
Abstract
Diabetic patients have an increased prevalence of blood pressure (BP) circadian rhythm disruption, which is associated with an increased risk of target organ damage and detrimental cardiovascular events. Limited information is available regarding the role of clock genes in the disruption of BP circadian rhythm in diabetes due to the lack of a diabetic animal model that allows real-time monitoring of clock gene oscillation. Here, we generated a novel diabetic db/db-mPer2Luc mouse model by crossing type 2 diabetic db/db mice with mPer2Luc knock-in mice. The daily rhythms of BP, heart rate, locomotor activity, and food and water intake were acquired by radiotelemetry or using metabolic chambers. The daily oscillation of mPer2 bioluminescence was recorded by LumiCycle in real-time in tissue explants and using the IVIS system in vivo. Our results show that db/db-mPer2Luc mice are obese, diabetic, and glucose intolerant. The db/db-mPer2Luc mice displayed a compromised BP daily rhythm, which was associated with disrupted daily rhythms in baroreflex sensitivity, locomotor activity, and metabolism, but not heart rate or food and water intake. The phase of the mPer2 daily oscillation was advanced to different extents in the explanted peripheral tissues from db/db-mPer2Luc mice relative to control mice. In contrast, no phase shift was detected in mPer2 daily oscillations in the explanted SCN. Moreover, advanced phase shift of the mPer2 daily oscillation was detected in the liver, kidney and submandibular gland in vivo of db/db-mPer2Luc mice. In conclusion, the diabetic db/db-mPer2Luc mouse is a novel animal model that allows real-time monitoring of mPer2 circadian rhythms ex vivo and in vivo. The results from db/db-mPer2Luc mice suggest that the desynchrony of mPer2 daily oscillation in peripheral tissues contributes to the loss of BP daily oscillation in diabetes.
Keywords
Diabetes is one of the most common metabolic disorders, and its prevalence is rising to epidemic levels worldwide (NCD Risk Factor Collaboration, 2016). Cardiovascular diseases are the major common causes of mortality and morbidity in diabetic patients (Rask-Madsen and King, 2013). Accumulated evidence from human and rodent studies suggests that disruptions in normal circadian rhythms are associated with an increased incidence of obesity and type 2 diabetes (Bass and Takahashi, 2010). Night or rotating shift workers have a higher prevalence of type 2 diabetes (Gan et al., 2015). Chronic jet-lag or light at night in mice disrupts food intake patterns and is associated with higher body weight (Fonken et al., 2010; Oike et al., 2015) and leptin resistance (Kettner et al., 2015). Food intake at the “wrong” time (i.e., during the rest period) and increased snacking is critical for the development of obesity and diabetic metabolic disorder, independent of total caloric intake and macronutrient quality (Hatori et al., 2012). In humans, genetic variations in BMAL1, a core clock gene, are associated with an increased incidence of type 2 diabetes and hypertension (Corella et al., 2016; Uemura et al., 2016; Woon et al., 2007). In mice, either global (Kondratov et al., 2006; Rudic et al., 2004) or tissue-specific Bmal1 deletion in liver (Jacobi et al., 2015; Lamia et al., 2008) or pancreas (Marcheva et al., 2010) causes impaired glucose homeostasis and/or insulin resistance. Taken together, a large body of evidence indicates a critical role of circadian rhythm disruption in the pathogenesis of obesity, diabetes, and metabolic disorders. In contrast, much less research has been conducted on the impact of diabetes on circadian rhythm, particularly in relation to diabetic cardiovascular complications.
Blood pressure (BP) in humans undergoes a daily oscillation that is lowest at night (i.e., a “nocturnal dip”) and peaks before awakening (“morning surge”) (Millar-Craig et al., 1978). The importance of BP circadian rhythm is highlighted by a meta-analysis that demonstrated that the early morning BP surge is associated with a 40% higher risk of acute myocardial infarction, a 29% higher risk of sudden cardiac death, and a 49% higher risk of stroke (Cohen et al., 1997). The results of a cross-sectional analysis of a 20,000-patient database revealed that up to 70% of diabetic patients are “non-dippers” (Gorostidi et al., 2007), in which the decrease in BP during the nocturnal sleep period is less than 10% of the daytime values. The non-dipping BP rhythm is the most common form of BP circadian rhythm disruption in diabetic patients and is associated with increased risks of target organ damage and detrimental cardiovascular outcomes (Ayala et al., 2013; Eguchi, 2011; Routledge et al., 2007; Yano and Kario, 2012). Importantly, the non-dipping BP is emerging as an independent predictor of future cardiovascular events (Cuspidi et al., 2010; Friedman and Logan, 2009). Nocturnal laboratory animals, such as mice, have a BP daily oscillation that is opposite to that in humans; i.e., BP is low during the day (rest phase) and peaks at night (active phase). In agreement with these studies, we and others recently reported that db/db mice, a widely used diabetic mouse model (Herberg and Coleman, 1977), are not only hypertensive but are also non-dippers (Goncalves et al., 2009; Park et al., 2008; Senador et al., 2009; Su et al., 2008). Moreover, we and others have demonstrated that either global or selective deletion of Bmal1 in smooth muscle or adipocytes abolishes or attenuates BP circadian rhythm (Chang et al., 2018; Curtis et al., 2007; Xie et al., 2015; Yang et al., 2016). Furthermore, the daily oscillations of the mRNA encoding many core clock genes and clock target genes are altered in isolated tissues from db/db mice (Caton et al., 2011; Grosbellet et al., 2016; Kudo et al., 2004; Nernpermpisooth et al., 2015; Su et al., 2008; Su et al., 2012). However, most of these studies investigated the core clock genes and clock target gene oscillations by real-time PCR or Western blotting in tissues collected every 4 to 6 h in over one day. Consequently, the time resolution of circadian rhythm analysis is limited by the limited sampling intervals and duration. One of the major reasons accounting for these limitations is that increasing the time resolution of clock gene oscillation requires a significant increase in time points of tissue collection, which is cost prohibitive.
To overcome this barrier and to stimulate the research on BP circadian rhythms in diabetes, we crossed db/db mice with mPer2Luc knock-in mice and generated a novel db/db-mPer2Luc mouse model. The db/db mouse is an extensively used monogenic type 2 diabetic mouse model. The syndrome in db/db mice is similar to that in maturity-onset diabetes in humans, characterized by obesity, infertility, hyperphagia and marked hyperglycemia (Ktorza et al., 1997). Diabetes in db/db mice is caused by a spontaneous point mutation in the leptin receptor gene (lepr), resulting in abnormal splicing of the gene transcript and defective leptin signaling (Chen et al., 1996; Lee et al., 1996). db/db-mPer2Luc mice are expected to be diabetic. Furthermore, because of the in-frame 3’-end fusion of the luciferase reporter gene to the endogenous mPer2 gene, we can quantitatively measure mPer2 protein oscillation using mPer2Luc bioluminescence monitoring in real-time ex vivo and in vivo (Tahara et al., 2012; Yoo et al., 2004). We report here for the first time that db/db-mPer2Luc mice are obese and diabetic and that they are non-dippers, even though they are normotensive. The compromised daily rhythm in BP in db/db-mPer2Luc mice is associated with disrupted daily rhythms in baroreflex sensitivity, locomotor activity, and metabolism. Moreover, by monitoring mPer2Luc bioluminescence in various peripheral and SCN tissues ex vivo and in vivo, we demonstrate desynchrony of mPer2Luc bioluminescence daily oscillations in peripheral tissues but not in the SCN of db/db-mPer2Luc mice.
Materials and Methods
Generation of db/db-mPer2Luc Mice
The heterozygous leptin receptor (Leprdb) mutation db/+ mice on the C57BL/KsJ background (Stock No: 000642; also known as C57BL/KsJ-db/+) and the homozygous mPer2Luc mice on the C57BL/6J background (Stock No: 006852; also known as C57BL/6J-mPer2Luc) were purchased from the Jackson Laboratory. Since homozygous C57BL/KsJ-db/db mice are infertile, the heterozygous male C57BL/KsJ-db/+ mice and homozygous female C57BL/6J-mPer2Luc mice were used as breeders to generate homozygous diabetic db/db-mPer2Luc mice and heterozygous non-diabetic db/+-mPer2Luc control mice (Suppl. Figure S1A). Of note, both db/db-mPer2Luc and db/+-mPer2Luc control mice have a mixed C57BL/KsJ and C57BL/6J background. The genotyping protocol for db/db mice is listed on the Jackson Laboratory website. The genotyping protocol for the mPer2Luc mice was described previously (Yoo et al., 2004). Representative agarose gels for PCR genotyping of the mPer2Luc and db/db mice are shown in Suppl. Figure S1B and S1C. Mice were fed a normal chow diet and housed under 12-12 LD conditions. Only 4- to 6-month-old male db/db-mPer2Luc and age- and gender-matched db/+-mPer2Luc control mice were used in the current study. All animal procedures were approved by the Institutional Animal Care and Use Committee.
Animal Characterization
Body composition (lean mass and fat mass) was assessed by NMR spectroscopy (Echo MRITM-100H, Houston, TX). Non-fasting blood glucose levels were measured between zeitgeber time ZT9 and ZT10 using a StatStrip XepressTM glucometer (NOVA Biomedical; Waltham, MA). (ZT0 is defined as lights on and ZT12 is defined as lights off.) Non-fasted plasma insulin level was determined between ZT10 and ZT11 by ELISA, according to the manufacturer’s instructions (Chrystal Chem; Downers Grove, IL). Intraperitoneal glucose tolerance test (IPGTT) was performed by injecting 1 mg/kg glucose at ZT3 after 6-h fasting.
Radiotelemetry Measurement of BP, Heart Rate, and Locomotor Activity
The db/db-mPer2Luc and control mice were chronically instrumented in the left common carotid artery with a radiotelemetry probe (TA11PA-C10, Data Sciences International; St. Paul, MN), as described previously (Su et al., 2008; Su et al., 2013; Xie et al., 2015). BP, heart rate, and locomotor activity were recorded for 3 consecutive days 10 days after recovery from surgery.
Baroreflex Sensitivity Analysis
Spontaneous baroreflex sensitivity was analyzed by sequence techniques using Hemolab software (http://www.haraldstauss.com/HemoLab/HemoLab.html). At least 4 consecutive sequences where the systolic arterial pressure and pulse interval were positively correlated (r2 > 0.80) were counted. Baroreflex sensitivity was calculated as the average slope of the systolic pressure-pulse interval relationships, as described previously (Xie et al., 2015).
Metabolic Chamber Measurement of Locomotor Activity, Food and Water Intake, Respiratory Exchange Ratio (RER) and Energy Expenditure (EE)
The locomotor activity, food and water intake, RER, and EE were determined by indirect gas calorimetry LabMaster system (TSE System; Bad Homburg, Germany; also known as metabolic chambers). Mice were exposed to a 12-12 LD cycle and were individually housed in the acclimation cages for 7 days and then transferred to metabolic chambers. Oxygen consumption and carbon dioxide production in the metabolic chambers were measured every 30 min for 3 consecutive days. RER and EE were calculated using the accompanying TSE PhenoMaster software.
Real-time Monitoring of mPer2 Oscillations in Explant Tissues by LumiCycle
The procedure for the real-time monitoring of mPer2 oscillations in explant tissues by LumiCycle was adapted from a previous report (Yamazaki and Takahashi, 2005). Briefly, the aorta, mesenteric artery (MA), kidney, liver, white adipose tissue (WAT), thymus, lung, adrenal gland (AG), and brain were isolated from mice between ZT10 and ZT11. The aorta was cleaned, cut open longitudinally, and denuded of endothelial cells. The MA was dissected to remove fat tissues. The kidney, liver, WAT, thymus, and lung were cut into small pieces, with a diameter varying between approximately 2 and 6 mm depending on the tissue. The whole AG was used. The brain containing the SCN was cut into 250-µm-thick sections using an NVSL manual advance vibroslice (World Precision Instruments; Sarasota, FL). Each tissue was cultured in a well-sealed 35-mm Petri dish containing Dulbecco’s Modified Eagle’s Medium (DMEM) and 0.1 mM
In Vivo Imaging of mPer2 Time-of-Day Variation in the Kidney, Liver, and Submandibular Gland (SG)
The procedure for in vivo imaging of mPer2 time-of-day variation in the kidney, liver, and SG was adapted from a previous report (Tahara et al., 2012). Briefly, at ZT5, 11, 17 and 23, mice were anesthetized with 2.5% to 4% isoflurane and subcutaneously injected with
Cosinor Analysis of Circadian Rhythm
The daily rhythms of BP, heart rate, locomotor activity, food and water intake, RER, and EE were analyzed using cosinor analysis, as previously reported (Refinetti et al., 2007). Briefly, a cosine wave with a known period (24 h) was fitted to the data by the least squares method as an estimate of the pattern of the smooth rhythm. The model equation was written as xi=M+Acos (θi+φ), where M is mesor, A is amplitude, φ is acrophase, and θi is trigonometric angles corresponding to the sampling time.
Quantitative Analysis of mRNA Expression
Mesenteric arteries were isolated from db/db-mPer2Luc and control mice at ZT5 and ZT17. RNA extraction, cDNA synthesis, and real-time PCR were carried out as described previously (Guo et al., 2005; Xie et al., 2015). The real-time PCR primers for each gene are described in Suppl. Table S1.
Statistical Analysis
All data are expressed as mean ± SEM. For comparison of one parameter between the 2 strains of mice, unpaired 2-tailed Student’s t-test was used. For comparison of one parameter across a time period between 2 strains of mice, 2-way ANOVA with repeated measures and Bonferroni’s post-hoc test were performed. For comparison of multiple parameters between the 2 strains of mice, regular 2-way ANOVA with Bonferroni’s post-hoc test was performed. P < 0.05 was defined as statistically significant.
Results
db/db-mPer2Luc Mice Are Obese and Diabetic
The db/db mouse is an extensively used monogenic type 2 diabetic mouse model. The syndrome in db/db mice is similar to that in maturity-onset diabetes in humans, characterized by obesity, infertility, hyperphagia and marked hyperglycemia (Ktorza et al., 1997). The diabetic phenotype of db/db mice, however, varies depending on the genetic background. Currently, there are 2 db/db mouse models: one is on the C57BL/KsJ background, with severe hyperglycemia and temporarily elevated plasma insulin; the other is on the C57BL/6J background, with transient hyperglycemia and marked hyperinsulinemia (Hummel et al., 1972). To study the disruption of circadian rhythms in type 2 diabetes, we crossed C57BL/KsJ-db/db mice, which have severe diabetes, with mPer2Luc mice, which contain a knock-in luciferase gene fused to mouse Period2 (mPer2) as a clock gene reporter (Yoo et al., 2004) to generate a novel db/db-mPer2Luc mouse. Since the mPer2Luc mice are on the C57BL/6J background, the generated db/db-mPer2Luc mice have a mixed background (C57BL/KsJ and C57BL/6J). It is unclear to what extent db/db-mPer2Luc mice retained a diabetic phenotype in this mixed background. Therefore, we first characterized this novel mouse model with respect to obesity, hyperglycemia, hyperinsulinemia, and glucose tolerance.
The db/db-mPer2Luc mice had significantly increased body weight when compared with their littermate db/+-mPer2Luc control mice (Figure 1a). The body weight increase was mostly attributable to an increased fat mass, as the lean mass was comparable between db/db-mPer2Luc and control mice (Figure 1b). Non-fasting blood glucose and plasma insulin levels in db/db-mPer2Luc mice were also markedly elevated relative to those in the control mice (Figure 1c and 1d). Moreover, db/db-mPer2Luc mice exhibited a severely impaired glucose tolerance (Figure 1e). These results indicate that db/db-mPer2Luc mice manifest the common characteristics of type 2 diabetes; i.e., obesity, hyperglycemia, hyperinsulinemia, and impaired glucose tolerance.
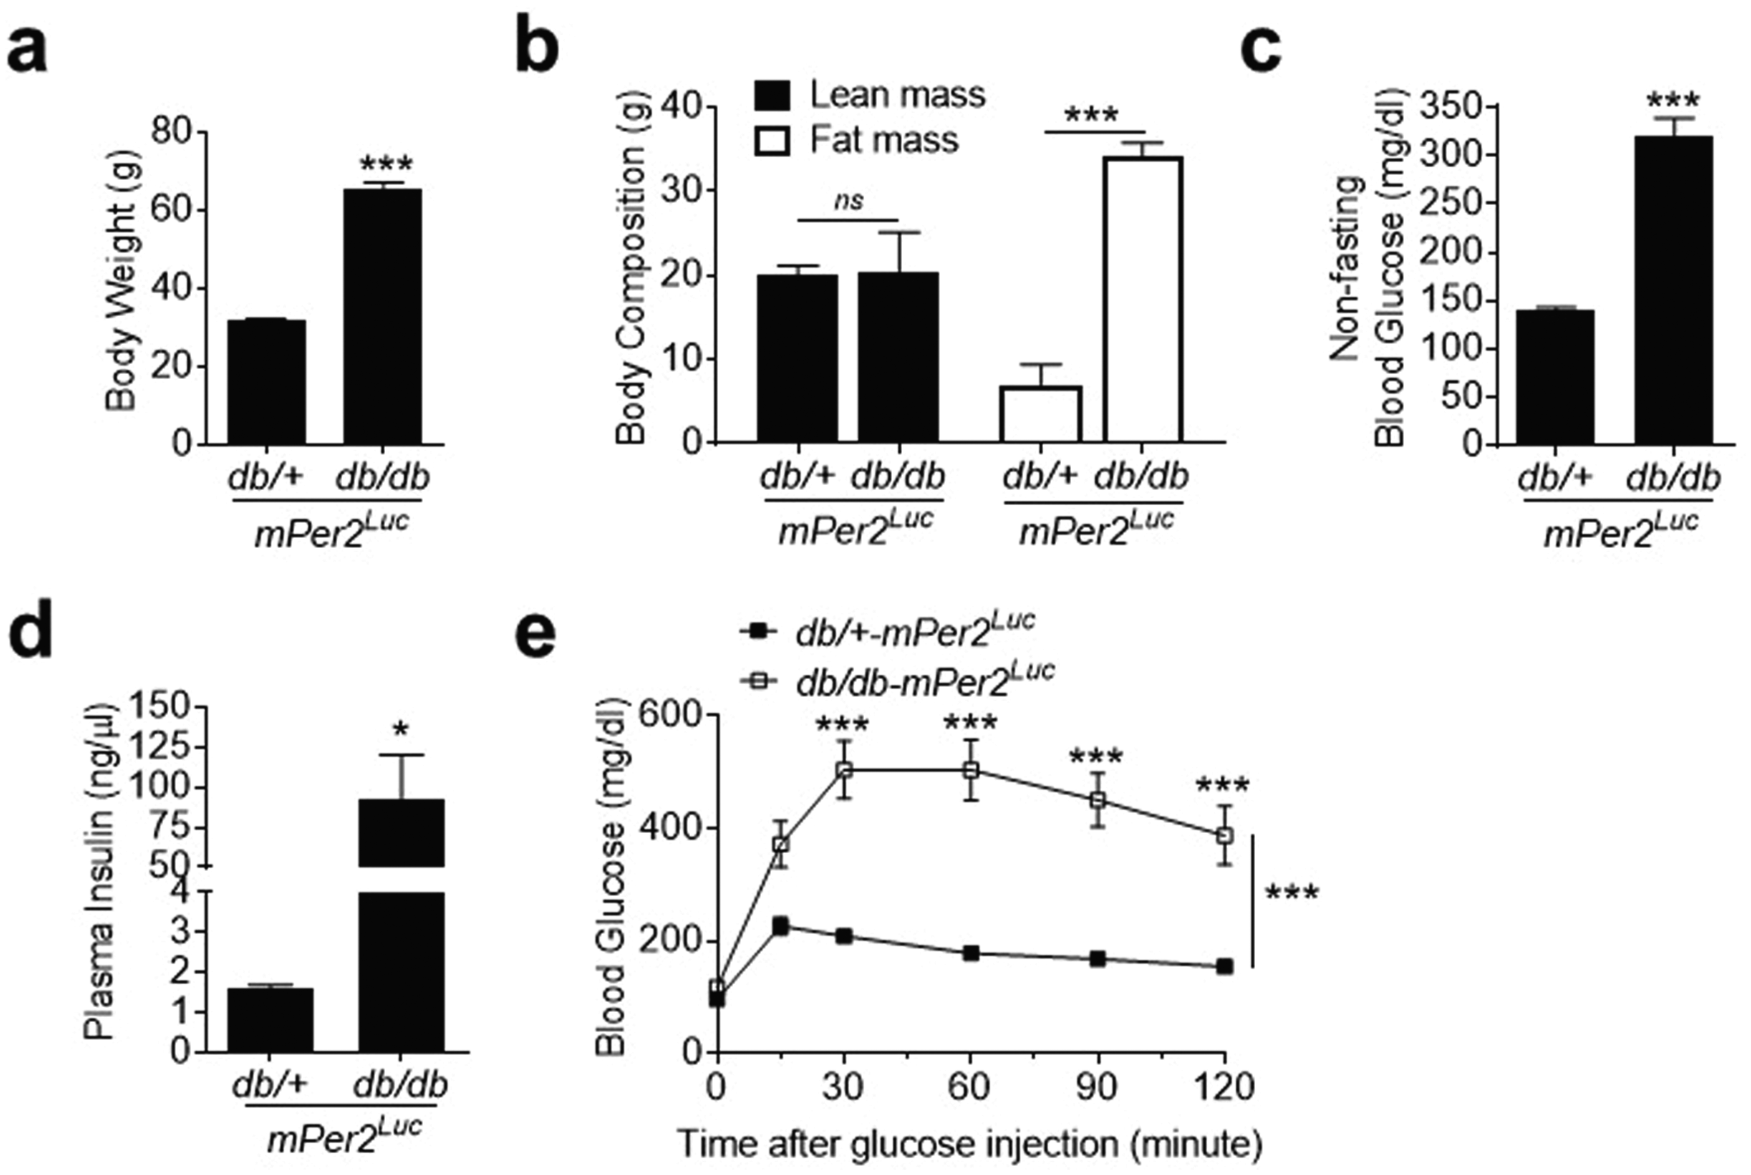
The db/db-mPer2Luc mice are obese and diabetic. Body weight (a; n = 12), body composition (b; n = 4 to 6), non-fasting blood glucose (c; n = 12), and plasma insulin (d; n = 4 to 5) were measured between ZT9 and ZT11 in db/db-mPer2Luc and control db/+-mPer2Luc mice. Glucose tolerance test (
db/db-mPer2Luc Mice Have a Compromised BP Daily Rhythm That Is Associated with the Disruption of Daily Rhythms in Baroreflex Sensitivity but Not Heart Rate
To determine whether BP daily rhythm is disrupted in db/db-mPer2Luc mice, we recorded BP by radiotelemetry under normal 12-12 LD cycles for a consecutive 72 h. We found that daily oscillations of mean arterial pressure (MAP), systolic blood pressure (SBP), and diastolic blood pressure (DBP) were diminished in db/db-mPer2Luc mice compared with control mice (Figure 2a; Suppl. Figure S2a and S2d). The compromised daily rhythms of MAP, SBP, and DBP were primarily caused by decreased dipping during the inactive light phase with no change during the active dark phase in db/db-mPer2Luc mice relative to control mice (Figure 2a; Suppl. Figure S2a and S2d). Quantitative analysis of the daily (24-h) average of MAP, SBP, and DBP showed no difference between db/db-mPer2Luc and control mice (Figure 2b; Suppl. Figure S2b and S2e), indicating that db/db-mPer2Luc mice are normotensive, unlike C57BL/KsJ-db/db mice (Goncalves et al., 2009; Park et al., 2008; Senador et al., 2009; Su et al., 2008). Further quantitative analysis of BP during either the light or dark phase (12-h) revealed a 50% reduction in the difference between the light phase and the dark phase in MAP, SBP, and DBP in db/db-mPer2Luc mice compared with the control (Figure 2c; Suppl. Figure S2c and S2f). Cosinor analysis of the oscillations showed that the amplitude (half of the range of oscillation) and robustness of daily rhythms in MAP, SBP, and DBP were significantly attenuated in db/db-mPer2Luc mice compared with control mice (Figure 2d and 2e; Suppl. Table S2). Interestingly, no differences were found in the acrophase (the time when the cycle peaks) between db/db-mPer2Luc and control mice (Figure 2f; Suppl. Table S2).
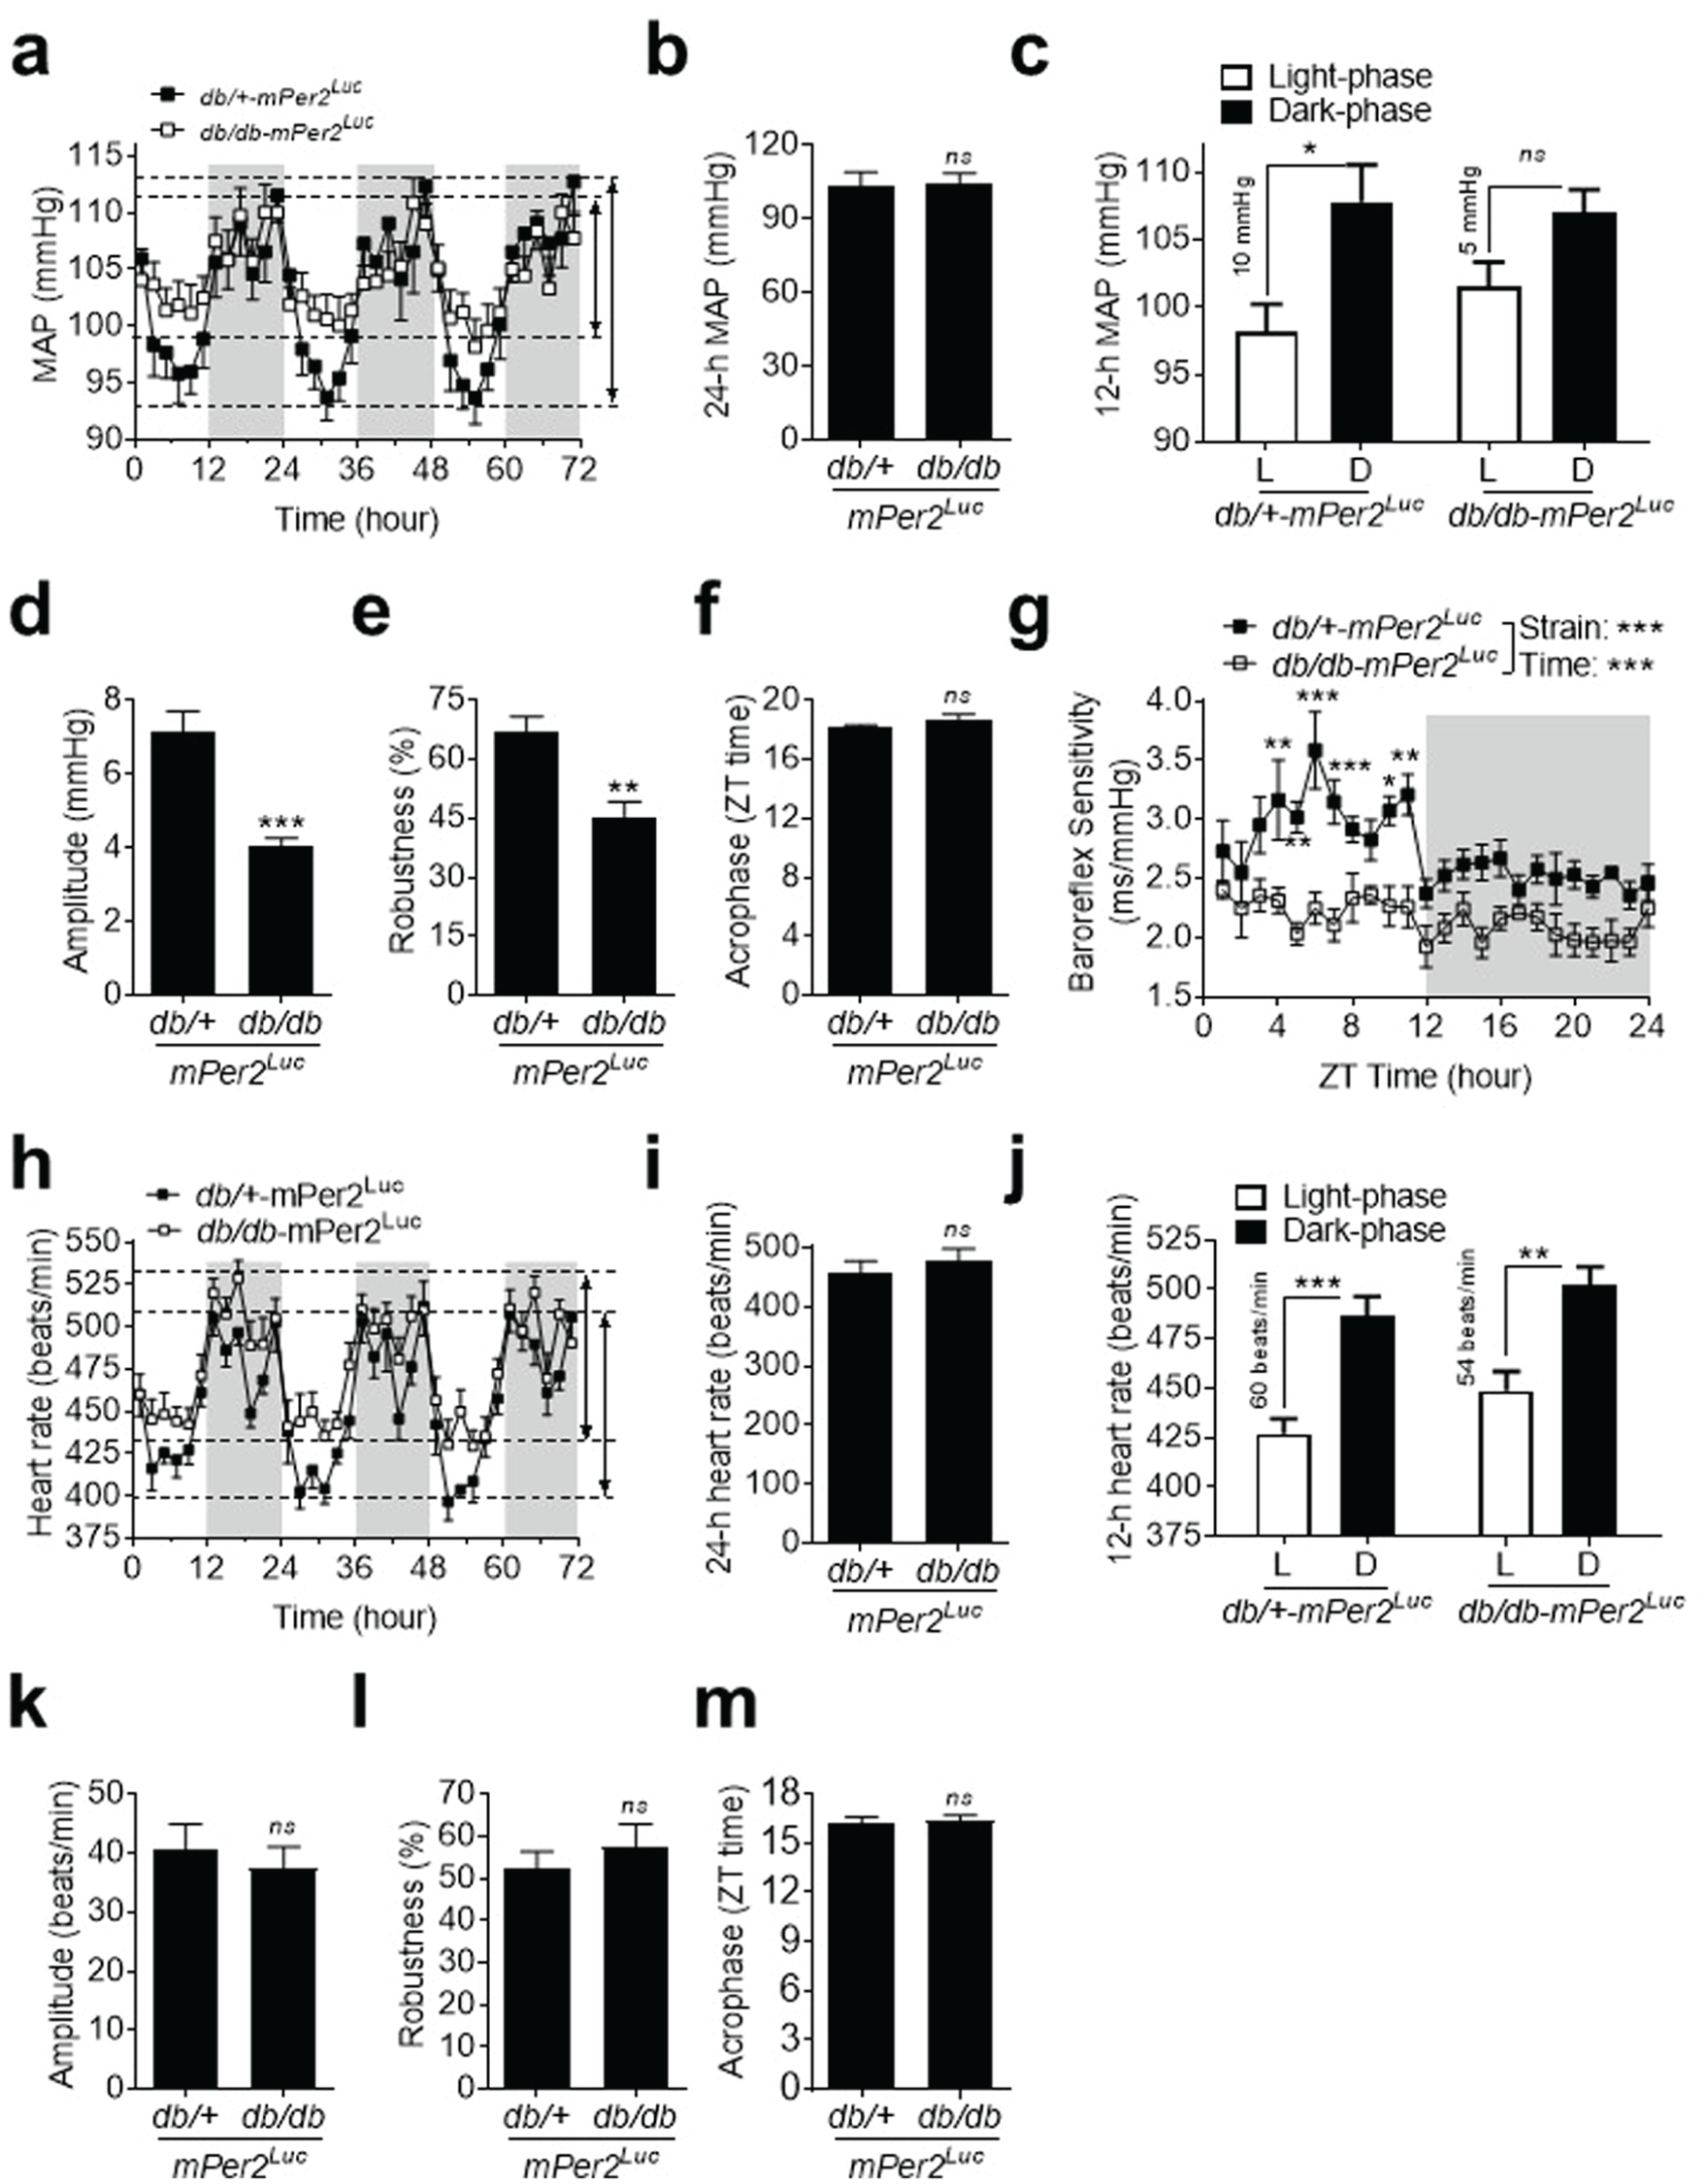
Daily rhythms of blood pressure (BP) and baroreflex sensitivity but not heart rate are disrupted in db/db-mPer2Luc mice. BP and heart rate were recorded by radiotelemetry in db/db-mPer2Luc and control db/+-mPer2Luc mice. (a) The 72-h recording of mean arterial pressure (MAP). The light grey box indicates the dark-phase and the length of the arrowhead lines indicates the difference in BP between the light and dark phases in the 2 mouse strains. (b) The 24-h MAP. (c) The 12-h MAP during the light phase (L) and dark phase (D). (d-f) The amplitude, robustness, and acrophase of MAP daily oscillation. (g) Spontaneous baroreflex sensitivity over the 24-h day. (h) The 72-h recording of heart rate. (i) The 24-h heart rate. (j) The 12-h heart rate during the light phase (L) and dark phase (D). (k-m) The amplitude, robustness, and acrophase of heart rate daily oscillation. All data are expressed as mean ± SEM (n = 6). *P < 0.05, **P < 0.01, ***P < 0.001, ns, not significant.
Baroreflex is an important rapid negative feedback mechanism for maintaining normal BP. Therefore, we investigated whether compromised BP daily rhythm in db/db-mPer2Luc mice was associated with an alteration in the time-of-day variations in baroreflex sensitivity. We analyzed spontaneous baroreflex sensitivity by sequence techniques in db/db-mPer2Luc and control mice, as previously described (Xie et al., 2015). In db/+-mPer2Luc control mice, baroreflex sensitivity was significantly higher during the light phase than during the dark phase (Figure 2g). In contrast, such time-of-day variations in baroreflex sensitivity were abolished in db/db-mPer2Luc mice. This result suggests that the loss of daily variation in baroreflex sensitivity contributes to compromised BP daily rhythm.
Because heart rate is an important factor that determines cardiac output and BP level (Reule and Drawz, 2012), we investigated whether the daily heart rate oscillation is also altered in db/db-mPer2Luc mice. We found that daily heart rate, the difference between light phase and dark phase heart rate, and its rhythmicity, including amplitude, robustness, and acrophase, were not significantly altered in db/db-mPer2Luc mice compared with control mice (Figure 2, h-m).
Compromised BP Daily Rhythm Is Associated with the Disruption of Daily Rhythms in Locomotor Activity and Metabolism but not in Food and Water Intake in db/db-mPer2Luc Mice
Behavioral factors, such as locomotor activity, food and water intake, and metabolism, may affect central and peripheral clock function through the release of neurotransmitters and hormones, and thus impinge on BP circadian rhythm (Rudic and Fulton, 2009). Therefore, daily rhythms in locomotor activity, food and water intake, and metabolism were monitored by indirect calorimetry (using a metabolic chamber) in db/db-mPer2Luc and control mice every 30 min over a consecutive 72 h under 12-12 LD conditions. We also used radiotelemetry to monitor locomotor activity independently to confirm the indirect calorimetry data. The results from both indirect calorimetry and radiotelemetry data consistently showed that the daily oscillation in locomotor activity was abolished in db/db-mPer2Luc mice compared with control mice (Figure 3a and 3b; Suppl. Figure S3a and S3b). While the absolute counts regarding daily locomotor activity from indirect calorimetry (Figure 3c) and radiotelemetry (Suppl. Figure S3c) were not consistent, both methods showed a loss of locomotor activity daily oscillation in db/db-mPer2Luc mice (Figure 3d; Suppl. Figure S3d). Cosinor analysis revealed that the amplitude and robustness of locomotor activity daily oscillations were largely diminished in db/db-mPer2Luc mice (Figure 3e and 3f; Suppl. Figure S3e and S3f). Interestingly, in agreement with the compromised BP daily rhythm in db/db-mPer2Luc mice (Figure 2f), there were also no differences in the acrophase of locomotor activity daily oscillation between db/db-mPer2Luc and control mice (Figure 3g; Suppl. Figure S3g).
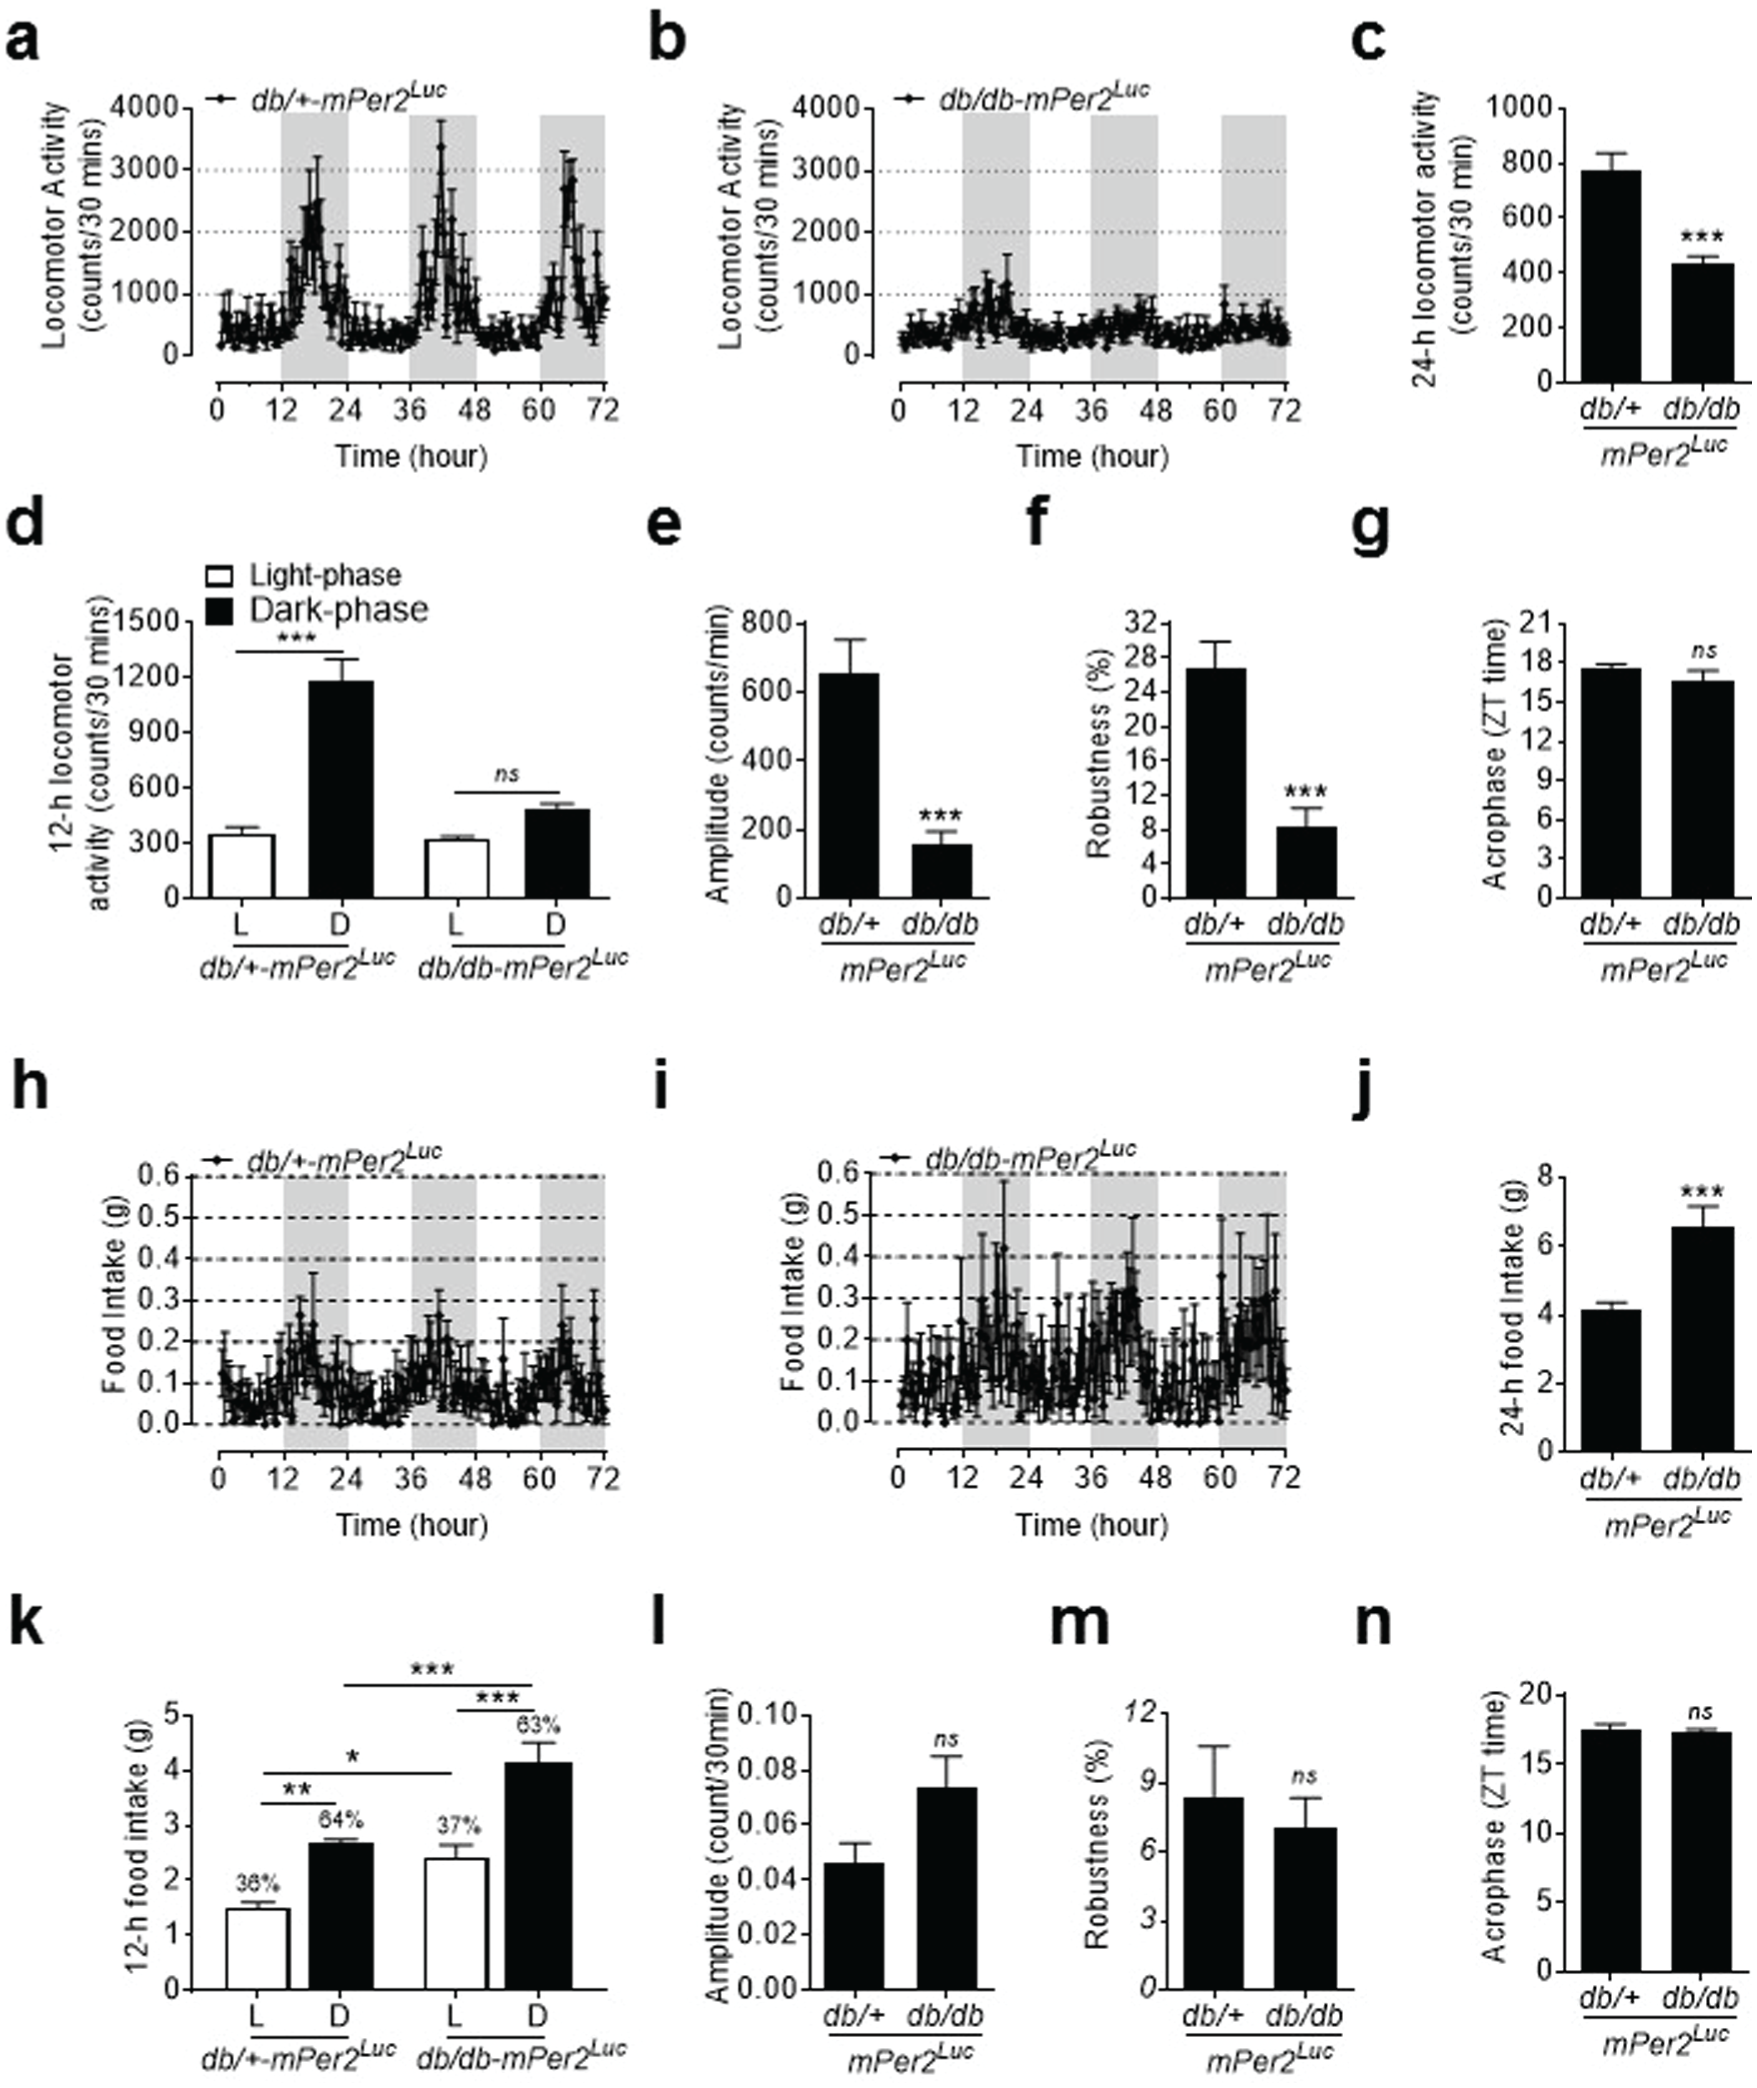
The daily rhythm of locomotor activity but not food intake is disrupted in db/db-mPer2Luc mice. Locomotor activity and food intake were recorded by indirect calorimetry. (a) 72-h recording of locomotor activity in control mice, where the light grey box indicates the dark-phase. (b) 72-h recording of locomotor activity in db/db-mPer2Luc mice, where the light grey box indicates the dark-phase. (c) The 24-h locomotor activity. (d) The 12-h locomotor activity during the light phase (L) and dark phase (D). (e-g) The amplitude, robustness, and acrophase of locomotor activity daily oscillation. (h) The 72-h recording of food intake in control mice, where the light grey box indicates the dark-phase. (i) The 72-h recording of food intake in db/db-mPer2Luc mice, where the light grey box indicates the dark-phase. (j) The 24-h food intake. (k) The 12-h food intake during the light phase (L) and dark phase (D). (l-n) The amplitude, robustness, and acrophase of food intake daily rhythm. All data are expressed as mean ± SEM (n = 6). *P < 0.05, **P < 0.01, ***P < 0.001, ns, not significant.
In contrast to the locomotor activity, the food and water intake daily oscillations appeared to be preserved in db/db-mPer2Luc mice (Figure 3h and 3i; Suppl. Figure S4a and S4b); although, db/db-mPer2Luc mice consumed more food and water than did control mice (Figure 3j; Suppl. Figure S4c). Since db/db-mPer2Luc mice consumed more food and water proportionally during both the light and dark phases than control mice (Figure 3k; Suppl. Figure S4d), the percentages of daily food and water intake during the light and dark phase were similar between the 2 strains of mice (Figure 3k; Suppl. Figure S4d). In accordance with these findings, there were also no differences in robustness and acrophase in food and water intake daily oscillations (Figure 3m and 3n; Suppl. Figure S4f and S4g). Interestingly, there was a trend towards an increased daily oscillation amplitude in food intake (Figure 3l) and a significant increase in water intake (Suppl. Figure S4e) in db/db-mPer2Luc mice.
RER and EE daily oscillations were acquired using the metabolic chamber. RER is calculated as the ratio between the volume of carbon dioxide (VCO2) produced and the volume of oxygen (VO2) used in metabolism. It is an indicator of fuel sources (Even and Nadkarni, 2012). EE is calculated as the total daily energy (calories) that is expended in the metabolic chamber, including basal and physical activity expenditure, thermoregulation, and the thermic effects of food (Even and Nadkarni, 2012). The RER daily oscillation was disrupted in db/db-mPer2Luc mice compared with control mice (Figure 4a and 4b). Although both strains of mice had a similar average RER (Figure 4c), the db/db-mPer2Luc mice lost the RER daily oscillation compared with control mice (Figure 4d). In agreement with these findings, the amplitude and robustness of RER daily oscillation were suppressed (Figure 4e and 4f), and the acrophase was delayed in db/db-mPer2Luc mice (Figure 4g). In contrast, EE daily oscillation was preserved in both strains of mice (Figure 4h and 4i); although, the daily EE level was higher in db/db-mPer2Luc than in control mice (Figure 4j). Both strains of mice exhibited a similar EE daily oscillation pattern (Figure 4k). In agreement with these findings, there was no difference in amplitude and acrophase between db/db-mPer2Luc and control mice (Figure 4l and 4n); however, robustness was suppressed in db/db-mPer2Luc mice (Figure 4m).
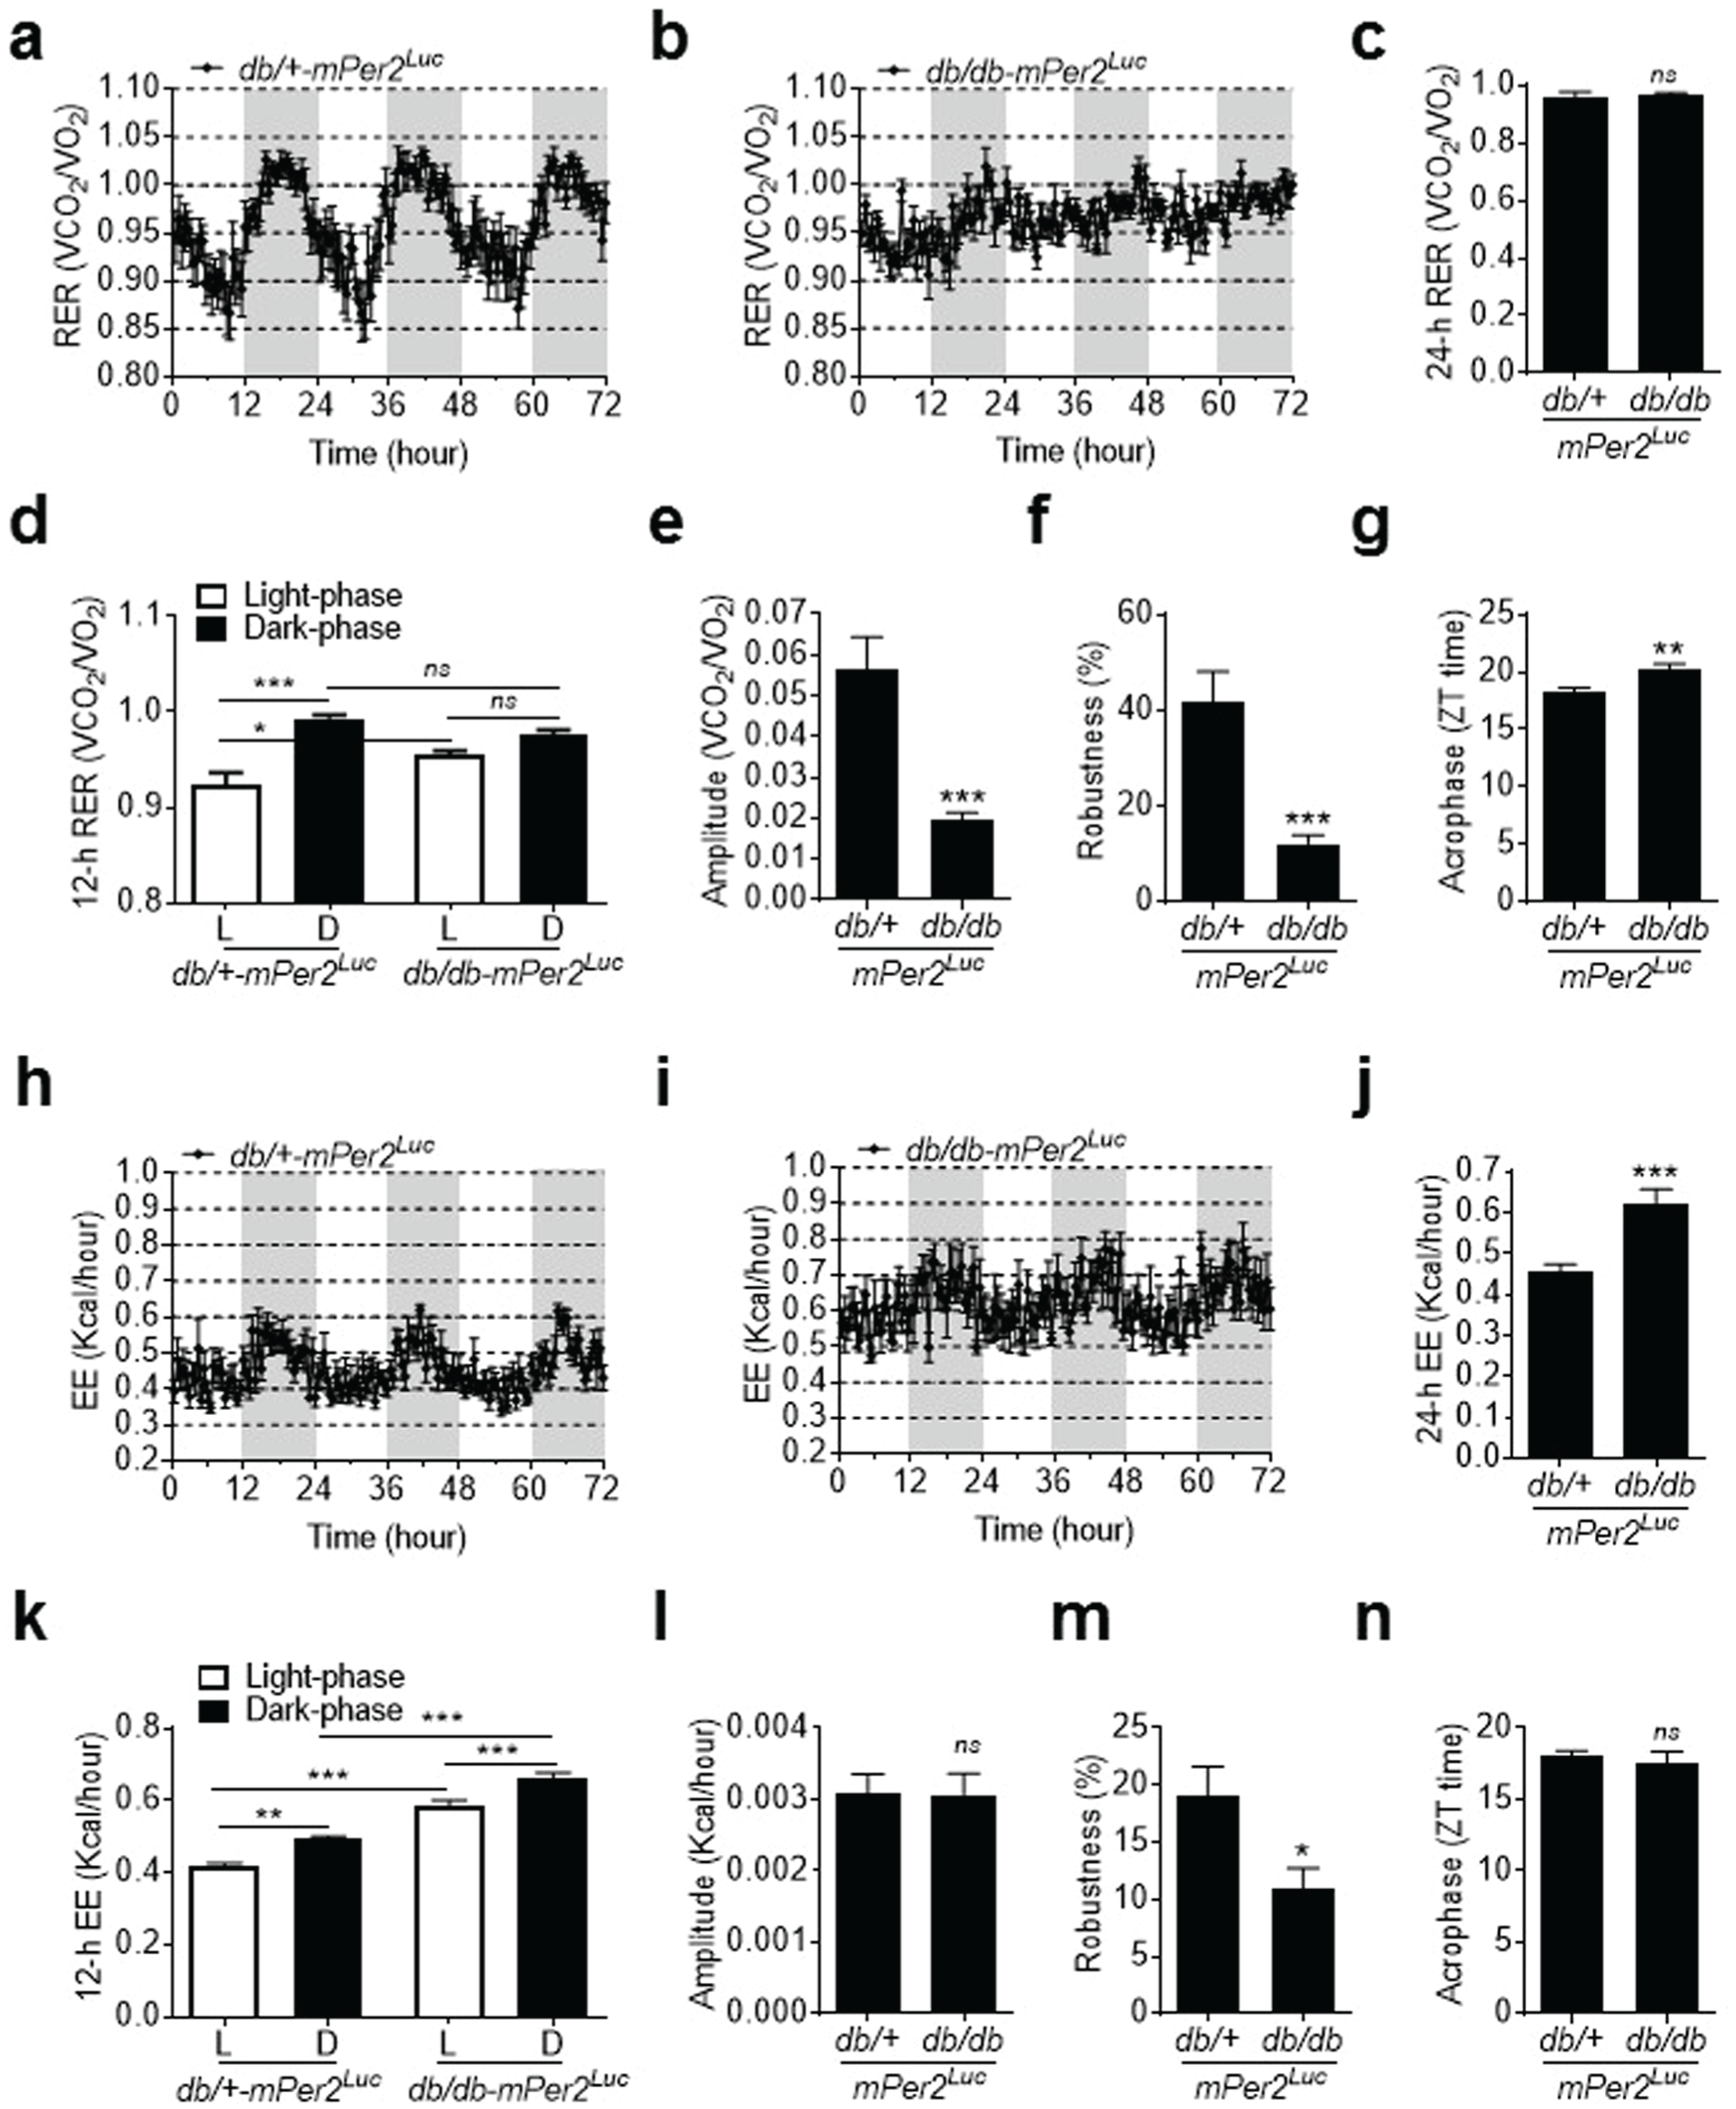
The daily rhythm of respiratory exchange ratio (RER) but not energy expenditure (EE) is disrupted in db/db-mPer2Luc mice. RER and EE were recorded by indirect calorimetry. (a) The 72-h recording of RER in control db/+-mPer2Luc mice. The light grey box indicates the dark-phase. (b) The 72-h recording of RER in db/db-mPer2Luc mice. The light grey box indicates the dark-phase. (c) The 24-h RER. (d) The 12-h RER during the light phase (L) and dark phase (D). (e-g) The amplitude, robustness, and acrophase of RER daily rhythm. (h) The 72-h recording of EE in the control db/+-mPer2Luc mice. The light grey box indicates the dark-phase. (i) The 72-h recording of EE in the diabetic db/db-mPer2Luc mice. The light grey box indicates the dark-phase. (j) The 24-h EE. (k) The 12-h EE during the L and D phases. (l-n) The amplitude, robustness, and acrophase of EE daily rhythm. All data were expressed as mean ± SEM (n = 6). *P < 0.05, **P < 0.01, ***P < 0.001, ns, not significant.
Ex Vivo LumiCycle Recording Reveals that the Phases of mPer2 Daily Oscillation Are Shifted to Different Extents in Various Peripheral Tissues but not in the SCN of db/db-mPer2Luc Mice
Multiple systems coordinate to maintain normal physiological BP circadian rhythm (Coffman, 2011). To investigate in which tissue the clock genes are altered in the db/db-mPer2Luc mice that may contribute to the compromised BP circadian rhythm, we monitored mPer2 bioluminescence in real-time in peripheral and central SCN tissues from db/db-mPer2Luc and control mice in explant organ culture. In the various tissues from control mice, the acrophases of mPer2 oscillation varied but were orchestrated in a specific order (Figure 5, a-j), with the earliest peak shown by the SCN (10.47 ± 0.82 h) and later peaks shown by the lung (12.08 ± 0.24 h), kidney (14.23 ± 0.11 h), liver (14.39 ± 0.77 h), adrenal gland (15.59 ± 0.20 h), WAT (15.59 ± 0.39 h), aorta (16.17 ± 0.24 h), thymus (19.61 ± 0.77 h), and mesenteric arteries (MA; 19.69 ± 0.29 h).
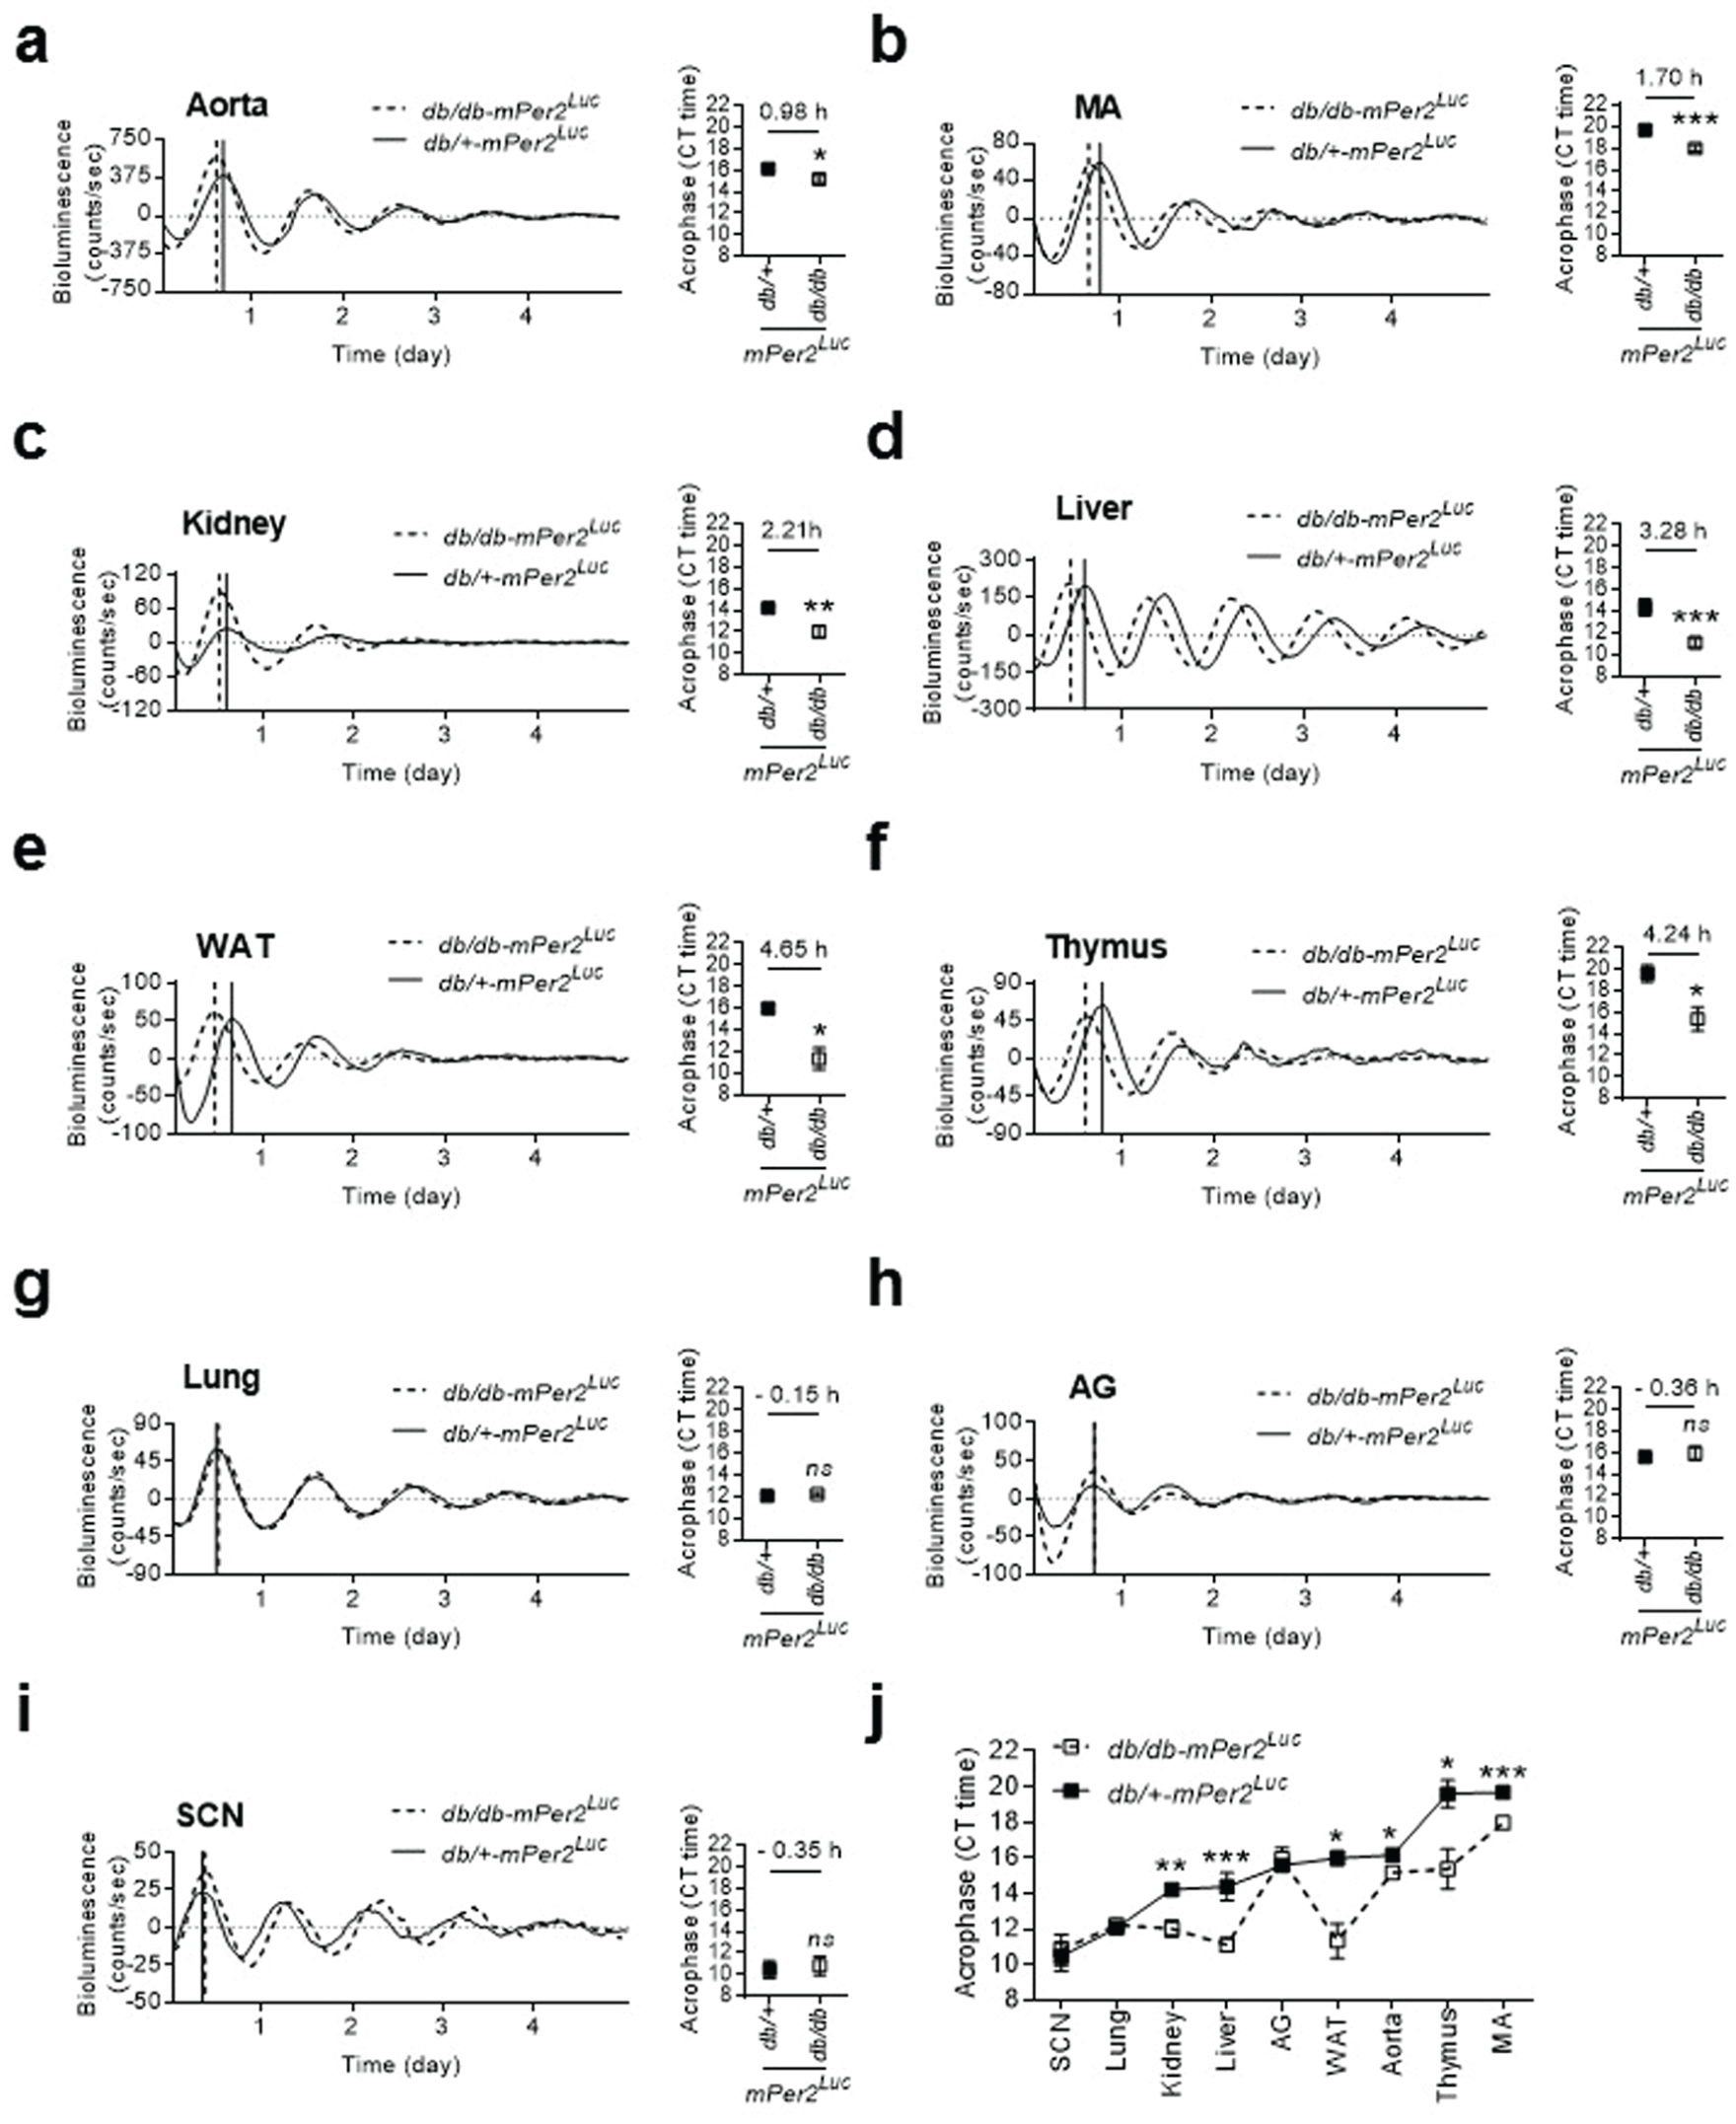
The phases of mPer2 protein daily oscillation were desynchronized in various explanted peripheral tissues from db/db-mPer2Luc mice. The bioluminescence of mPer2 protein daily oscillation was recorded by LumiCycle in explanted central SCN and peripheral tissues from db/db-mPer2Luc and control db/+-mPer2Luc mice. The mPer2 oscillation acrophase of the tissues was calculated using LumiCycle analysis software. In the representative mPer2 bioluminescence real-time recording (left panel), the solid vertical line indicates the acrophase of the non-diabetic db/+-mPer2Luc control mice, whereas the dotted vertical line indicates the acrophase of the diabetic db/db-mPer2Luc mice. In the acrophase (right panel), the number above the symbol indicates the differences between the 2 strains of mice. All data are expressed as mean ± SEM from the aorta (a; n = 7-11), mesenteric artery (MA; b; n = 8-12), kidney (c; n = 4-5), liver (d; n = 6-12), white adipose tissue (WAT; e; n = 3-4), thymus (f; n = 3-5), lung (g; n = 4-6), adrenal gland (h; n = 3-6), and SCN (n = 6-11). *P < 0.05, **P < 0.01, ***P < 0.001, ns, not significant.
In the tissues from db/db-mPer2Luc mice, the acrophases of mPer2 oscillations were significantly advanced to different extents relative to control in a tissue-specific manner (Figure 5j). The aorta, MA, and kidney, which are crucial for BP and cardiovascular homeostasis, had a phase advance of 0.98 ± 0.40, 1.70 ± 0.42, and 2.21 ± 0.56 h, respectively (Figure 5, a-c). Liver and WAT—2 tissues that are crucial for energy metabolism—had a 3.28 ± 0.77 h and 4.65 ± 1.21 h phase advance (Figure 5d and 5e). The thymus, a primary lymphoid organ, had a 4.24 ± 1.59 h phase advance (Figure 5f). In contrast, the lung and adrenal gland had no significant phase shift (Figure 5g and 5h). Interestingly, the SCN, long believed to be a major regulator of BP circadian rhythm, also showed no significant phase shift (Figure 5i). In contrast to the shift in the acrophase in tissues from db/db-mPer2Luc mice, no consistent change was detected in period or amplitude of mPer2 luciferase oscillations in most peripheral tissues from db/db-mPer2Luc mice (Suppl. Table S3).
In Vivo Imaging Verifies that the Phase of mPer2 Oscillation Is Also Advanced in the Kidney, Liver, and Submandibular Gland (SG) in db/db-mPer2Luc Mice
To investigate whether the phase advance of mPer2 oscillation observed in the explant tissue culture represents in vivo tissue oscillation, we used IVIS spectrum analysis and monitored the mPer2 oscillations of the kidney, liver, and SG in the intact db/db-mPer2Luc and control mice. In vivo mPer2 bioluminescence images were obtained at 6-h intervals at ZT5, ZT11, ZT17, and ZT23, respectively. In accordance with the result from the ex vivo LumiCycle recording (Figure 5c and 5d), the in vivo mPer2 bioluminescence of the kidney, liver, and SG exhibited apparent time-of-day variations. The lowest absolute bioluminescence intensity was detected at ZT5 and the highest at ZT17 in all 3 tissues (Figure 6a and 6b). These absolute bioluminescence intensities were significantly higher in db/db-mPer2Luc mice as compared with control mice at ZT11 and ZT17 in the kidney (Figure 6c), at ZT11, ZT17, and ZT23 in the liver (Figure 6f) and at ZT17 in the SG (Figure 6i).
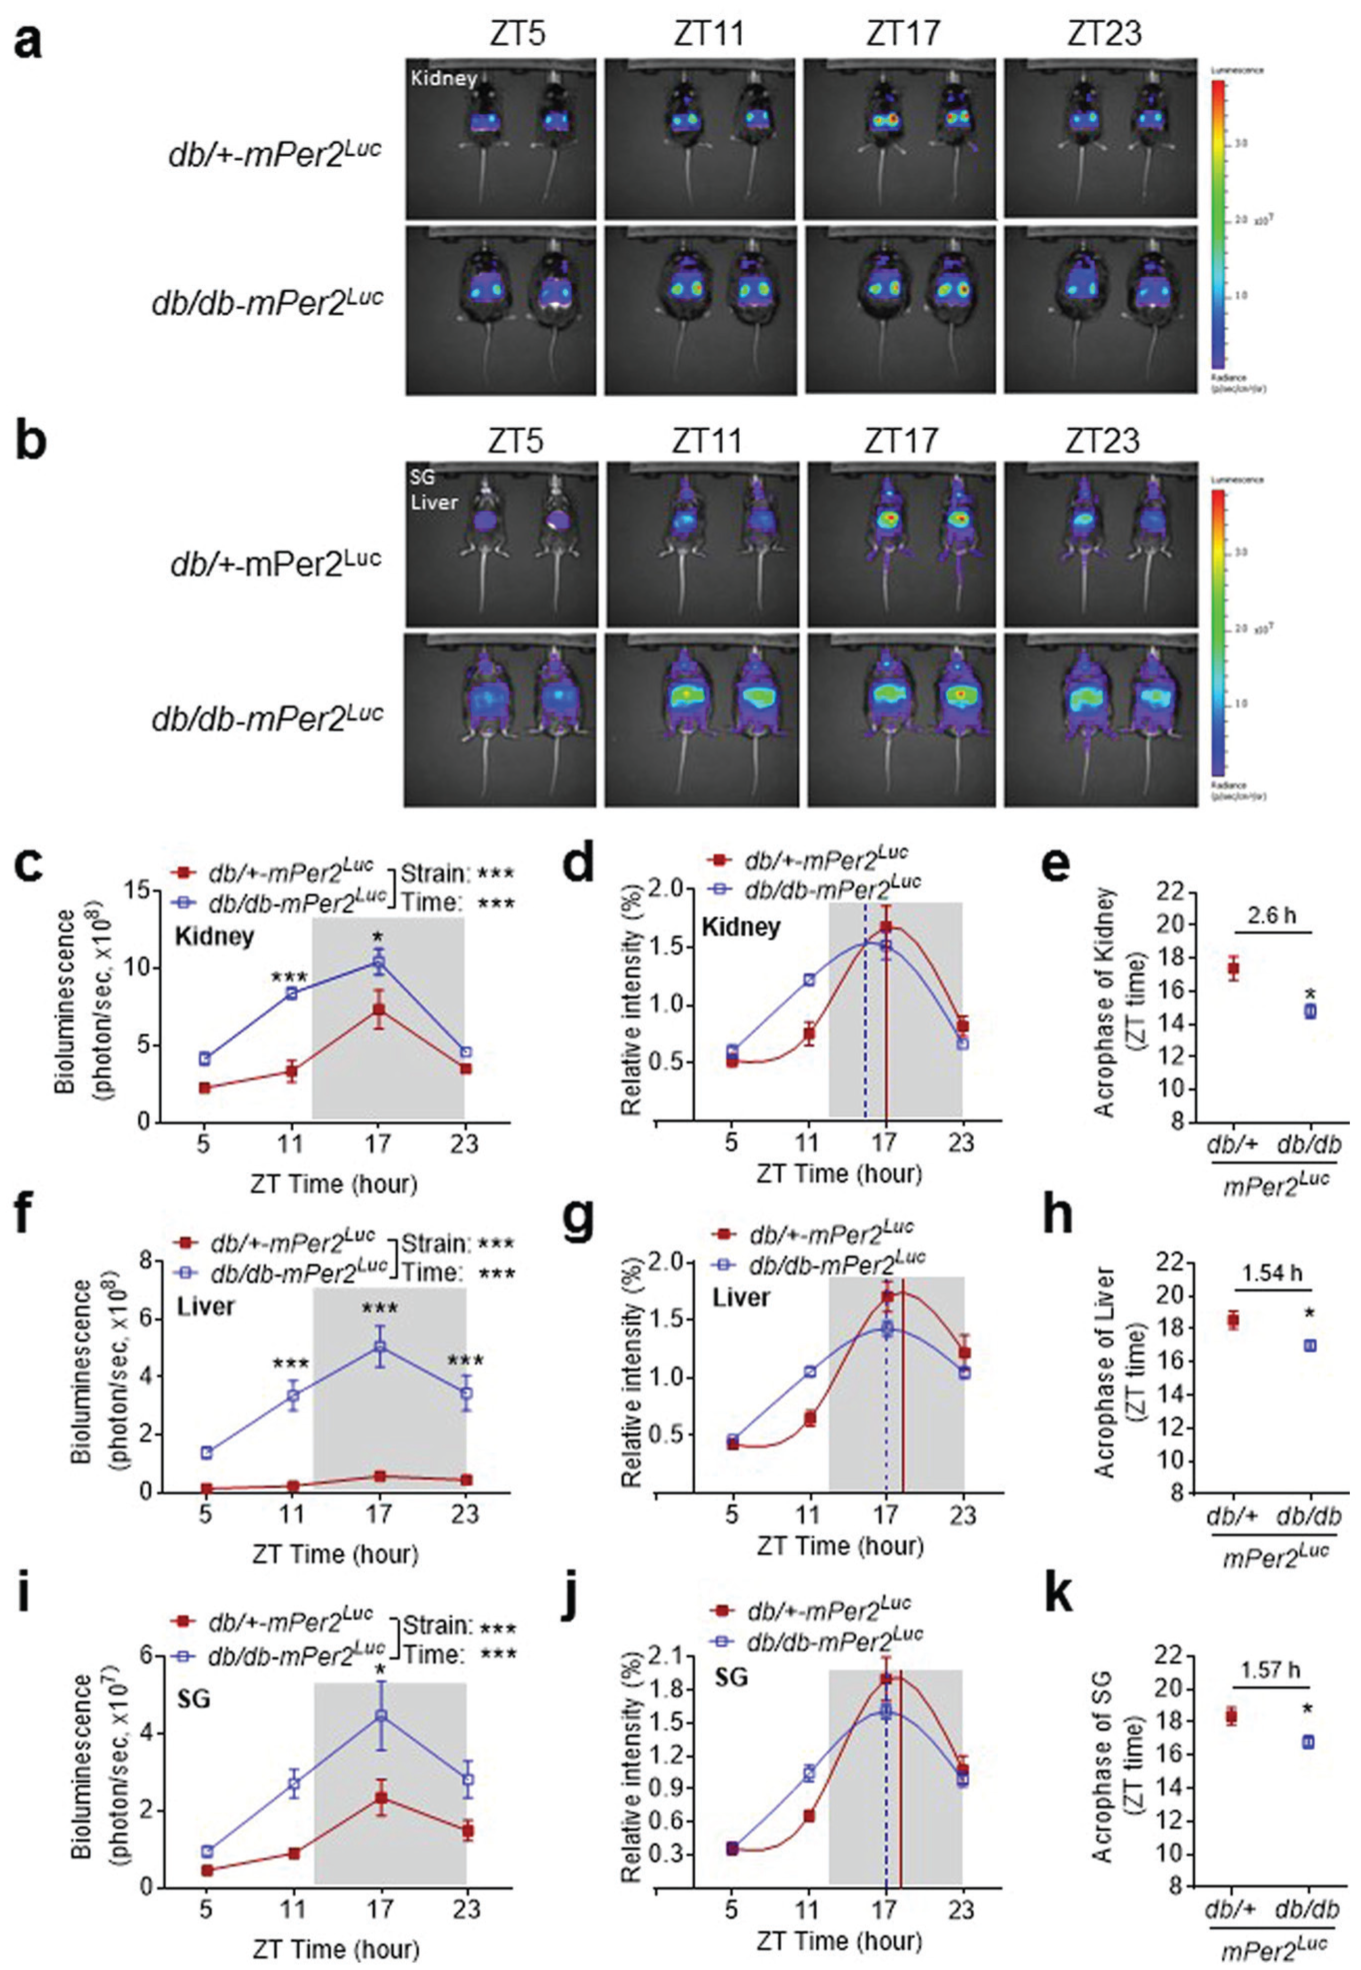
The in vivo imaging shows a phase shift in mPer2 oscillation in the kidney, liver, and submandibular gland (SG) in the db/db-mPer2Luc mice. a. Representative in vivo imaging of the mPer2 bioluminescence in the kidney in the db/db-mPer2Luc (lower panel) and control mice (upper panel). b. Representative in vivo imaging of the mPer2 bioluminescence in the SG and liver in the db/db-mPer2Luc (lower panel) and control mice (upper panel). The absolute bioluminescence intensity detected in the kidney (c), liver (f), and SG (i). The relative bioluminescence intensity obtained by normalizing to the average of the four-time points’ data in the kidney (d), liver (g), and SG (j). The solid vertical line indicates the acrophase of the control db/+-mPer2Luc mice, whereas the dotted vertical line indicates the acrophase of the db/db-mPer2Luc mice. The acrophase of the two strains of mice in the kidney (e), liver (h), and SG (k) where the number above the symbol indicates the difference of the acrophase between the two strains of mice. From c through k: the open square with dotted line represents the db/db-mPer2Luc mice, the filled square with solid line represents the control db/+-mPer2Luc mice. All data were expressed as mean ± SEM (N = 4-5). *, P < 0.05; ***, P < 0.001.
To better quantify mPer2 oscillations in all 3 tissues between the 2 mouse strains, we normalized the absolute mPer2 bioluminescence intensities to the average of the 4 ZT time points of absolute mPer2 bioluminescence intensities, in accordance with a previous report (Tahara et al., 2012). We found that the relative mPer2 bioluminescence signal from db/db-mPer2Luc mice peaked earlier in all 3 tissues than in control mice (Figure 6d, 6g, and 6j). Moreover, cosinor analysis further illustrated that the phase of the mPer2 oscillation was significantly advanced in all 3 tissues in db/db-mPer2Luc mice compared with that in control mice, with 2.60 ± 0.82, 1.54 ± 0.59, and 1.57 ± 0.61 h advance in the kidney, liver, and SG (Figure 6e, 6h, and 6k), respectively.
Time-of-day Variations in Gene Expression Are Altered in the Mesenteric Arteries of db/db-mPer2Luc Mice
Db/db mice exhibit alterations in the daily mRNA expression of clock genes and BP regulatory genes, as we have previously shown (Su et al., 2012). In addition, we have demonstrated that smooth muscle BMAL1 participates in the control of BP daily rhythm by regulating one of the contraction regulatory proteins Rho-kinase 2 (ROCK2) in WT mice (Xie et al., 2015). To test whether any putative clock-controlled blood pressure-associated genes are dysregulated in db/db-mPer2Luc mice, we determined the mRNA expression of Bmal1 and several contractile regulatory genes in the MA at ZT5 and ZT17. As shown in Suppl. Figure S5a-S5e, Bmal1, ROCK1, calponin-1, tropomyosin-2, and smooth muscle protein-22α (SM22α) mRNA expression varied by time-of-day. Importantly, an attenuation or loss of the time-of-day variation was found in db/db-mPer2Luc mice compared with control mice. In contrast, no time-of-day variations were detected in ROCK2, calponin-2, calponin-3, and tropomyosin-1 mRNA in either genotype (Suppl. Figure S5c and S5e-g).
Discussion
The current study describes a novel type 2 diabetic db/db-mPer2Luc mouse model. The major new findings are: 1) db/db-mPer2Luc mice are obese, hyperglycemic, and glucose-intolerant and thus resemble type 2 diabetic patients; 2) db/db-mPer2Luc mice are normotensive but exhibit a compromised BP daily rhythm, which is associated with the disruption of daily rhythms in baroreflex sensitivity, locomotor activity, and metabolism, but not heart rate or food and water intake; 3) a desynchrony of peripheral tissue oscillation is caused by the various extents of phase advances of the mPer2 oscillation ex vivo of many tissues except the central SCN pacemaker; 4) the similar desynchrony of mPer2 phase is also observed in vivo in the kidney, liver, and SG.
The db/db mice have been used extensively for studying the pathogenesis of obesity and diabetes. Interestingly, the diabetic phenotype of db/db mice varies depending on the genetic background: the hyperglycemia is more severe when the leptin receptor mutation is expressed on a C57BL/KsJ background than on a C57BL/6J background (Leiter et al., 1981). Probably because of its severe diabetic phenotype, C57BL/KsJ-db/db mice are most commonly used. Interestingly, db/db-mPer2Luc mice have a significantly higher body weight than age-matched C57BL/KsJ-db/db mice (65.72 ± 1.38 g v. 47.07 ± 1.05 g; n = 12; P < 0.001). However, the hyperglycemia in db/db-mPer2Luc mice is much less severe than that in C57BL/KsJ-db/db mice (320.3 ± 18.46 mg/dl v. 585.9 ± 9.163 mg/dl; n = 12; P < 0.001). These results suggest that db/db-mPer2Luc mice more closely resemble C57BL/6J-db/db mice (Hummel et al., 1972) and mimic diabetic patients with obesity, moderate hyperglycemia, and glucose intolerance.
In agreement with their moderate diabetic phenotypes, db/db-mPer2Luc mice are normotensive, which contrasts with hypertensive C57BL/KsJ-db/db mice (Goncalves et al., 2009; Park et al., 2008; Senador et al., 2009; Su et al., 2008). Despite this difference, db/db-mPer2Luc mice also exhibit non-dipping BP, similar to C57BL/KsJ-db/db mice (Goncalves et al., 2009; Park et al., 2008; Senador et al., 2009; Su et al., 2008), which is typified by a lack of BP fall during the inactive light phase. Although leptin signaling is implicated in obesity-associated hypertension (Simonds et al., 2014), such non-dipping BP in db/db-mPer2Luc and C57BL/KsJ-db/db mice is unlikely to be mediated directly by the loss-of-function mutation in the leptin receptor since the disruption of BP circadian rhythm was only detectable in mice older than 11 weeks (Senador et al., 2009). The mechanism by which diabetes induces non-dipping BP is unclear. In particular, it is unclear whether hyperglycemia, insulin resistance, or both are responsible for the disrupted BP circadian rhythm. While this important mechanistic issue remains to be elucidated, the current study demonstrates for the first time that disrupted BP daily rhythm in db/db-mPer2Luc mice is associated with the loss of daily rhythm in spontaneous baroreflex sensitivity but not heart rate. Baroreflex is a critical mechanism for maintaining BP homeostasis, and baroreflex sensitivity exhibits daily variations in humans (Di Rienzo et al., 2001; Hossmann et al., 1980). Interestingly, the observed loss of baroreflex sensitivity daily variation resembles the loss of baroreflex sensitivity daily variation previously reported by us in the smooth muscle Bmal1 knockout mice (Xie et al., 2015), indicating that dysfunction of clock genes in db/db-mPer2Luc mice may cause a loss of baroreflex sensitivity daily variation, and thus contribute to the decreased nocturnal BP decline phenotype.
We have previously reported that the daily locomotor activity rhythm is lost in C57BL/KsJ-db/db mice (Su et al., 2008). In accordance with this finding, the current study illustrated that this locomotor rhythm was similarly abolished in db/db-mPer2Luc mice (Su et al., 2008). We speculate that the loss of locomotor activity rhythm in both strains of db/db mice results from their severe obesity; i.e., they are too heavy to move around. Although the loss of locomotor activity rhythm may potentially contribute to a loss of BP daily rhythm, the loss of locomotor activity mainly occurred during the night in db/db-mPer2Luc mice, whereas the loss of BP dipping occurred during the day. Therefore, it is unlikely that the loss of locomotor activity accounts for the disrupted BP daily rhythm in db/db-mPer2Luc mice.
In humans (van Moorsel et al., 2016) and rodents (Oosterman et al., 2015; Sun et al., 2015), RER displays time-of-day variations, with higher values during the active phase indicating the preferential use of carbohydrates and lower values during the inactive phase indicating the preferential use of fats. In C57BL-KsJ-db/db mice, RER was decreased at one specific time of the day (Choi et al., 2015; Osborn et al., 2010). However, it is surprising that it has not been reported whether the daily rhythm of RER is disrupted in db/db mice. An intriguing finding from the current study is that db/db-mPer2Luc mice lost their RER time-of-day variations, mainly due to an increased RER during the inactive light phase as compared with control mice. These results suggest that the flexibility to use different sources of fuel is compromised in diabetic db/db-mPer2Luc mice. Moreover, there is a temporal correlation between increased RER and decreased BP decline as both occurred during the inactive light phase. However, it is unclear whether the increased RER during the light phase caused the compromised BP dipping in db/db-mPer2Luc mice.
Accumulated evidence from animal and human studies over the last decade suggests that BP circadian rhythm is regulated by multiple organs and systems, including the neuroendocrine system, kidneys, and vasculature (resistance arteries) (Rudic and Fulton, 2009). It is long believed that BP circadian rhythm, just like other physiological and behavioral circadian rhythms, is mostly controlled by the master pacemaker in the SCN. However, the current study demonstrates that the phase of mPer2 protein daily oscillation was not significantly altered in the SCN tissue from db/db-mPer2Luc mice compared with controls. These results confirm previous reports that there is little to no change in SCN mPer2 mRNA daily oscillation in C57BL-KsJ-db/db mice (Grosbellet et al., 2016; Kudo et al., 2004; Nernpermpisooth et al., 2015). These results are also consistent with previous reports that peripheral clock gene oscillations are altered in some tissues from diabetic patients (Ando et al., 2009; Pappa et al., 2013) and db/db mice (Caton et al., 2011; Kudo et al., 2004; Nernpermpisooth et al., 2015; Su et al., 2012). In addition, in db/db mice, the alternations to peripheral clock expression occur as early as 6 to 8 weeks of age (Caton et al., 2011; Kudo et al., 2004), whereas the disruption in BP circadian rhythm is not detectable in db/db mice until 11 weeks or older; this indicates that peripheral clock impairment precedes the disruption to BP circadian rhythm. Taken together, these results suggest that peripheral oscillators, in contrast to the master SCN pacemaker, are strongly affected by diabetes and may be responsible for disrupted BP circadian rhythm.
Perhaps one of the most important findings from the current study is that the phase of the mPer2 protein daily oscillation was advanced to various extents in a tissue-specific manner in peripheral tissues, without any changes in the phase in the SCN. This finding was revealed by monitoring mPer2 protein oscillation in real-time in our novel db/db-mPer2Luc mice. In agreement with the important role of BMAL1 in the renal, smooth muscle, and fat tissues in regulating BP rhythm under physiological conditions (Chang et al., 2018; Tokonami et al., 2014; Xie et al., 2015), we found that the phase of mPer2 protein oscillation was advanced in WAT, kidney, MA, and aorta from db/db-mPer2Luc mice to 4.6, 2.21, 1.71, and 0.99 h, respectively. These results are also consistent with previous studies that reported altered mPer2 mRNA daily oscillations in these tissues from C57BL-KsJ-db/db mice (Caton et al., 2011; Nernpermpisooth et al., 2008; Su et al., 2012; Qiu et al., 2015). In contrast, it was surprising that the phase of mPer2 protein daily oscillation in the adrenal gland, an important source of hormones that regulate BP circadian rhythm, was not significantly changed in C57BL-KsJ-db/db mice relative to control mice. It was also surprising that the phase of mPer2 protein daily oscillation in the thymus, an important organ that produces T lymphocytes, was advanced up to 4.23 h. This result is consistent with the recent report that T lymphocytes play a critical role in angiotensin II-induced hypertension (Guzik et al., 2007), and suggests that clock genes in T lymphocytes may be crucially involved in the disruption of BP circadian rhythm in diabetes.
Obesity and diabetes in mice can be induced by a high fat (HF) diet, which also alters activity, feeding, and molecular circadian rhythms (Hatori et al., 2012; Kohsaka et al., 2007). Although the causes of obesity and diabetes in HF diet-fed mice and db/db-mPer2Luc mice are different, it is interesting to note that there are some similarities with respect to the effects of a HF diet and leptin receptor mutation (db/db mice) on mPer2 rhythm. For example, using ex vivo bioluminescent analyses, Pendergast and others demonstrated that HF diet-fed mice exhibited a 1- to 4-h phase advance in the mPer2 rhythms of 2 organs but not the SCN (Pendergast et al., 2013). Using the same ex vivo assay, the current study obtained similar results in db/db-mPer2Luc mice, suggesting that the disruption of peripheral clocks in the absence of a change in the central pacemaker by obesity or diabetes is not model-specific. In addition, an approximately 4-h phase advance of mPer2 oscillation in liver explants without a phase shift in lung explants is observed in HF-fed mice (Pendergast et al., 2013; Branecky et al., 2015). The current study also found similar results in db/db-mPer2Luc mice, suggesting that different peripheral tissues have different sensitivity to obesity and diabetes. Despite these similarities, there were some differences with respect to the effects of a HF diet and leptin receptor mutation (db/db mice) on mPer2 rhythm. For example, mPer2 rhythm in aorta explants showed an approximately 1-h phase advance in db/db-mPer2Luc mice but no change in the HF diet-fed mice (Pendergast et al., 2013).
Another interesting finding of the current study is that the mPer2 phase shifts observed in vitro from tissues explanted from the db/db-mPer2Luc mouse reflected phase shifts observed in vivo. This raises the question whether the mPer2 phase shifts in db/db-mPer2Luc mice might be caused directly by leptin receptor mutation within cells or indirectly by hyperphagia, obesity, and diabetes. Although it is currently uncertain, there is some evidence to support all possibilities. First, leptin is an adipocyte-derived hormone that binds to the leptin receptor and promotes weight loss by reducing appetite and food intake and by increasing energy expenditure (Kelesidis et al., 2010). Serum leptin levels display diurnal daily variations in both humans and rodents. There is also evidence that leptin can directly regulate clock gene oscillations. For example, leptin can phase advance the electrical activity rhythm in rat SCN in vitro (Prosser and Bergeron, 2003). Moreover, leptin is implicated in the regulation of hypertension in obesity (Simonds et al., 2014). Thus, leptin receptor mutation in various tissues may directly advance mPer2 oscillations in vivo. Second, consistent with a previous report (Ktorza et al., 1997), the current study demonstrated that db/db-mPer2Luc mice consumed more food and water than control mice. Although the food intake pattern was not altered in db/db-mPer2Luc mice, it is possible that the increased food intake due to impaired leptin signaling in db/db-mPer2Luc mice alters circadian rhythms. In fact, evidence that increased food intake affects behavioral, metabolic, and molecular circadian rhythms has been demonstrated in HF diet-fed mice (Branecky et al., 2015; Hatori et al., 2012; Kohsaka et al., 2007; Pendergast et al., 2013) and db/db mice (Kennedy et al., 2010). Thus, hyperphagia may mediate leptin receptor mutation-associated phase advance of mPer2 oscillation in vivo. Third, the current study demonstrated hyperglycemia, hyperinsulinemia, and glucose intolerance in db/db-mPer2Luc mice. Since both glucose and insulin can alter clock gene expression rhythms in vitro and in vivo (Dang et al., 2016; Hirota et al., 2002), it is likely that obesity and diabetes resulting from leptin receptor mutation may also have an indirect effect on mPer2 phase advances in these tissues in vivo. Nevertheless, future studies are required to distinguish these potential mechanisms.
In conclusion, the current study described a novel diabetic db/db-mPer2Luc mouse model that allows real-time measurement of diabetes-induced dysregulation of clock genes and disruption of BP circadian rhythm. Using this novel db/db-mPer2Luc mouse model, we have revealed that disruption of BP circadian rhythm in diabetes is associated with the loss of daily rhythms in baroreflex sensitivity, locomotor activity, metabolism, and a tissue-specific phase advance of the peripheral oscillators but not the central SCN pacemaker. These findings provide preclinical evidence for a potentially significant role of peripheral clock gene desynchrony in linking diabetes to compromised BP and metabolism circadian rhythms. The results from the current study may lead to the synchronization of various oscillators as a novel therapeutic strategy against diabetic cardiovascular complications and thus improve prognosis in diabetic patients.
Supplemental Material
Supplemental_Materials_1 – Supplemental material for A Novel Diabetic Mouse Model for Real-Time Monitoring of Clock Gene Oscillation and Blood Pressure Circadian Rhythm
Supplemental material, Supplemental_Materials_1 for A Novel Diabetic Mouse Model for Real-Time Monitoring of Clock Gene Oscillation and Blood Pressure Circadian Rhythm by Tianfei Hou, Wen Su, Zhenheng Guo and Ming C. Gong in Journal of Biological Rhythms
Footnotes
Acknowledgements
The authors thank Mrs. Ming Zhang for the animal breeding, Dr. Wendy Katz for assistance with the indirect calorimetry measurements, and Dr. Marilyn Duncan and Mr. Mark Schwarcz for editing the manuscript. This work was supported by the US NIH Grants HL125228 and HL106843 (to M.C.G. and Z.G.), the US Department of Veteran Affairs (VA Merit Award to Z.G.), and the Institutional Development Award (IDeA) from the US National Institute of General Medical Sciences of NIH, under grant number P20GM103527.
Authors Contributions
T.H. and W.S. performed the experiments and analyzed the data. T.H., Z.G., and M.G. contributed to the idea, experimental design, writing and editing the manuscript. Z.G. and M.G. share senior-authorship and contributed equally to this work.
Conflict of Interest Statement
The author(s) have no potential conflicts of interest with respect to the research, authorship, and/or publication of this article.
Notes
References
Supplementary Material
Please find the following supplemental material available below.
For Open Access articles published under a Creative Commons License, all supplemental material carries the same license as the article it is associated with.
For non-Open Access articles published, all supplemental material carries a non-exclusive license, and permission requests for re-use of supplemental material or any part of supplemental material shall be sent directly to the copyright owner as specified in the copyright notice associated with the article.