
Abstract
Huntington’s disease (HD) patients suffer from progressive neurodegeneration that results in cognitive, psychiatric, cardiovascular, and motor dysfunction. Disturbances in sleep-wake cycles are common among HD patients with reports of delayed sleep onset, frequent bedtime awakenings, and excessive fatigue. The BACHD mouse model exhibits many HD core symptoms including circadian dysfunction. Because circadian dysfunction manifests early in the disease in both patients and mouse models, we sought to determine if early interventions that improve circadian rhythmicity could benefit HD symptoms and delay disease progression. We evaluated the effects of time-restricted feeding (TRF) on the BACHD mouse model. At 3 months of age, the animals were divided into 2 groups: ad lib and TRF. The TRF-treated BACHD mice were exposed to a 6-h feeding/18-h fasting regimen that was designed to be aligned with the middle (ZT 15-21) of the period when mice are normally active (ZT 12-24). Following 3 months of treatment (when mice reached the early disease stage), the TRF-treated BACHD mice showed improvements in their locomotor activity and sleep behavioral rhythms. Furthermore, we found improved heart rate variability, suggesting that their autonomic nervous system dysfunction was improved. On a molecular level, TRF altered the phase but not the amplitude of the PER2::LUC rhythms measured in vivo and in vitro. Importantly, treated BACHD mice exhibited improved motor performance compared with untreated BACHD controls, and the motor improvements were correlated with improved circadian output. It is worth emphasizing that HD is a genetically caused disease with no known cure. Lifestyle changes that not only improve the quality of life but also delay disease progression for HD patients are greatly needed. Our study demonstrates the therapeutic potential of circadian-based treatment strategies in a preclinical model of HD.
Huntington’s disease (HD) patients suffer from progressive neurodegeneration that inflicts cognitive, psychiatric, cardiovascular, and motor dysfunction (Margolis and Ross, 2003; Kuljis et al., 2012). HD is caused by a CAG repeat expansion within the first exon of the Huntingtin (Htt) gene, and when translated, it produces a polyglutamine repeat that leads to protein misfolding, soluble aggregates, and inclusion bodies detected throughout the body (Saft et al., 2005; Ciammola et al., 2006). The mutated HTT protein triggers dysfunction of a large range of cellular processes, including glucose, cholesterol, and lipid metabolic pathways. HD symptoms appear at different ages, with an average onset at 40 years of age. Generally, the longer the CAG repeat, the earlier the age of onset and the greater the severity of the symptoms (Langbehn et al., 2010). Yet, even among patients with the same CAG repeat length, there is a considerable range in the time of onset and severity of symptoms (Wexler et al., 2004; Gusella et al., 2014). Such variability raises the possibility of environmental modifiers influencing the disease and suggests that appropriate disease management strategies can increase the health span of the patients. This possibility is important to pursue, as there are no known cures for HD.
Sleep disorders are extremely common in HD patients and have detrimental effects on the daily functioning and quality of life of patients and their caregivers (Morton et al., 2005; Cuturic et al., 2009; Aziz et al., 2010; Goodman et al., 2011). Disruptions in the timing of sleep are common in HD patients and often become apparent years before the onset of the motor symptoms. One of the first signs of the disease in HD patients is a phase delay in the nightly rise in melatonin (Kalliolia et al., 2014), and by the end of life, the central circadian clock (suprachiasmatic nucleus [SCN]) shows evidence of degeneration (van Wamelen et al., 2014). Mouse models of HD also exhibit a progressive and rapid breakdown of the circadian rest/activity cycle that closely mimics the condition observed in human patients, typified by loss of consolidated sleep, increased wakeful activity during the light (rest) phase, and more sleep during the dark (active) phase (Morton et al., 2005; Kudo et al., 2011; Loh et al., 2013; Kuljis et al., 2016). Disorganized circadian timing leads to undesirable effects throughout the body (Colwell, 2015), altering the function of key organ systems including heart, pancreas, liver, lungs, as well as the brain. Collectively, this prior research supports the hypothesis that circadian dysfunction interacts with HD pathology, leading to the exacerbation of HD-related symptoms. If this hypothesis is correct, we would anticipate a retardation of HD progression by employing treatments that improve the sleep-wake cycle.
To test this hypothesis, we have been using the BACHD knock-in mouse model of HD. While there are several good mouse models of HD, the BACHD offers the advantage of containing the human mutation (Gray et al., 2008; Wang et al., 2014). We have characterized the impact of age (3, 6, 9, and 12 months old) on the diurnal and circadian rhythms in wheel-running behavior, core body temperature (CBT), and heart rate (HR; Kudo et al., 2011) and have also documented clear dysfunction in the daily rhythms in autonomic regulation of cardiac output (Schroeder et al., 2011; Schroeder et al., 2016). SCN neurons are spontaneously active and generate action potentials with peak firing rates during the day (Colwell, 2011). We have previously shown that BACHD SCN neurons show significantly reduced daytime spontaneous firing rates (Kudo et al., 2011; Kuljis et al., 2016) demonstrating that, early in the disease, these mice have deficits in the central circadian clock. Decreased daytime electrical activity in the SCN would weaken both neural and hormonal outputs. These observations suggest that a pathological weakening of the electrical output from the SCN is responsible for the circadian behavioral phenotypes observed in the BACHD. This wealth of data makes the BACHD an ideal preclinical model to examine the impact of circadian interventions on disease trajectory.
One of the most powerful regulators of the circadian system is the daily feed/fast cycle (Bass and Takahashi, 2010; Tahara and Shibata, 2013). For example, SCN-lesioned animals can still be synchronized to a feeding schedule (Stephan, 2002; Acosta-Galvan et al., 2011; Tahara et al., 2012). Most of the published work has examined the consequences of placing the feeding in the light (rest) phase when it is misaligned with normal consumption patterns. However, there have been a few studies that found benefits in scheduling the feeding so that it is aligned with the normal active phase. Most notably, the Panda lab has shown that mice under time-restricted feeding (TRF) consume equivalent calories from a high-fat diet as those with ad libitum (ad lib) access and yet are protected against obesity, hyperinsulinemia, and inflammation and have improved motor coordination (Hatori et al., 2012). The TRF protocol was also beneficial in preventing age-induced cardiovascular dysfunction in Drosophila (Gill et al., 2015; Melkani and Panda, 2017). We felt that this protocol could be usefully applied to the BACHD model to determine whether the scheduled feeding provides benefits to a preclinical neurodegenerative disease model with a focus on the sleep-wake, motor, and cardiovascular phenotypes.
Materials and Methods
The work presented in this study followed all guidelines and regulations of the University of California, Los Angeles, Division of Animal Medicine, which are consistent with the Animal Welfare Policy Statements and the recommendations of the Panel on Euthanasia of the American Veterinary Medical Association.
Animals
The BACHD mouse model that we used in this study expresses the full-length human mutant Htt gene encoding 97 glutamine repeats under the control of endogenous regulatory machinery (BACHD; Gray et al., 2008). Female BACHD dams backcrossed on a C57BL/6J background (minimum 12 generations) were bred with C57BL/6J (wild-type [WT]) males from the Jackson Laboratory (Bar Harbor, ME) in our own breeding facility to obtain male and female offspring, either WT or heterozygous for the BACHD transgene. Data were also collected from WT mice from this colony. Only male mice were used in this study as there is a sex difference in the circadian and motor phenotypes (Kuljis et al., 2016). Genotyping was performed at 15 days of age by tail snips, and after weaning, littermates were group housed until otherwise noted. All animals were housed in sound-proof, humidity-controlled chambers with controlled lighting conditions, using a 12-h light, 12-h dark cycle (12:12 LD, intensity 300 lux) for at least 2 weeks prior to experimentation. For all experiments, a light meter (BK Precision, Yorba Linda, CA) was used to measure light intensity (lux). The chambers were in the same animal housing facility with controlled temperature and humidity, and each chamber held 8 cages of mice, grouped together by feeding treatment. All animals received cotton nestlets, and water was made available at all times. To confirm the effect of timed feeding on daily rhythms and motor performance, we also examined WT mice at 6 months of age.
This study used a total of 86 C57 mice divided into 5 cohorts. The first group of BACHD (5) and WT (5) mice were used to examine the amount of food consumed and body weight under the scheduled feeding protocol. This pilot was used just to demonstrate the feasibility of the protocol, and the results are presented as a supplemental figure. The second cohort of BACHD (16) and WT (16) mice were used for the measurements of behavior (sleep, activity, motor performance). The third cohort of BACHD (16) were used for telemetry measurements. Two mice did not recover well from the surgery and were euthanized shortly after surgery. The fourth cohort of BACHD (14) and WT (14) mice were used for in vivo and in vitro measurements of bioluminescence. For these experiments, the BACHD were crossed into the PER2::LUC line.
TRF
Mice were first entrained to a 12:12 h LD cycle for a minimum of 2 weeks prior to any treatment. Experimental animals were then exposed to one of two feeding conditions: food available ad libitum (ad lib) or food available for 6 h during the middle of the active phase during zeitgeber time (ZT) 15-21. By definition, ZT 12 is the time when the lights go off when the mice are in an LD cycle. Experimental mice were singly housed in cages with a custom-made programmable food hopper that could temporally control access to food (standard chow) and prevent food consumption during restricted times. Mice are coprophagic, and the mice were not moved to new cages between their daily feeding and fasting cycles. It is likely that the mice consumed their own feces during the fast interval. These cages were also equipped with an infrared (IR) motion detector to give us the ability to measure cage activity. The mice were held in these conditions for a total of 3 months (from 3 mo to 6 mo of age).
Automated Episodic Food Intake Monitoring
Mouse episodic food intake was performed using the BioDAQ intake monitoring system (Research Diets, Inc., New Brunswick, NJ). WT and BACHD mice (n = 5) were housed and habituated in normal cages for 2 weeks. All mice were transferred to BioDAQ monitoring cages, and 2 weeks of episodic food intake under ad lib was automatically collected and recorded (Supplementary Fig. S1). Mice were then returned to normal cages, where treated mice were acclimated to TRF. When daily TRF food consumption values were consistent, after 2 weeks, all mice were again transferred to BioDAQ monitoring cages. To the extent possible, the conditions were kept identical to our normal housing conditions. Two weeks of episodic food intake under TRF or ad lib was automatically collected and recorded. Data were analyzed using the BioDAQ DataViewer software (Research Diets, Inc.). Data from 14 days were averaged into 1-h and 12-h bins across a 24-h cycle for analysis.
Monitoring of Cage Locomotor Activity
Experimental mice were singly housed in cages with the food hopper as well as IR motion sensors. The locomotor activity was recorded as previously described (Wang et al., 2017). Mice were entrained to a 12:12 h LD cycle for a minimum of 2 weeks prior to data collection. Locomotor activity data were recorded using Mini Mitter (Bend, OR) data loggers in 3-min bins, and 10 days of data were averaged for analysis. We used the 10 days of activity data collected just prior to the motor performance tests during the final 2 weeks of the TRF schedule. The data were analyzed to determine the period and rhythmic strength as previously described (Loh et al., 2013; Wang et al., 2017). The periodogram analysis uses a χ2 test with a threshold of 0.001 significance, from which the amplitude of the periodicities is determined at the circadian harmonic to obtain the rhythm power. The amount of cage activity over a 24-h period was averaged over 10 days and reported here as the arbitrary units (a.u.)/h. The number of activity bouts and the average length of bouts were determined using Clocklab (Actimetrics, Wilmette, IL), in which each bout was counted when activity bouts were separated by a gap of 21 min (maximum gap: 21 min; threshold: 3 counts/min). The onset variability was determined using Clocklab by drawing the best-fit line over the 10 days and averaging the differences between activity onset and best-fit regression of each day.
Monitoring of Immobility-defined Sleep Behavior
Immobility-defined sleep was determined as described previously (Loh et al., 2013; Wang et al., 2017). Mice were housed in see-through plastic cages containing bedding (without the addition of nesting material) and the food hopper. A side-on view of each cage was obtained, with minimal occlusion by the food bin or water bottle, both of which were top mounted. Cages were top lit using IR/light-emitting diode lights. Video capture was accomplished using surveillance cameras with visible light filters (Gadspot Inc., City of Industry, CA) connected to a video-capture card (Adlink Technology Inc., Irvine, CA) on a Dell Optiplex computer system. ANY-maze software (Stoelting Co., Wood Dale, IL) was used for automated tracking of mouse immobility.
Immobility was registered when 95% of the area of the animal stayed immobile for more than 40 sec, as was previously determined to have 99% correlation with simultaneous EEG/electromyography defined sleep (Pack et al., 2007; Fisher et al., 2012). Continuous tracking of the mice was performed for a minimum of 5 sleep-wake cycles, with randomized visits (1-2 times/day) by the experimenter to confirm mouse health and video recording. The third and fourth sleep-wake cycles were averaged for further analysis. Immobility-defined sleep data were exported in 1-min bins, and total sleep time was determined by summing the immobility durations in the rest phase (ZT 0-12) or active phase (ZT 12-24). An average waveform of hourly immobile sleep over the 2 sleep-wake cycles was produced during the final week of TRF. Variability of sleep onset and awake time was determined using Clocklab to draw the best-fit line over the sleep cycles, and the differences between sleep offset and best-fit regression of each sleep cycle were averaged.
Autonomic Outputs: CBT, HR, and Heart Rate Variability (HRV)
For the telemetry measurements, methods employed were similar to those previously described (Schroeder et al., 2016; Cutler et al., 2017). Two groups (ad lib and TRF) of BACHD mice (n = 7/group) were surgically implanted with a wireless radiofrequency transmitter (ETA-F20, Data Sciences International, St. Paul, MN). Mice were singly housed in cages with the food hopper. Cages were placed atop telemetry receivers (Data Sciences International) in a light- and temperature-controlled chamber. Standard rodent chow was provided for both groups. Data collection began 2 weeks postsurgery. HR was extrapolated from electrocardiogram waveforms using the RR interval. After the baseline recordings, the sensors were turned off to conserve battery life and turned on again for the final 2 weeks of measurements. The final measurements were made when the mice were between 5 and 6 months of age.
Data collection and analysis were performed as described previously (Cutler et al., 2017). Data were extracted in 20-sec intervals and then filtered to remove extreme noise. Remaining valid data segments were averaged into 1-h bins across the 24-h cycle. Mean normal to normal intervals (NN; in msec) and standard deviation of all NN intervals (in msec) were calculated for the time domain analysis.
In Vivo Bioluminescence
In vivo monitoring was performed as previously described (Tahara et al., 2012) with an in vivo kinetic imaging system (IVIS Kinetics; Caliper Life Sciences, Hopkinton, MA). BACHD PER2::LUC male mice (6-7 months) were subjected to ad lib or TRF for 2 weeks prior to sampling. The mice were anesthetized with isoflurane (Zoetis, Kalamazoo, MI) using a gas anesthesia system (XGI-8; Caliper Life Sciences). While the mice were under anesthesia, they were subcutaneously injected with d-luciferin potassium salt (Promega Corporation, Madison, WI) in the back near the neck at a dosage of 15 mg/kg (30 mg/10 mL or 0.05 mL/10 g body weight). Images with a 1-min exposure time were captured 8 min after the luciferin injection in the dorsal-up position for the kidney and 10 min after the injection in the ventral-up position for the liver and submandibular gland (Sub gland). For each time point, the bioluminescence image was merged with a gray-scale image. To investigate the circadian oscillations of PER2::LUC in the peripheral tissues, images were obtained 6 times per day at 4-h intervals. The average photon/sec value of the data of each day was designated as 100%, and the bioluminescence rhythms of the individual organs of the day were expressed as a percentage. The peak phase and amplitude of the normalized data were determined with the single cosinor procedure (acro.exe; designed by Dr. Refinetti). Data with p values less than 0.05 were considered rhythmic oscillations, and the graphs of the amplitudes and peak phases contained only rhythmic data.
In Vitro Bioluminescence
In vitro measurements of bioluminescence were performed as previously described (Loh et al., 2011; Loh et al., 2013). BACHD PER2::LUC male mice (6-9 months) were subjected to ad lib or TRF for 2 weeks prior to sampling. Mice were sacrificed after anesthesia (isoflurane) between ZT 10 and 11, and 1- to 2-mm3 explants were immediately dissected in ice-cold Hanks’ balanced salt solution (HBSS; Sigma, St. Louis, MO) supplemented with 4.5 mM NaHC03, 10 mM HEPES, and 100 U/mL penicillin-streptomycin. Brains were incubated in ice-cold slice solution (in mM: 26 NaHCO3, 1.25 NaH2PO4, 10 glucose, 125 NaCl, 3 KCl, 5 MgCl2, 1 CaCl2) aerated with 95% O2/5% CO2 for 5 min, and 300-µm coronal sections were collected using a vibratome and further microdissected in HBSS under a 10× dissecting microscope. The SCN was cut away from the rest of the section using 2 cuts with a surgical scalpel (No. 21 blade, Fisher Scientific, Waltham, MA). All explants were individually transferred to Millicell membranes (0.4 µm, PICMORG50; Millipore, Bedford, MA) resting on 1.2 mL of recording media: 1X DMEM (Sigma); 1X B27 supplement (Gibco, Waltham, MA); 4.5 mM NaHCO3, 10 mM HEPES, 40 mM Glutamax (Gibco), 4.5 mg/mL D-glucose, 25 U/mL penicillin, 25 U/mL streptomycin, 0.1 mM sodium salt monohydrate luciferin (Biosynth, Staad, Switzerland) in a 35-mm dish sealed with autoclaved vacuum grease (Dow Corning, Midland, MI). SCN, heart, and liver explants were inserted into the Lumicycle photometer (Actimetrics), incubated at 37 °C, and bioluminescence was continuously monitored for 7 consecutive days. Raw bioluminescence values were normalized by baseline subtraction (24-h running average) and smoothed with 2-h windows to prepare the representative bioluminescence traces. The phase and amplitude of each explant were determined as previously described (Loh et al., 2011). Period was determined using the sine-wave fit function in Lumicycle Analysis (Actimetrics).
Rotarod Test: Accelerating Version
The rotarod apparatus (Ugo Basile, Varese, Italy) is commonly used to measure motor coordination and balance. This apparatus is, in essence, a small circular treadmill. It consists of an axle or rod thick enough for a mouse to stand on when it is not in motion and a flat platform a short distance below the rod. The rod is covered with smooth rubber to provide traction while preventing the mice from clinging to the rod. In this study, mice were placed on top of the rubber-covered rod. When the mice moved at the pace set by the rotation rate of the rod, they would stay on top of it. When mice no longer moved at the selected pace, they dropped a short distance to the platform below. The time a mouse remains on the rod before dropping to the platform is called the latency to fall. Following a 15-min habituation to the testing room, mice were placed on the slowly rotating rod. The rod gradually accelerated from 5 rpm to 38 rpm over the course of the trial. The length of time the mouse stayed on the rod was recorded. A 2-day protocol for the accelerating rotarod tests was used. On the first day, the mice were trained on the rotarod over 5 trials. The maximum length of each trial was 600 sec, and mice were allowed to rest for a minimum of 60 sec between trials. On the second day, mice were tested on the rotarod, and the latency to fall from the rotarod was recorded from 5 trials. Mice were again allowed to rest for a minimum of 60 sec between trials. Data from each mouse were analyzed after averaging the times from all 5 trials. The apparatus was cleaned with 70% alcohol and allowed to dry completely between trials. A dim red light (2 lux) was used for illumination during active (dark) phase testing.
Challenging Beam Test
The challenging beam test is a modified version of the beam traversal test described by Goldberg and colleagues (Goldberg et al., 2003; Fleming et al., 2013), and was used to characterize the motor deficits of BACHD mutant mice in previous studies (Kudo et al., 2011; Wang et al., 2017). The beam narrows in 4 intervals from 33 mm > 24 mm > 18 mm > 6 mm, with each segment spanning 253 mm in length. The home cage of each mouse is put on the end of the beam as the motivating factor. In this study, animals were trained on the beam for 5 consecutive trials on 2 consecutive days. During each trial, each mouse was placed on the widest end of the beam and allowed to cross with minimal handling by the experimenter. On the testing day, a metal grid (10 × 10 mm spacing, formed using 19-gauge wire) was overlaid on the beam. This overlaid grid increased the difficulty of the beam traversal task and provided a visual reference for foot slips made while crossing the grid. Each mouse was subjected to 5 consecutive trials conducted during their active (dark) phase. Trials were recorded by a camcorder under dim red-light conditions (2 lux), supplemented with infrared lighting for video recording. The videos were scored post hoc by 2 independent observers for the number of missteps (errors) made by each mouse. The observers were masked as to the treatment group of the mice that they were scoring. An error was scored when any foot dipped below the grid. The number of errors was averaged across the 5 trials per mouse to give the final reported values. The apparatus was cleaned with 70% alcohol and allowed to dry completely between trials.
Statistical Analysis
We were interested in determining if TRF can improve the symptoms in the BACHD mouse model; therefore, treated BACHD mice (TRF group) were compared with age-matched untreated BACHD mice (ad lib group) in all experiments. The sample size per group was determined by both our empirical experience with the variability in the prior measures in the BACHD mice and a power analysis (SigmaPlot, SYSTAT Software, San Jose, CA) that assumed a power of 0.8 and an alpha of 0.05. To assess the impact of TRF after 3 months, we applied a t test for the analysis. To determine the impact of the treatment on temporal activity, sleep, CBT, HR, and HRV waveforms, we used a 2-way repeated-measures analysis of variance (RM ANOVA) with treatment and time as factors. To determine the impact of the treatment on errors made in each beam of the challenging beam test, we used a 2-way ANOVA with treatment and beam as factors. Pairwise multiple-comparison procedures were made using the Holm-Sidak method. Correlations between circadian parameters and motor performance were examined by applying Pearson correlation analysis. Statistical analysis was performed using SigmaPlot. Data were examined for normality (Shapiro-Wilk test) and equal variance (Brown-Forsythe test). Between-group differences were determined significant if p < 0.05. All values are reported as group mean ± standard error of the mean. For each of the tests, we report the t- or F-values as well as the degrees of freedom.
Results
In these experiments, we used a TRF protocol consisting of a scheduled 6-h feeding/18-h fast, with the feeding between ZT 15 and 21 aligned to the middle of the active phase when mice normally eat. During this 6-h interval, the mice could eat without any restrictions, and the total amount of food consumed daily did not vary between the BACHD groups (ad lib: 3.6 ± 0.3 g; TRF: 3.3 ± 0.1 g, t = 1.110, p = 0.179, t test). The body weights at the end of the study were not different in BACHD mice under TRF (28.7 ± 0.7 g) compared with age-matched ad lib–fed mutants (28.2 ± 4.1 g, U = 21.5, p = 0.279, rank-sum test). The treatment was applied starting when the mutants begin to exhibit disrupted activity rhythms and motor symptoms (3 months) and ended at 6 months (Kudo et al., 2011).
TRF Improved Activity and Sleep Behavioral Rhythms in the BACHD Line
TRF noticeably improved the temporal pattern of cage activity (Fig. 1; Table 1). Compared with ad lib BACHD of the same age (6 months), the BACHD mice on TRF exhibited increased power of the rhythm, t(14) = 6.891, p < 0.001 (t test); percentage of activity in the active (dark) phase, t(14) = 4.457, p < 0.001 (t test); and precision in onset, U(14) = 1.000, p < 0.001 (rank-sum test). Overall activity per hour was not altered by the treatment, t(14) = 1.679, p = 0.115 (t test), compared with the ad lib–fed mutants. A 2-way RM ANOVA of the activity waveforms revealed a significant effect of time, F(23) = 53.811, p < 0.001, and treatment, F(1) = 16.239, p < 0.001, and a significant interaction between the 2 factors (F = 2.788, p < 0.001). A comparison of the same animals before (3 months) and after (6 months) treatment indicated that the TRF also significantly improved power, t(7) = −4.622, p = 0.002 (paired t test), and the percentage activity in the light, t(7) = −6.318, p < 0.001 (paired t test), in the BACHD, whereas activity levels and precision were not altered pre- and posttreatment.
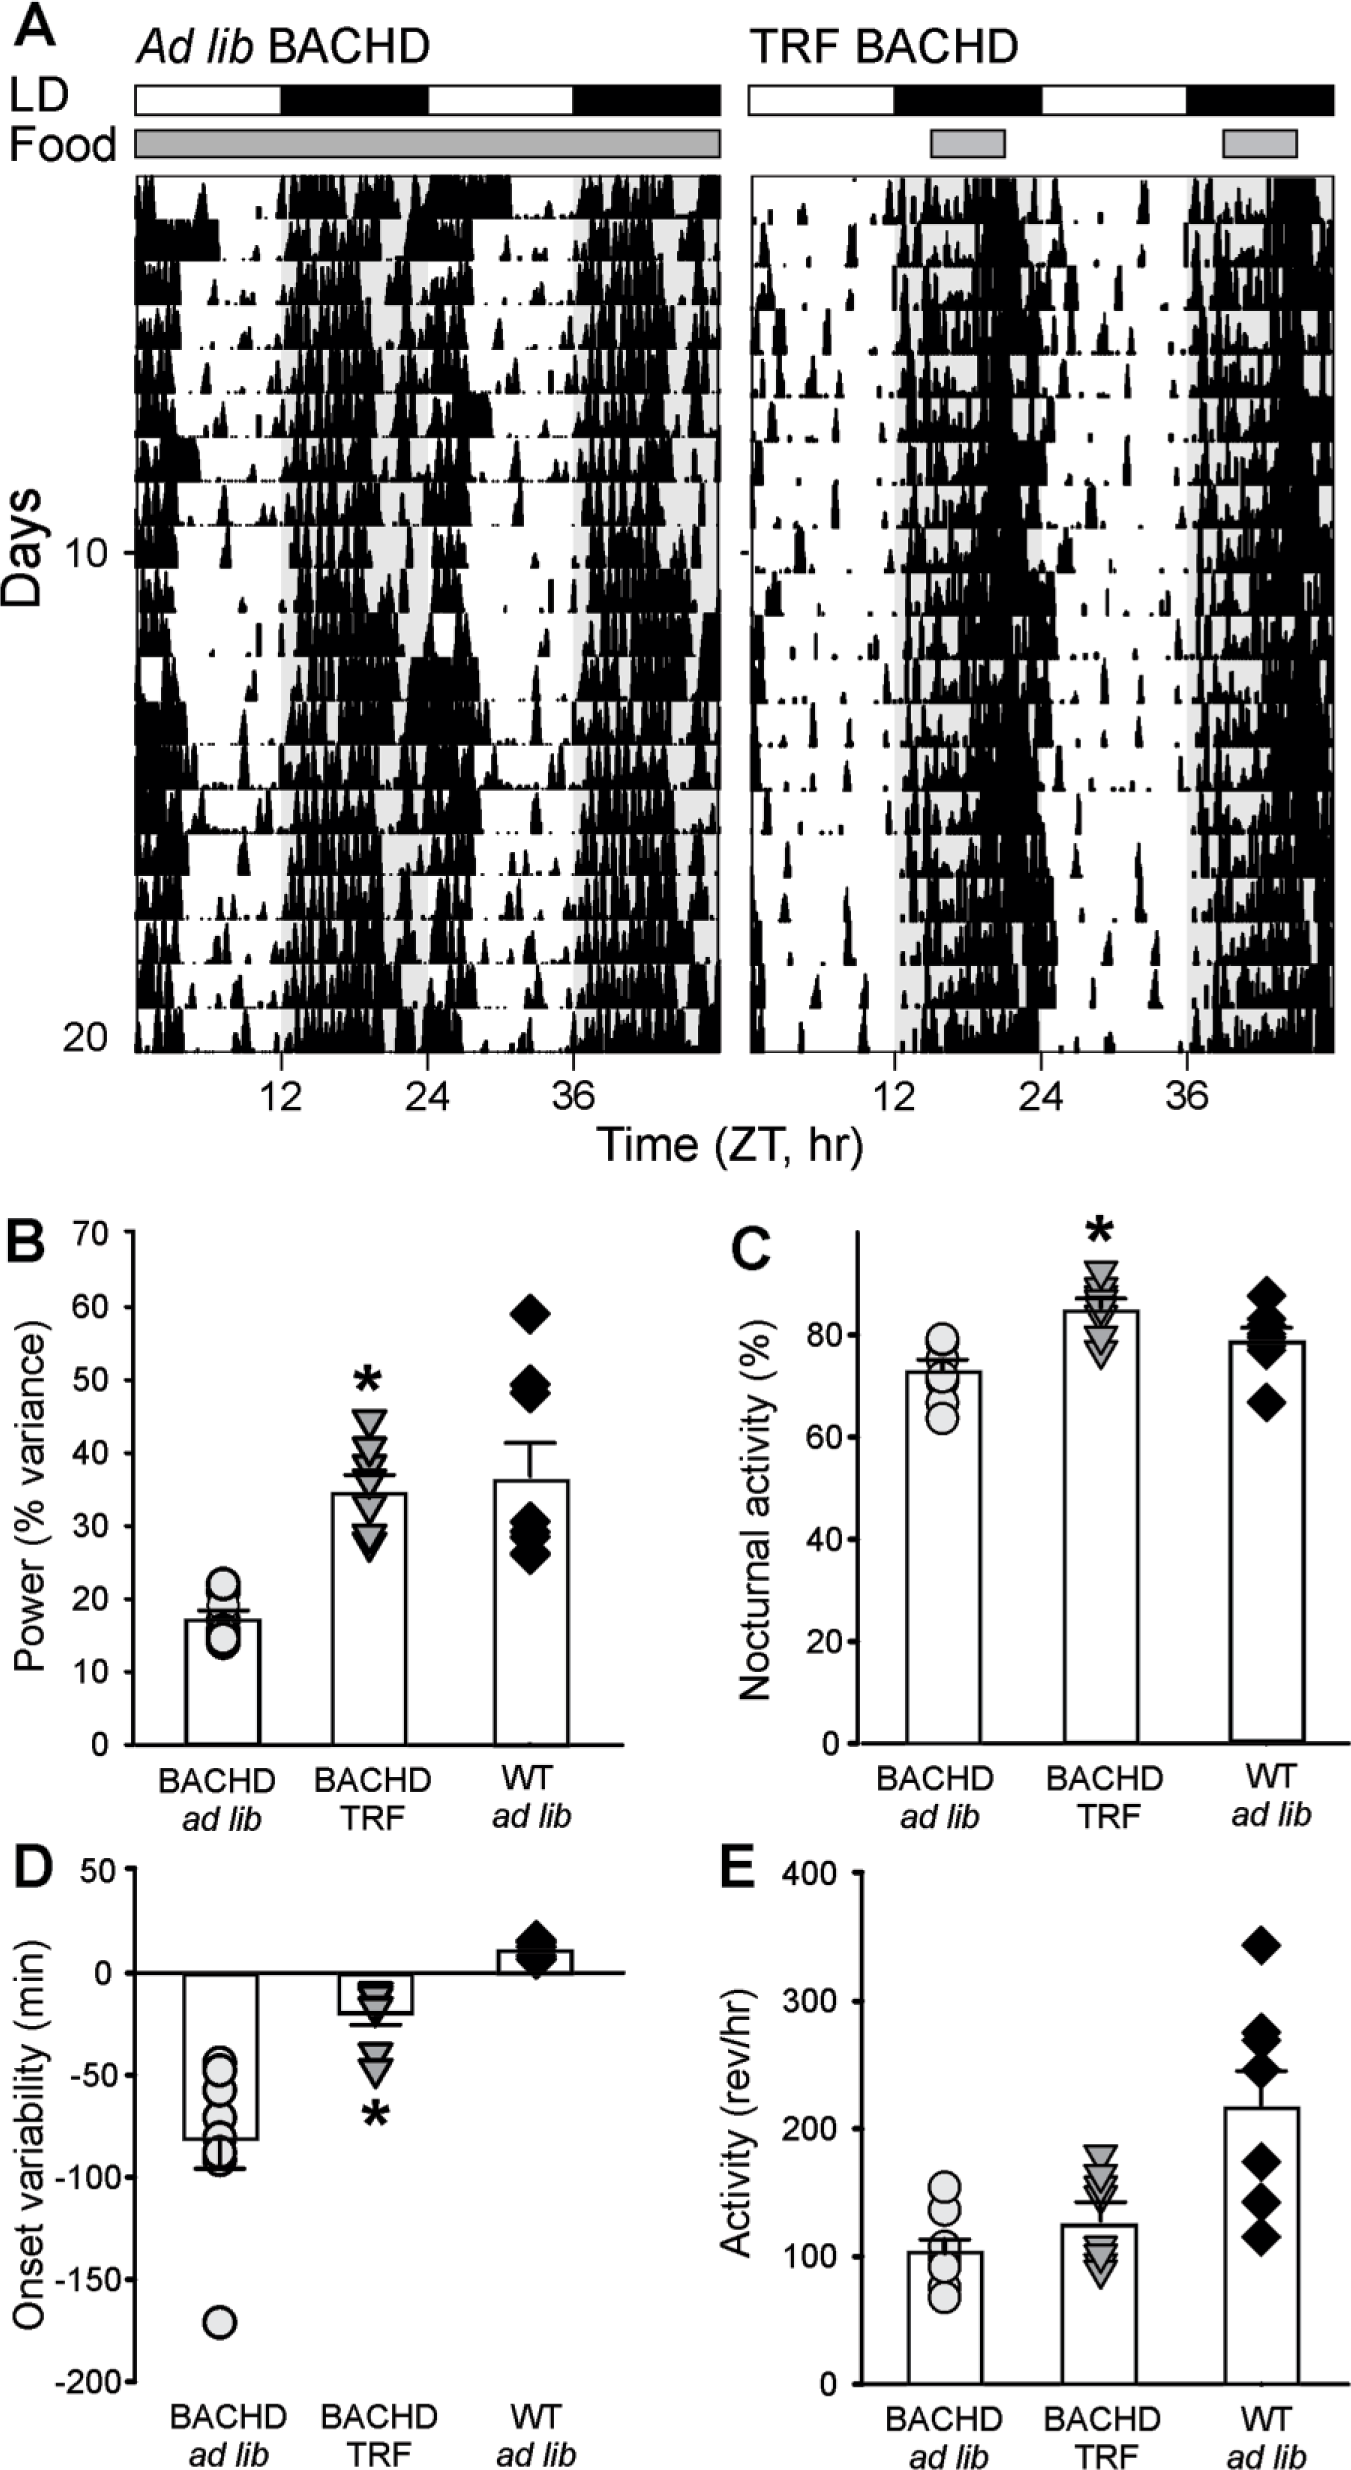
Locomotor activity rhythms were improved by the TRF regimen. (A) Examples of cage activity rhythms recorded from BACHD mutant mice under ad lib (left) and TRF (right) conditions. The activity levels in the actograms were normalized to the same scale (85% of the maximum of the most active individual). Each row represents two consecutive days, and the second day is repeated at the beginning of the next row. The white/black bars on the top of the actograms and the white/grey shading in the actograms indicate the lighting condition. The grey bar at the top of the actogram indicates food availability under ad lib conditions, and the grey bar at the top of TRF actogram indicates the time when food hopper is opened. (B) The strength of the activity rhythm is indicated by the power (% variance) of the X2 periodogram analysis. (C) The % of total activity that occurred in the dark (active) phase. (D) The averaged onset variability was calculated from the best-fit regression line. (E) Average hourly activity levels from 10 days of cage activity. For this and other figures, the vertical bar plots show group means and SEM. The symbols show the values from individual animals in each group (BACHD ad lib, circles; BACHD TRF, triangles, WT ad lib, diamonds). Comparisons between BACHD cohorts were made using a t-test. Asterisks represent significant differences due to TRF regimen compared to the BACHD ad lib controls (p < 0.05; n = 8 per group).
Rhythms in locomotor activity and sleep behavior in BACHD mice were improved by TRF.
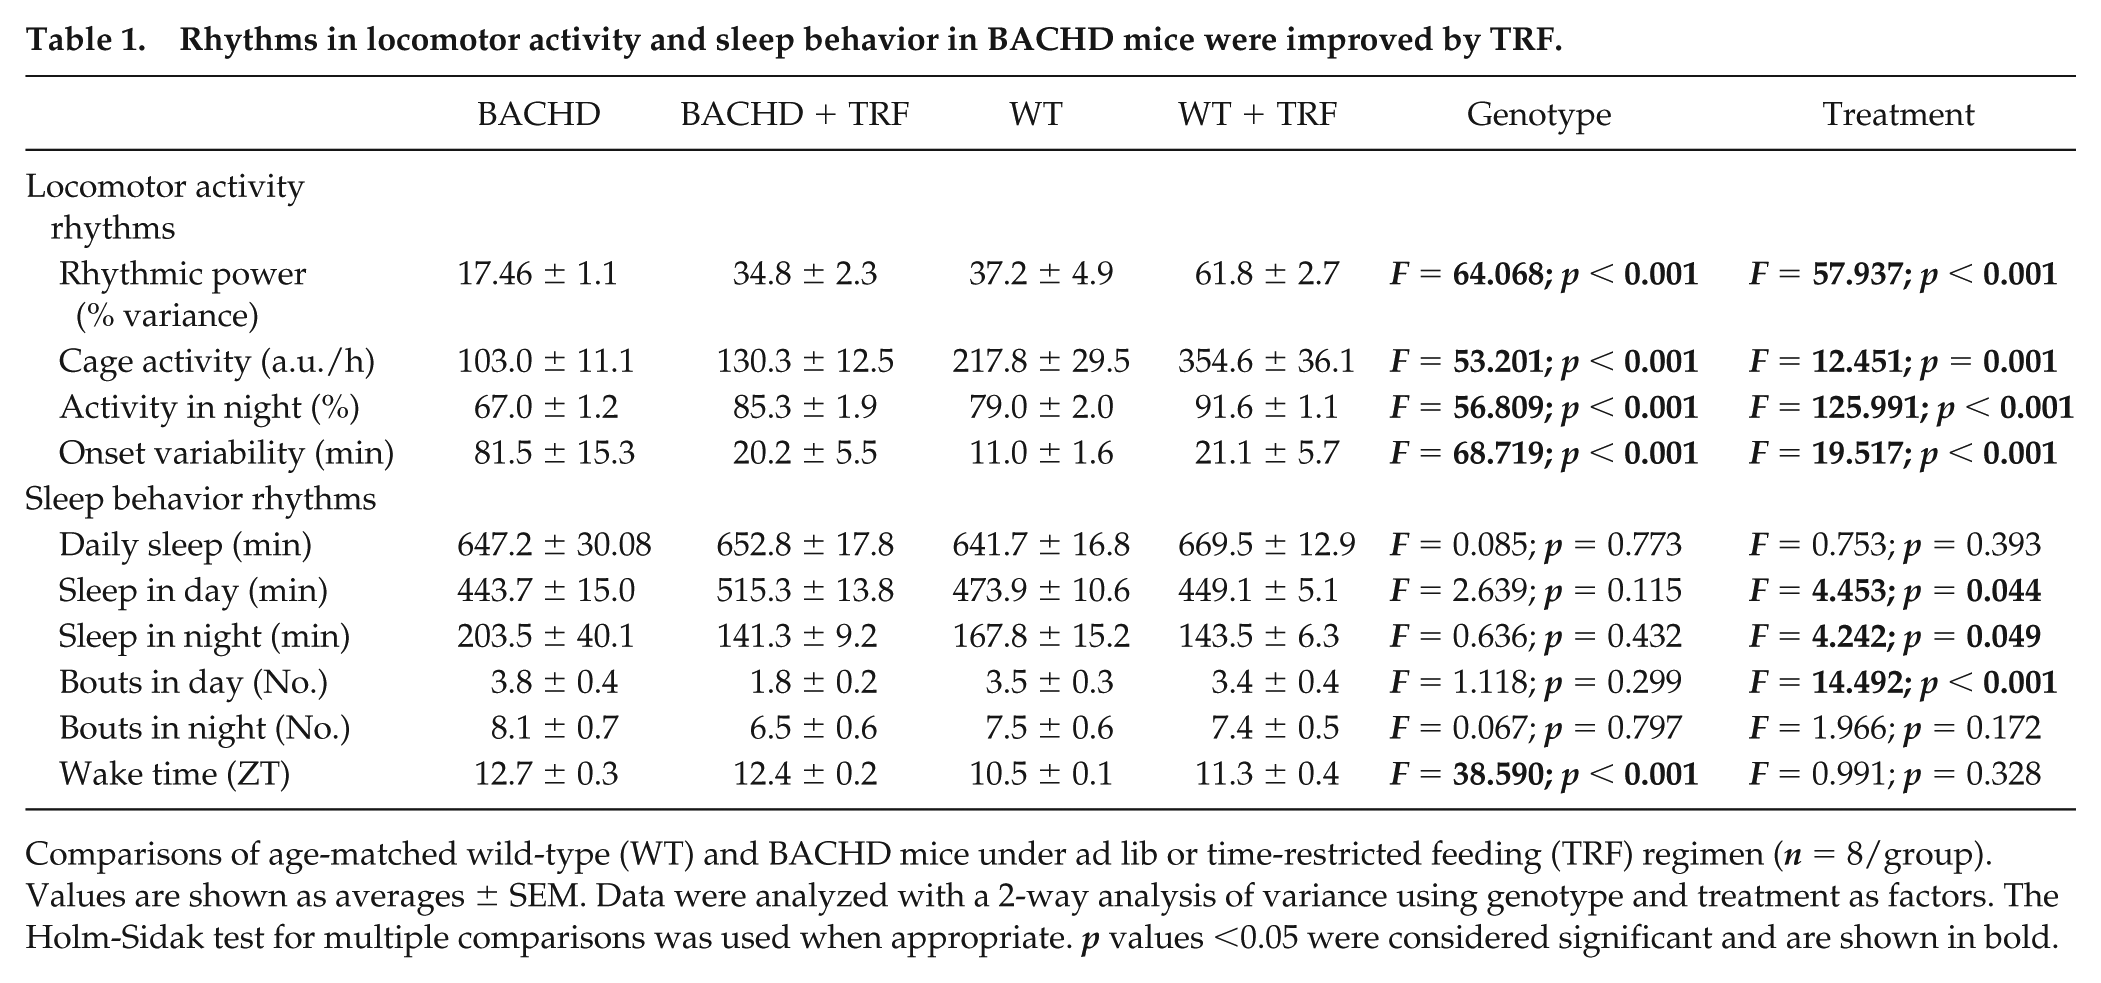
Comparisons of age-matched wild-type (WT) and BACHD mice under ad lib or time-restricted feeding (TRF) regimen (n = 8/group). Values are shown as averages ± SEM. Data were analyzed with a 2-way analysis of variance using genotype and treatment as factors. The Holm-Sidak test for multiple comparisons was used when appropriate. p values <0.05 were considered significant and are shown in bold.
The temporal distribution of sleep behavior was altered by TRF. During their rest (light) phase, the treated mice spent more time sleeping, t(14) = 3.322, p = 0.005 (t test), as well as exhibiting fewer sleep bouts, t(14) = 3.812, p = 0.001 (t test), compared with untreated BACHD mice (Fig. 2; Table 1). In contrast, during the active (dark) phase, there were no differences in the amount of sleep, U(14) = 24, p = 0.442 (rank-sum test), or in the number of sleep bouts, t(14) = 1.758, p = 0.101. Finally, TRF decreased variability and phase advanced the time of sleep onset. A 2-way RM ANOVA revealed a significant effect of time, F(23) = 41.656, p < 0.001, and treatment, F(1) = 13.986, p = 0.001, and a significant interaction between the 2 factors (F = 2.771, p < 0.001). Significant differences between the genotypes were found in both the rest (light) phase (ZT 0, 3, 4) and dark phase (ZT 12, 20, 23). A comparison of the same animals before and after treatment indicated that TRF produced significant increases in the duration of sleep, t(7) = −3.212, p = 0.015 (paired t test) and decreased the number of sleep bouts, t(7) = 13.133, p < 0.001 (paired t test) in the BACHD in the light phase. During the dark phase, TRF did not alter either the duration, t(7) = 0.934, p = 0.381 (paired t test), or number of bouts, t(7) = 0.789, p = 0.456 (paired t test). In summary, daily rhythms in both activity and sleep behavior were significantly improved in the BACHD mice by the TRF protocol.
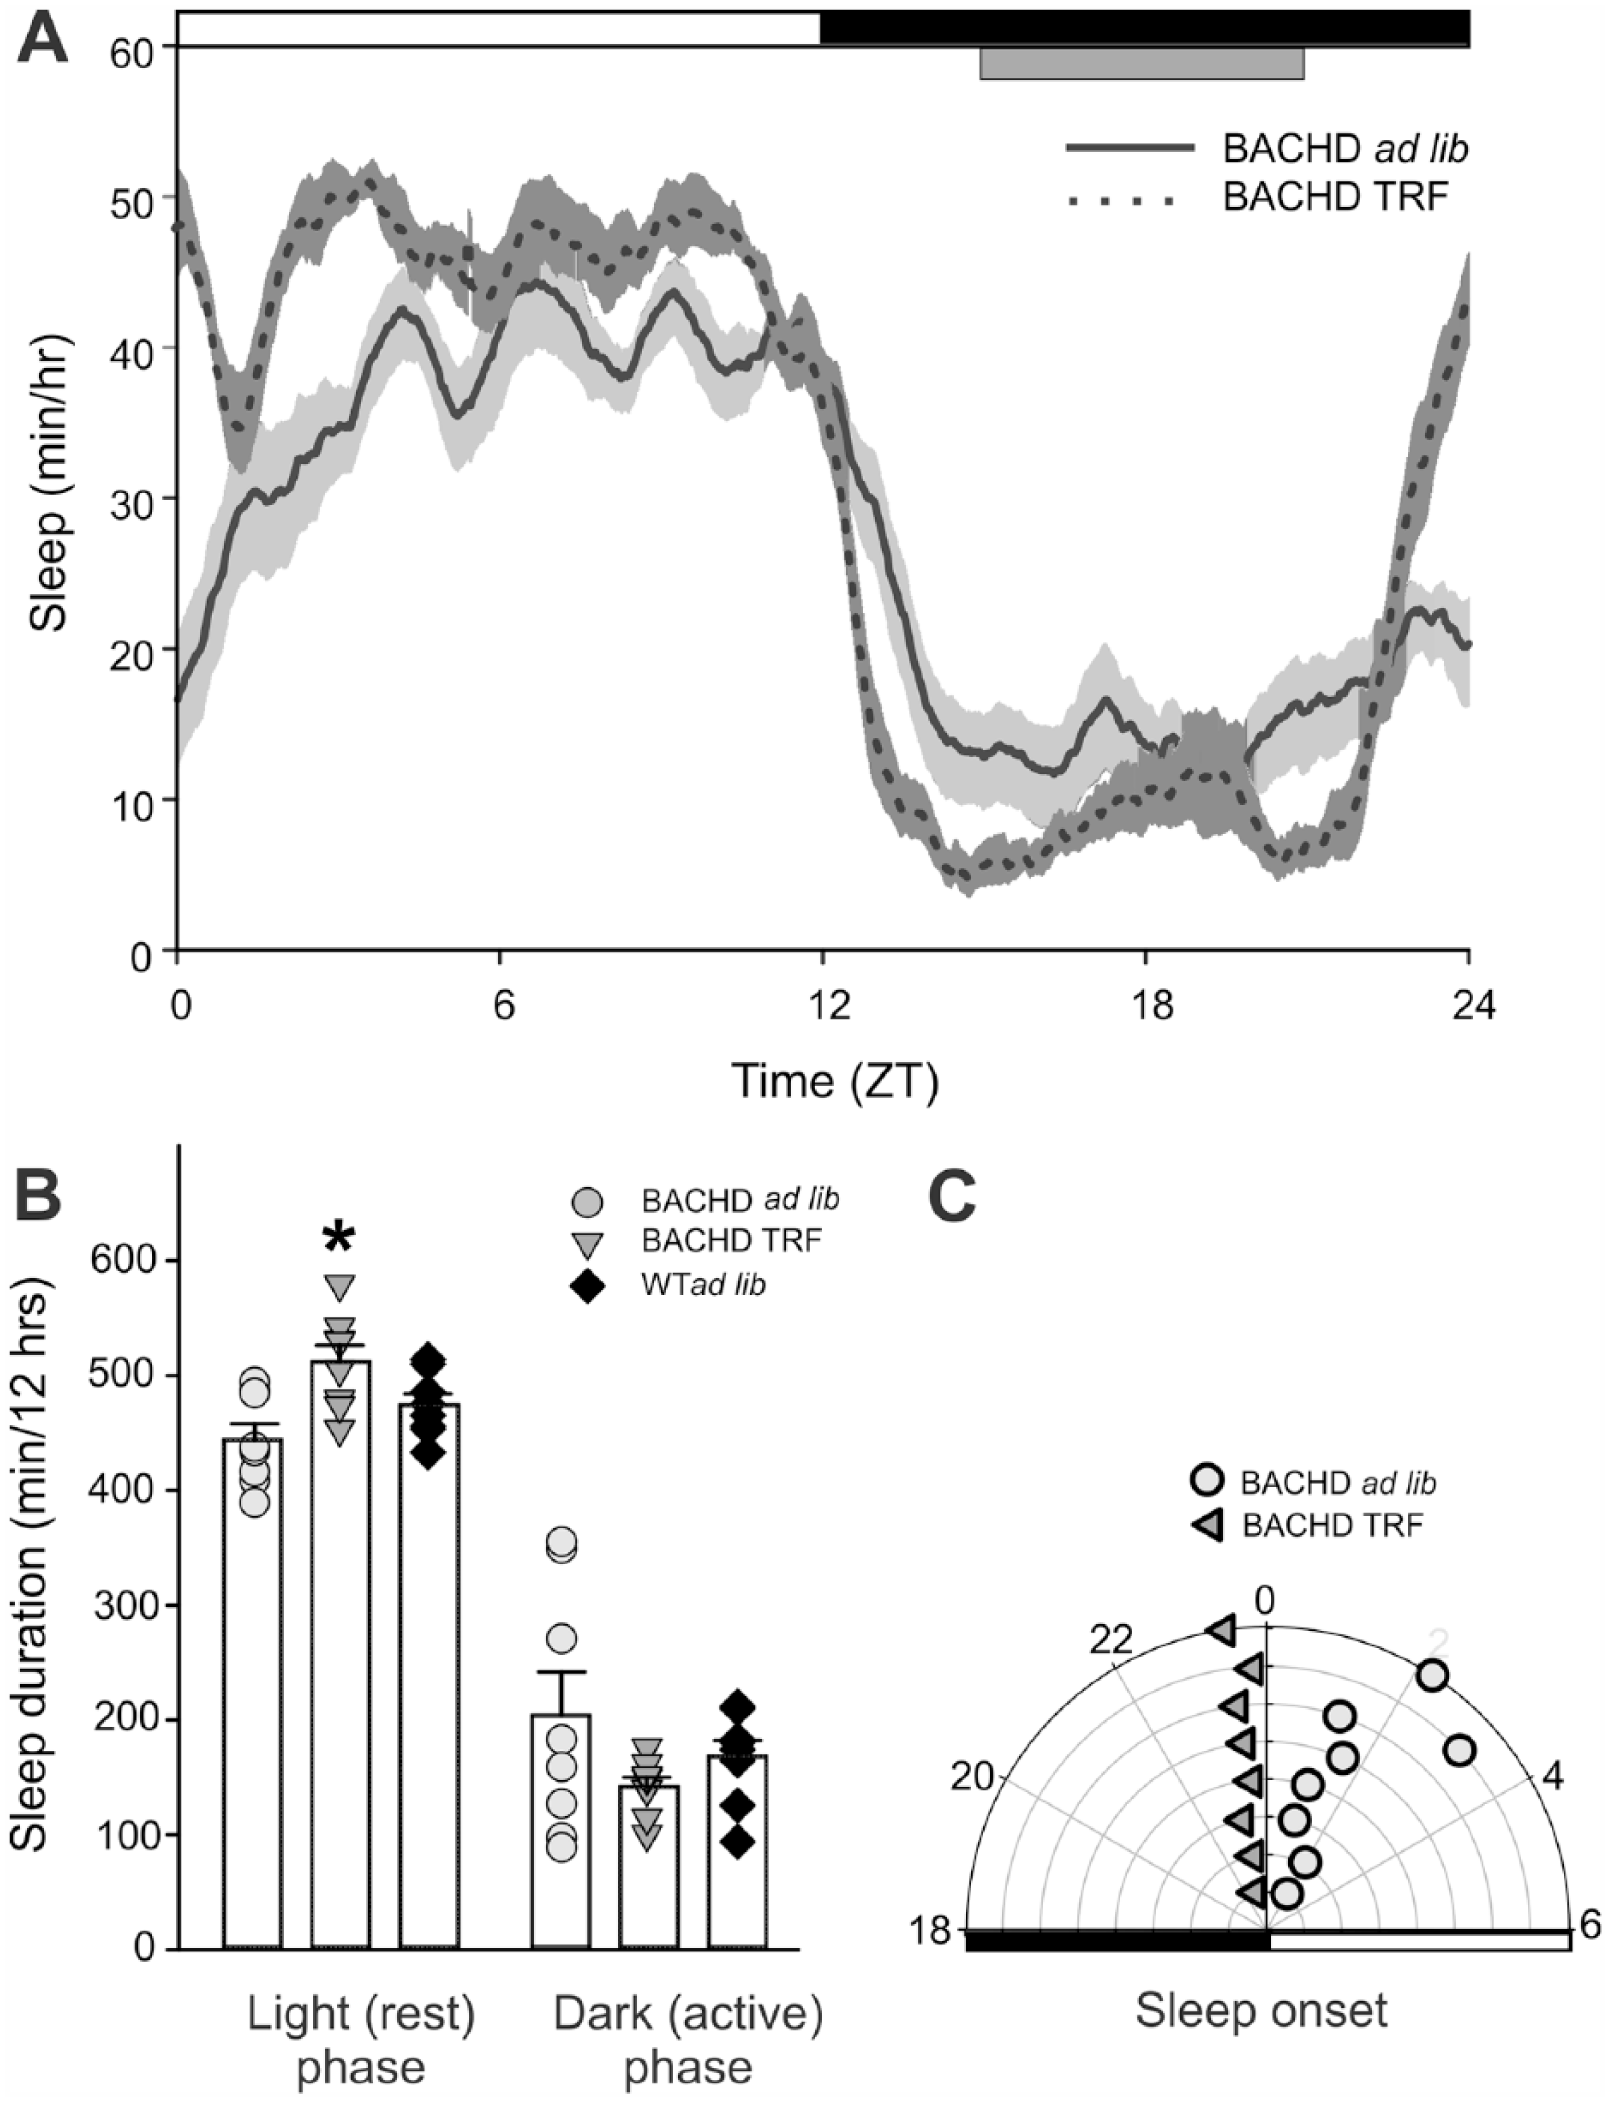
Sleep behavior was altered by the TRF protocol. Video recording in combination with automated mouse tracking analysis software was used to measure immobility-defined sleep (n = 8 per group). (A) Running averages of immobility-defined sleep in BACHD mutants with ad lib (solid line) and timed feeding (dotted line) are plotted. The white/black bar on the top of the waveforms indicates the 12:12 hr LD cycle. The grey bar on the top of waveforms indicates the time when food hopper is opened for TRF. (B) Quantification of the immobility-defined sleep in the light (rest) phase and dark (active) phase. Comparisons between BACHD cohorts were made using a t-test. Asterisks represent significant differences due to TRF regimen compared to ad lib controls (p < 0.05; n = 8 per group). (C) Radial plot showing the time of sleep onset for the ad lib feed group (circles) and the TRF group (triangles). The numbers show the phases (ZT) with ZT 0 showing the time of light-onset. TRF reduced the variability when the mutant mice initiated sleep.
TRF Improved Autonomic Outputs in the BACHD Mice
It has been shown that dysfunction in the circadian regulation of autonomic outputs can be detected early in disease progression in the BACHD mice (Kudo et al., 2011; Schroeder et al 2016). In the present study, we measured the impact of TRF on daily rhythms in HR, HRV, and CBT measured simultaneously in freely moving BACHD mice under ad lib and TRF (Fig. 3A-C). TRF-treated BACHD exhibited higher light (rest) phase HRV than the ad lib–fed BACHD group. (ad lib: 10.0 ± 0.6 msec; TRF: 12.7 ± 0.7 msec, t[6] = 2.672, p = 0.032, t test) as well as increased amplitude of the HRV rhythm (ad lib: 2.7 ± 0.1 msec; TRF: 5.9 ± 0.8 msec, t = 3.270, p = 0.005, t test). A 2-way ANOVA on the waveform confirmed a significant effect of time, F(23) = 7.471, p < 0.001, and treatment, F(1) = 53.362, p < 0.001, and an interaction (F = 6.478, p < 0.001). TRF-treated BACHD also exhibited increased amplitude (max-min) of the HR rhythm (ad lib: 95.0 ± 12.4 bpm; TRF: 196 ± 20.0 bpm, t = 8.081, P = 0.0002, t test). A 2-way RM ANOVA run on the waveform (1-h bins) confirmed significant effects of time, F(23) = 28.223, p < 0.001, and treatment, F(1) = 95.153, p < 0.001, and an interaction between the 2 factors (F = 6.768, p < 0.001). Finally, the daily 24-h averaged CBT was not significantly different between the 2 groups (ad lib: 36.4 ± 0.2 °C; TRF: 36.7 ± 0.1 °C; U = 5, p = 0.486, rank-sum test), nor did the TRF drive a change in amplitude (ad lib: 2.45 ± 0.15; TRF: 2.75 ± 0.15; t = 1.386, p = 0.215, t test). A 2-way RM ANOVA did find overall significant effects of time, F(23) = 36.0.29, p < 0.001, and treatment, F(1) = 21.321, p < 0.001, without an interaction between the 2 factors (F = 0.648, p = 0.887). Overall, the TRF regimen improved the daily rhythms in physiological, autonomically driven outputs with the most robust effect on HRV.
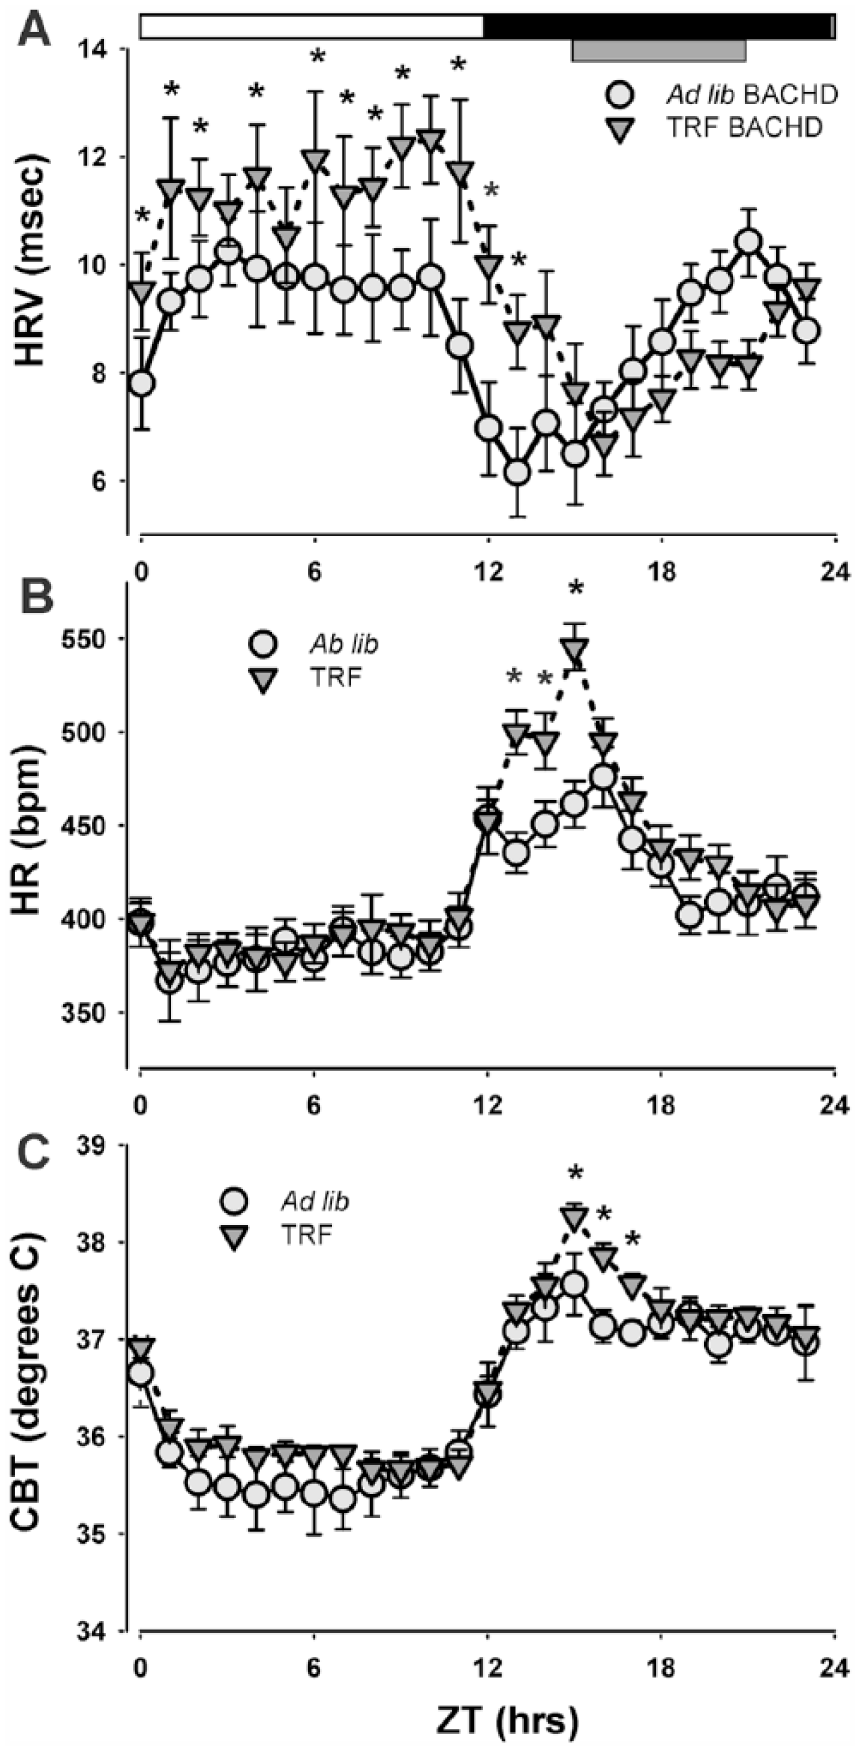
Autonomic output rhythms from BACHD mice were improved by the TRF regimen. (A, B, C) The autonomic outputs from ad lib (light grey circles) and TRF (dark grey triangles) BACHD mice were recorded simultaneously using a telemetry device. Hourly running averages of (A) heart rate variability (HRV), (B) heart rate (HR) and (C) core body temperature (CBT) from both groups are plotted. The temporal waveforms of autonomic outputs were analyzed using a 2-way RM ANOVA with time and treatment as factors. Asterisks represent significant differences due to TRF regimen compared to ad lib controls (p < 0.05, n = 7 per group).
TRF Shifted the Phase of PER2::LUC Rhythms in the BACHD Mice
Next, we used in vivo imaging of BACHD and WT PER2::LUC mice to examine the impact of the mutation on clock gene expression rhythms in 3 peripheral organs. These rhythms were measured at 6 months of age, and we observed robust daily rhythms in the liver, submandibular gland, and kidneys (Fig. 4A). We found no genotypic differences in the amplitude, phase, or goodness of fit for the rhythms measured in these 3 structures (Table 2). Next, the mice were placed on the TRF for 2 weeks (Fig. 4B). As analyzed by paired t test, the phase of the peak in the rhythm in the liver (t = 13.402, p = 0.000179), kidney (t = 12.996, p = 0.000202), and submandibular gland (t = 7.292, p = 0.00188) were all phase shifted (Fig. 4E). In contrast, TRF had no measurable impact on the amplitude of the rhythms (liver: t = 0.263, p = 0.805; kidney: t = 0.0261, p = 0.980; submandibular gland: t = 0.234, p = 0.827; Fig. 4F). 2-way ANOVA with genotype and treatment as factors found significant effects of both factors for the liver and kidney (Table 2).
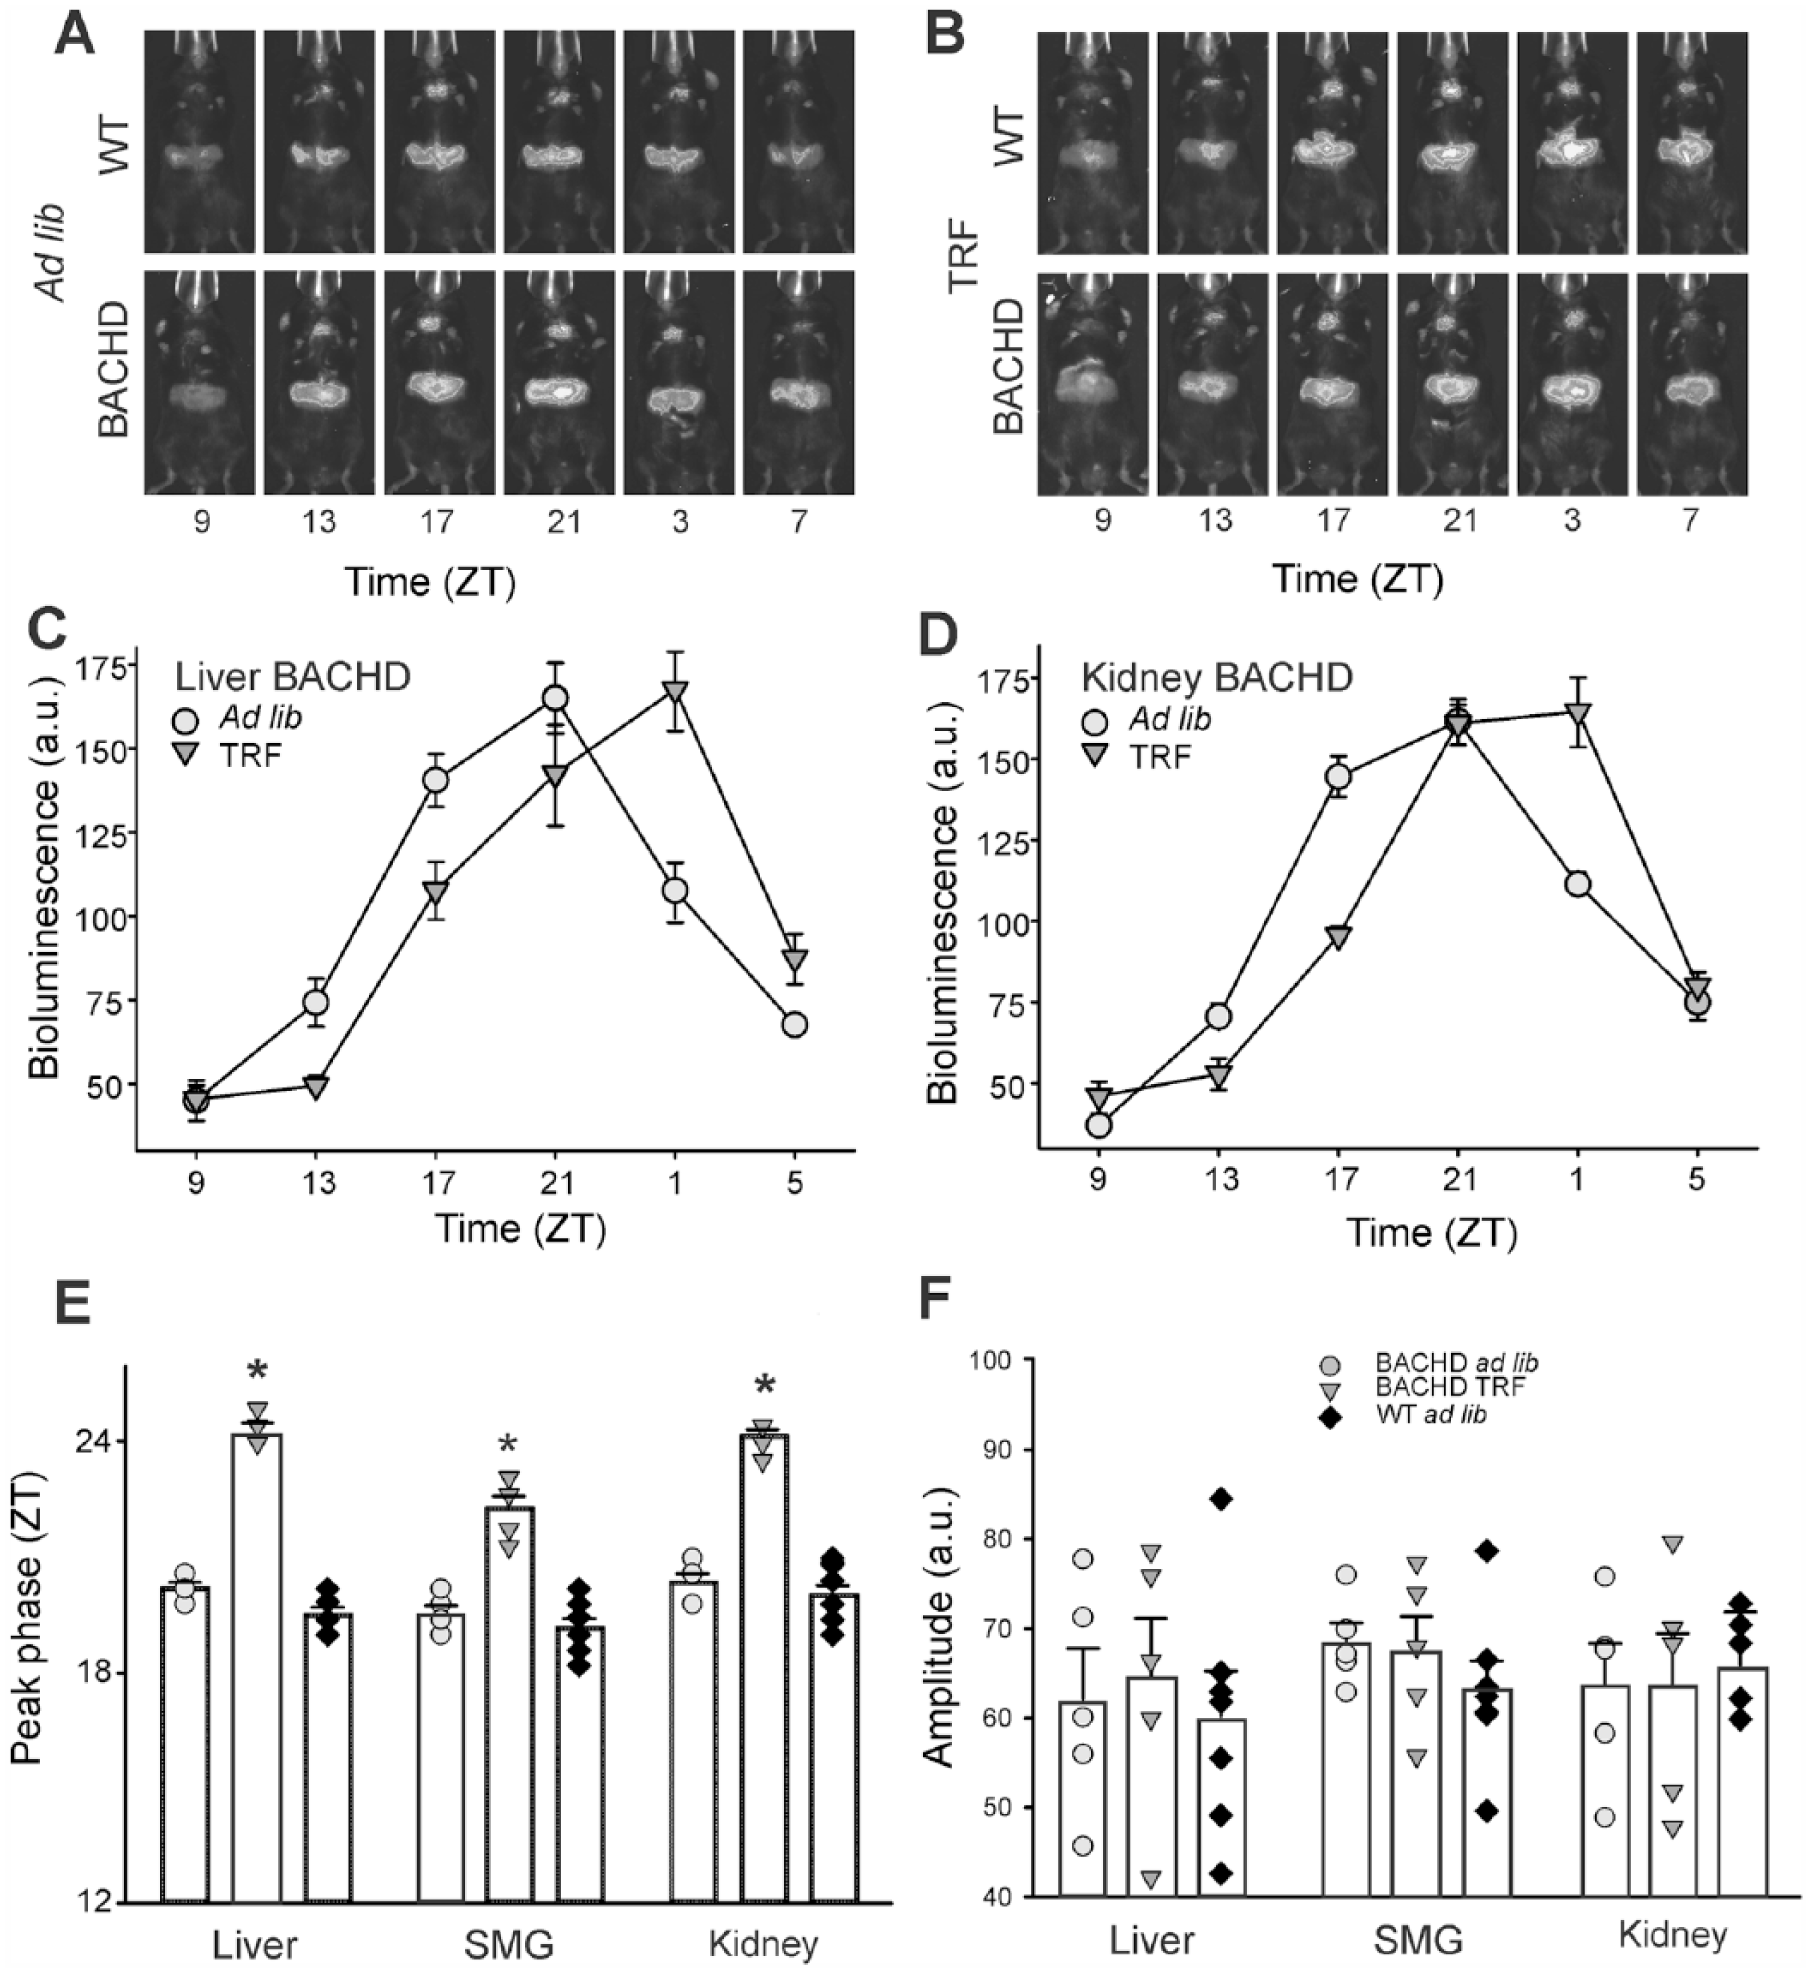
TRF alters the peak phase, but not the amplitude, of the PER2::LUC rhythms measured in peripheral organs in vivo. Representative examples of in vivo imaging performed to measure bioluminescence from the liver and submandibular gland under (A) ad lib and (B) TRF conditions. Average bioluminescent measurements at each time point (mean ± SEM) are shown for the (C) liver and (D) kidney. (E) The peak phase of the rhythm was shifted by the TRF protocol. (F) The amplitude of the rhythms was not altered. Circles are used to indicate data from the ad lib controls while triangles represent data from the TRF group. The vertical bar plots show group means and SEM. The symbols show the values from individual animals in each group (BACHD ad lib, circles; BACHD TRF, triangles, WT ad lib, diamonds). Asterisks represent significant differences due to TRF regimen compared to BACHD ad lib controls (paired t-tests, p < 0.05, n = 5 BACHD and n = 7 BACHD).
TRF alters the peak phase but not the amplitude of the PER2::LUC rhythms measured in peripheral organs in the intact animal.
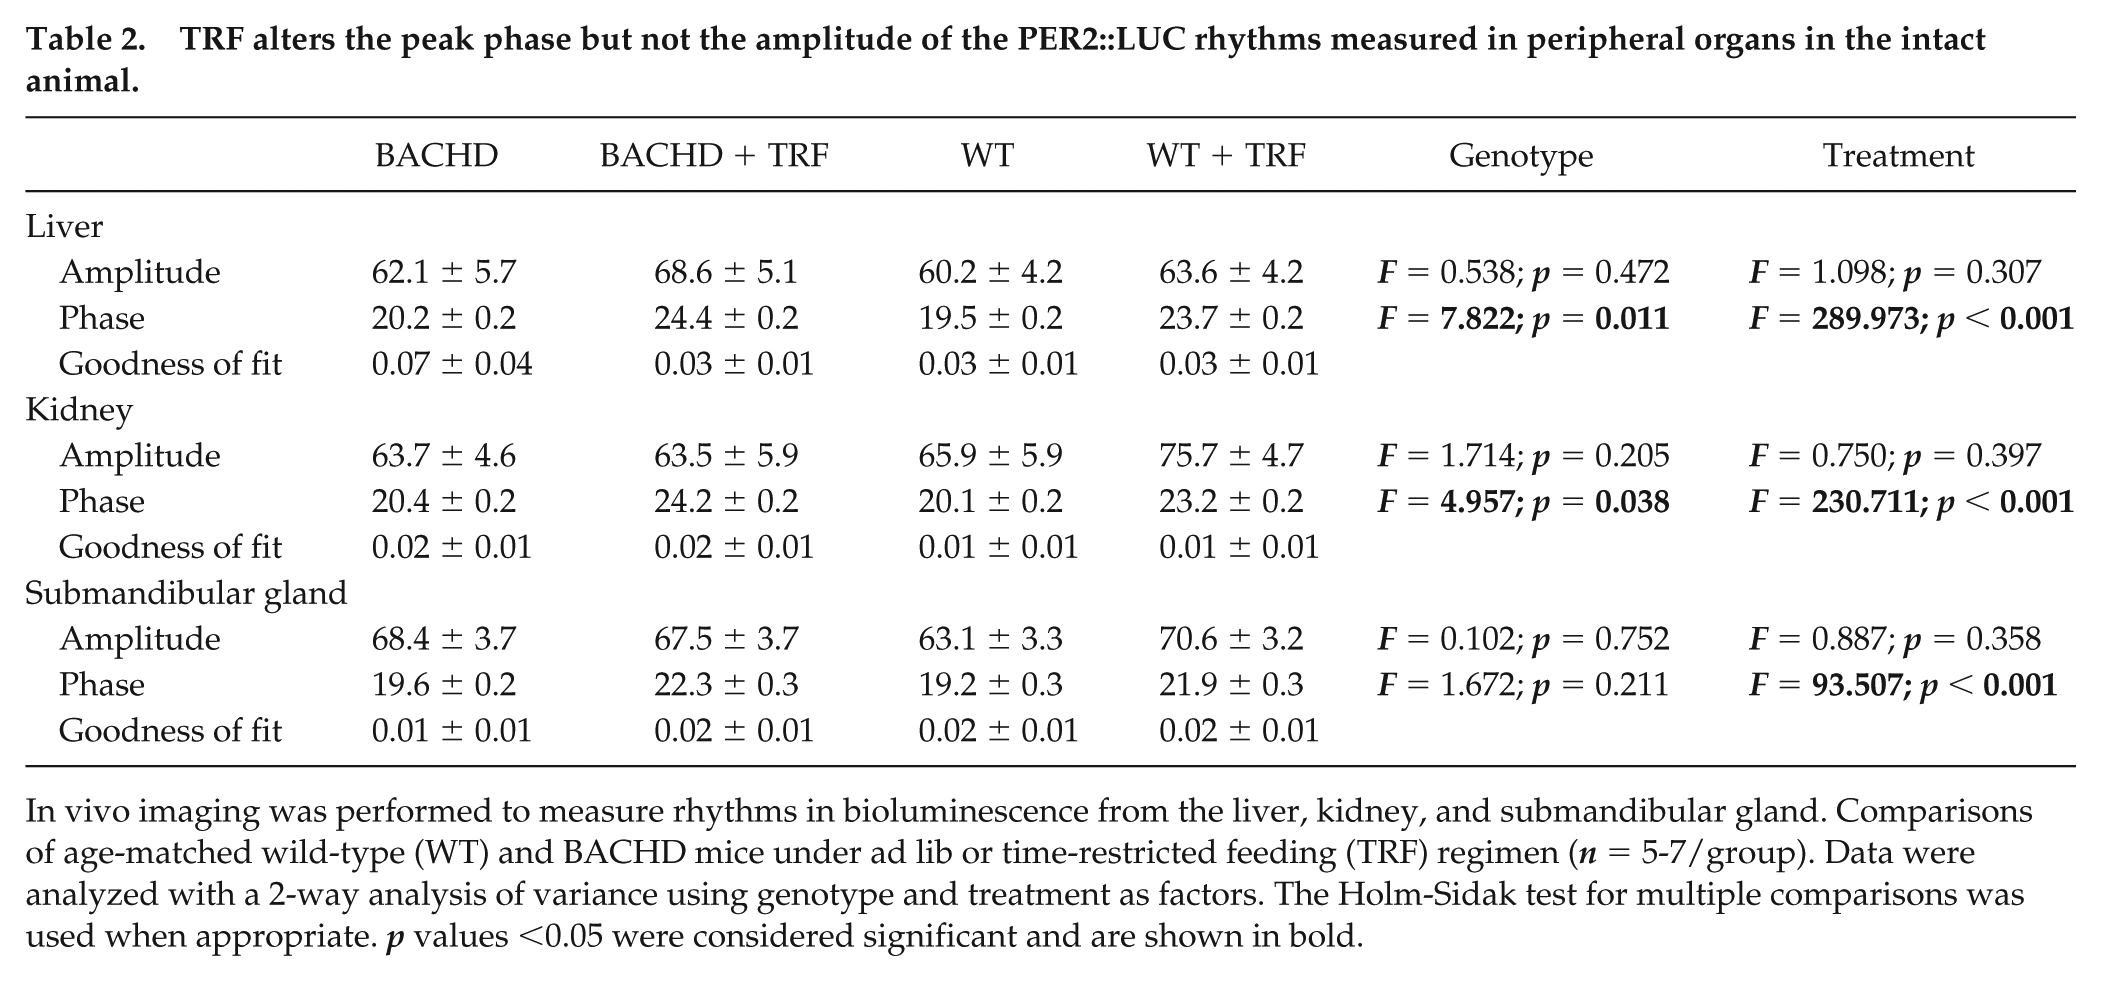
In vivo imaging was performed to measure rhythms in bioluminescence from the liver, kidney, and submandibular gland. Comparisons of age-matched wild-type (WT) and BACHD mice under ad lib or time-restricted feeding (TRF) regimen (n = 5-7/group). Data were analyzed with a 2-way analysis of variance using genotype and treatment as factors. The Holm-Sidak test for multiple comparisons was used when appropriate. p values <0.05 were considered significant and are shown in bold.
The in vivo imaging does not allow us to measure bioluminescence rhythms from all structures, so we turned to in vitro measurements of PER2::LUC in the SCN, liver, and heart. Again, we observed robust daily rhythms from all 3 regions and found no genotypic differences in the amplitude, phase, or goodness of fit for the rhythms measured in these 3 structures (Table 3). The amplitude of the rhythm measured from the SCN was reduced in the BACHD, but this effect was not significant. We found no significant impact of TRF on the amplitude or phase of the rhythms measured in the SCN. The peak and amplitude of the PER2::LUC rhythm in the heart were altered by TRF. Overall, our data indicated that the BACHD still had robust PER2:LUC rhythms and TRF modified the phase of these rhythms.
TRF alters some aspects of the PER2::LUC rhythms measured in culture in a tissue-specific manner.
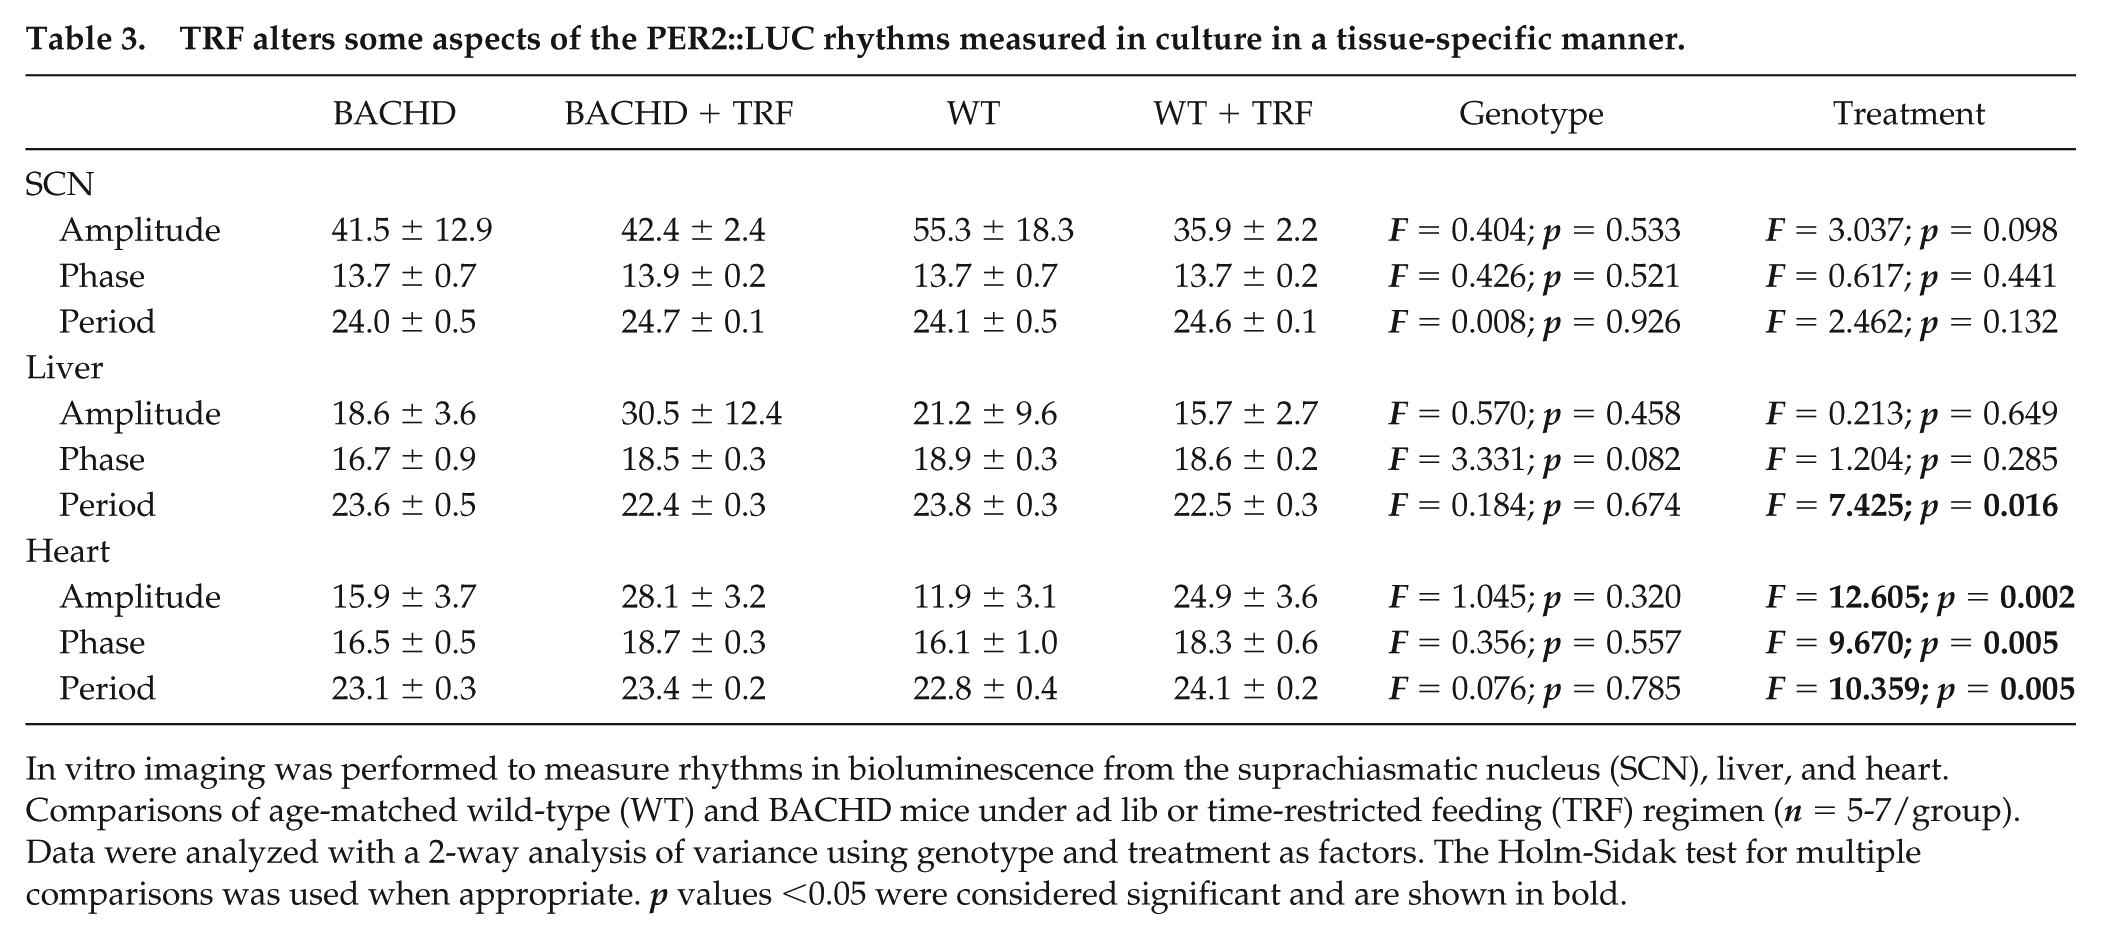
In vitro imaging was performed to measure rhythms in bioluminescence from the suprachiasmatic nucleus (SCN), liver, and heart. Comparisons of age-matched wild-type (WT) and BACHD mice under ad lib or time-restricted feeding (TRF) regimen (n = 5-7/group). Data were analyzed with a 2-way analysis of variance using genotype and treatment as factors. The Holm-Sidak test for multiple comparisons was used when appropriate. p values <0.05 were considered significant and are shown in bold.
TRF Improved Motor Function in the BACHD Mice
The defining symptoms of HD are centered on motor dysfunction; thus, we hypothesized that TRF would also improve motor performance in the BACHD model. Motor performance in the BACHD was assessed using 2 well-defined tests: the accelerating rotarod and the challenging beam tests (Fig. 5A-C; Table 4). BACHD mice on TRF exhibited a longer latency to fall, t(14) = 3.557, p = 0.003 (t test) off the rotarod and made significantly fewer errors, t(14) = 3.139, p = 0.007 (t test), on the challenging beam compared with ad lib–fed mutants. We also analyzed the number of errors on each beam. A 2-way ANOVA found overall significant effects of beam, F(3) = 54.499, p < 0.001, and treatment, F(1) = 32.910, p < 0.001, without an interaction between the 2 factors (F = 2.191, p = 0.099). Multiple-comparison procedures (Holm-Sidak method) found significant reduction in errors in all but the easiest beam (Fig. 5C). Finally, we found that the power of the rhythms of the individual mice under TRF was negatively correlated with their errors in the challenging beam (Pearson correlation: −0.722, p = 0.043) and positively correlated with the latency on the rotarod (Pearson correlation: 0.743, p = 0.035). In contrast, untreated mutant mice exhibited no correlation between power and errors (Pearson correlation: −0.040, p = 0.925) or latency (Pearson correlation: 0.456, p = 0.256). A comparison of the same mutant animals before (3 months) and after (6 months) treatment indicated that there was no decline in performance in latency on rotarod, t(7) = −0.283, p = 0.785 (paired t test), or in errors in challenge beam, t(7) = −1.268, p = 0.245 (paired t test). Thus, the BACHD mice exhibited no age-related decline in motor performance while they were on the treatment schedule. Overall, a key finding of this study is that 2 distinct measures of motor performance (challenging beam and rotarod) in the BACHD model were improved by TRF.
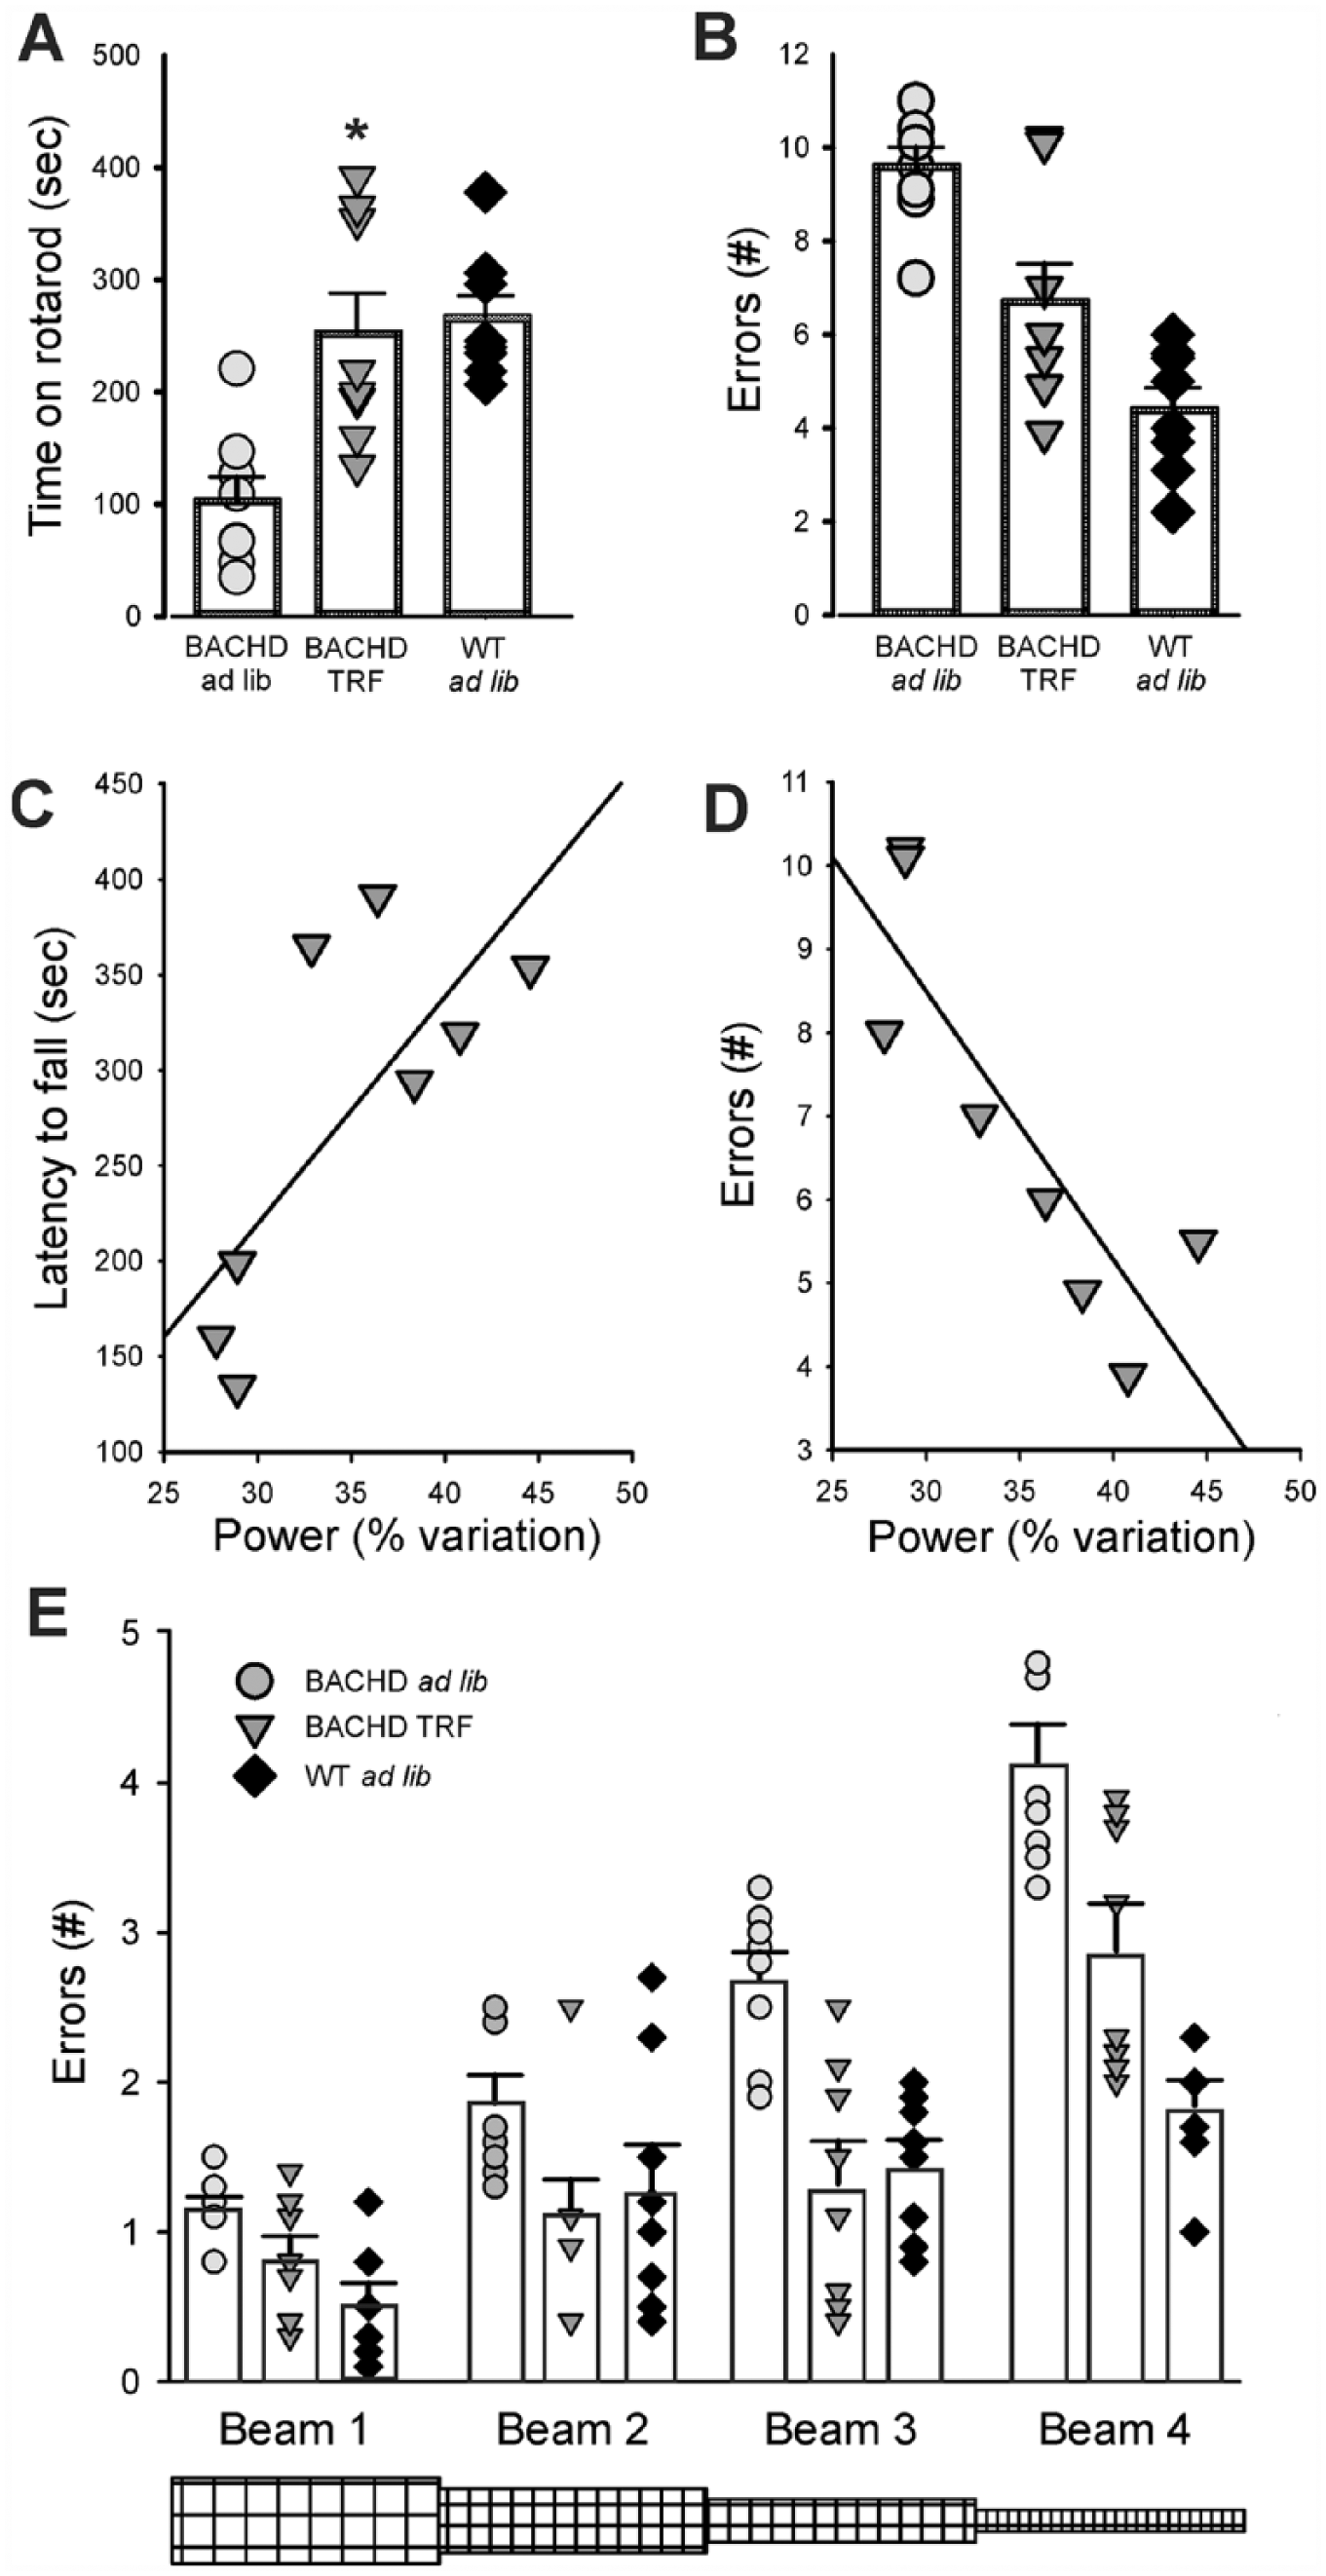
TRF improved motor performance in the BACHD model. (A) The accelerating rotarod test revealed that the TRF treatment improved motor performance by showing longer latency to fall. Comparisons between the BACHD cohorts were made using a t-test. (B) The challenging beam motor test indicated that the TRF treatment improved performance signified by mice making fewer errors when crossing the beam. Asterisks represent significant differences due to TRF regimen compared to ad lib controls (paired t-tests, p < 0.05, n = 8 per group). (C, D) Correlations between the power of the rhythms and motor performance were evaluated using Pearson correlations. Power of the individual mice under TRF was negatively correlated with their errors in the challenging beam (Pearson Correlation: -0.722, p = 0.043) and positively correlated with the latency on the rotarod (Pearson Correlation: 0.743, p = 0.035). (E) Analysis of the performance of the BACHD mice on each beam of the challenging beam indicated that the TRF improved performance on the three more difficult of the four beams. Comparisons between BACHD cohorts were made using a 2-way ANOVA with beam and treatment as factors. Asterisks represent significant differences due to TRF regimen compared to BACHD ad lib controls (p < 0.05, n = 8 per group).
TRF improved motor performance in the BACHD model.
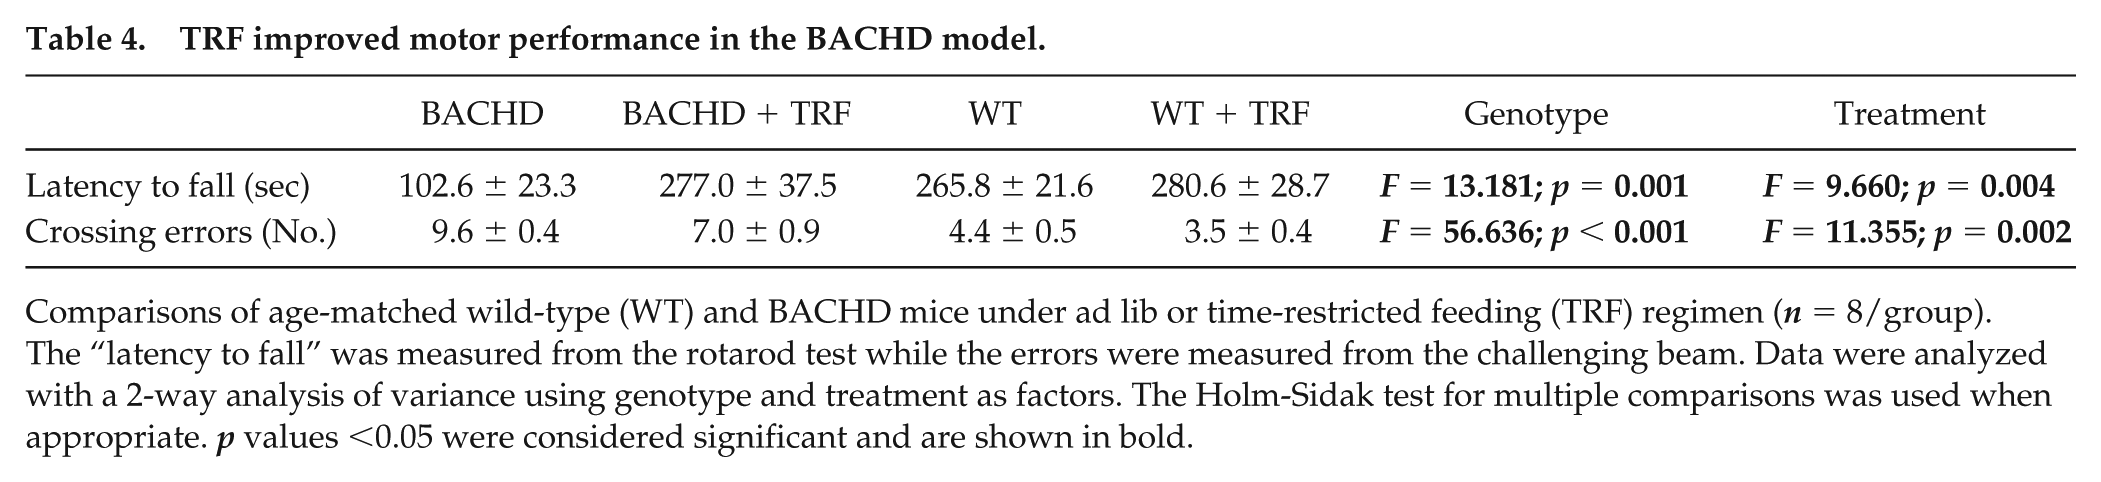
Comparisons of age-matched wild-type (WT) and BACHD mice under ad lib or time-restricted feeding (TRF) regimen (n = 8/group). The “latency to fall” was measured from the rotarod test while the errors were measured from the challenging beam. Data were analyzed with a 2-way analysis of variance using genotype and treatment as factors. The Holm-Sidak test for multiple comparisons was used when appropriate. p values <0.05 were considered significant and are shown in bold.
Discussion
The present study demonstrates that TRF can ameliorate a range of symptoms relative to HD and related neurodegenerative disorders. Using the BACHD mouse model of HD, we demonstrate that TRF boosts the amplitude and reduces variability in activity rhythms. The temporal patterning of both sleep behavior and sleep fragmentation were improved by the scheduled feeding. Physiologically, TRF increased the HRV during the sleep time and altered the diurnal rhythm in HR but had minimal impact on CBT. On a molecular level, the BACHD still exhibited robust peripheral PER2:LUC rhythms and TRF modified the phase, but not the amplitude, of the rhythms. Finally, a key finding of this study is that 2 distinct measures of motor performance (challenging beam and rotarod) in the BACHD model were improved by TRF. Thus, the scheduled feeding protocol successfully improved several behavioral and physiological parameters that have been shown to be compromised in HD.
There is a substantial body of literature demonstrating that rats and mice display food anticipatory behavior (FAA) characterized by increased arousal and activity immediately prior to the time of scheduled feeding (Mistlberger, 1994; Stephan, 2002). The FAA does not depend on an intact SCN (Krieger et al., 1977; Phillips and Mikulka, 1979; Angeles-Castellanos et al., 2010), and thus, we reasoned that feeding schedules could be particularly useful when a disease process compromises the functioning of the central clock. In the present study, the BACHD mice were allowed access to their food (standard chow, 6 h) nightly for 3 months starting at an age coinciding with the onset of motor symptoms. We provided the food between ZT 15 and 21 to maximize activity in the beginning of the night. We confirmed that the animals consumed similar amounts of food and the body weights were not significantly decreased by this feeding regimen. We demonstrate that the nightly TRF regimen improved the daily activity rhythm with enhancement in the rhythmic strength as measured by power of the periodogram and a decrement in the cycle-to-cycle variability in activity onset (Fig. 1). The amount of inappropriate activity during the light (rest) phase was also reduced. The power, precision, and percentage of activity during the dark (active) phase were improved approaching WT levels. However, the overall activity levels were not different between the treated and untreated BACHD groups, and both cohorts exhibited significantly lower activity compared with WT (Table 1). Prior work using scheduled feeding protocols also improved locomotor activity rhythms in the Q175 (Wang et al., 2018) and R6/2 (Skillings et al., 2014) mouse models of HD. These improvements in the locomotor activity rhythms under TRF could be driven by the nightly acute effects of FAA with its still unknown anatomical loci or through an enhancement of SCN-driven outputs.
The benefits of the TRF protocol were not limited to this transient arousal prior to feeding in the dark phase. In this work, we used a video analysis of sleep behavior that allows us to measure the temporal patterning of sleep as well as sleep fragmentation but does not allow identification of sleep stages. Both the amount of sleep during the light phase and the precision of sleep onset were improved while the fragmentation of light phase sleep was reduced by TRF (Fig. 2; Table 1). To our knowledge, this is the first demonstration that TRF can improve sleep parameters in mice, although earlier work has shown that feeding mice during their normal rest phase can disrupt sleep patterns (Szentirmai et al., 2010). There has been a report in Drosophila that TRF can improve sleep behavior (Gill et al., 2015). Variability in sleep onset has been associated with decreased academic performance and reduced white matter in humans (Telzer et al., 2015; Fuligni et al., 2018); thus, improvements in precision of sleep onset are an important target for therapeutic interventions. These improvements to sleep behavior occurred during the light phase (ZT 0-12) several hours after the feeding time (ZT 15-21) and could not be due to acute increase in arousal due to FAA mechanisms alone. Prior work with the R6/2 (Kantor et al., 2013; Fisher et al., 2013) and Q175 (Fisher et al., 2016) mouse HD models has provided evidence of dysfunction in EEG-defined sleep, including increases in sleep fragmentation as well as characteristic changes in the EEG spectral profiles. The total amount of non–rapid eye movement (NREM) and rapid eye movement (REM) sleep over 24 h as well as homeostatic responses to sleep loss were not affected by the mutation (Fisher et al., 2016). In the R6/2 model, these HD-evoked changes in the EEG responded to treatment with either a serotonin uptake inhibitor (paroxetine; Kantor et al., 2017) or a hypnotic (zolpidem; Kantor et al., 2016). The circuits responsible for REM and NREM sleep are centered in the basal forebrain, lateral hypothalamus, and brainstem (Weber and Dan, 2016; Saper and Fuller, 2017; Scammell et al., 2017). Pathology in these regions could contribute to the sleep fragmentation seen in HD. In addition, given the well-established dysfunction in the basal ganglia circuits in HD patients and animal models, deficits in these circuits could be the site of action for some of the sleep deficits. There is a variety of evidence indicating that dopamine signaling within the striatum and the external globus pallidus (GPe) plays an important role in suppressing movements during sleep, and dysfunction in these pathways has been implicated in restless leg syndrome (e.g., Jones and Cavanna, 2013; Guo et al., 2017) and REM sleep disorder (e.g., Arnulf, 2012; Rolinski et al., 2016). Neurons in the GPe exhibit alterations in GABA-mediated synaptic transmission in the R6/1 HD mouse model (Du et al., 2016), and deep-brain stimulation of this same region promotes sleep (Qiu et al., 2016a, 2016b). Dopamine is a rhythmically regulated neurotransmitter (e.g., Mendoza and Challet, 2014), and the impact of feeding schedules on activity appears to be mediated by D1 receptors in the striatum (Gallardo et al., 2014). Therefore, we speculate that TRF modulation of dopamine levels could underlie the improvements that we observed in sleep behavior in the present study. Given the body of prior work that suggests a critical role for sleep in motor learning (e.g., Walker et al., 2002; Backhaus et al., 2015), the improvements in sleep that we observed could drive improvements in motor performance.
The data in this study indicate that TRF can affect autonomically driven parameters, with the most striking impact on HRV (Fig. 3). HRV measures the variation in the beat-to-beat (R-R) interval and reflects the dynamic balance of sympathetic and parasympathetic control of heart function. Reduced HRV is generally considered an indication of poor cardiovascular health and a predictor for cardiovascular disease and mortality (e.g., Kemp et al., 2017). Prior work demonstrated that the BACHD mice exhibit a loss of circadian control in HRV day/night differences as well as an overall decrease in HRV over a 24-h period when compared with WT controls (Schroeder et al., 2016). We have now shown that TRF increases HRV in both the Q175 (Wang et al., 2018) and the BACHD models (present study). Importantly, reduced HRV has also been reported in HD patients beginning during the presymptomatic stage of disease progression (Andrich et al., 2002; Aziz et al., 2010; Bellosta Diago et al., 2017), and cardiovascular events are a major cause of early death in the HD population (Lanska et al., 1988; Sørensen and Fenger 1992). In Drosophila, TRF reduces age-related decline in cardiovascular function through a mechanism that is dependent on circadian clock genes (Melkani and Panda, 2017). Together, this work suggests that TRF can reduce cardiovascular dysfunction, and at least in Drosophila, feeding schedules can boost the amplitude and perhaps the phasing of the molecular clockwork.
The BACHD mouse model shows alterations in the temporal patterning of neural activity recorded in the SCN (Kudo et al., 2011; Kuljis et al., 2016). The weakening of the electrical output of the SCN would be expected to affect the phase of peripheral molecular clocks that are driven by the SCN. For example, in aging mice, there are parallel reductions in SCN neural activity (Nakamura et al., 2011; Farajnia et al., 2012) and shifts in the phase of at least some extra-SCN molecular clockwork (Nakamura et al., 2011; Sellix et al., 2012; Nakamura et al., 2015; Tahara et al., 2017). In the R6/2 model of HD, circadian rhythms of PER2 bioluminescence were normal in the SCN but phase advanced in the liver (Maywood et al., 2010). Prior work examining PER2 rhythms in the liver found that TRF (8/16 feed/fast cycle) increased the amplitude (Hatori et al., 2012) but not the phase (Hirao et al., 2010) of the gene expression rhythms in WT mice. Based on these data, we anticipated that we would see phase shifts in the peripheral oscillations as measured by PER2::LUC, whereas the SCN rhythm in clock gene expression would not show genotypic differences (Kudo et al., 2011). Unexpectedly, we did not see any evidence for genotypic differences between the clock gene expression in WT and BACHD mice (Fig. 4; Table 3). The TRF protocol shifted the phase of the rhythm in the heart but not in the SCN. This shift in phase fits with a variety of prior work showing that feeding schedules can shift the phase of clock gene expression rhythms throughout the body, including in limbic structures involved in motivation and reward (Angeles-Castellanos et al., 2007; Waddington Lamont et al., 2007) as well as in the striatum (Akiyama et al., 2004). The amplitude of the rhythms in PER2 expression in the heart, but not the liver, was increased by treatment. One of the limitations of these experiments is that we relied exclusively on the PER2::LUC reporter and perhaps other clock genes could have shown the anticipated increase in amplitude driven by TRF.
HD is defined as a movement disorder, as the most striking and debilitating symptoms of this disease include motor deficits and loss of neurons in the striatum. Critically, the TRF regimen dramatically improved performance of the HD mutant mice on 2 different motor tests (Fig. 5). The beneficial impact of TRF on motor performance could be dependent on or independent from the improvements in circadian output. We examined this issue by taking advantage of the animal-to-animal variation in the impact of the treatment on circadian and motor function. Using our most sensitive motor assay (i.e., challenging beam test), we found that the improved circadian behavior was negatively correlated with number of errors in the TRF group (coefficient = −0.722, p = 0.043). This finding leads us to suggest that improved circadian timing underlies the improved motor function in the treated mice. Prior work has shown that scheduled feeding can improve motor function in the Q175 (Wang et al., 2018) and exploratory behavior in the open field (Skillings et al., 2014) in the R6/2 HD models. Furthermore, mice challenged with a high-fat diet or other nutritional perturbations perform significantly better on the rotarod under TRF (Hatori et al., 2012; Chaix et al., 2014). Varieties of different approaches aiming to boost circadian output improve motor functions in different HD mouse models. There is evidence that improving the sleep-wake cycle with sleep-inducing drugs (Pallier et al., 2007; Kantor et al., 2016), stimulants (Cuesta et al., 2012; Whittaker et al., 2017), bright light and restricted wheel access (Cuesta et al., 2014), enhanced blue light (Wang et al., 2017), and scheduled feeding (Wang et al., 2018) can improve HD symptoms. This body of work supports the general hypothesis (Morton, 2013; Schroeder and Colwell, 2013; van Wamelen et al., 2015; Longo and Panda 2016) that circadian-based therapies can alter the trajectory of a genetically determined disease.
Supplemental Material
Supplemental_Figure_1 – Supplemental material for Circadian-based Treatment Strategy Effective in the BACHD Mouse Model of Huntington’s Disease
Supplemental material, Supplemental_Figure_1 for Circadian-based Treatment Strategy Effective in the BACHD Mouse Model of Huntington’s Disease by Daniel S. Whittaker, Dawn H. Loh, Huei-Bin Wang, Yu Tahara, Dika Kuljis, Tamara Cutler, Cristina A. Ghiani, Shigenobu Shibata, Gene D. Block and Christopher S. Colwell in Journal of Biological Rhythms
Footnotes
References
Supplementary Material
Please find the following supplemental material available below.
For Open Access articles published under a Creative Commons License, all supplemental material carries the same license as the article it is associated with.
For non-Open Access articles published, all supplemental material carries a non-exclusive license, and permission requests for re-use of supplemental material or any part of supplemental material shall be sent directly to the copyright owner as specified in the copyright notice associated with the article.