
Abstract
The circadian clock orchestrates gene expression rhythms. Regulation at the level of gene transcription is essential for molecular and cellular rhythms. Pol II pause release is a critical step of transcription regulation. However, whether and how Pol II pause release is regulated during daily transcription have not been characterized. In this study, we performed Pol II ChIP-seq across the day in the mouse liver and quantitatively analyzed binding signals within the transcription start site (TSS) region and the gene body. We frequently found discordant changes between Pol II near the TSS ([Pol II]TSS, paused Pol II) and that within the gene body ([Pol II]GB, transcribing Pol II) across the genome, with only [Pol II]GB always reflecting transcription of clock and clock-controlled genes. Accordingly, Pol II traveling ratios of more than 7000 genes showed significant daily changes (>1.5-fold). Therefore, there is widespread regulation of Pol II pausing in the mouse liver. Interestingly, gene transcription rhythms exhibited a bimodal phase distribution. The transcription of ~400 genes peaked near ZT0, coincident with a genome-wide increase in [Pol II]TSS and traveling ratio (TR). The transcription of ~300 other genes peaked ~12 h later, when there was a global decrease in [Pol II]TSS and TR. ChIP-seq against TATA-binding protein (Tbp), a preinitiation complex (PIC) component, revealed that Pol II recruitment mainly played an indirect role in transcriptional output, with transcriptional termination and pause release functioning prominently in determining the fate of initiated Pol II and its pausing status. Taken together, our results revealed a critical, albeit complex role of Pol II pausing control in regulating the temporal output of gene transcription.
The circadian clock plays an essential role in orchestrating daily rhythms in physiology and behavior. With the identification of clock genes, some of which are transcription factors, the molecular basis of circadian timing is being revealed (Koike et al., 2012). Rhythmic transcription is critical for clock oscillation and for the control of cellular processes via rhythmic gene expression (Koike et al., 2012; Le Martelot et al., 2012; Menet et al., 2012; Montenegro-Montero and Larrondo, 2016). Transcription is regulated at distinct steps, including Pol II recruitment, initiation, pause release, transcription elongation, and termination (Fuda et al., 2009). Despite current knowledge about the molecular clock, the relative roles of these steps in the daily regulation of transcription are not well characterized.
Pol II pause release is thought to be a key control step of transcription (Adelman and Lis, 2012; Jonkers and Lis, 2015). After the preinitiation complex (PIC) assembles at the promoter, the basal transcription factor TFII H unwinds dsDNA to facilitate transcription initiation (Kim et al., 2000). The C-terminal domain (CTD) of Pol II is phosphorylated at Ser5 by the Cdk7 subunit of TFII H to facilitate the recruitment of the mRNA capping enzyme (Phatnani and Greenleaf, 2006). Cdk7 also phosphorylates and displaces TFII E (and possibly other proteins), allowing the binding of DSIF (DRB sensitivity-inducing factor, consisting of Spt4&5) and NELF (negative elongation factor, consisting of NELF-A to E) complexes to initiated Pol II (Larochelle et al., 2012; Nilson et al., 2015). While DSIF tethers Pol II at transcription start site (TSS)–proximal regions, NELF binds to both Pol II and the nascent RNA (Yamaguchi et al., 2013). These 2 complexes, together with other factors, enable a transcriptional state termed pausing, where engaged Pol II is prevented from productive elongation (Adelman and Lis, 2012; Jonkers and Lis, 2015). While paused Pol II can be removed via transcription termination (at the 5′-end of genes) or released into elongation, it is relatively stable, leading to apparent Pol II accumulation near the TSS (Core et al., 2012; Jonkers et al., 2014). Disruption of DSIF or NELF does not abolish pausing but affects transcriptional output (Rahl et al., 2010). The +1 nucleosome, a barrier to Pol II, is another player in Pol II pausing. The chromatin remodeler Chd1 is required for efficient +1 nucleosome turnover when paused Pol II is released into elongation (Skene et al., 2014).
The release of paused Pol II into productive elongation requires P-TEFb (Cdk9/Cyclin T), which is usually sequestered in the 7SK snRNP (small nuclear ribonucleoprotein) complex and tethered at the TSS-proximal region (Yang et al., 2001; Ghamari et al., 2013; Ji et al., 2013; McNamara et al., 2016). When released from the 7SK snRNP, P-TEFb becomes active and can be associated with other proteins (e.g., c-Myc) (Rahl et al., 2010). The active P-TEFb phosphorylates NELF-E via Cdk9, causing the release of NELF from Pol II. It also phosphorylates Spt5, converting DSIF into an activator of Pol II elongation (Peterlin and Price, 2006). Cdk9 promotes the recruitment of PAF1 complex and Cdk12, the Ser2 kinase of elongating Pol II (Bartkowiak et al., 2010; Yu et al., 2015). Given the association of Chd1 with elongation factors (i.e., FACT, PAF1C, and Spt5) (Skene et al., 2014), pause release can dissociate the NELF complex and promote the turnover of the +1 nucleosome at the same time. Inhibiting P-TEFb/Cdk9 mainly blocks pause release, while inhibiting Cdk12 (and Cdk13) preferentially affects Pol II elongation in certain genes (Jonkers et al., 2014; Zhang et al., 2016).
Previous studies hinted at a role for Pol II pausing in clock transcriptional oscillations. In Aplysia, acute application of the Cdk9 inhibitor DRB phase-shifts the clock, while its chronic treatment lengthens period (Raju et al., 1991). In mice, Cdk9 is associated with clock proteins (Padmanabhan et al., 2012). Pol II elongation is accompanied by H2A.Z incorporation into the +1 nucleosome (Weber et al., 2014), an event undergoing daily changes in the mouse liver (Menet et al., 2014). An RNAi screen revealed that knockdown of genes involved in pausing control alters clock properties in U2OS cells (Zhang et al., 2009). Despite this indirect evidence, whether and how Pol II pausing is regulated have not been systematically studied (Takahashi, 2017). In this study, we performed ChIP-seq against Pol II to characterize Pol II pausing in the mouse liver. The results revealed widespread regulation of Pol II pausing and its complex relationship with transcription. We also performed ChIP-seq against TATA-binding protein (Tbp) and found that Pol II recruitment mainly plays an indirect role in determining transcriptional output, with its effect modulated by transcriptional termination and pause release.
Materials and Methods
Animals
Young male C57BL/6 mice (3-4 months old) were housed in a 12:12 LD cycle with food and water freely available. Room temperature was maintained at 25 °C. Mice were sacrificed by cervical dislocation, and livers were collected from 5 mice per time point and stored in liquid nitrogen. The time points were ZT2, 6, 10, 14, 18 and 22 (ZT, zeitgeber time; ZT0, lights-on; ZT12, lights-off). The study was approved by the Institutional Review Board of the College of Life Sciences, Wuhan University, and was conducted in accordance with internationally accepted standards.
Protein Analysis
Nuclear proteins were extracted using the NUN method (Lavery and Schibler, 1993). Proteins not tightly associated with chromatin were released into the nucleoplasmic fraction, while those that remained in the pellet (chromatin fraction) were isolated via sonication. For target detection by Western blot, proteins from the 2 compartments (with similar yields) were loaded in equal amounts. The primary antibodies used were Cdk9 (Santa Cruz, sc-484), NELF-A (Abcam, ab85852), NELF-E (Abcam, ab170104), Spt5 (CST, 9033), and U2AF65 (Sigma, U4758). The quantitation result for each protein was shown as a ratio against the mean on each gel.
ChIP-seq
ChIP was performed according to Nelson et al. (2006) with minor modifications. At each time point, frozen liver tissues from 5 mice were pooled by about equal weight and homogenized in 1% PFA (freshly prepared). After 10 min at RT, crosslinking was stopped via addition of glycine to a final concentration of 125 mM. The nuclei were isolated via sucrose density gradient centrifugation and sonicated in IP buffer (with 1% SDS). The sonicated chromatin was aliquotted and stored at −80 °C. The same batch of chromatin prepared at each time point was used in all ChIPs. The ChIP antibodies were against Pol II (Santa Cruz, sc-899; control, rabbit IgG) and Tbp (Abcam, ab51841; control, mouse IgG). At each time point, 10 µg of chromatin and 2 µg of antibody were used per ChIP, and 5 ChIPs were performed in parallel for each antibody. The IPed DNAs were pooled (to at least 10 ng). SE-50 ChIP-seq libraries were prepared at Beijing Genomics Institute at Shenzhen and sequenced on HiSeq 2000 following standard protocols.
ChIP-seq Data Analysis
Raw reads (tag size, 49 bp; Fastq format, Illumina 1.5+, Phred64 quality score system) were subject to quality control as described by Patel and Jain (2012). Reads passing the filtering criteria were aligned to the UCSC mm9 genome via Bowtie (v1.1.2) (Langmead et al., 2009). The –n mode was used with default settings, except that the −phred64-quals option was on. The first 28 bp of the read were used as the seed. At most 2 mismatches in the seed region were allowed, and the sum of phred quality values at all mismatched positions of the entire read should not exceed 70. Reads with more than 1 mapping location were also discarded. The SAM alignment files were converted to BAM files via SAMtools (v1.3.1) (Li et al., 2009) and were sorted, and all duplicates were removed. The final BAM files contained only unique and nonredundant reads. We referred to the number of such reads as the sequencing depth of each sample. Genomic coverage of those reads is shown in Supplementary Figure S1. Peak calling was performed via MACS (v1.4.2) (Feng et al., 2012). For model-based analysis, the fragment size estimates varied by ~10% among Pol II samples (average 136 bp). To avoid bias in length estimate, we performed MACS analysis with a fixed tag shift of 68 bp (half of the average length estimate for Pol II samples) for all samples. The threshold p value for enrichment was set at 10-5, and λlocal values were normalized to the IgG sample. The statistics for read mapping and MACS analysis are in Supplementary Table S1. The MACS peaks were not selected by FDR or fold enrichment. They were annotated with CEAS (Shin et al., 2009). For genomic average profiles, CEAS data at each time point were divided by a factor proportional to the sequencing depth at that time point (1 for the sample with the lowest sequencing depth). For Integrative Genomic Viewer (IGV) display of bedgraph/wig files (Robinson et al., 2011), the data range was normalized by sequencing depth relative to that of IgG control. For example, IgG control had a depth of 20 million, while sample A had a depth of 15 million. If the data range in IGV was set at 100 for IgG, then the data range for sample A was set at 75 at the same height of data display. For overlap analysis, the UCSC mm9 refFlat list was downloaded. After annotation duplicates were removed, the remaining 29,933 genes were used in overlap analysis between MACS peaks and the TSS region via “intersect” of BEDTools (v.2.26.0) (Quinlan and Hall, 2010). At each time point, ~90% of overlapping events covered the entire TSS region. For the rest, the lengths of overlap did not cover the entire TSS region and/or changed over the day. All overlapping events were accepted without specifying the minimum overlap length.
Quantitative Binding Analysis and Pol II TR Calculation
Quantitative analysis of binding signals within TSS region and gene body and Pol II traveling ratio (TR) calculation were performed as described by Day et al. (2016), with minor modifications. BAM files were processed by the R package SPP (v1.4) (Kharchenko et al., 2008), and all tags were selected. After local tag anomaly was removed, a read extension of 136 bp was performed. Tag pileups within specified regions (TSS region and gene body) of target genes were normalized to region length and sequencing depth (read per base pair per million). We used the definition of [–50, +300 bp] to TSS as the TSS region and from +300 bp downstream of TSS to annotated gene end as the gene body. A small fraction of Pol II signals within the TSS region ([Pol II]TSS) probably represented Pol II in the PIC and/or initiated Pol II before the establishment of pausing (Chen et al., 2015), although the exact proportion was difficult to determine based on our ChIP-seq data. We used [Pol II]TSS as a quantitative measure of paused Pol II in this study. For Tbp binding, defining the TSS region as [–80, +270 bp] to TSS, in accordance with the upstream location of Tbp peak relative to Pol II peak, resulted in [Tbp]TSS correlating well (~0.99 at ZT2) with original values. We used [–50, +300 bp] to TSS as the TSS region for all analyses. To determine whether Pol II signals could be corrected by IgG binding, we obtained tag counts within 29,933 refFlat genes’ boundaries (via Samtools -bedcov) and normalized them by sequencing depth. At each time point, there were more than 12,000 genes whose Pol II coverage was lower than that of the IgG control; 11,778 genes had more coverage in all Pol II samples than in IgG control. However, while most of those genes had TSS Pol II peaks, some clock genes (e.g., Arntl, Cry1, Per1, and Per3) with TSS Pol II peaks were excluded. Because the signals of the specific antibodies and IgG had time- and locus-specific variations in relative strength, IgG correction would reduce the number of genes with truly positive signals to be analyzed, including clock genes essential for our study. A simulated correction of [Pol II]TSS and [Pol II]GB by a fixed value (1.0E-6, close to the smallest [Pol II]GB value in our data) had almost no effect on rhythm analysis of TR. Alternatively, correction by dividing [Pol II]GB by a factor (e.g., 2) raised TR, without changing our conclusion either. All binding values presented were without correction. We prepared a list of more than 14,000 genes harboring all TSS MACS peaks of Pol II and a protein involved in pausing control (done in parallel with Pol II ChIP-seq in a pilot study) over the day. This list covered more than 99% of the genes with TSS Tbp peaks. After removal of transcript isoforms (typically the longest one was kept for each gene), overlapping genes, genes within 1 kb from each other, and genes shorter than 1 kb, 7414 genes from this list were selected for quantitative analysis (Suppl. Tables S2-S6). TR values in IgG control (<2 for ~40% of genes) were typically much smaller than those in Pol II samples.
Rhythm Analysis
Because our 1-cycle data could not be analyzed with JTK-CYCLE (Hughes et al., 2010), we used ARSER instead (Yang and Su, 2010). The cutoff p value was 0.05 in all analyses. Overlap of genes rhythmic in different parameters was analyzed using Excel via functions such as sort and filter. ARSER analysis of 1-cycle [Tbp]TSS and [Pol II]TSS:[Tbp]TSS data resulted in misleading phase estimates that did not agree well with gross examination of heatmaps. Using 2-cycle data of duplication, as described by Koike et al. (2012), led to more appropriate phase estimate. It also resulted in more rhythmic genes in all parameters analyzed. The results on both 1-cycle and 2-cycle data are included in Supplementary Tables S2 through S6. For heatmaps, values were normalized by the daily mean of each gene, and genes were sorted by ARSER phase in ascending order.
Data Availability
Raw sequencing reads and bedgraph files produced by MACS (for IGV display) have been deposited into Gene Expression Omnibus (GSE96773).
Results
ChIP-seq Reveals Prominent Pol II Binding Near the TSS
We set out to study Pol II pausing by characterizing Pol II distribution within the mouse liver genome via ChIP-seq at 6 time points across the day. The antibody is against the N-terminus of Rpb1 (the largest subunit of the Pol II complex), regardless of its CTD phosphorylation states. At each time point, ~14,000 to ~32,000 Pol II peaks were identified. About 20% to 40% of those peaks were within the promoter and 5′-UTR of genes (Suppl. Fig. S2). Such TSS-proximal peaks were evident in clock genes (Fig. 1A). Genomic average profile also revealed a prominent Pol II peak near the TSS (Fig. 1B), a pattern indicative of Pol II pausing. We defined the TSS region as from −50 to +300 bp relative to TSS (Fig. 1B), following convention (Day et al., 2016). The TSS region did not cover the entire Pol II peak near the TSS. Pol II signals upstream of the TSS could arise from divergent transcription (i.e., a Pol II peak upstream of the TSS) (Almada et al., 2013). To our benefit, the TSS region thus defined typically excluded such upstream Pol II signals when examined with IGV. The relatively high Pol II signals downstream of the TSS region (up to 1 kb into the gene body) most probably reflected increased Pol II density due to the low speed of Pol II elongation just after pause release (Jonkers et al., 2014). At each time point, ~30% to 56% of the Pol II MACS peaks had overlap with the defined TSS region of genes (Fig. 1C). About 99% of genes with TSS Pol II peaks at other time points also had such peaks at ZT2, when the greatest numbers of such genes were found (Fig. 1D). The daily changes in the number of genes with TSS Pol II peaks indicated that Pol II signals near the TSS changed over the day, warranting quantitative analysis. About 10% to 15% of the Pol II peaks were within intergenic regions (Suppl. Fig. S2), probably occupying enhancers (Kim et al., 2010). They were not further analyzed. Despite the relatively low Pol II average profile within the gene body, ~40% to 50% of Pol II MACS peaks were found within coding exons and introns at each time point (Suppl. Fig. S2). While we did not analyze those peaks either, average Pol II binding within gene body could be used as a measure of transcription (Le Martelot et al., 2012), allowing a quantitative study of gene transcription via ChIP-seq.
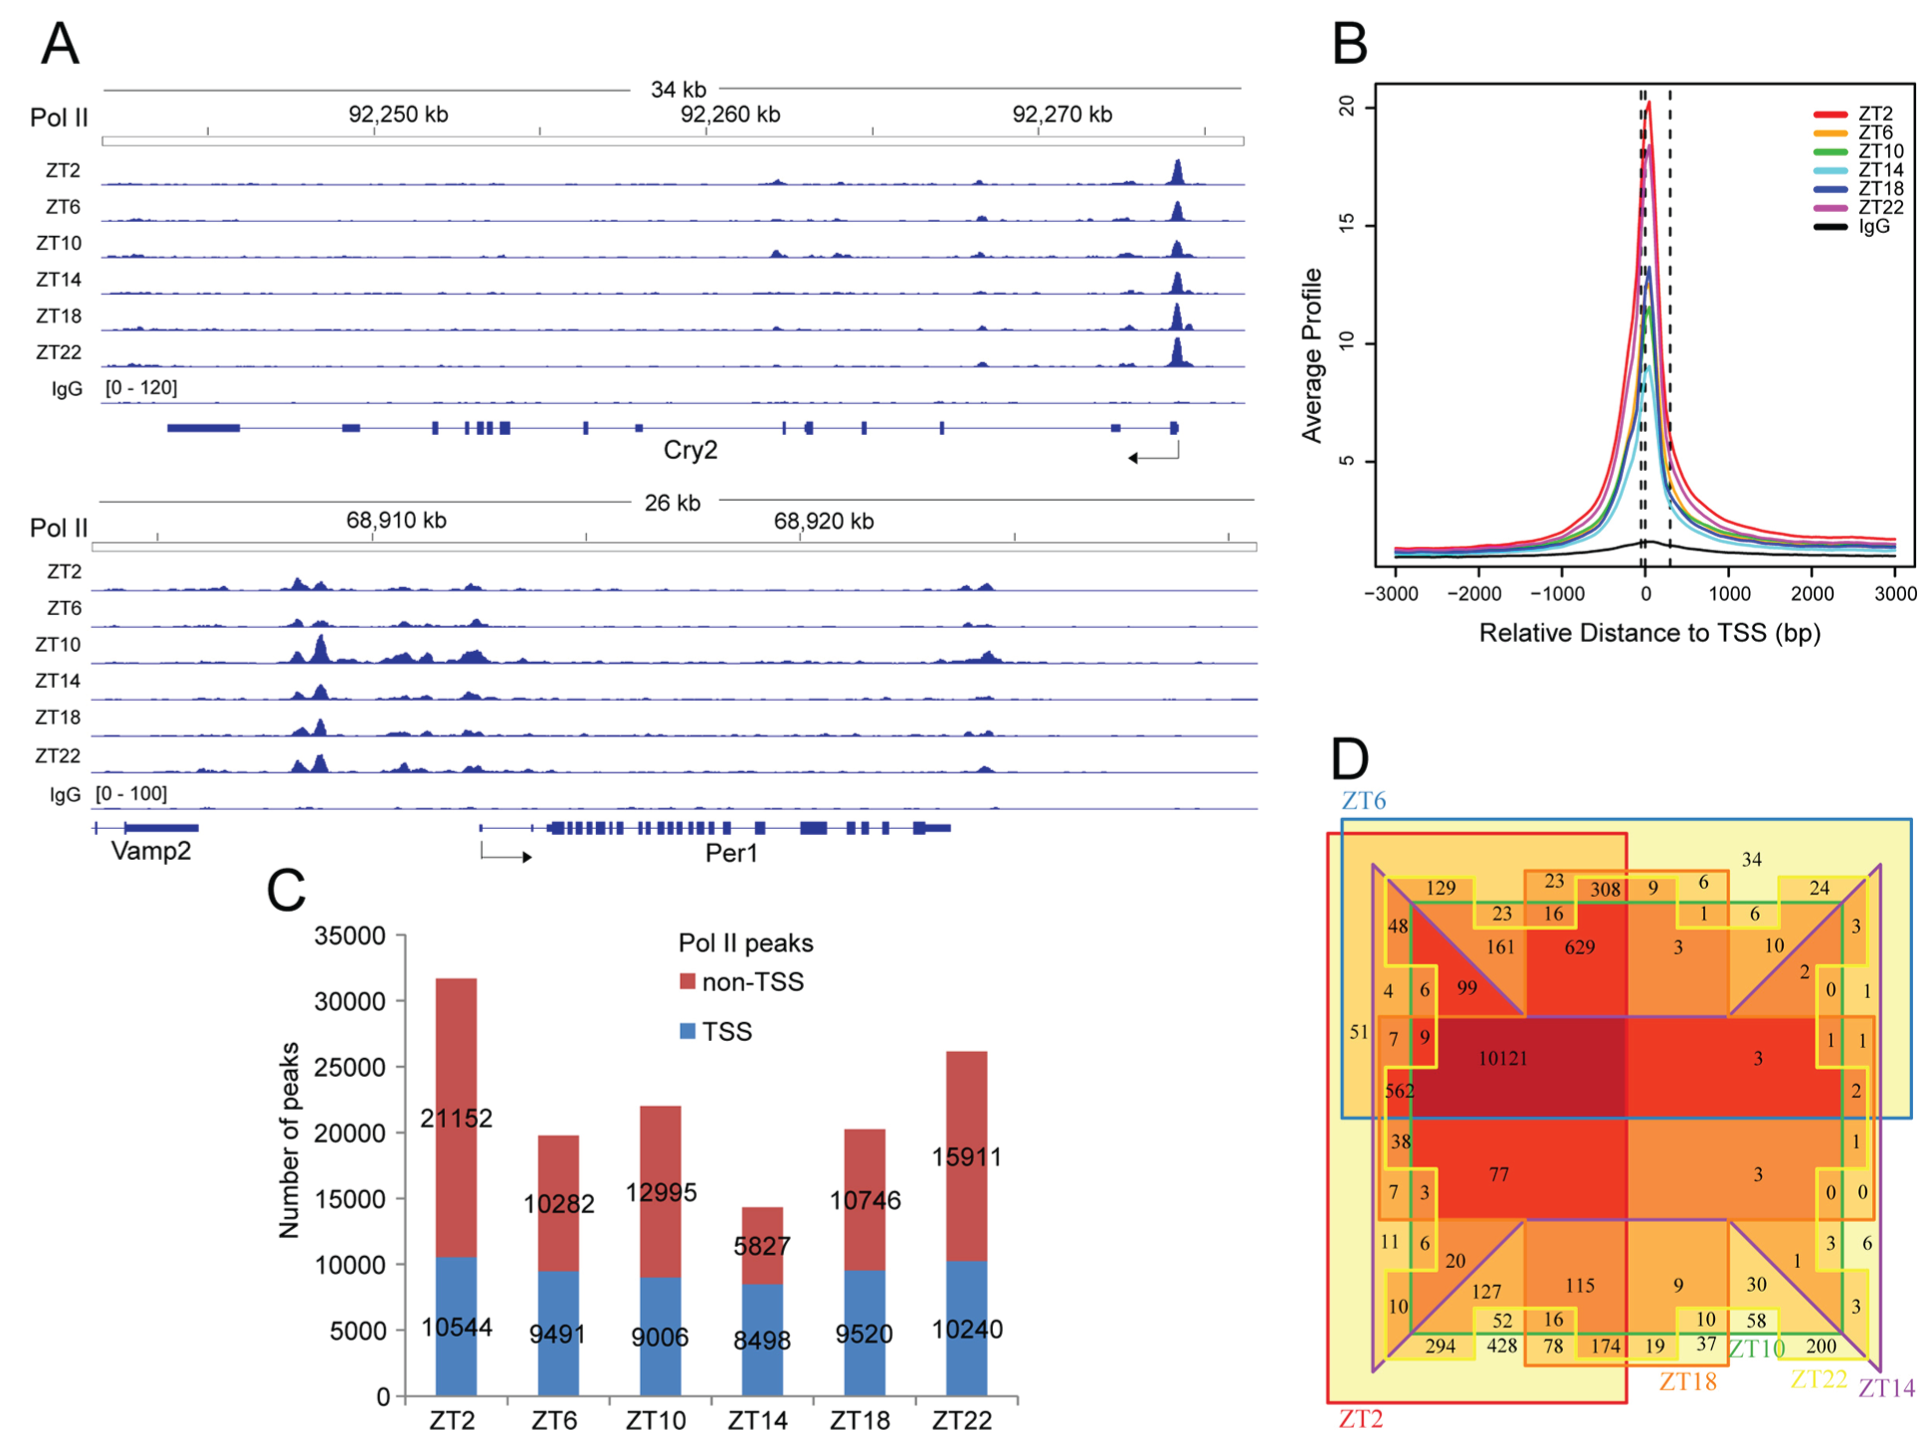
Pol II ChIP-seq. (A) Examples of Pol II ChIP-seq results. IGV display of Cry2 and Per1 results. Data range is normalized by sequencing depth to that of IgG (set to 120). (B) TSS-centered (±3 kb) genome-wide average Pol II profile. Data (produced by CEAS) are scaled according to sequencing depth relative to sample with the lowest depth. The TSS region, defined as [–50 bp, 300 bp] to TSS, is also shown. The 3 dashed lines cross the x-axis at −50 bp, 0 bp, and 300 bp relative to TSS, respectively. (C) Summary of Pol II peaks. The MACS peaks are grouped as either within the TSS region or not, and their numbers are shown. If a MACS peak is shared by genes due to their proximity, only 1 peak is counted. (D) Venn diagram showing overlap among genes with TSS Pol II peaks across the day. Most genes with TSS Pol II peaks at other time points are also found at ZT2. Overlapping (including isoforms) and neighboring genes that share TSS Pol II peaks are all counted. If a gene has multiple TSS Pol II peaks, only 1 gene is counted.
Quantitative Analysis of Pol II Binding Reveals Distinct Pol II Binding within the TSS Region and Gene Body
To study the relationship between TSS Pol II binding and transcription within the gene body, we quantitated Pol II signals within the TSS region ([Pol II]TSS) and gene body ([Pol II]GB) for 7414 genes across the genome. The values (without background subtraction) were normalized to sequencing depth and region length. We found that [Pol II]GB, but not always [Pol II]TSS, reflected temporal changes in the transcription of genes (Fig. 2). Genes such as Bmal1, Fgf21, and Gys2 had nearly synchronized changes in their [Pol II]TSS and [Pol II]GB. However, for genes such as Cry2, Nampt, and Per3, their daily [Pol II]TSS and [Pol II]GB profiles were dramatically different, with the latter conforming to their known expression patterns (Fig. 2). These observations validated the approach of using [Pol II]GB as a measure of transcription level and indicated that [Pol II]GB was not always passively determined by [Pol II]TSS. To further study such dissociation, we performed rhythm analysis of [Pol II]TSS and [Pol II]GB. For 2535 genes rhythmic in [Pol II]TSS (Suppl. Table S2), the phases were clustered around ZT0 (Fig. 3A), a pattern also evident in all genes (Suppl. Figs. S1B and S3). Consistent with this finding, pSer5-CTD, a marker of paused Pol II, was previously shown to exhibit daily changes that peaked similarly near CT0 (Koike et al., 2012). Those results supported the notion that TSS Pol II peaks represent paused Pol II and indicated that there was a global rhythm of Pol II pausing. We identified 665 genes as rhythmic in [Pol II]GB, but their phases had a bimodal distribution (Fig. 3C). A prominent [Pol II]GB peak cluster of ~400 genes (including ~60 genes coding for transcription factors, histone modification enzymes, and mediators) was found near ZT0, when the [Pol II]TSS rhythms also peaked. However, another peak cluster of ~300 genes was found near ZT12 (Fig. 3C), in anti-phase to the [Pol II]TSS rhythm (Fig. 3D). Because 1-cycle data of low sampling resolution (4-h interval) were analyzed, the number of rhythmic genes was likely an underestimate, and few clock genes were identified as rhythmic in [Pol II]GB (Suppl. Table S3). Loosening the detection criteria by analyzing 2-cycle data of duplication resulted in more genes rhythmic in transcription, including those whose transcription peaked at times beyond near ZT0 and ZT12 (Suppl. Table S3). However, the bimodal pattern was independent of detection criteria and evident even when all genes were considered as rhythmic (Suppl. Fig. S4). Thus, our results were not biased. However, despite the transcriptional peak cluster near ZT12, our pan-Pol II antibody did not reveal an increase of [Pol II]TSS at that time (Suppl. Fig. S3), in contrast to previous results with the 8WG16 antibody (Koike et al., 2012). The reason for such discrepancy is not clear, but the cross-reactivity of Pol II CTD antibodies (e.g., 8WG16) to various pCTD forms could confound ChIP-seq results (Nojima et al., 2015).
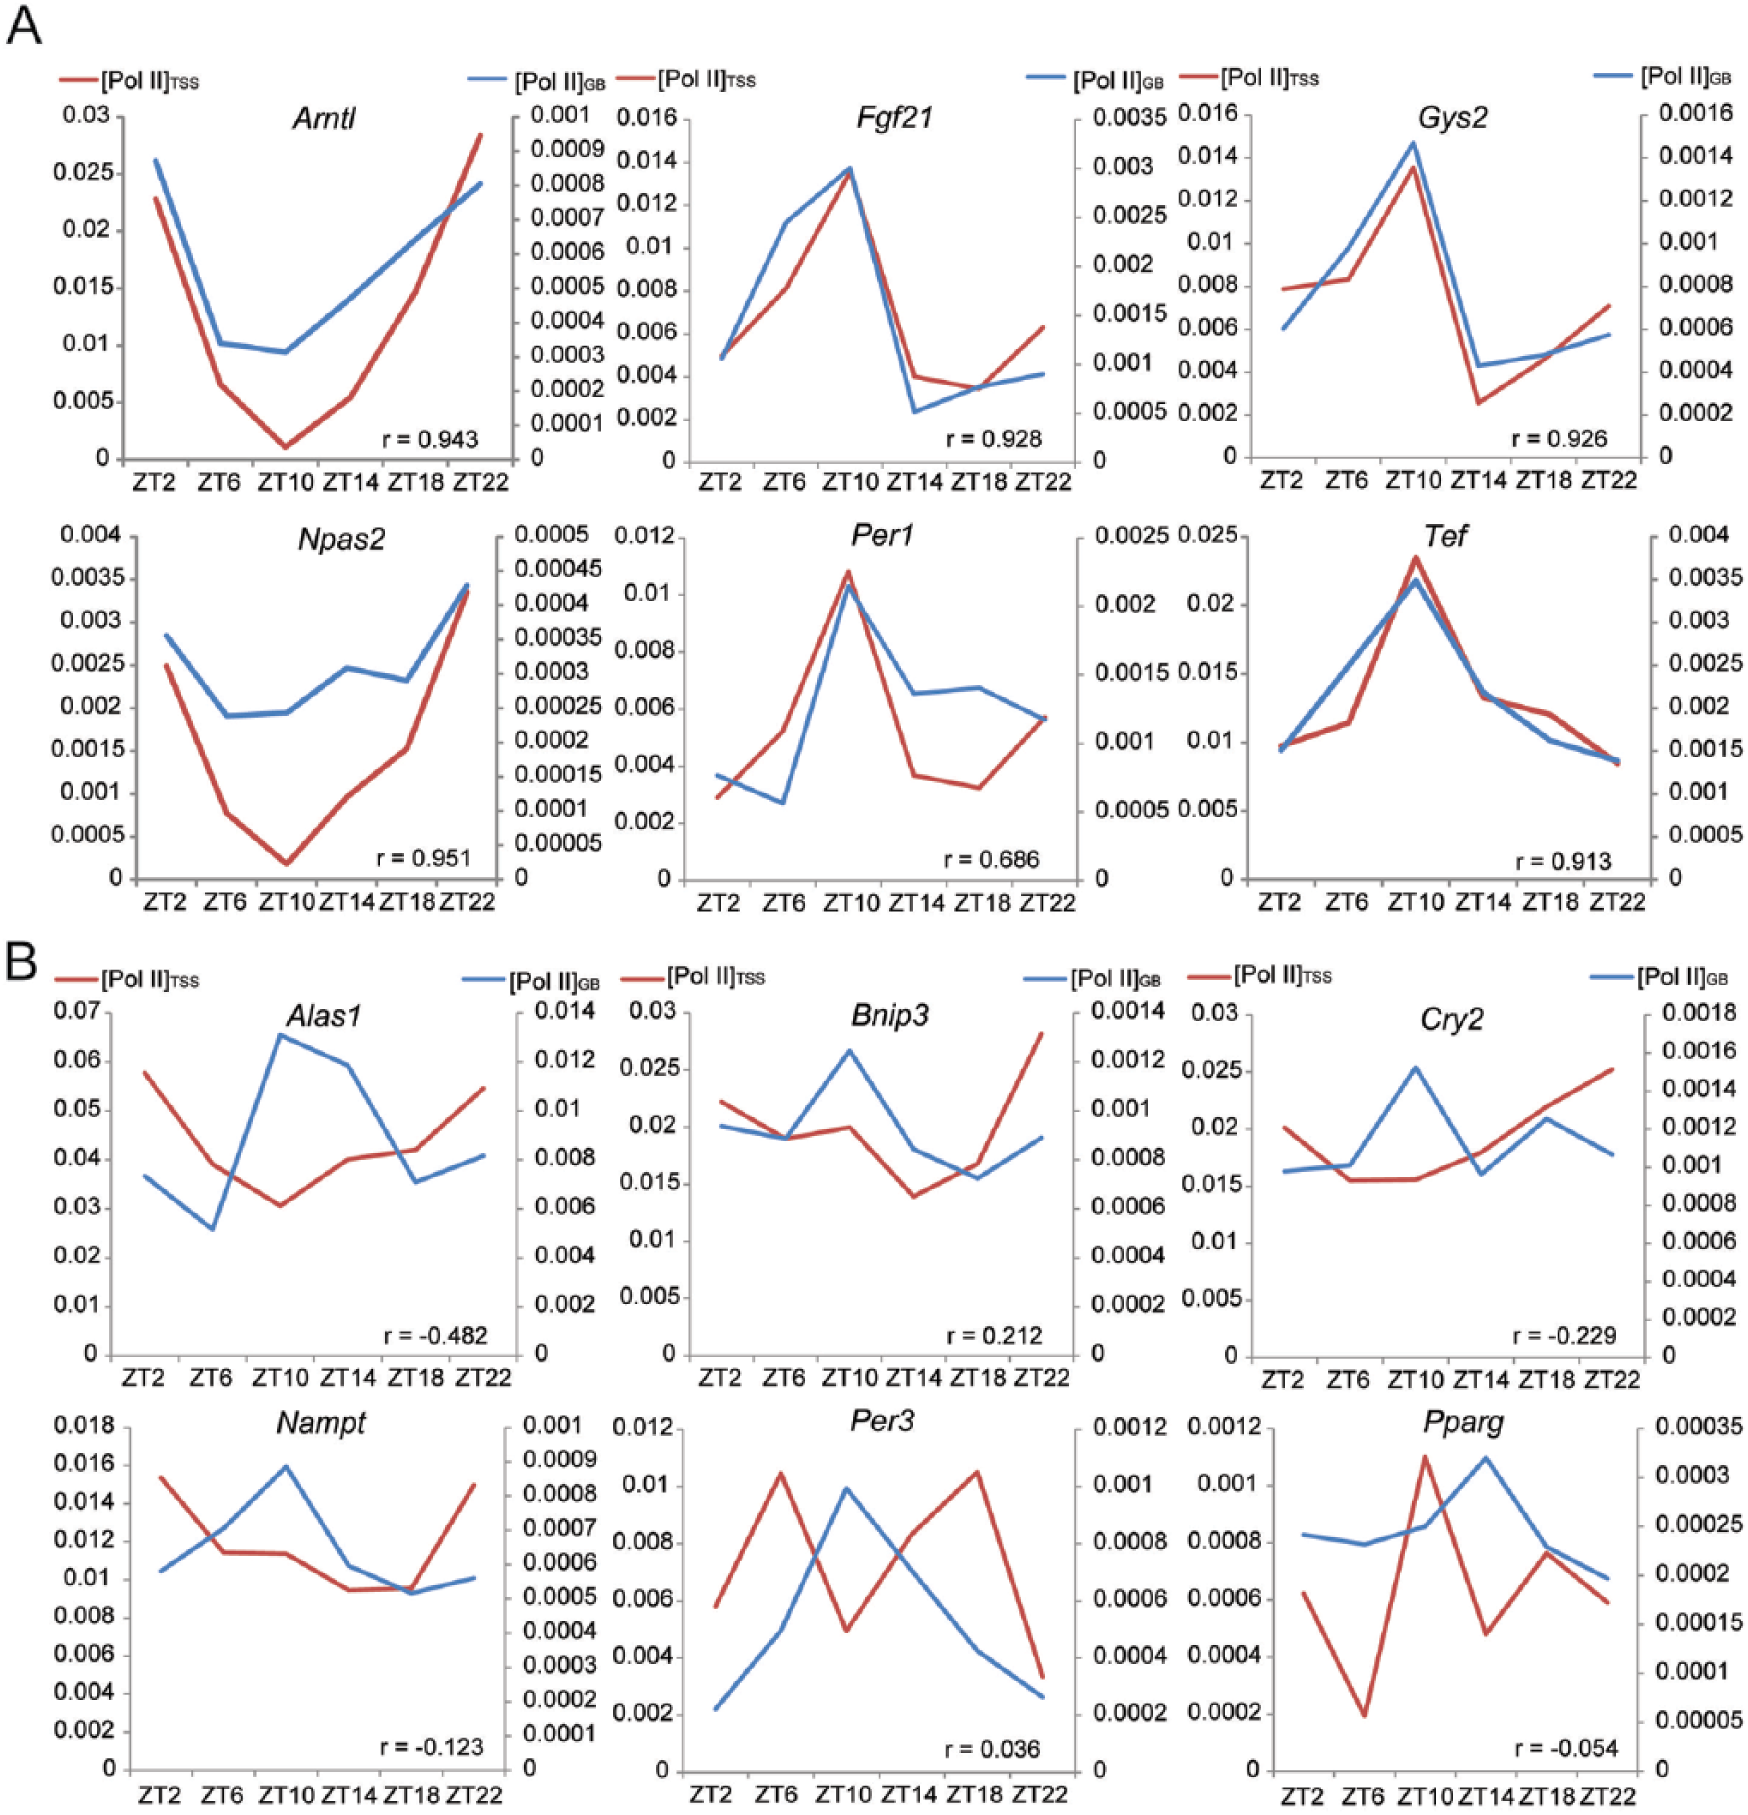
[[Pol II]GB and [Pol II]GB show discordant changes for certain genes. Within-gene correlation value (between [Pol II]TSS and [Pol II]GB across 6 time points) is shown for each gene. The temporal changes in [Pol II]GB better reflect the known expression patterns of genes. (A) [Pol II]TSS (black, left y-axis. Unit: read per million per bp) and [Pol II]GB (gray, right y-axis) change in close parallel for Arntl, Fgf21, Gys2, Npas2, Per1, and Tef. (B) Discordant changes are found for Alas1, Bnip3, Cry2, Nampt, Per3 and Pparγ.
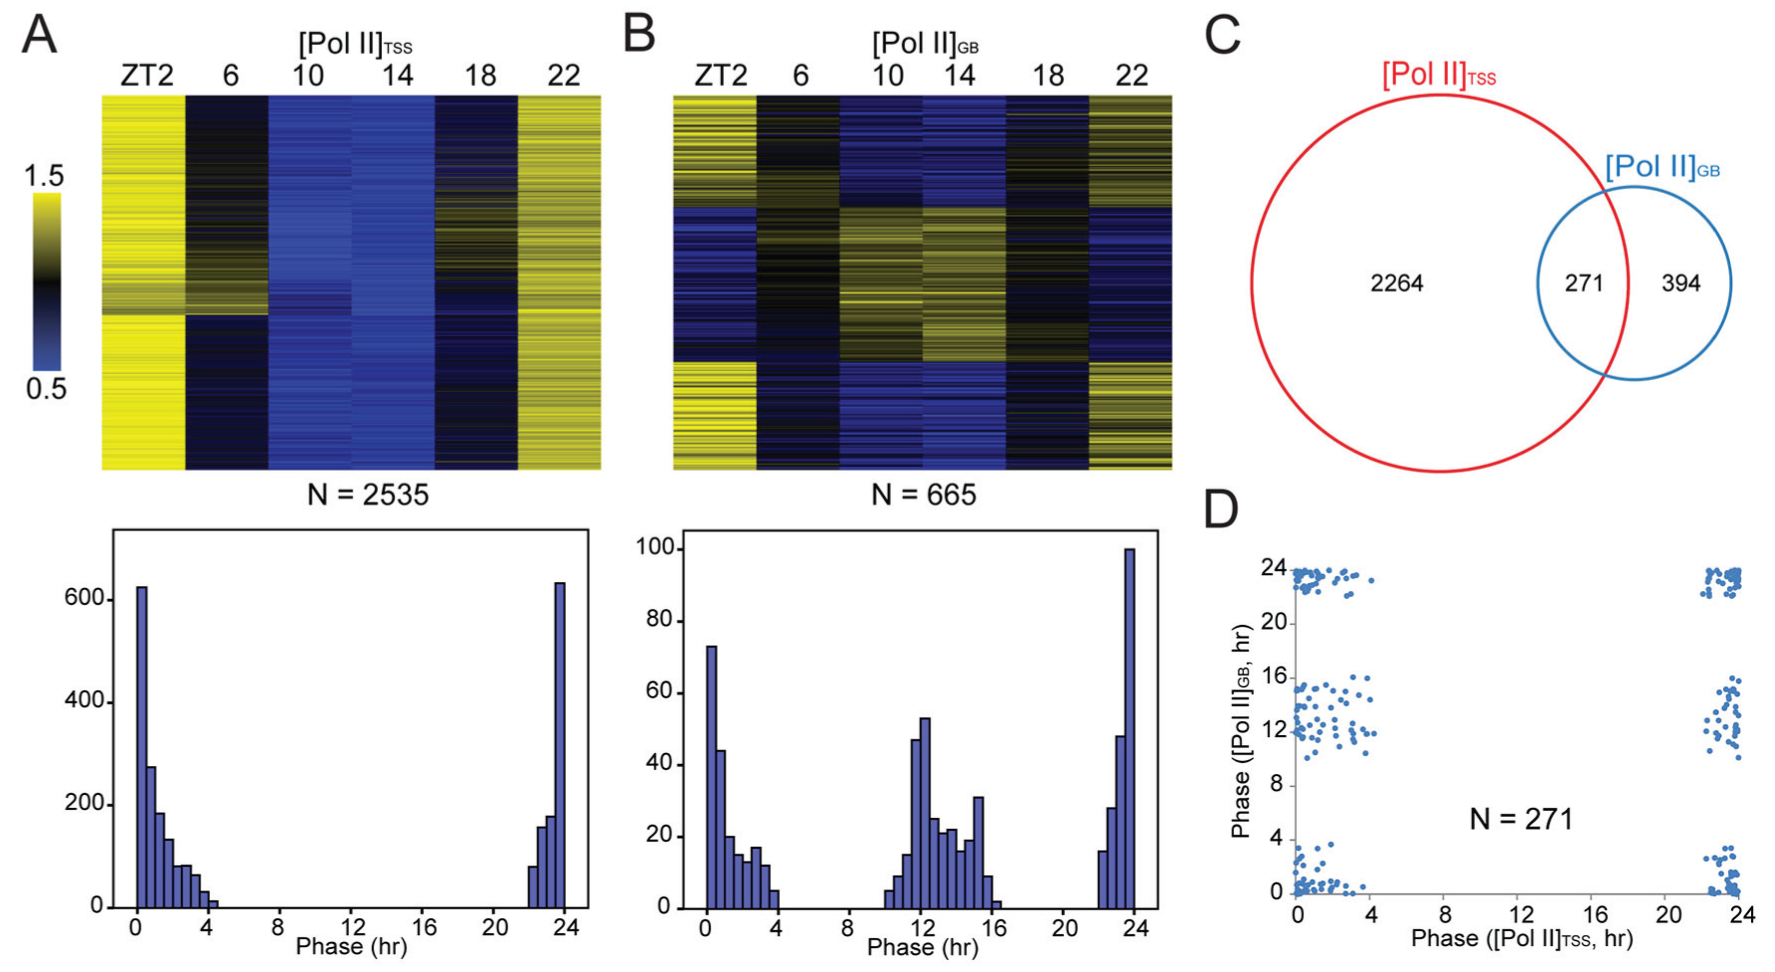
Rhythm analysis of [Pol II]TSS and [Pol II]GB. Mean-normalized values are displayed in heatmaps, where genes are sorted by ARSER phase in ascending order. (A) [Pol II]TSS rhythms. Upper, heatmap. Lower, histogram of phase distribution (0.5-h bin). (B) [Pol II]GB rhythms. Upper, heatmap. Lower, histogram of phase distribution. (C) 271 genes are rhythmic in both [Pol II]TSS and [Pol II]GB, and (D) the respective phases of [Pol II]TSS and [Pol II]GB are plotted as x-y scatter.
Pol II Pausing Is Related to Transcription in Complex Ways
The discordant changes of [Pol II]TSS and [Pol II]GB across the day prompted us to calculate Pol II traveling ratio (TR: [Pol II]TSS:[Pol II]GB; a.k.a. the pausing index), a quantitative measure of Pol II pausing (Rahl et al., 2010; Day et al., 2016). After pause release, the Pol II elongation complex is known to gain speed when transcribing into gene body (Jonkers et al., 2014). Accordingly, more Pol II is expected to travel at maximum speed in the gene bodies of longer genes, potentially leading to lower Pol II density therein and hence higher TR. There was indeed a positive correlation between TR and gene length (Suppl. Fig. S9). However, such correlation was weak. Pol II elongation kinetics also varies across genes (Jonkers et al., 2014). In this study, we assumed that the overall kinetics of Pol II elongation does not change over the day for each gene. TR values had a broad distribution (Fig. 4A, left) and exhibited daily changes by more than 1.5-fold for ~95% of genes (Suppl. Table S4). At each time point, ~90% of genes had TR larger than 2 (Fig. 4A, right). Nearly all genes had TR larger than 2 at least at 1 time point (Suppl. Table S4). Interestingly, TR curves for ZT2, ZT6, and ZT10 were similar to those for ZT22, ZT18, and ZT14, respectively, resulting in a near-symmetrical pattern across the day (Fig. 4A, right). Overall, TR was smaller at ZT10 and ZT14 but higher at ZT2 and ZT22 (Fig. 4A). For 2123 genes rhythmic in TR, their phases were clustered near ZT0 (Fig. 4B and Suppl. Fig. S6), similar to the [Pol II]TSS rhythm (Fig. 3A). For 1463 genes rhythmic in both [Pol II]TSS and TR (Fig. 4C), the phases of the 2 rhythms agreed well (with only 2 exceptions; Fig. 4D). In contrast, for genes rhythmic in both TR and [Pol II]GB, a bimodal pattern of association was evident. There were genes whose transcription peaked near ZT12, in anti-phase to the [Pol II]TSS and TR rhythms (Figs. 3 and 4D). A rise of pause release, to decrease pausing and increase elongation, could potentially account for increased transcription of these genes near ZT12. The expression of proteins involved in pausing control (Suppl. Fig. S8), however, did not have a clear relationship with the global rhythm of Pol II pausing. ChIP-seq studies on those proteins’ DNA association are needed to characterize whether and how pause release activity varies over the day for specific genes. In contrast, [Pol II]TSS represents net accumulation of Pol II within the TSS region, where initiated Pol II can be removed via not only pause release but also premature termination (Jonkers and Lis, 2015). A reduction in [Pol II]TSS and TR does not necessarily reflect an increase in pause release activity but could be due to increased transcriptional termination as well. Such caution is warranted, given the near-symmetrical distribution of TR and [Pol II]TSS values across the day for most genes (Suppl. Figs. S3 and S6). These patterns reflected complex interactions between transcriptional termination and pause release after Pol II initiation. Further arguing against pause release as the sole determinant of transcription level and TR, there were a few genes whose TRs peaked near ZT12, but their transcription peaked near ZT0 (Fig. 4D). Moreover, there were genes whose transcription and TR both peaked near ZT0 (Fig. 4D), when [Pol II]TSS also peaked (Fig. 3D), presumably due to low pause release activity. For these genes, more Pol II initiation was required to increase [Pol II]TSS, [Pol II]GB, and TR at the same time. The results thus agreed with a role of Pol II initiation in driving transcription, as suggested previously (Le Martelot et al., 2012). In contrast, from the perspective of Pol II pausing, the results were also consistent with a positive role of Pol II pausing in transcription, as revealed in previous studies (Gilchrist et al., 2010; Nilson et al., 2015). Indeed, at each time point, there was always a positive correlation between [Pol II]GB and [Pol II]TSS across genes (Suppl. Fig. S7). However, within-gene correlations between [Pol II]TSS and [Pol II]GB across the 6 time points were highly variable, with poor or negative correlation being frequent (Fig. 4E). Overall, [Pol II]TSS was not always a good predictor of [Pol II]GB. Thus, despite the global rhythm of Pol II pausing, the temporal output of transcription was mostly regulated in a gene-specific manner. This was due to the complexity of transcriptional control, which occurs at 3 levels near the TSS: Pol II recruitment and initiation, transcriptional termination, and pause release.
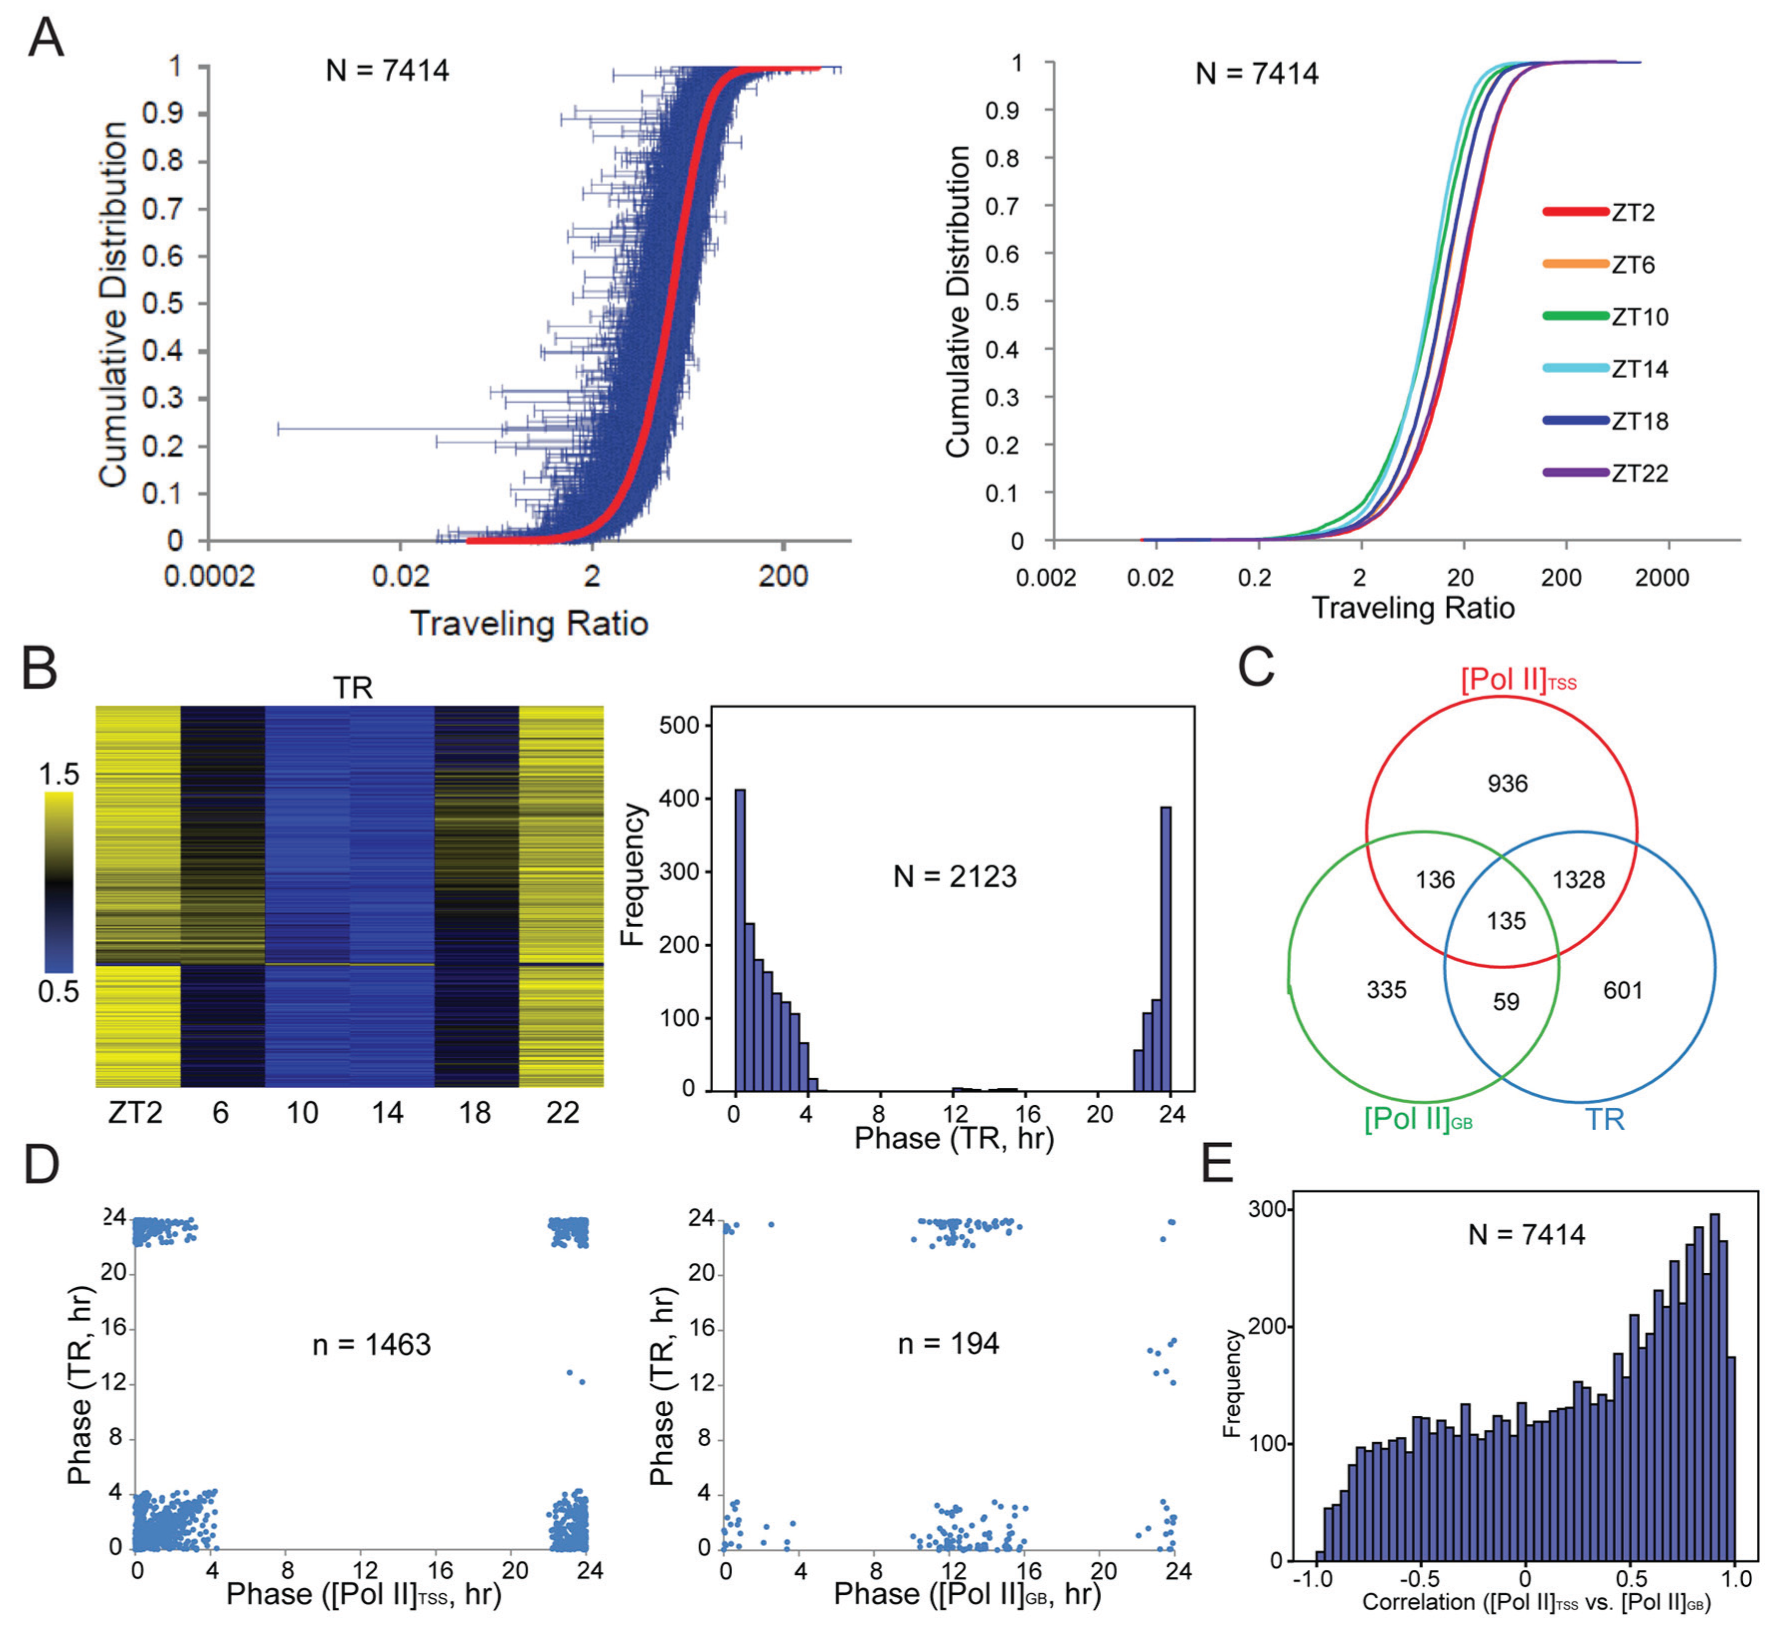
Daily changes in Pol II traveling ratio. (A) TR distribution. Left, daily average TR values of genes (in red; n = 7414) are ranked and plotted against cumulative distribution. Blue error bars represent standard deviations over the 6 time points. Right, TR values at each time point are ranked and plotted against cumulative distribution. Note that values at ZT10 and ZT14 are smaller (left-shifted). The curves of ZT2 and ZT22 (and ZT6/18) appear nearly indistinguishable. (B) TR rhythms. Left, heatmap; right, histogram of phase distribution. (C) Venn diagram showing overlap among genes rhythmic in TR, [Pol II]TSS, or [Pol II]GB. (D) For genes rhythmic in both TR and [Pol II]TSS (left; n = 1463) or rhythmic in both TR and [Pol II]GB (right; n = 194), the respective phases are plotted as x-y scatter. (E) Within-gene correlation between [Pol II]TSS and [Pol II]GB across 6 time points. Note that many genes have poor or negative correlation.
The Effect of Pol II Recruitment and Initiation to Transcription Is Modulated by Transcriptional Termination and Pause Release
To study the role of Pol II recruitment and initiation in daily transcription, we performed ChIP-seq against the PIC component Tbp (TATA-binding protein). Tbp signals near the TSS of Cry2 and Per1 appeared relatively weak, especially when compared with strong signals at the 3′-end of the Per1 gene (Fig. 5A and Suppl. Fig. S9A). Nonetheless, MACS analysis revealed that Tbp peaks were mainly located near the TSS (Suppl. Fig. S10). Genomic average profiles revealed a Tbp peak slightly upstream of the TSS (Fig. 5B and Suppl. Fig. S9B), with a much lower peak height than that of Pol II (Suppl. Fig. S9C). Across the day, most numbers of Tbp peaks (genome-wide or within the TSS region) were found at ZT2 (Fig. 5C). Most of the genes with TSS Tbp peaks at other time points were also found at ZT2 (Fig. 5D). Overall, the TSS Tbp peaks were found within nearly the same set of genes that also had TSS Pol II peaks (Fig. 5E and Suppl. Fig. S9D). Those results were consistent with Tbp being a PIC component, while the TSS Pol II peak represents mainly paused Pol II after initiation. We found that 269 genes were rhythmic in [Tbp]TSS (Fig. 6A), which had marginal overlap with those rhythmic in [Pol II]TSS or [Pol II]GB (Fig. 6B). The number of genes rhythmic in [Tbp]TSS appeared greatly underestimated, since heatmapping revealed a genome-wide trend of decreasing [Tbp]TSS values over the day, peaking at ZT2 for most genes (Suppl. Fig. S11). Such peculiar waveforms, far from symmetrical, could have hindered rhythm detection. We also noticed that [Tbp]TSS phase values based on 1-cycle data analysis differed from those based on 2-cycle data, with the latter closer to intuitive estimates according to heatmap (Suppl. Fig. S11). We thus did not analyze the phase relationship between [Tbp]TSS and [Pol II]TSS (or [Pol II]GB). Genome-wide, there was a positive correlation between [Tbp]TSS and [Pol II]TSS across genes at each time point (Suppl. Fig. S12A). However, within-gene correlation between [Tbp]TSS and [Pol II]TSS (or [Pol II]GB) across the day was highly variable, with poor correlation being frequent (Fig. 6C and 6D; Suppl. Fig. S12B for examples). Such results indicate that Pol II recruitment is not the direct determinant of Pol II pausing or transcriptional output on most occasions. This is due to the fact that both premature termination and pause release reduce [Pol II]TSS, but with opposite effects on [Pol II]GB. Assuming that [Tbp]TSS is a quantitative measure of Pol II recruitment and that Pol II initiation is efficient, the [Pol II]TSS:[Tbp]TSS ratio can be used as a stability index of initiated Pol II. Analysis of this index showed that initiated Pol II was more stable at ZT22, with intermediate stability at ZT14, but was much less stable at ZT2/10 (Fig. 6E), a pattern also evident in genes rhythmic in this index (Fig. 6F and Suppl. Fig. S13). Because Pol II TR was high at ZT2/22 but low at ZT10/14, there is no clear temporal association between TR and Pol II stability. Thus, a complex interplay between pause release and trancriptional termination determines the fate of initiated Pol II and its pausing status.
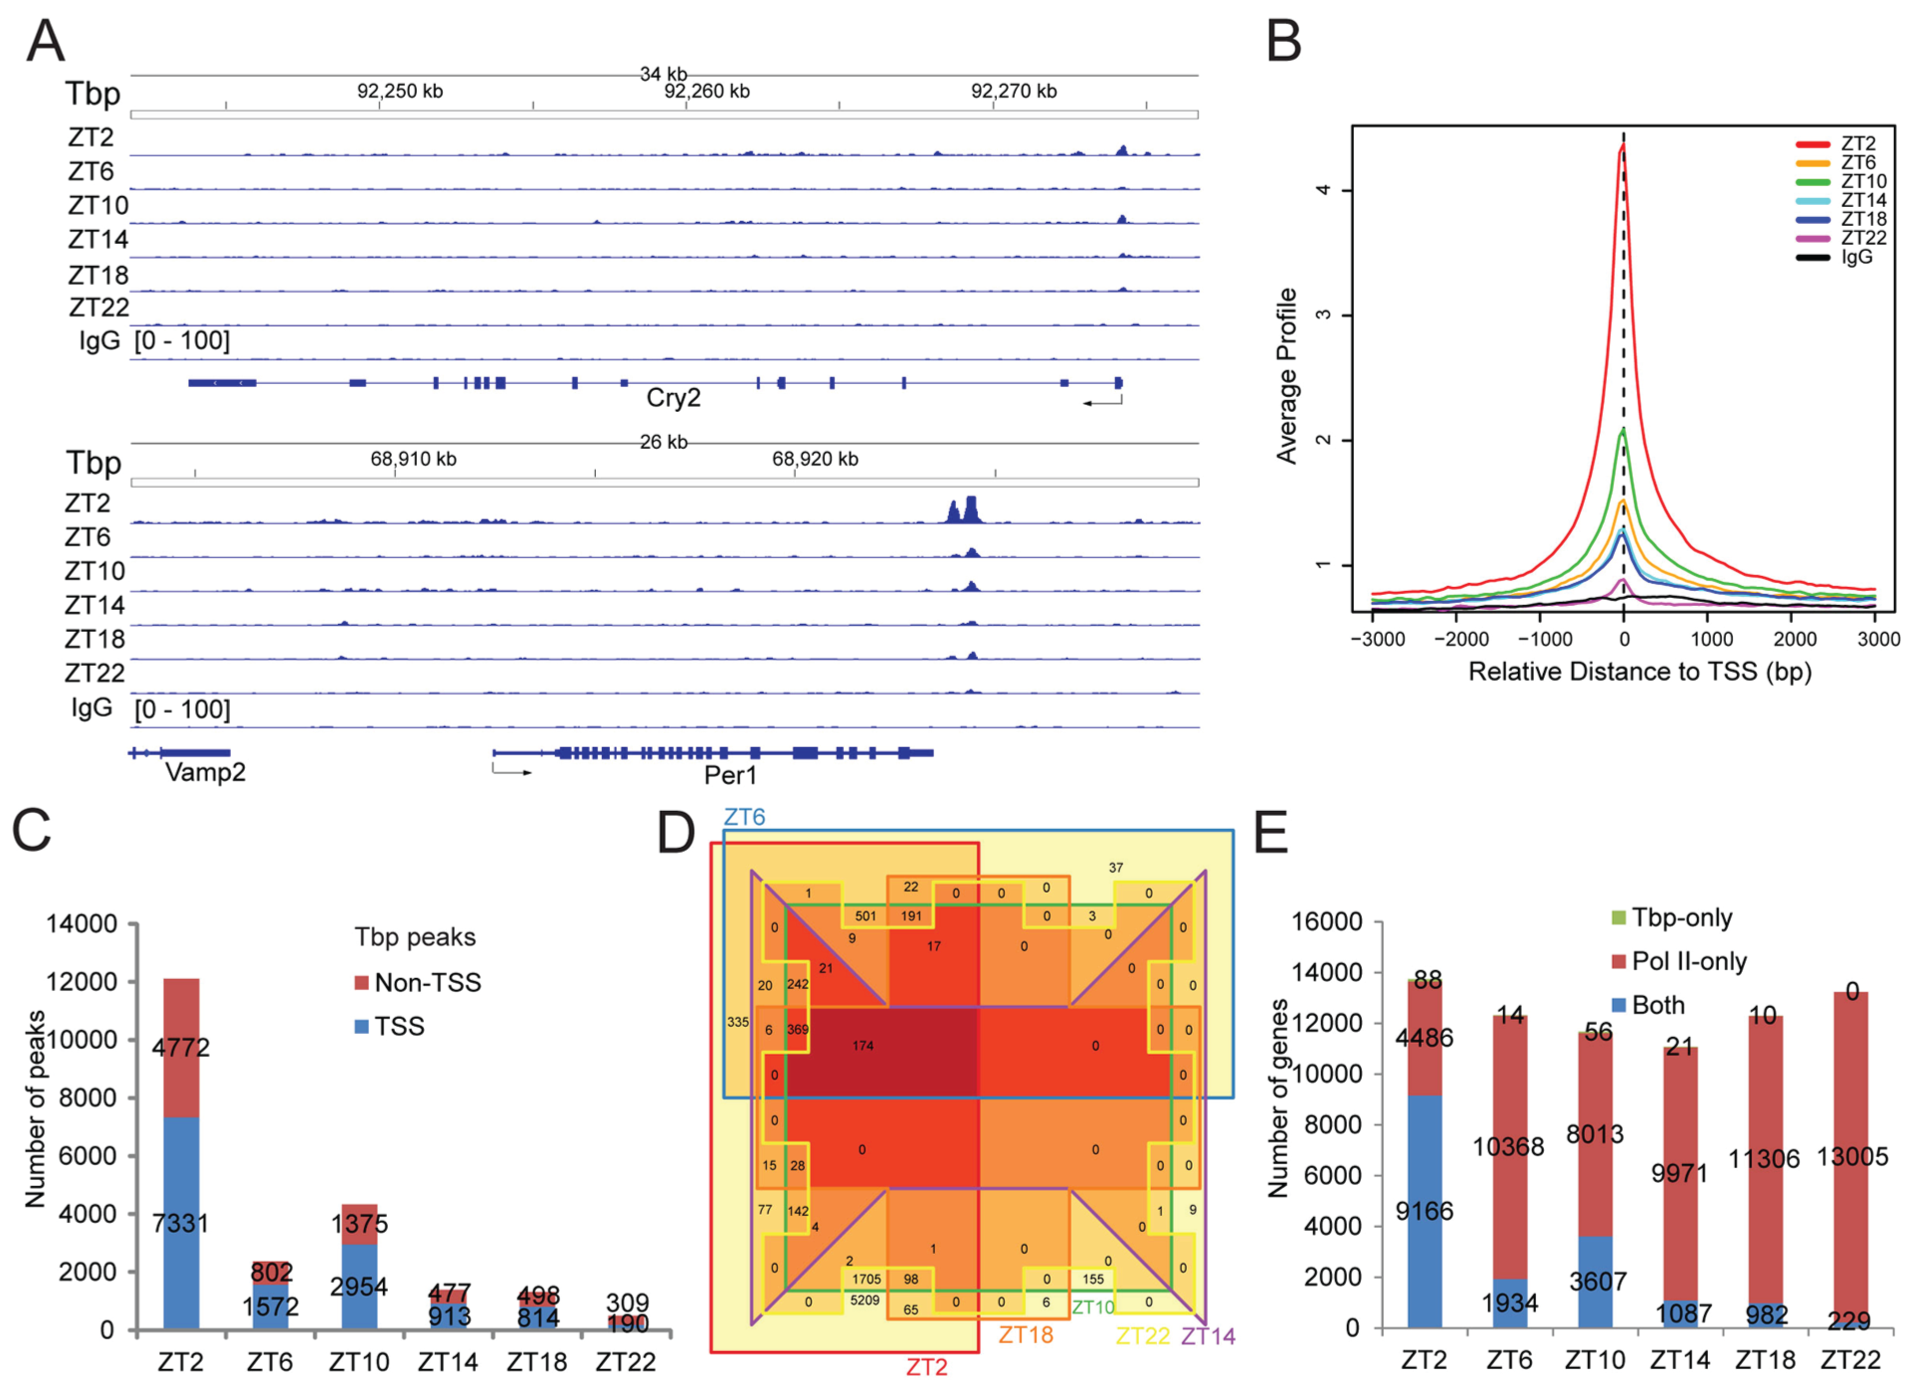
Tbp ChIP-seq results. (A) Tbp ChIP-seq results for the Cry2 and Per1 gene. Note the strong Tbp signals at the 3′-end of Per1. (B) TSS-centered (±3 kb) average Tbp binding profile. Data are normalized relative to the sample with the lowest sequencing depth. The Tbp peak is located slightly upstream of the TSS. (C) Overlap between the Tbp MACS peaks and the TSS region of genes. The Tbp peaks are classified as either overlapping with the TSS region or not. The numbers of such peaks at each time point are shown. (D) Venn diagram showing overlap among genes with TSS Tbp peaks at each of the 6 time points. Most genes with TSS Tbp peaks at other time points can be found at ZT2. (E) Overlap between genes with TSS Pol II and Tbp peaks. The numbers of genes with both TSS Pol II and TSS Tbp peaks, TSS Pol II peaks only, or TSS Tbp peaks only are shown for each time point.
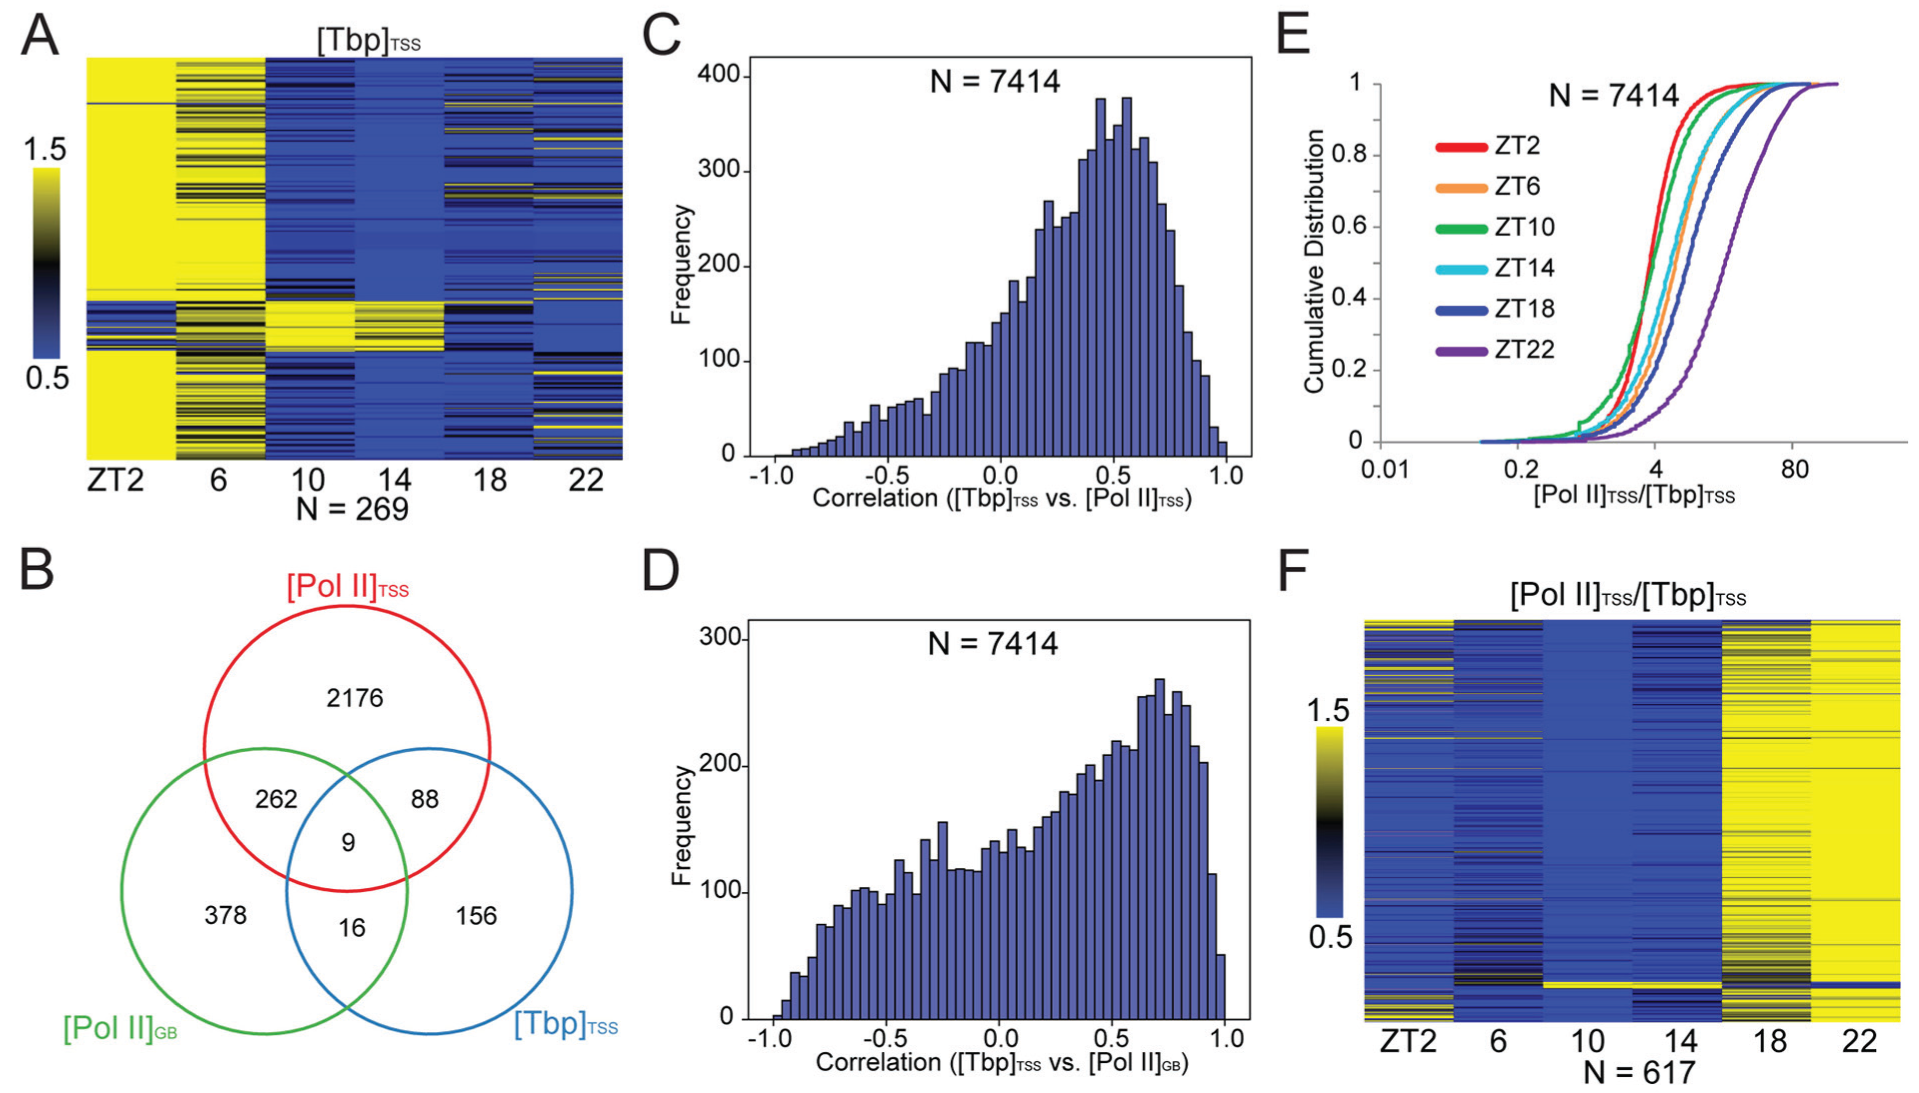
Indirect contribution of Pol II recruitment to transcriptional rhythms. (A) Analysis of the [Tbp]TSS rhythms. Left, heatmap for 269 genes rhythmic in [Tbp]TSS. (B) Venn diagram showing overlap among genes rhythmic in [Tbp]TSS, [Pol II]TSS, or [Pol II]GB. (C) Within-gene correlation between [Tbp]TSS and [Pol II]TSS across the 6 time points. (D) Within-gene correlation between [Tbp]TSS and [Pol II]GB across the 6 time points. (E) Daily changes in Pol II stability. The [Pol II]TSS:[Tbp]TSS ratios for 7414 genes are ranked at each time point and plotted against cumulative distribution. In general, values are larger at ZT22, intermediate at ZT14, and smaller at ZT2 and ZT10. (F) Heatmap for 617 genes rhythmic in [Pol II]TSS:[Tbp]TSS. For most of those genes, higher stability is found at ZT18 and ZT22, a pattern also evident in all genes (Suppl. Fig. S13).
Discussion
In this study, we showed that Pol II pausing control is involved in transcription in the mouse liver. The results provided clear evidence for separate regulation of [Pol II]TSS and [Pol II]GB and revealed global changes in Pol II TR. Our results indicate that both pause release and transcriptional termination are involved in the regulation of Pol II pausing. They modulate the effect of Pol II recruitment and shape the temporal profiles of transcription in a gene-specific manner. Our results were based on 1-cycle data of low sampling resolution and thus were statistically underpowered (Hughes et al., 2017). Additional biological replicates and/or higher sampling resolutions are required to characterize Pol II pausing more rigorously. Nonetheless, some insights can be gained from our study.
The global decrease in [Pol II]TSS and Pol II TR near ZT12 (especially at ZT14) is probably due to an increase in pause release activity at that time. Evidence in the literature supports such a scenario. During pause release, P-TEFb promotes the recruitment of PAF1 complex (Yu et al., 2015), which in turn recruits histone modifying enzymes (e.g., for H2B ubiquitination and H3K4 methylation) and the chromatin remodeler Chd1 (for +1 nucleosome turnover) (Tomson and Arndt, 2013). The level of trimethyl H3K4, a marker of transcription near TSS, peaked near CT14 (Koike et al., 2012). The level of H2A.Z, another transcription marker near TSS, also peaked at ZT14, distinct from the ZT6 peak due to maximal BMAL1 binding (Menet et al., 2014). Those results are consistent with a daily rise of Pol II pause release activity near dusk, when ~300 genes reached peak transcription according to our data. In contrast, previous studies suggested that Pol II pausing has a positive role in transcription by keeping an open chromatin state near the TSS (Gilchrist et al., 2010; Nilson et al., 2015). Indeed, our results revealed that the transcription of ~400 genes peaked near ZT0, when pause release activity was presumably low. For these genes, greater TSS Pol II accumulation appeared sufficient to increase their transcription. There were probably other genes whose transcription peaked at times beyond near ZT0 and ZT12. Thus, Pol II pausing status is temporally related to transcription in a gene-specific manner. Factors other than pause release must be involved in determining such relationships. One candidate is Pol II initiation. However, our results showed that within-gene correlation between [Tbp]TSS and [Pol II]GB over the day was gene-specific, ruling out Pol II initiation as the direct determinant of transcription output for a majority of genes. We conclude that transcription is determined in a mostly gene-specific manner, owing to the interplay among 3 factors: Pol II initiation, transcriptional termination (regulating the fraction of initiated Pol II available for pause release), and pause release (controlling the fraction of available Pol II for release into elongation). The 3 factors could act at genes with distinct temporal characteristics, resulting in gene-specific transcription output. The interplay between transcriptional termination and pause release modulates the effect of Pol II recruitment to transcription and determines the stability of initiated Pol II. ChIP-seq against pause release markers and transcriptional terminators is required to study the daily changes in premature termination and pause release at the 5′-end of genes. Inhibitors can be used to differentiate the roles of Pol II initiation and pause release in transcription. While pause release is blocked by the Cdk9 inhibitor DRB (Chodosh et al., 1989), Pol II initiation is inhibited by triptolide (Titov et al., 2011). The effects of DRB and triptolide on transcription and clock oscillation should be compared.
While we focused mainly on Tbp and Pol II signals near the TSS and/or within gene body, previous studies also revealed daily changes in enhancer activity (Koike et al., 2012; Fang et al., 2014). Enhancers are known to influence transcription through eRNA production and pause release (Kim et al., 2010; Liu et al., 2013; Schaukowitch et al., 2014). Thus, the interactions among the clock, enhancers, and core promoters ultimately regulate transcription through Pol II pausing control. In this regard, the global rhythm of Pol II pausing we revealed is intriguing and provides new perspectives on circadian rhythm generation. The contribution of pausing regulation to circadian transcription should be studied in mice bearing mutations of relevant genes. The role of the clock in Pol II pausing also needs to be characterized. Another question is how feeding, a potent regulator of gene expression in peripheral tissues (Damiola et al., 2000), is involved in Pol II pausing regulation. Given the clock-independent rhythm of mTOR activation in livers of fasted mice (Khapre et al., 2014), however, it is probably difficult to completely dissect the role of feeding in Pol II pausing regulation. It is possible that the temporal regulation of Pol II pausing in the mouse liver is an emergent feature due to the integration of clock and metabolism.
Supplementary Material
Supplementary Material, Fig-S1 – Regulation of Pol II Pausing Is Involved in Daily Gene Transcription in the Mouse Liver
Supplementary Material, Fig-S1 for Regulation of Pol II Pausing Is Involved in Daily Gene Transcription in the Mouse Liver by Jialou Zhu, Chengwei Li, Changxia Gong, and Xiaodong Li in Journal of Biological Rhythms
Supplementary Material
Supplementary Material, Fig-S2 – Regulation of Pol II Pausing Is Involved in Daily Gene Transcription in the Mouse Liver
Supplementary Material, Fig-S2 for Regulation of Pol II Pausing Is Involved in Daily Gene Transcription in the Mouse Liver by Jialou Zhu, Chengwei Li, Changxia Gong, and Xiaodong Li in Journal of Biological Rhythms
Supplementary Material
Supplementary Material, Fig-S3 – Regulation of Pol II Pausing Is Involved in Daily Gene Transcription in the Mouse Liver
Supplementary Material, Fig-S3 for Regulation of Pol II Pausing Is Involved in Daily Gene Transcription in the Mouse Liver by Jialou Zhu, Chengwei Li, Changxia Gong, and Xiaodong Li in Journal of Biological Rhythms
Supplementary Material
Supplementary Material, Fig-S4 – Regulation of Pol II Pausing Is Involved in Daily Gene Transcription in the Mouse Liver
Supplementary Material, Fig-S4 for Regulation of Pol II Pausing Is Involved in Daily Gene Transcription in the Mouse Liver by Jialou Zhu, Chengwei Li, Changxia Gong, and Xiaodong Li in Journal of Biological Rhythms
Supplementary Material
Supplementary Material, Fig-S5 – Regulation of Pol II Pausing Is Involved in Daily Gene Transcription in the Mouse Liver
Supplementary Material, Fig-S5 for Regulation of Pol II Pausing Is Involved in Daily Gene Transcription in the Mouse Liver by Jialou Zhu, Chengwei Li, Changxia Gong, and Xiaodong Li in Journal of Biological Rhythms
Supplementary Material
Supplementary Material, Fig-S6 – Regulation of Pol II Pausing Is Involved in Daily Gene Transcription in the Mouse Liver
Supplementary Material, Fig-S6 for Regulation of Pol II Pausing Is Involved in Daily Gene Transcription in the Mouse Liver by Jialou Zhu, Chengwei Li, Changxia Gong, and Xiaodong Li in Journal of Biological Rhythms
Supplementary Material
Supplementary Material, Fig-S7 – Regulation of Pol II Pausing Is Involved in Daily Gene Transcription in the Mouse Liver
Supplementary Material, Fig-S7 for Regulation of Pol II Pausing Is Involved in Daily Gene Transcription in the Mouse Liver by Jialou Zhu, Chengwei Li, Changxia Gong, and Xiaodong Li in Journal of Biological Rhythms
Supplementary Material
Supplementary Material, Fig-S8 – Regulation of Pol II Pausing Is Involved in Daily Gene Transcription in the Mouse Liver
Supplementary Material, Fig-S8 for Regulation of Pol II Pausing Is Involved in Daily Gene Transcription in the Mouse Liver by Jialou Zhu, Chengwei Li, Changxia Gong, and Xiaodong Li in Journal of Biological Rhythms
Supplementary Material
Supplementary Material, Fig-S9 – Regulation of Pol II Pausing Is Involved in Daily Gene Transcription in the Mouse Liver
Supplementary Material, Fig-S9 for Regulation of Pol II Pausing Is Involved in Daily Gene Transcription in the Mouse Liver by Jialou Zhu, Chengwei Li, Changxia Gong, and Xiaodong Li in Journal of Biological Rhythms
Supplementary Material
Supplementary Material, Fig-S10 – Regulation of Pol II Pausing Is Involved in Daily Gene Transcription in the Mouse Liver
Supplementary Material, Fig-S10 for Regulation of Pol II Pausing Is Involved in Daily Gene Transcription in the Mouse Liver by Jialou Zhu, Chengwei Li, Changxia Gong, and Xiaodong Li in Journal of Biological Rhythms
Supplementary Material
Supplementary Material, Fig-S11 – Regulation of Pol II Pausing Is Involved in Daily Gene Transcription in the Mouse Liver
Supplementary Material, Fig-S11 for Regulation of Pol II Pausing Is Involved in Daily Gene Transcription in the Mouse Liver by Jialou Zhu, Chengwei Li, Changxia Gong, and Xiaodong Li in Journal of Biological Rhythms
Supplementary Material
Supplementary Material, Fig-S12 – Regulation of Pol II Pausing Is Involved in Daily Gene Transcription in the Mouse Liver
Supplementary Material, Fig-S12 for Regulation of Pol II Pausing Is Involved in Daily Gene Transcription in the Mouse Liver by Jialou Zhu, Chengwei Li, Changxia Gong, and Xiaodong Li in Journal of Biological Rhythms
Supplementary Material
Supplementary Material, Fig-S13 – Regulation of Pol II Pausing Is Involved in Daily Gene Transcription in the Mouse Liver
Supplementary Material, Fig-S13 for Regulation of Pol II Pausing Is Involved in Daily Gene Transcription in the Mouse Liver by Jialou Zhu, Chengwei Li, Changxia Gong, and Xiaodong Li in Journal of Biological Rhythms
Supplementary Material
Supplementary Material, Table-S1 – Regulation of Pol II Pausing Is Involved in Daily Gene Transcription in the Mouse Liver
Supplementary Material, Table-S1 for Regulation of Pol II Pausing Is Involved in Daily Gene Transcription in the Mouse Liver by Jialou Zhu, Chengwei Li, Changxia Gong, and Xiaodong Li in Journal of Biological Rhythms
Supplementary Material
Supplementary Material, Table-S2 – Regulation of Pol II Pausing Is Involved in Daily Gene Transcription in the Mouse Liver
Supplementary Material, Table-S2 for Regulation of Pol II Pausing Is Involved in Daily Gene Transcription in the Mouse Liver by Jialou Zhu, Chengwei Li, Changxia Gong, and Xiaodong Li in Journal of Biological Rhythms
Supplementary Material
Supplementary Material, Table-S3 – Regulation of Pol II Pausing Is Involved in Daily Gene Transcription in the Mouse Liver
Supplementary Material, Table-S3 for Regulation of Pol II Pausing Is Involved in Daily Gene Transcription in the Mouse Liver by Jialou Zhu, Chengwei Li, Changxia Gong, and Xiaodong Li in Journal of Biological Rhythms
Supplementary Material
Supplementary Material, Table-S4 – Regulation of Pol II Pausing Is Involved in Daily Gene Transcription in the Mouse Liver
Supplementary Material, Table-S4 for Regulation of Pol II Pausing Is Involved in Daily Gene Transcription in the Mouse Liver by Jialou Zhu, Chengwei Li, Changxia Gong, and Xiaodong Li in Journal of Biological Rhythms
Supplementary Material
Supplementary Material, Table-S5 – Regulation of Pol II Pausing Is Involved in Daily Gene Transcription in the Mouse Liver
Supplementary Material, Table-S5 for Regulation of Pol II Pausing Is Involved in Daily Gene Transcription in the Mouse Liver by Jialou Zhu, Chengwei Li, Changxia Gong, and Xiaodong Li in Journal of Biological Rhythms
Supplementary Material
Supplementary Material, Table-S6_(1) – Regulation of Pol II Pausing Is Involved in Daily Gene Transcription in the Mouse Liver
Supplementary Material, Table-S6_(1) for Regulation of Pol II Pausing Is Involved in Daily Gene Transcription in the Mouse Liver by Jialou Zhu, Chengwei Li, Changxia Gong, and Xiaodong Li in Journal of Biological Rhythms
Footnotes
Acknowledgements
The authors thank Beijing Genomics Institute at Shenzhen for preparing and sequencing ChIP-seq libraries. The authors are grateful to Prof. William Pu (Children’s Hospital Boston) and Dr. Daniel Day (MIT) for sharing the Pol II TR script and Prof. Michael E. Hughes (Washington University at St. Louis) for sharing the JTK_CYCLE script. Prof. Frederick Davis (Northeastern University, Boston) provided valuable comments to the manuscript. Part of the numerical calculations in this paper were done on the supercomputing system in the Supercomputing Center of Wuhan University.
Conflict of Interest Statement
The author(s) have no potential conflicts of interest with respect to the research, authorship, and/or publication of this article.
Notes
References
Supplementary Material
Please find the following supplemental material available below.
For Open Access articles published under a Creative Commons License, all supplemental material carries the same license as the article it is associated with.
For non-Open Access articles published, all supplemental material carries a non-exclusive license, and permission requests for re-use of supplemental material or any part of supplemental material shall be sent directly to the copyright owner as specified in the copyright notice associated with the article.