
Abstract
Despite the significant advance in our understanding of the molecular basis of light entrainment of the circadian clock in Drosophila, the underlying genetic architecture is still largely unknown. The aim of this study was to identify loci associated with variation in circadian photosensitivity, which are important for the evolution of this trait. We have used complementary approaches that combined quantitative trait loci (QTL) mapping, complementation testing, and transcriptome profiling to dissect this variation. We identified a major QTL on chromosome 2, which was subsequently fine mapped using deficiency complementation mapping into 2 smaller regions spanning 139 genes, some of which are known to be involved in functions that have been previously implicated in light entrainment. Two genes implicated with the clock and located within that interval, timeless and cycle, failed to complement the QTL, indicating that alleles of these genes contribute to the variation in light response. Specifically, we find that the timeless s/ls polymorphism that has been previously shown to constitute a latitudinal cline in Europe is also segregating in our recombinant inbred lines and is contributing to the phenotypic variation in light sensitivity. We also profiled gene expression in 2 recombinant inbred strains that differ significantly in their photosensitivity and identified a total of 368 transcripts that showed differential expression (false discovery rate < 0.1). Of 131 transcripts that showed a significant recombinant inbred line by treatment interaction (i.e., putative expression QTL), 4 are located within QTL2.
How genetic variation allows organisms to adapt to their changing environments, either temporally or spatially, is a major question in evolutionary genomics. For most organisms, light is the primary environmental cue that regulates daily rhythms, by aligning the circadian clock to the 24-h light/dark cycle (LeGates et al., 2014). In the laboratory, light entrainment of the clock is often studied by light-pulse experiments, in which a brief light stimulus is presented to subjects maintained in continuous darkness (Daan and Aschoff, 2001). Most organisms, including Drosophila, respond to the stimulus by shifting their free-running rhythm to a new phase. The amount of phase shift, depicted as a phase-response curve (PRC), depends on the timing (phase), intensity, and duration of the stimulus and the light sensitivity of the subject (Johnson et al., 2003) . Many species share the same basic PRC, with early night stimuli causing phase delays and late night stimuli leading to phase advances, although the precise shape may vary between species (Johnson et al., 2003) or populations within a species (Pittendrigh et al., 1991).
Extensive research over the past 5 decades has elucidated the molecular basis of the circadian clock in Drosophila (Dubowy and Sehgal, 2017). Briefly, clock proteins PERIOD (PER) and TIMELESS (TIM) negatively regulate their own transcription via interaction with the transcription activators CLOCK (CLK) and CYCLE (CYC). This negative feedback loop drives a cyclical expression pattern in which accumulation of protein levels of PER and TIM is associated with reduced level of the mRNA (Pegoraro and Tauber, 2011). The proteins PDP1 and Vrille form a second feedback loop that drive the oscillation of Clk mRNA (Cyran et al,. 2003; Hardin et al., 2003; Zhou et al., 2016) . The protein Clockwork Orange (CWO) is another repressor of the CLK-CYC complex (Kadener et al., 2007). The transcriptional-translation feedback loops are enhanced by posttranslational mechanisms, particularly phosphorylation. This is carried out by kinases such as DOUBLETIME (DBT), Shaggy (SGG), and NEMO (Price et al., 1998; Kloss et al., 1998; Martinek et al., 2001; Chiu et al., 2011) and by phosphatases such as protein phosphatase 2A (Sathyanarayanan et al., 2004) and protein phosphatase 1 (Fang et al., 2007)
While many of the core components of the circadian clock have been identified, the extent of natural genetic variation associated with the circadian clock is largely unknown. This variation is expected to be substantial, reflecting different molecular adaptations that have evolved in wild populations in response to various environmental cues. For example, there is evidence for molecular variations in clock genes that exhibit geographical clines, following the latitudinal change of photoperiod and temperature (Kyriacou et al., 2008). Identifying and characterizing these variations are essential for understanding of the clock and its evolution.
An early study (Pittendrigh et al., 1991) showed that light sensitivity in natural populations of Drosophila auraria follows a latitudinal cline with an apparently reduced light response in northern populations. This was explained as an adaptive response to the extremely long days of the summer. Although the genetic basis for this phenotypic cline in D. auraria is still unknown, this observation indicated that genetic variation underlying this trait is present in wild populations.
Later, a natural polymorphism in the light-sensitive clock protein TIM was identified in Drosophila melanogaster (Tauber et al., 2007). A single-base insertion/deletion, situated between 2 alternative translation starts, results in 2 alleles: ls-tim allele (the insertion) produces both long and short isoforms of the protein, whereas the s-tim allele (the deletion) generates only the shorter isoform. This polymorphism follows a robust latitudinal cline and is maintained by directional selection. Light pulse experiments have indicated that ls-tim flies are less light responsive than flies carrying s-tim (Sandrelli et al., 2007).
Quantitative trait loci (QTL) mapping is a popular approach for identifying loci that underlie phenotypic variation of a complex trait. Attempts to map circadian traits by QTL mapping have been previously made in plants (Darrah et al., 2006; Michael and McClung, 2003), mice (Yoshimura et al., 2002), and fungi (Kim et al,. 2007), but not in Drosophila. The available powerful tools for fly genetics, and its compact genome, offer a rapid means to move from an identified QTL to a specific gene and the underlying polymorphism (Mackay, 2001). The current study was aimed at identifying QTLs for circadian photo sensitivity and isolating the underlying candidate genes.
Materials and Methods
Mapping Population
A set of 123 recombinant inbred lines (RIL) were randomly selected from a larger population of 300 RIL previously described (Bergland et al., 2008). This panel was generated from 2 isofemale lines from a wild population in Winters, California, collected in 2001. These parental lines were made isogenic by inbreeding and were used for generating 500 isogenic lines, which were crossed with each other for 15 generations. This was followed by full sib crossing for 15 generations, resulting in the RIL panel.
The lines were maintained in vials of yeast-sucrose-agar medium under ~70% relative humidity, at either 18 °C or 25 °C and 12h:12h light cycle.
Light Pulse Experiment
The locomotor activity of the flies was measured using the DAM2 Drosophila monitors (Trikinetics Inc., Waltham, MA). Single flies were placed in glass tubes (10 cm × 0.5 cm) that were filled with 2 cm sugar/agar medium. The monitors were placed in an incubator at 25 °C, ~70% humidity. The flies were entrained to a light-dark cycle (LD 12:12) for 4 d and then allowed to free run for 3 d in constant darkness (DD). This entrainment regime (4 d LD, 3 d DD) was repeated with the same set of flies in the following week but with a 20-min light pulse at ZT 15 at in the last dark phase of the LD cycle. The light pulse (1500 lux) was delivered by 2 fluorescent lamps (Philips MCFE 20W/35) mounted behind a diffuser.
For each fly, the phase difference between the reference phase (second day DD, offset of locomotor activity bout) and the offset of the second day in DD after the 20-min light pulse was taken as the phase delay. Note that by the second day, all flies complete their phase shift (Suri et al., 1998). The reference and the response phases were determined manually by visual inspection of each fly activity profile.
QTL Analysis
The broad sense heritability (h2) for the RIL population and the genome scans for QTL were performed using composite interval mapping (CIM; Zeng et al., 1999) and multiple interval mapping (MIM) in Windows QTL Cartographer version 2.5 program (WinQTLCart; Wang et al., 2007) . The threshold value for the CIM analysis was determined at the 5% level of 1000 permutations (Churchill and Doerge, 1994). The confidence intervals (95%) for the QTL were determined by identifying the region in which the log of odds (LOD) score is within 1.5 of its highest peak, and markers spanning the QTL as determined from the map were used. The cytological positions and the putative genes were estimated using the markers’ physical location from Ensembl release 56 and the FlyMine database (Lyne et al., 2007).
Complementation Tests
A total of 11 deficiency stocks spanning QTL 2 (22B1-25B1) and QTL 3 (71E1-79A1; obtained from Bloomington Drosophila Stock Centre, see Suppl. Table S1) were used to fine map these QTL intervals. Two RI lines, RIL 104 and RIL 58, which showed high and low light response, respectively, were chosen for further analysis of the QTL as the parental lines were not available. In addition to their difference in light response, these lines also showed a close resemblance to the parental genotypes along the QTL regions. Males from RIL58 and RIL104 were crossed with virgin females from each of the deficiency lines, resulting in 4 F1 genotypes: 58/Df, 58/Bal, 104/Df, and 104/Bal, where Df and Bal refer to deficiency and the balancer chromosomes, respectively. A 2-way analysis of variance (ANOVA) was carried out using the RIL (L) and the genetic background (G), which were treated as fixed effects. Quantitative failure to complement the QTL alleles is inferred when the interaction of the 2 factors (L × G) is significant. Specifically, we required that difference in mean light response between the genotypes 58/Df 104/Df would be significantly greater than that between 58/Bal 104/Bal.
Complementation tests were also carried out using y1 w; Thor2, w; tim01, w; cyc01 and clkJRK strains (all within the QTL). Crosses were performed as described above but using the mutant strain and w1118 instead of the Df and the balancer chromosome. It should be noted that in both cases, the genetic background is not identical across the four genotypes that were compared in each test. For example, the 58/Bal and 58/Df differ in their overall background, so phenotypic differences may be due to loci outside the deletion. Thus, a statistically significant interaction could also be due to various epistatic interactions involving other loci (Service, 2004) and may lead to false-positives.
Sample Collection for Transcriptomics
Five-day posteclosion males from RIL58 and RIL104 were entrained to 4 LD cycles. Flies were then split into two groups: one presented with a light pulse for 30 min at ZT 15 and a control group kept in the same conditions without the pulse. Flies were collected at ZT 16.5 and flash frozen in liquid nitrogen under red light. Two independent replicates were prepared per condition, totaling 8 samples: 2x lines (L) × treatments (T) × 2 replicates. Total RNA was isolated from fly heads using Invitrogen TRIzol reagent in accordance with the company protocol. RNA concentration was determined using NanoDrop 2000 (Thermo Scientific, Waltham, MA), and sample quality was assessed by the Agilent 2100 Bioanalyzer (Agilent Technologies, Santa Clara, CA) according to the manufacturers’ protocols.
cDNA Samples Processing
Invitrogen superscript plus indirect cDNA kit was used to generate fluorescently labeled cDNA from 35 µg total RNA according to the manufacturer’s protocol (Invitrogen, Carlsbad, CA). The purification and quantification were done as recommended by the Invitrogen protocol. The purified Alexa 555 and Alexa 647 labeled cDNA were hybridized to Drosophila Oligo 14Kv1 array (Canadian Drosophila Microarray Centre) according to University Health Network Microarray Centre amino-allyl (indirect) labeling protocol. The array slides were scanned on Molecular Devices’ GENEPIX 4000 microarray scanner.
Data Processing and Statistical Analysis
The data were normalized and processed by the Limma package (Ritchie et al., 2015) using the R software (R Development Core Team, 2010). The data were corrected for background intensities and normalized across each slide using the print-tip loess method (Yang et al., 2001). Differential expression was assessed using a linear model and Bayesian fit that generated the moderated t-statistics (Smyth, 2004). The analysis implemented the pooled correlation method to make full use of the duplicate spots on the slide (Smyth et al., 2005). Because our main focus is components of the central pacemaker, the data were filtered to include only genes that are expressed in the brain (FlyAtlas mRNA signal >10). We also filter transcripts that show a fold change of log2FC ≥ 0.1. The p values were adjusted using the Benjamini and Hochberg false discovery (FDR) method (Benjamini and Hochberg, 1995). Analysis of enriched gene ontologies (GO terms) among differential expressed genes was carried out using the FlyMine Database (Lyne et al., 2007). To carry out analysis of regulatory motifs enrichment, a 2-kb upstream sequence was extracted from each candidate gene using BioMart, a data-mining tool from Ensembl (Aken et al., 2017). We used the AME algorithms (McLeay and Bailey, 2010), implemented in the MEME suite (Bailey et al., 2009) to search and identify enriched motifs.
Results
The RI lines exhibited extensive variation in the magnitude of the phase response to the light pulse, ranging from −1.9- to −5.5-h delays (Fig. 1), and the difference between the strains was statistically significant: Kruskal-Wallis, H(123) = 288.18, p = 0.001. The estimation of the broad-sense heritability (h2) for the RIL population was 0.3, suggesting a moderate genetic component for light response in this population.
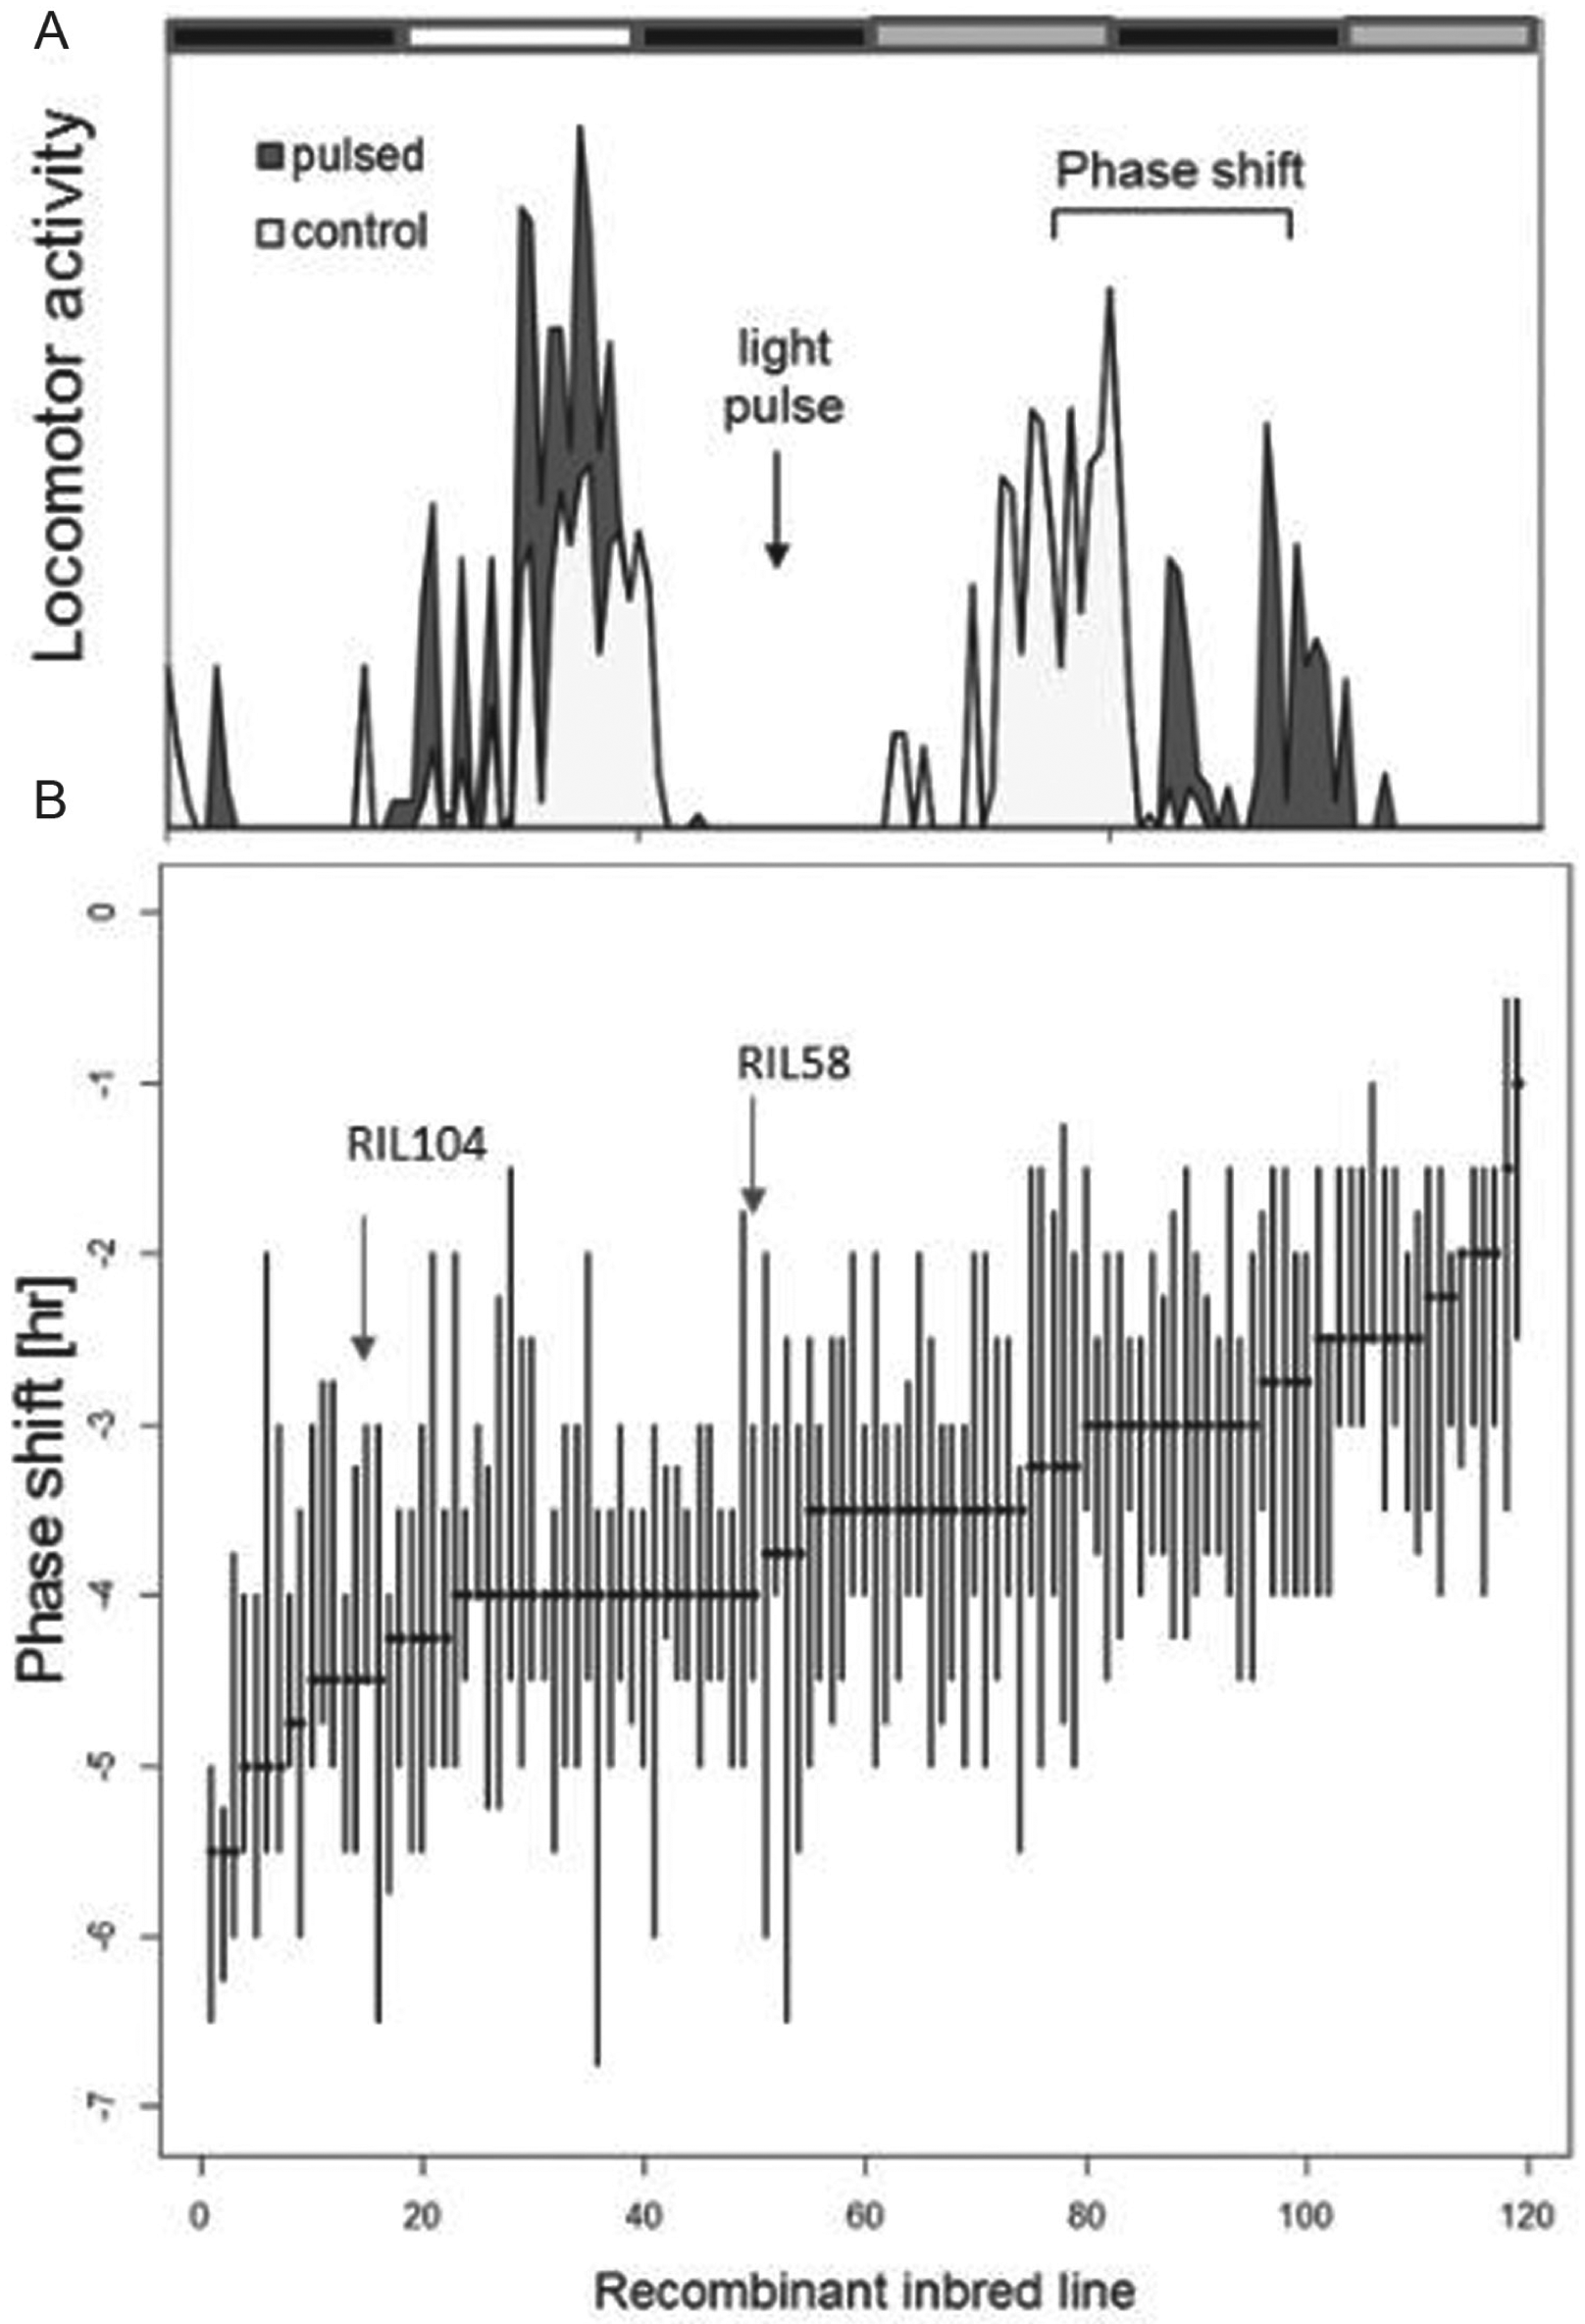
Variation in circadian photosensitivity among recombinant inbred (RI) lines. (A) Diagram showing 2 d of locomotor activity rhythms for a population of flies that were treated by a light pulse at ZT 15 (pulsed) and a nontreated control group. Upon light pulse, the subsequent activity is delayed. The delay interval (bracket) represents the phase delay. (B) The phase delay response to early light pulse is shown for each of the 123 RI lines. The median and 25 to 75 percentiles are plotted (20-30 males each line).
We used CIM to identify QTL underlying circadian photosensitivity in the RI lines. One significant QTL was detected with an LOD score of 2.4 (Fig. 2), and 3 additional suggestive QTLs were indicated by MIM (Fig. 2; Suppl. Table S2). Together, these QTL explained 30% of the variation in delay response, with the major QTL (QTL2) explaining 12% of the total phenotypic variation observed for this trait. This QTL is located on the left arm of second chromosome (22C1-25A3) and spans a genomic region of about 2600 kb, encompassing 316 genes. The QTL on the X chromosome (cytological bands 10C7-11B12) explains 7.1% of the overall variation. The other 2 QTLs are located on the same arm (L) of the third chromosome (72A1-78D4 and 62D4-66D12) and account for 4.7% and 6.6% of the variation, respectively. There was no evidence for any epistatic effect.
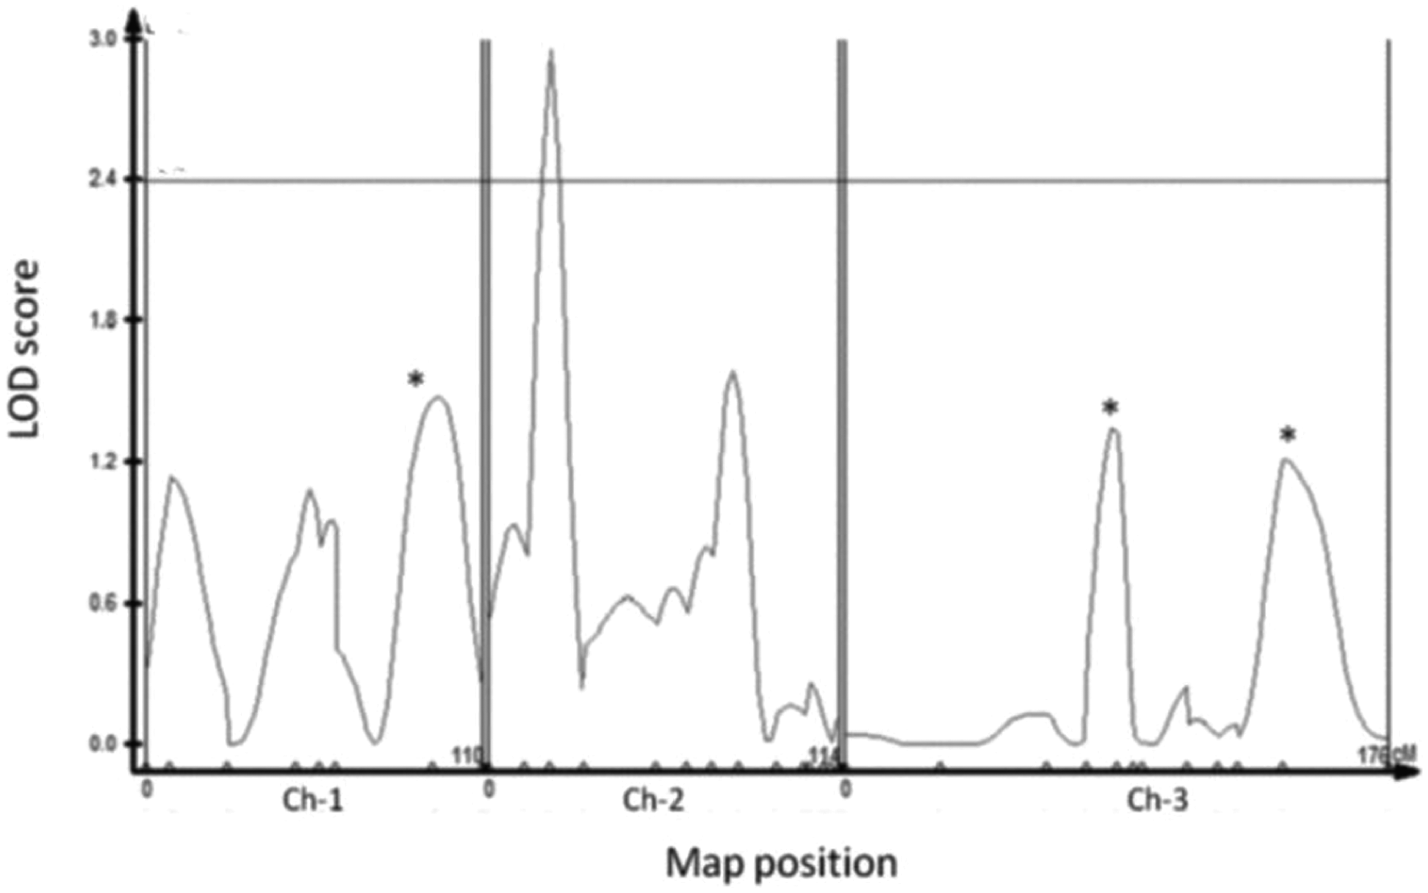
Composite interval mapping of quantitative trait loci (QTL) for circadian light sensitivity. Log of odds scores and significant thresholds plotted against chromosome location for phase shift response. The horizontal line represents the threshold level (p = 0.05) determined by 1000 permutation tests. The marker position is shown on the x-axis. The vertical lines separate chromosomes. Asterisks indicate additional QTL that were suggested by multiple interval mapping.
Of the 10 deficiencies that were tested, 2 failed to complement the QTL alleles (Suppl. Table S3). These were Df3133 (22A3-22E1) in QTL2 and Df6411 (74D3-75B5) in QTL3 region (Fig. 3). Additional quantitative complementation tests were performed using mutant strains of 3 known clock genes, tim, cyc, and Clk, which reside in the QTL. A mutant for the gene Thor, which has also been recently implicated in clock function (Nagoshi et al,. 2010), was also tested. Two of these mutants, tim0 and cyc0, failed to complement the QTL phenotype, while no significant interaction was found for Clkjrk and Thor2 (Fig. 3).
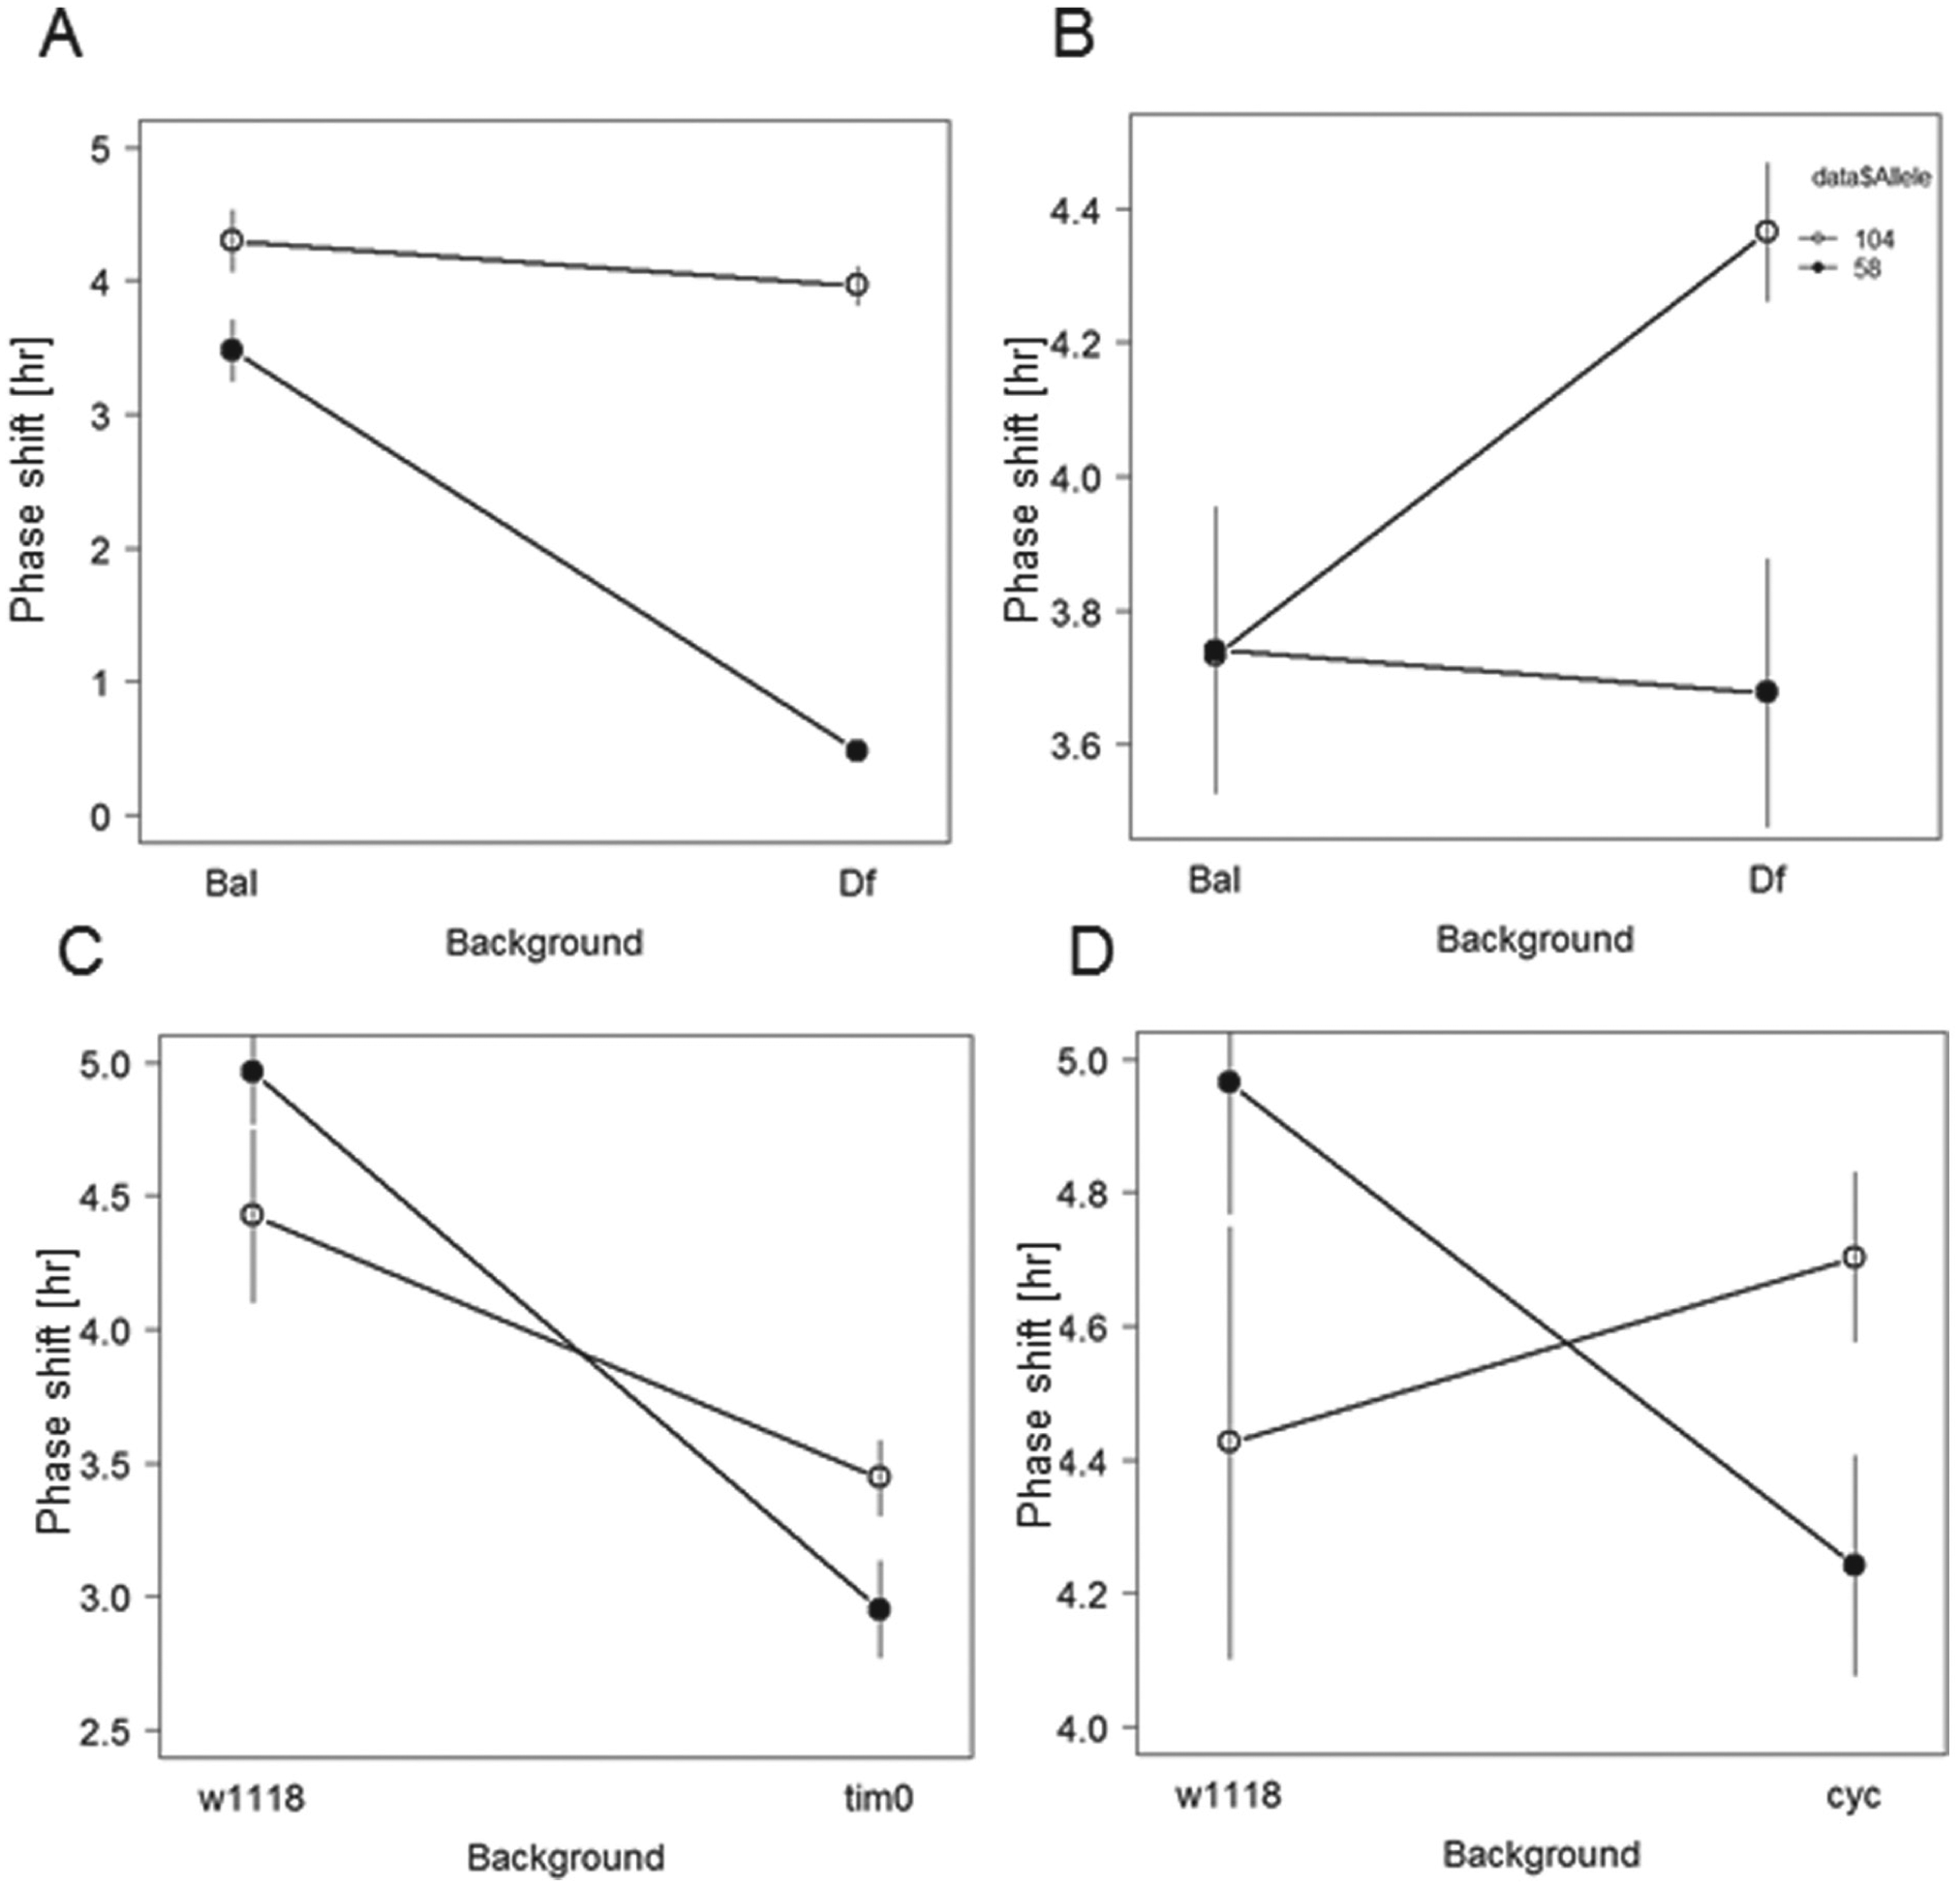
Quantitative complementation to deficiency strains. Interaction plots are shown for RIL58 (filled circles) and RIL104 (open circles) crossed with deficiency strains (A) 6411 and (B) 3133, which showed a significant genotype × line interaction effect (see text). At the bottom are complementation tests using (C) tim0 and (D) cyc0 null mutants. Error bars represent the standard error of the mean. The sample size of each genotype ranged from 18 to 32 flies.
Since the complementation tests suggested that variation in tim contributes to the major QTL2, we tested whether the previously published ls-tim polymorphism segregates in the RIL by genotyping 66 randomly selected lines. Supplementary Figure S1 shows that both alleles segregate in the RI strains and that s-tim flies responded to light with significantly longer delays than ls-tim flies (median delays of −4.0 vs. –3.3, Mann-Whitney U = 267, df = 64, p < 0.0001). The RIL104 flies with the longer delay carry s-tim, while RIL58 (less light sensitive) was ls-tim, consistent with the known photosensitivity of these alleles (Sandrelli et al., 2007).
In another set of experiments, we used microarrays to examine the gene expression of RIL58 and RIL104 following a light pulse at ZT 15. Variation in transcriptional response to light between these 2 lines may represent expression QTL (eQTL), which could be either cis-eQTL (QTL mapped to the location of the expressed gene) or tran-eQTL (QTL is mapped far from the expressed gene).
We profiled gene expression at ZT 16.5, as this time point has been previously used for capturing early expression response to light stimulus (Adewoye et al., 2015). The current experiment also revealed an extensive differential expression in both lines, comparing flies that received a light pulse to flies that did not (Fig. 4). At the level of FDR < 0.1, there were 184 differentially expressed genes (DEG) in RIL58 and 284 DEG in RIL104 (Suppl. Table S4). There was substantial difference between the GO terms that were enriched by each of the strains: the top terms in the RIL58 list included regulation of cell cycle (p < 0.001), cellular component assembly, as well as protein localization and cytoskeleton-dependent intracellular transport (Suppl. Table S5). In RIL104, the top GO terms were associated with metabolic processes involving galactose, lipids, and other metabolites. There were 42 overlapping DEG between the 2 RILs (Suppl. Table S6), none of which has been previously implicated in light response of the clock. GO analysis of these overlapping genes represented a broad range of biological processes, including metal ion binding (CG10889, msl-2, cg5196), voltage-gated ionic channel activity (shaw), and ATP binding (pll, sun, grp).
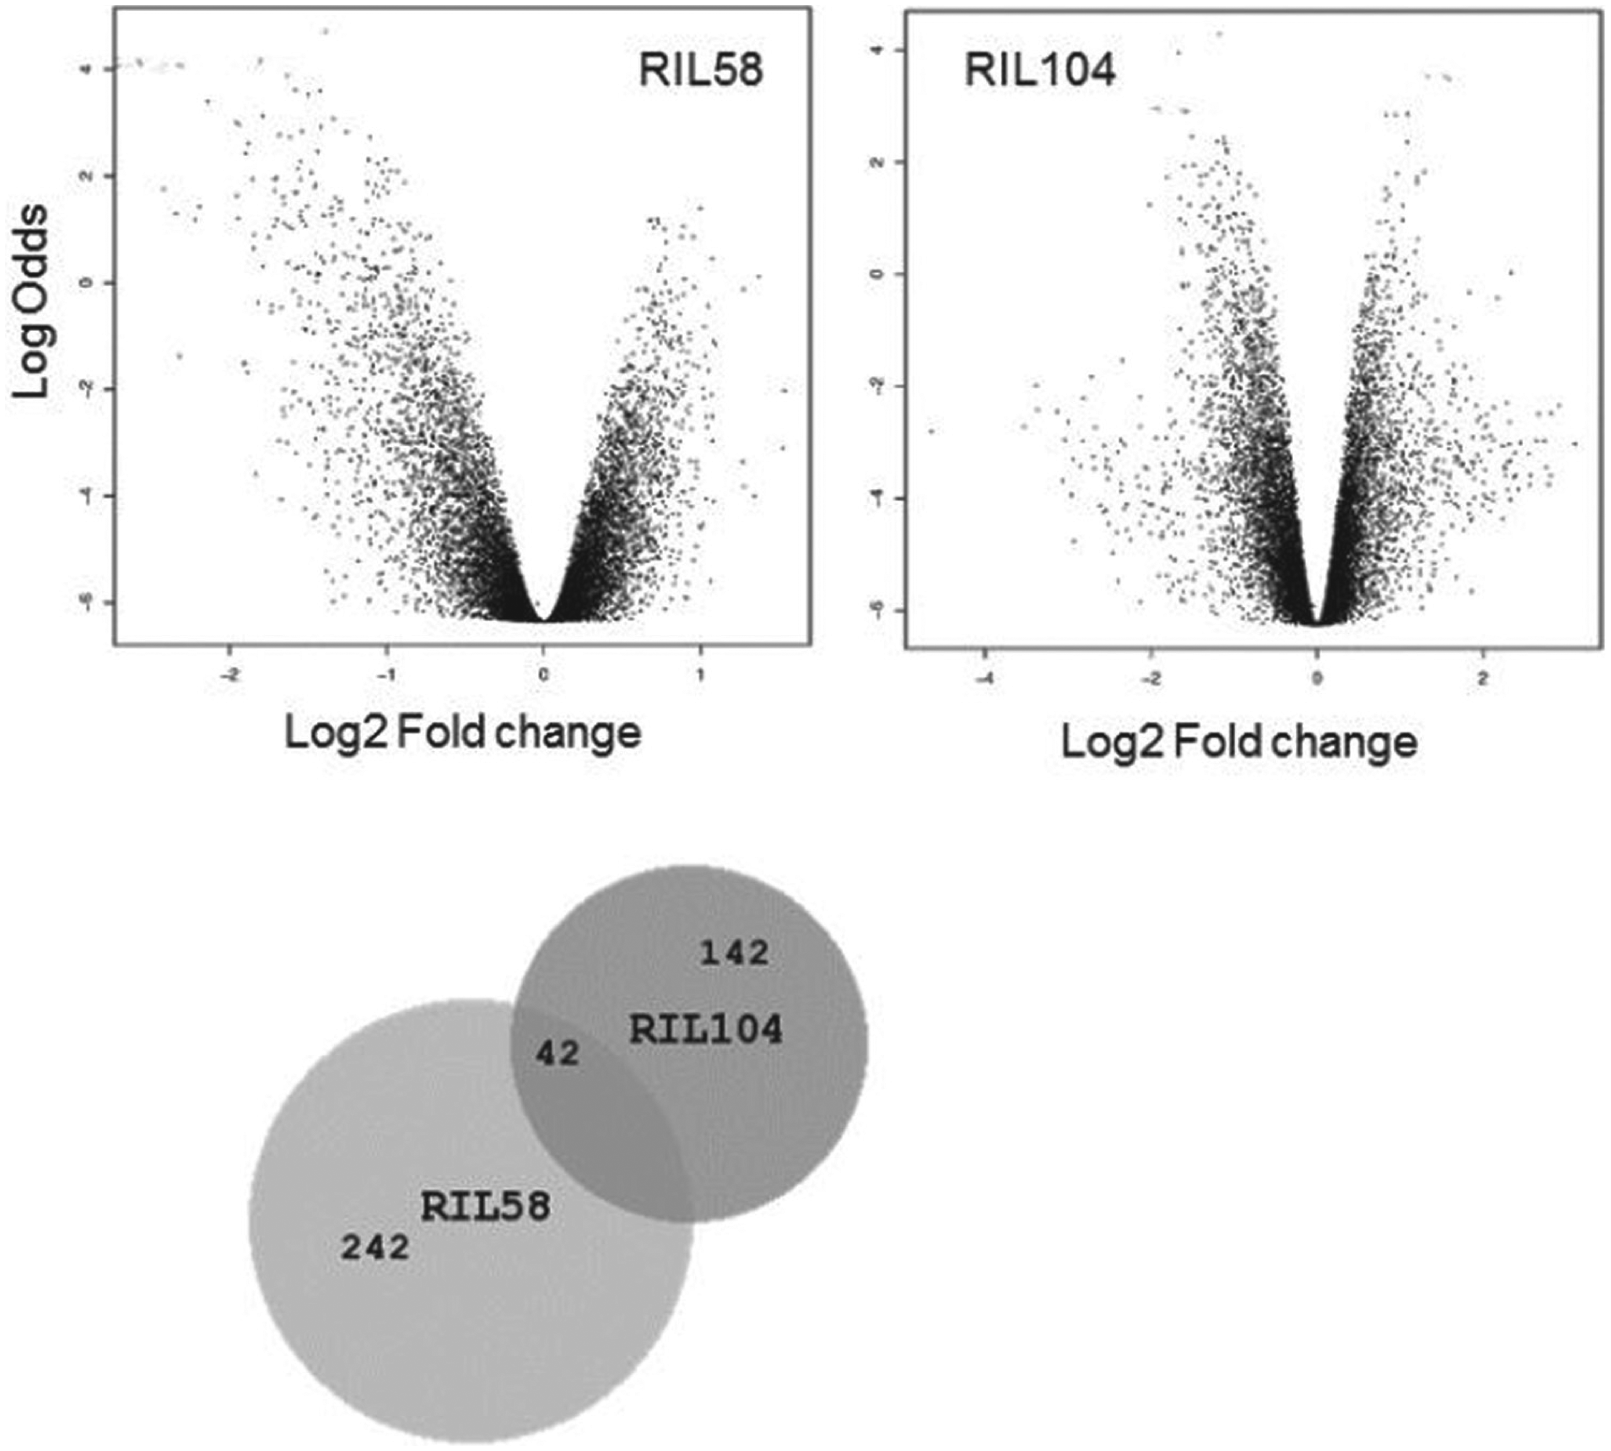
Differential expression induced by light in recombinant inbred (RI) strains. Volcano plots of differential expression of RIL58 transcripts (left: 160 down-regulated and 25 up-regulated with light pulse) and RIL104 transcripts (right: 118 down-regulated and 56 up-regulated with light pulse). The empirical Bayes log-odds of differential expression are plotted against log2 fold change. Positive fold change represents up-regulation of transcript in the light-pulsed samples compared with the controls.
To identify eQTLs, we tested for genes that show significant difference in their expression between the 2 RILs strains (i.e., treatment: strain interaction; Suppl. Table S7). Of 131 transcripts that showed significant interaction (p < 0.001), 4 are located within QTL3 and could therefore may be considered as cis-QTLs. These were CG32189, Tsp74F (a membrane component), CG5577 (phosphatase and dephosphorylation activity), and CG7510 (intracellular signal transduction and transmembrane transport). All 4 loci are located within the Df6411 deficiency that failed to complement in the complementation test.
We have also analyzed the upstream sequences of the 131 candidate genes and searched for enrichment of regulatory motifs. There were 32 motifs that showed a significant enrichment (adjusted p-value <0.05; Suppl. Table S8). None of the 32 transcription factors is located within the deficiency intervals that failed to complement. Interestingly, one of the top enriched transcription factor motif Bab1 was previously associated with CLK/CYC targets (Meireles-Filho et al., 2014). Another interesting enriched motif is CF2, which is a transcription factor that regulates the microRNA mir-276a and has been recently shown to alter expression of tim in clock neurons (Chen and Rosbash, 2016).
Discussion
Although light entrainment of the clock is a pathway that has been extensively studied, little is known about the genetic variation associated with its components. This type of information, which is addressed by QTL analysis is essential for understanding the evolution and the adaptive potential of this system. QTL studies of circadian photosensitivity were previously carried out in mammals. For example, Yoshimura and colleagues (2002) crossed the retinally degenerated mice strains C57BL/6J and CBA/J (both homozygous for the mutation rd) that differed greatly in their phase response. They identified 5 QTLs on 3 different chromosomes, suggesting that multiple loci contribute to variation in light sensitivity, although no obvious candidate genes (e.g., photopigments) were mapped to these QTLs. Here, we have carried a QTL analysis of circadian photosensitivity in Drosophila and identified a single major QTL in chromosome 2 (Fig. 2).
However, the evidence suggests that additional loci also contribute to photosensitivity variation. For instance, within the QTL2 interval, the 3133 deficiency that failed to complement the natural alleles does not span the tim locus, indicating that this large QTL interval may fractionate into multiple linked QTLs. In fact, the relatively small sample size used here (123 RILs) might have led to the Beavis effect (Beavis, 1998), where loci that failed to be detected due small power contribute to size inflating and bias of the estimated proportion of the genetic variance explained by the nearest QTL.
An additional 3 QTLs were suggested by the MIM algorithm. The fact that the cyc locus is located within one of these QTLs (QTL3) and was implicated in the complementation tests provided further evidence that these additional QTLs may indeed contribute to the variation in light sensitivity.
The peak of the LOD of QTL2 coincides with the genomic position of timeless and the ls-tim polymorphism that has already been shown to be involved in natural variation in light-sensitivity and contributes to phenotypic variation that we observe here among the RIL. Besides demonstrating that the ls-tim SNP is a major component of the genetic architecture of this trait, the analysis of our RIL (from a population in Winters, CA) indicates that this variation, which has emerged in Europe, is also segregating in North American populations. Indeed, our recent survey of American populations (Pegoraro et al., unpublished data) shows that new ls-tim allele is present and follows a latitudinal cline, although this spatial pattern could reflect a demographical processes rather than natural selection, similar to the situation in Europe (Tauber et al., 2007).
QTL2 encompasses other loci worth noting for future research. Lilliputian (lilli) encodes a nuclear protein related to mammalian Fragile-X–Mental Retardation 2 protein FMR2 (Tang et al., 2001). The mammalian fmr1/fmr2 has been shown to play a significant role in circadian function of the peripheral clock, possibly through its defect in neuronal communication (Zhang et al., 2008). Similarly, Drosophila null mutations of the Fmr1 are reported to alter circadian output with no detectable effect on the function of the central pacemaker (Inoue et al., 2002). Interestingly, Fmr1 was shown to be differentially expressed in response to light stimulation in a microarray study using Canton-S strain (Adewoye et al., 2015). In addition, LILLI has been shown to act as a dominant suppressor of activated MAPK pathway phenotypes (Dickson et al., 1996). The MAPK pathway has been reported to be activated by light, suggesting that its activation is vital for circadian light entrainment (Obrietan et al., 1998), and this signaling pathway has also been shown to mediate the function of PDF in Drosophila (Williams et al., 2001). Another gene of interest that is located within the QTL2 interval is Shaw, a member of the Shaker family encoding a voltage-gated K+ channel, which triggers hyperpolarization of neurons upon activation. Misexpression of Shaw in clock neurons, particularly the dorsal neurons (DNs), results in disruption of the clock output and accumulation of PDF in projections of the ventral lateral neurons (LNv; Hodge and Stanewsky, 2008). Interestingly, Shaw also showed a significant differential expression in response to light in both RIL58 and RIL104, although the similar transcriptional response in both loci rules out this gene as an expression QTL for this trait.
The substantial transcriptional variation revealed by the microarray experiments suggested that variation in a large number of genes is associated with this phenotype (Fig. 3). However, the overlap between the differential expression (total of 368 DEG) was rather modest (42 genes, 11%), which might be due to the rather limited power of the experiment (only 2 replicates per experiments). Alternatively, and not mutually exclusive, the lack of overlap suggests that the response to light evolves through different mechanisms that are highly dependent on the genetic background. This may also explain the little overlap with the light response of the Canton-S strain that has been previously studied (Adewoye et al., 2015). Only a single transcript, sticks and stones (sns), was shared between the RILs and the Canton-S lists (Supplementary Material). Interestingly, SNS was shown to be involved in the morphogenesis of the compound eye (Bao et al., 2010). The difference in the microarray platforms used here (spotted cDNA) and in the previous study (Affymetrix oligonucleotide microarrays) is likely to be an additional factor contributing to the differences between these studies.
Although tim (and cry) serve as a prominent light input for clock entrainment, it is clear that additional independent light inputs exist (Yoshii et al., 2015). These include 3 external photoreceptor organs, the compound eyes, the ocelli, and the Hofbauer-Buchner eyelets. Clearly, each of these inputs may involve a plethora of proteins that might be targeted by natural selection. For example, it was shown that the compound eyes are essential for light entrainment under long days (Rieger et al., 2003), as well as for mediating moonlight response (Schlichting et al., 2014), a response that implicates light-sensing rhodopsins Rh1 and Rh6. A recent study (Hilbrant et al., 2014) demonstrated natural variation in rhodopsin expression (presumably reflecting variation in ommatidia patterns), which potentially may give rise to phenotypic variation in light entrainment of the clock. Although none of the rhodopsins were included in our DEG lists, one of the genes that shows significant difference (i.e., RIL × treatment interaction) was ninaA, a gene that encodes cyclophilin, which transports opsins from the endoplasmic reticulum to the membrane. ninaA itself exhibits daily expression oscillation both in Drosophila (Ueda et al., 2002) and in 2 mosquito species (Rund et al., 2013).
Although the Drosophila PRC shows similar phase delay and advance responses (Li and Rosbash, 2013), the candidate genes we identified here for phase delay may be different from those involved in phase advance, reflecting different molecular mechanisms. For example, spectral composition of ambient light changes throughout the day and was shown to be significant for light entrainment in birds (Pohl, 1999), fish (Pauers et al., 2012), and mammals (Walmsley et al., 2015). Thus, it is possible that during light pulse, different photoreceptor populations are being activated in delay and advance zones, respectively. Furthermore, it was suggested that the delay and advance responses are mediated by separate neural networks (Tang et al., 2010). A recent study using thermogenetics to activate different clock neuron clusters (Eck et al., 2016) showed that depolarization of the s-LNvs induced only phase advances, while stimulation of the LNds and the PDF-positive l-LNvs generates phase delays. Thus, variation in circadian photosensitivity may also be due to variation in the wiring of the clock neurons, which in turn might be due to genetic variation in developmental genes that drive the cellular connectivity of the clock. Although expression analysis has been a popular way for identifying genes underlying QTLs, the approach has its own limitations (Verdugo et al., 2010). For instance, no significant gain is achieved by combining QTL/microarrays, and more importantly and often overlooked is the fact that transcriptional variation captures only a fraction of the genetic variation, as many genetic variations affect expression posttranscriptionally or posttranslationally. The polymorphism in timeless is a particularly apt example, since the ls/s tim polymorphism is not manifested at the transcriptional level but rather translationally. In addition, we note that only a small fraction of DEGs that are induced by light may be in the QTL since a single transcription factor with a QTL may regulate many distant genes (i.e., trans-eQTL).
Nevertheless, our study has generated a large number of candidate genes that may contribute to genetic variation in circadian photosensitivity, and the new genomic resources that have been recently made available, such as the Drosophila Synthetic Population Resource (DSPR; Long et al., 2014), the Drosophila Genome Research Panel (DGRP; Mackay et al., 2012), or the Drosophila Genome Nexus would allow finer mapping of variations associated with these genes.
Footnotes
Acknowledgements
We would like to thank Dr. Christopher Talbot and Dr. Anne Genissel for their QTL mapping advice. We also thank the 2 anonymous reviewers whose comments and suggestions helped improve and clarify this article. This work was funded by a BBSRC grant BB/G02085X/1 to E.T.
Conflict of Interest Statement
The author(s) have no potential conflicts of interest with respect to the research, authorship, and/or publication of this article.
Supplementary material is available on the journal’s website at http://jbr.sagepub.com/supplemental. All microarray data used in this study have been deposited in GEO (![]() ) under accession number GSE77116.
) under accession number GSE77116.
References
Supplementary Material
Please find the following supplemental material available below.
For Open Access articles published under a Creative Commons License, all supplemental material carries the same license as the article it is associated with.
For non-Open Access articles published, all supplemental material carries a non-exclusive license, and permission requests for re-use of supplemental material or any part of supplemental material shall be sent directly to the copyright owner as specified in the copyright notice associated with the article.