
Abstract
Older adolescents are particularly vulnerable to circadian misalignment and sleep restriction, primarily due to early school start times. Light can shift the circadian system and could help attenuate circadian misalignment; however, a phase response curve (PRC) to determine the optimal time for receiving light and avoiding light is not available for adolescents. We constructed light PRCs for late pubertal to postpubertal adolescents aged 14 to 17 years. Participants completed 2 counterbalanced 5-day laboratory sessions after 8 or 9 days of scheduled sleep at home. Each session included phase assessments to measure the dim light melatonin onset (DLMO) before and after 3 days of free-running through an ultradian light-dark (wake-sleep) cycle (2 h dim [~20 lux] light, 2 h dark). In one session, intermittent bright white light (~5000 lux; four 20-min exposures) was alternated with 10 min of dim room light once per day for 3 consecutive days. The time of light varied among participants to cover the 24-h day. For each individual, the phase shift to bright light was corrected for the free-run derived from the other laboratory session with no bright light. One PRC showed phase shifts in response to light start time relative to the DLMO and another relative to home sleep. Phase delay shifts occurred around the hours corresponding to home bedtime. Phase advances occurred during the hours surrounding wake time and later in the afternoon. The transition from delays to advances occurred at the midpoint of home sleep. The adolescent PRCs presented here provide a valuable tool to time bright light in adolescents.
Over the course of adolescence (second decade of life), sleep-wake timing shifts later. Cross-sectional and longitudinal studies find later bedtimes on both school and nonschool nights and later wake-up times on nonschool or vacation mornings as youngsters age (Wolfson and Carskadon, 1998; Laberge et al., 2001; Giannotti et al., 2002; Wolfson et al., 2003; O’Brien and Mindell, 2005; Yang et al., 2005; Crowley et al., 2007; Randler, 2008; Sadeh et al., 2009; Crowley et al., 2014). This shift toward “eveningness” occurs from about age 10 to 20 years (Roenneberg et al., 2004) and is linked to pubertal development (Carskadon et al., 1993; Frey et al., 2009). The delay in sleep timing is associated with environmental factors that can displace sleep (e.g., part-time work, homework, television-watching, or other technology use [Carskadon, 1989-1990; Van den Bulck, 2004; Gradisar et al., 2013; Misiunaite et al., 2016]), but also with changes to the homeostatic sleep (Jenni et al., 2005) and circadian timing systems (Carskadon et al., 1997; Carskadon et al., 2004). Adolescent humans (Carskadon et al., 1997; Carskadon et al., 2004) and other young mammals, such as rhesus monkey, degu, laboratory rat, laboratory mouse, and fat sand rat (Hagenauer et al., 2009), show a puberty-related delay of the circadian timing system. In the cross-sectional studies by Carskadon and colleagues (1997, 2004), for example, the melatonin rhythm was later in participants who were late pubertal or postpubertal compared with those who were prepubertal or early pubertal. As a result, older adolescents are particularly vulnerable to circadian misalignment (mistimed sleep and wake relative to the circadian system) (Roenneberg et al., 2012) due to early school start times (Crowley et al., 2014).
Light is able to phase shift (reset) the circadian clock and thus could reduce circadian misalignment in youngsters having difficulty adjusting to their early school sleep-wake schedule. It is essential, however, to have a phase response curve (PRC) to light to know the optimal times of bright light administration to produce the maximum phase shift in the desired direction, and to identify the times that light will produce phase shifts in the opposite direction so that they may be avoided. Light PRCs are experimentally derived and describe the phase shifting response to a light stimulus when it is presented at various times across the 24-h day. In general, light presented in the evening or at the beginning of sleep shifts the system later (delay), and light at the end of sleep or morning shifts the system earlier (advance). Currently, there are several PRCs to light for adult humans ranging in age from 18 to 75 years (Honma and Honma, 1988; Czeisler et al., 1989; Minors et al., 1991; Khalsa et al., 2003; Revell and Eastman, 2005; Kripke et al., 2007; Revell et al., 2012; Rüger et al., 2013), but no light PRC exists specifically for adolescent humans.
The aim of this study was to construct a PRC to bright white light for older adolescents between 14 and 17 years and who were late pubertal to postpubertal. We narrowed our focus to older and mature adolescents because late sleep and circadian timing are more pronounced in this group compared with younger adolescents and because these ages correspond to the high school years when school start times are early, making these older adolescents particularly vulnerable to circadian misalignment and chronic sleep restriction.
Materials and Methods
Participants
The study took place at the Biological Rhythms Research Laboratory of Rush University Medical Center in Chicago between 2012 and 2015. A total of 47 participants were enrolled in the study. One male decided to discontinue the study due to schedule conflicts, 1 female decided to discontinue the study because of a family emergency, and we dropped 1 male for noncompliance to the protocol. Thus, 44 participants (21 males) aged 14.3 to 17.8 years (16.2 ± 1.0 years) completed the study. The majority of the participants self-described their race as Black/African American (n = 19) or White/Caucasian (n = 17); the remaining participants were multiracial (n = 6), Native American/Alaskan Native (n = 1), or of unknown race (n = 1). Ten participants identified themselves as Hispanic (6 White/Caucasian, 1 Native American/Alaska Native, 1 Black/African American, 1 multiracial, and 1 of unknown race).
Participants received brief physical examinations by a board-certified pediatric physician to determine pubertal status based on the criteria of Tanner (1962). Tanner stage is based on secondary sexual characteristics and ranges from stage 1 (i.e., childlike prepubertal) to 5 (postpubertal). The study’s entry criteria required that adolescents must be late pubertal to postpubertal (Tanner stage 4 or 5) to control for puberty stage and because this developmental stage is associated with the most pronounced delay of sleep and circadian timing (Carskadon et al., 2004; Crowley et al., 2014). The same physician examined all participants in the study and was blinded to the eligibility criterion.
A parent reported that the child was healthy and without a personal history of a sleep disorder, psychotic disorder, bipolar disorder, or neurological disorder and that the child had no diagnosis of any chronic medical conditions or developmental disorder. Participants were medication-free, except for 2 female participants who were taking an oral contraceptive. Participants did not endorse depressive symptoms as indicated by a score of 16 or lower on the Center for Epidemiologic Studies–Depression (CES-D) scale (Radloff, 1977). Participants did not travel more than 2 time zones within the month before starting the study. Participants reported that their usual sleep duration was between 6 and 10 h and that they were no more than moderate caffeine users (<300 mg/day). Circadian phase preference was measured with the Morningness Questionnaire of Smith and colleagues (1989); morning types (>44) and evening types (<20) were defined by 2 SDs above and below the mean of a larger separate sample of older adolescents (n = 148). The majority of participants (n = 41) were neither type, and 3 participants were morning types. Body mass index (BMI; kg/m2), computed from measurements of weight and height taken in the laboratory, ranged from the 6th to 97th percentiles based on age and sex according to the child and teen criteria set by the Centers for Disease Control and Prevention (2015). Participants were not color blind or deficient as measured by the Ishihara Color Blindness test.
The study was approved by the Rush University Medical Center’s Institutional Review Board, in compliance with the Declaration of Helsinki. A parent of the participant provided written consent for the child to participate in the study, and the adolescent co-signed the consent forms to acknowledge assent. Participants were paid for their participation.
Protocol
Adolescent participants completed a 4-week protocol during their summer vacation. They were required to keep a fixed 9-h sleep schedule at home that was similar to their reported habitual sleep times for 8 or 9 days before they were admitted to the laboratory for each 5-day laboratory session (Figure 1). Average scheduled bedtime was 2339 h (SD = 1 h 11 min); thus, average scheduled wake time was 0839 h and midsleep time was 0410 h. Participants wore an actigraph (Actiwatch Spectrum, Philips Respironics, Inc., Bend OR) on their nondominant wrist; completed daily sleep logs to record bedtime, sleep onset time, wake time, and sleep disturbances; and telephoned daily to a time-stamped voicemail messaging system at bedtime and wake time to measure compliance to the home sleep-wake schedule. When sleeping at home, participants visited the laboratory every 2 or 3 days so that we could download the actigraphy data and review sleep logs with them; participants were questioned about any inconsistencies between the actogram and sleep logs.
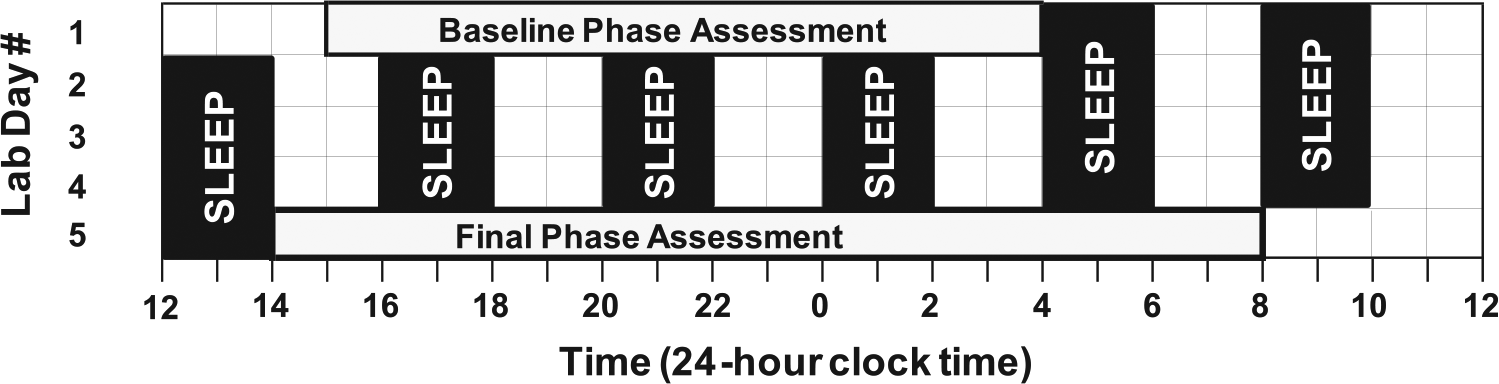
Protocol for the two 5-day laboratory sessions. After 8 or 9 days of sleeping on a fixed 9-h sleep schedule at home, participants completed this protocol in the laboratory. On days 1 and 5, participants completed a circadian phase assessment in dim light (<5 lux) to determine the salivary dim light melatonin onset (DLMO). Baseline saliva sampling began at 1530 h and ended at 0330 h. Final saliva sampling began at 1430 h and ended at 0800 h the next day. An ultradian light-dark (LD) cycle occurred in the intervening 3.4 days; participants were exposed to a 4-h LD cycle with a 2-h sleep opportunity in the dark alternating with 2 h of required wake in room light (~20 lux). Participants completed this protocol of home sleep followed by the 5-day laboratory session twice in a counterbalanced order. During one laboratory session, participants received 80 min (four 20-min exposures) of bright white light (~5000 lux) during one of the 2-h wake periods on days 2, 3, and 4. During the other laboratory session, participants remained in room light.
Participants arrived at the laboratory at noon on day 1 of the laboratory sessions (Figure 1). On days 1 and 5, participants completed a circadian phase assessment to determine the dim light melatonin onset (DLMO). Endogenous salivary melatonin concentration was measured from approximately 2 mL of saliva collected every 30 min using Salivettes (Sarstedt, Nümbrecht, Germany). Participants remained awake in dim light (<5 lux) sitting in comfortable recliners, except when they needed to use the attached washroom (also <5 lux). They were not allowed to eat or drink in the 10 min before each sample, and washroom trips were discouraged during this time. Saliva samples were immediately centrifuged after collection and frozen. These samples were later assayed by SolidPhase, Inc. (Portland, ME) using commercially available radioimmunoassay (RIA) kits (Alpco, Salem NH). An individual’s samples were analyzed in the same batch. The intra-assay coefficients of variation for low (evening) and high (nighttime) levels of salivary melatonin were 4.1% and 4.8%, respectively. The interassay coefficients of variation for low and high levels of salivary melatonin were 6.6% and 8.4%, respectively.
The ultradian light-dark (LD) cycle (2 h light, 2 h dark) began immediately after the baseline phase assessment and continued for 3.4 days. During the 2-h sleep (dark) episodes, participants lay in a cot in the dark and were instructed to try to sleep. Dividers were set up between each cot. During the intervening wake (light) episodes, participants played board games, engaged in crafts, watched prerecorded television shows or movies, read, talked, or completed other quiet activities. Uncaffeinated food and drink were available ad libitum. Participants were unaware of the time of day and the length of the sleep episodes during the ultradian LD protocol. The windowless experimental room was illuminated by 3 fluorescent (4100 K) ceiling fixtures controlled by dimmer switches locked to the lowest position. Light levels average 23 ± 7 lux at the angle of gaze during the wake episodes.
Participants were instructed to abstain from medications that influence endogenous melatonin (e.g., nonsteroidal anti-inflammatory drugs) or sleep (e.g., antihistamines) throughout the study. Recreational drugs, nicotine, and alcohol were also prohibited throughout the study. Urine toxicology screens for common drugs of abuse, including nicotine, and breath alcohol tests confirmed compliance. Caffeine was prohibited in the 72 h before each laboratory session.
Bright Light and Room Light Laboratory Sessions
Participants completed the sequence of home sleep followed by a 5-day laboratory session twice in a counterbalanced order. During one laboratory session, participants were exposed to bright light for 3 consecutive days (days 2, 3, and 4 in Figure 1) at the same time on each day during a wake episode. During the other laboratory session, participants remained in room light.
Bright light exposure started 5 min after waking at one of these times each day: 1405 h (n = 8), 1805 h (n = 8), 2205 h (n = 8), 0205 h (n = 5), 0605 h (n = 9), or 1005 h (n = 6). Light exposure ended 5 min before the next scheduled nap. The bright light stimulus pattern was intermittent; four 20-min light exposures occurred with 10 min of room light in between. The overhead lights remained on during the bright light exposure as this is how bright light treatment is administered in the real world. Groups of participants (maximum = 3) received bright light at the same clock time; however, the light did not occur at the same circadian phase since participants had different baseline phases. Thus, light exposure occurred at different circadian phases across the 24-h day. Twenty-three participants received bright light during the first laboratory session, and 21 received bright light during the second laboratory session.
During bright light exposure, participants sat around a large (60-inch) round table with a white table cloth. Three commercially available light boxes (SunRay, Sunbox, Inc., Gaithersburg, MD) each containing 4 fluorescent lamps (Sylvania Octron 5000 K FB031/50K 31 W) and measuring 59 × 39 × 8 cm (screen size was 56 × 31 cm) were set up horizontally without a stand in the middle of the table facing outward toward each participant. Thus, participants received the bright light stimulus from a single light box, similar to what would occur for treatment at home. The light boxes were 45 ± 5 cm, on average, from participants’ eyes, and light levels averaged 4946 ± 387 lux at the angle of gaze when the light boxes were on. The light boxes emitted light across the visible spectrum but not in the ultraviolet (UV) range. Figure 2 illustrates the spectral power distribution of the fluorescent lamps in the bright light boxes. Participant read or engaged in other quiet activity when the light boxes were on. During the room light session, participants sat at the same table engaged in similar quiet activities, but light boxes were not set up on the table and participants remained in room light.
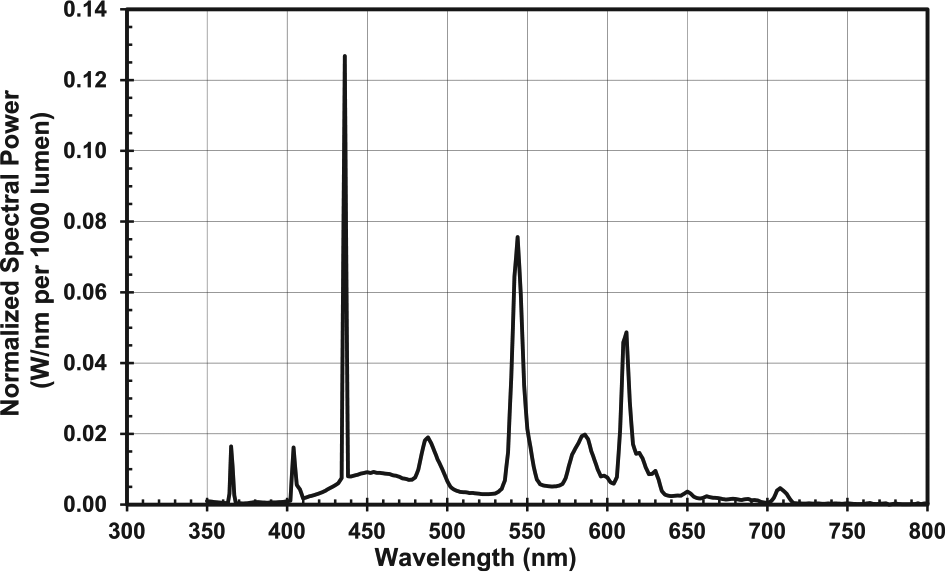
Spectral power distribution for the fluorescent lamps (Sylvania Octron 5000 K FB031/50K 31 W) contained within the bright light boxes used to construct the phase response curves to bright light in the current sample of adolescents.
Statistical Analysis
DLMO phase, expressed in 24-h clock time, was determined by linear interpolation across the time points before and after the melatonin concentration increased to and stayed above 4 pg/mL (Carskadon et al., 1997; Crowley et al., 2016). Three participants showed a clear rise of melatonin but were high melatonin secretors (n = 2) or low melatonin secretors (n = 1). The thresholds to compute DLMO were therefore adjusted to 10 pg/mL and 1 pg/mL, respectively. Phase shifts were defined as baseline DLMO minus final DLMO, and by convention, a phase delay is expressed as a negative number and phase advances are positive numbers.
The ultradian LD cycle is a forced desynchrony protocol; a 4-h day is beyond the limits of entrainment, and therefore the circadian clock free runs (Kripke et al., 2007; Burgess and Eastman, 2008; Burgess et al., 2008; Smith et al., 2009; Burgess et al., 2010; Eastman et al., 2012; Revell et al., 2012; Eastman et al., 2015; Eastman et al., 2016). Circadian period was computed from the DLMO phase shift from the baseline to final phase assessments during the room light session when bright light stimuli were absent. The phase shift was divided by 4 days to derive the daily phase shift because there were 4 days from the baseline to final phase assessments. Circadian period was computed using the following: |daily phase shift − 24 h|.
The phase shift due to free-running during the room light condition was subtracted from the phase shift produced during the bright light condition for each individual to provide the phase shift due to the light stimulus alone (net phase shift). To construct a PRC, we plotted net phase shifts on the y-axis and the time that bright light started on the x-axis. We constructed 2 PRCs with different time reference points on the x-axis. First, net phase shifts were plotted as a function of when bright light started relative to baseline DLMO measured during the bright light condition. Second, we plotted net phase shifts as a function of the midpoint of scheduled home sleep time for others to use in cases when the DLMO is unknown or not easily measured. A 2-harmonic curve was fit to the raw data for both PRCs as has been done previously (Khalsa et al., 2003; Burgess et al., 2008; Burgess et al., 2010; St. Hilaire et al., 2012; Rüger et al., 2013). The curve fit was tested using a nonlinear regression model.
Results
Figure 3 illustrates melatonin profiles from a 16-year-old male to demonstrate how circadian period and the net phase shift were computed as well as to show the necessity of the room light condition to account for the shift due to the protocol itself. For this participant, the DLMO was delayed by 1.49 h in the 4 days between baseline and final phase assessments during the room light condition (Figure 3, top). Thus, the daily shift was −1.49 h / 4 days = −0.37 h per day, and the circadian period was |−0.37 h − 24 h| = 24.37 h. For the entire sample of adolescents, circadian period ranged from 23.56 to 24.70 h (mean = 24.19 h, SD = 0.22 h).
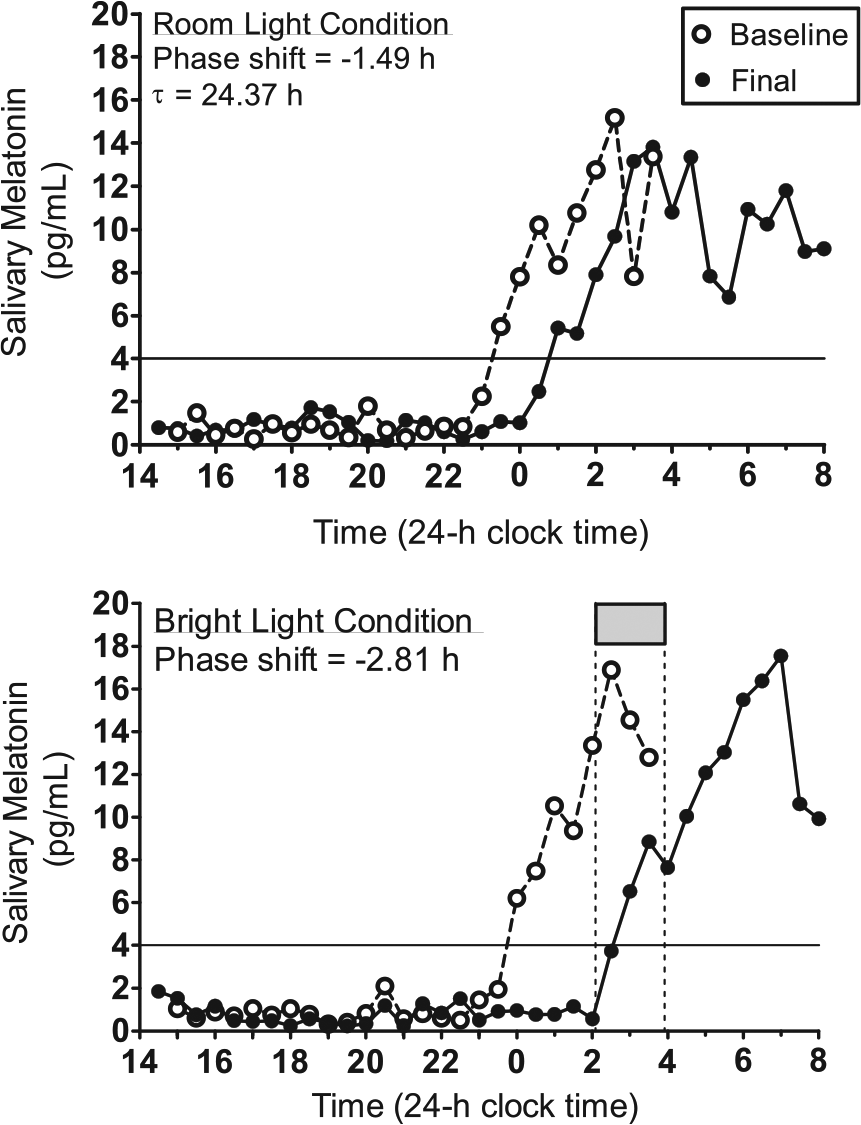
Melatonin profiles. Baseline and final melatonin profiles from a 16-year-old male participant during the room light condition (top) and the bright light condition (bottom). The solid horizontal line illustrates the 4 pg/mL threshold to determine the time of the DLMO. This participant was in a group in which bright light exposure (gray box and vertical dotted lines) started at 0205 h and ended at 0355 h.
Figure 3 (bottom) illustrates the phase shift from the same 16-year-old male participant when the intermittent bright light was turned on between 0205 h and 0355 h. The bright light started 2.3 h after his baseline DLMO and his melatonin rhythm was delayed by 2.81 h. This phase shift, however, was a result of the delay drift due to the ultradian LD cycle plus the phase delay due to the bright light. Thus, we computed the net phase shift by subtracting −1.49 h from −2.81 h (net phase shift = −1.32 h) to isolate the phase shift due to the bright light stimulus alone. Net phase shifts for all participants were plotted on the y-axes of the PRCs shown in Figures 4 and 5.
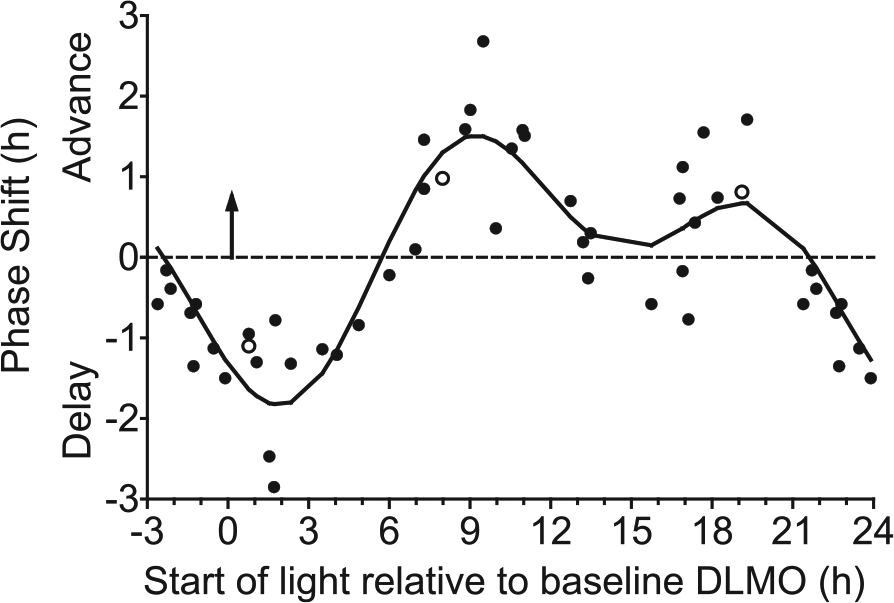
Adolescent phase response curve to bright light plotted relative to each individual’s circadian phase marked by the dim light melatonin onset (DLMO; upward facing arrow at 0 h). Bright light (~5000 lux) was produced with a single light box. An intermittent bright light pattern (four 20-min bright light exposures with 10 min of dim room light [~20 lux] in between) was repeated at the same clock time for 3 consecutive days while participants lived on an ultradian sleep-wake (2 h dark, 2 h light) schedule. DLMOs were measured before and after the 3 days of ultradian sleep-wake schedules and bright light exposures, from which the DLMO phase shift size (in hours) and direction (advance or delay) were computed for each individual. Participants completed the same 5-day laboratory session without bright light (in a counterbalanced order) to measure the natural drift of the system due to the protocol. This shift was subtracted from the phase shift during the bright light session to isolate the shift due to bright light alone (net phase shift). Each point represents an individual’s net phase shift (y-axis) in response to when bright light exposures started relative to the individual’s DLMO (x-axis). Open symbols represent the 3 participants for whom a different DLMO threshold was used (10 pg/mL for 2 high melatonin secretors and 1 pg/mL for 1 low melatonin secretor; see text). A 2-harmonic curve was fit to the data. Phase shifts that occurred 21 to 24 h after baseline DLMO are double plotted.
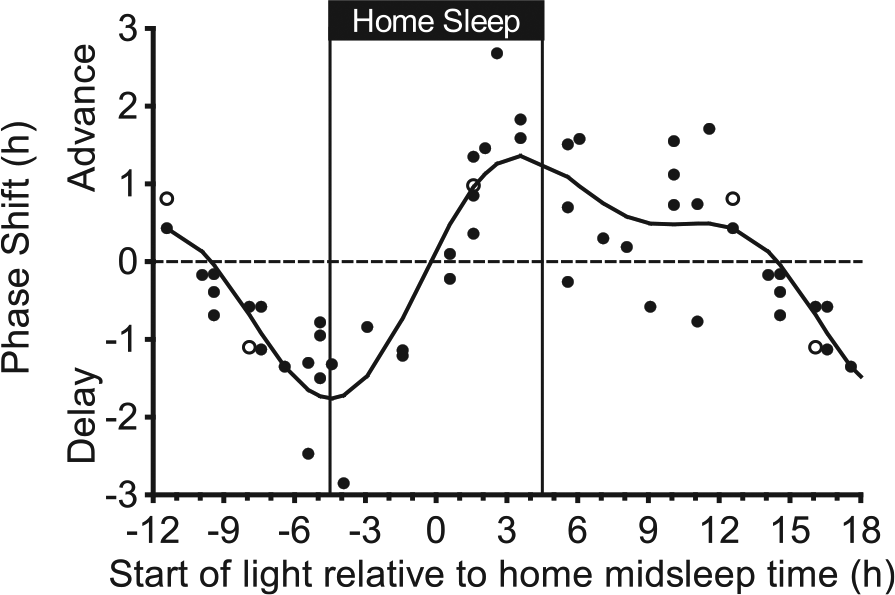
Adolescent phase response curve to bright light plotted relative to the midpoint of the fixed 9-h home sleep schedule that participants followed before each 5-day laboratory session. The sleep schedule was tailored to each participant’s current summertime sleep schedule and is illustrated with vertical lines. Bright light (~5000 lux) was produced with a single light box. An intermittent bright light pattern (four 20-min bright light exposures with 10 min of dim room light [~20 lux] in between) was repeated at the same clock time for 3 consecutive days while participants lived on an ultradian sleep-wake (2 h dark, 2 h light) schedule. DLMOs were measured before and after the 3 days of ultradian sleep-wake schedules and bright light exposures, from which the DLMO phase shift size (in hours) and direction (advance or delay) were computed for each individual. Participants completed the same 5-day laboratory session without bright light (in a counterbalanced order) to measure the natural drift of the system due to the protocol. This shift was subtracted from the phase shift during the bright light session to isolate the shift due to bright light alone (net phase shift). Each point represents an individual’s net phase shift (y-axis) in response to when bright light exposures started relative to the individual’s scheduled midpoint of sleep time at home (x-axis). Open symbols represent the 3 participants for whom a different DLMO threshold was used (10 pg/mL for 2 high melatonin secretors and 1 pg/mL for 1 low melatonin secretor; see text). A 2-harmonic curve was fit to the data. Phase shifts that occurred 12 to 18 h after home midsleep time are double plotted.
Figure 4 illustrates that the net phase shift response to bright white light depends on the start time of the bright light relative to the baseline DLMO. The 2-harmonic curve was a good fit for these data (R = 0.88; F4,43 = 33.01, p < 0.001). The maximum delay shift of the fitted curve was −1.8 h and occurred 1.9 h after the DLMO. The region of large phase delays (fitted-curve delays ≥1.0 h) spanned from 0.6 h before the DLMO to 4.3 h after the DLMO. Within this phase delay region, however, individual adolescents showed variability in their responses; delay shifts ranged from 0.8 h to 2.9 h. The maximum advance of the fitted curve was 1.5 h and occurred 9.2 h after the DLMO. The region of large phase advances (fitted-curve advance shifts ≥1.0 h) spanned from 7.3 h to 11.4 h after the DLMO. Similar to the phase delay region, however, individual adolescents showed variability in their responses within this phase advance region; advance shifts ranged from 0.4 h to 2.7 h. A second smaller advance region (fitted-curve peak = 0.7 h) occurred 18 to 20 h after the DLMO, with some adolescents shifting more than 1 h during this time. The fitted-curve transition (crossover) point from phase delay to phase advance shifts occurred 5.7 h after the DLMO.
Figure 5 illustrates the phase shift responses to bright white light relative to an individual’s scheduled midsleep time at home before the 5-day laboratory sessions. Again, the 2-harmonic curve was a good fit for these data (R = 0.85; F4,43 = 24.96, p < 0.001). The shape of this PRC is the same if scheduled bedtime or wake-up time was used as a reference point; the x-axis can be adjusted by 4.5 h because the scheduled duration of home sleep was fixed at 9 h. The maximum delay shift of the fitted curve was −1.8 h and occurred 4.5 h before midsleep time, which corresponds exactly to scheduled bedtime. The region of large phase delays (fitted-curve delay shifts ≥1.0 h) spanned from 7.2 h to 1.9 h before midsleep time (2.7 h before to 2.6 h after scheduled bedtime). The maximum advance of the fitted curve was 1.4 h and occurred 3.6 h after midsleep time (0.9 h before scheduled wake time). The region of large phase advances (fitted-curve advance shifts ≥1.0 h) spanned from 1.7 h to 6.0 h after midsleep time (2.8 h before to 1.5 h after scheduled wake time). Unlike Figure 4, a distinct secondary advance peak did not appear; however, the fitted curve showed advances during the majority of the adolescents’ usual waking day. When light started 10.1 h to 12.6 h after midsleep time (5.6 to 8.1 h after scheduled wake time), 6 participants phase advanced by more than 30 min. Of those 6 participants, 3 participants advanced by more than 1 h. The fitted-curve transition (crossover) point from phase delay to phase advance shifts occurred 0.2 h before midsleep time.
Discussion
This study produced the first phase response curves (PRCs) to bright white light for adolescents between 14 and 17 years, a group that is at heightened risk for circadian misalignment and sleep restriction. These PRCs to light constructed from a group of healthy adolescents during summer vacation showed the general predictable pattern of a PRC. The biological night for an individual has been defined as the time of melatonin secretion in dim light. When phase shifts were plotted relative to DLMO (Figure 4), phase delay shifts occurred during the first half of the biological night on the rising arm of the melatonin rhythm (in the 4 h following the DLMO) and phase advances occurred during the second half of the biological night when melatonin levels decreased (~7 to 11 h after the DLMO). The crossover point when delays became advances occurred approximately 6 h after the DLMO, which corresponds to the middle of the biological night. We also plotted the adolescent PRC to light with the time reference of home midsleep time (Figure 5). The crossover point when delays became advances occurred at approximately midsleep time, suggesting that when DLMO is unknown, average midsleep time can be a useful marker to time bright light exposure in older adolescents. Delay shifts occurred before midsleep time with the largest delays occurring at scheduled bedtime. Advance shifts occurred after midsleep time with the largest advances occurring about 1 h before scheduled wake time. Both PRCs, however, continued to show advances later in the biological day (Figure 4) and several hours after midsleep time (Figure 5).
Overall, the older adolescent PRCs to bright light showed similar amplitudes in the delay (maximum delay = 1.8 h) and advance (maximum advance ~1.5 h) regions. These data are surprising since these nearly symmetrical PRCs do not favor the delayed circadian phase that is observed in this age group. Previously, it was predicted that the delayed circadian system relative to the 24-h light-dark may be explained by an attenuated amplitude in the phase advance region of the PRC to light, an exaggerated amplitude in the phase delay region, or both (Carskadon et al., 1998; Carskadon et al., 2004; Crowley and Carskadon, 2010). Preliminary evidence in animals supported this hypothesis (Hagenauer et al., 2009). The adolescent PRCs produced from this study, however, suggest that a delayed circadian phase during late adolescence is likely not explained by a modified PRC to light. A recent study (Crowley et al., 2015) in which circadian light sensitivity was tested via melatonin suppression in response to 4 light exposures (~0.1, 15, 150, and 500 lux) also does not support the hypothesis that older adolescents have an exaggerated response to evening phase delaying light. Instead of being more sensitive to light in the evening during the phase delay portion of the PRC, late pubertal to postpubertal adolescents were less sensitive to light compared with prepubertal and early pubertal adolescents. A PRC to bright light constructed from prepubertal and early pubertal adolescents run under the same conditions may be needed to rule out this hypothesis completely, however.
The opportunity for more exposure to light, particularly around bedtime, may better explain the later circadian timing of older adolescents. Data from the Carskadon laboratory show that sleep pressure accumulates more slowly across waking in postpubertal adolescents compared with prepubertal adolescents. For example, Jenni and colleagues (2005) modeled slow wave activity build-up using sleep before and after 36 hours of sleep deprivation and found an increase in the time constant in postpubertal versus prepubertal adolescents, indicating that mature adolescents accumulate sleep pressure at a slower rate across a waking interval compared with prepubertal adolescents. Longer sleep onset latency near bedtime in postpubertal adolescents compared with prepubertal adolescents following 14.5 and 16.5 h awake also suggests that postpubertal adolescents have less sleep pressure at the end of the waking day compared with prepubertal adolescents (Taylor et al., 2005). Furthermore, Crowley and colleagues (2006, 2014) reported that older adolescents have a longer interval from DLMO to self-selected bedtime (bedtime phase angle) compared with younger adolescents, which means that older adolescents stay awake later after the onset of melatonin. Therefore, not only are older adolescents able to stay awake later, but they are able to stay awake longer after the onset of their biological night marked by the rise of melatonin. The ability to stay awake late into the evening and late into the biological night likely contributes to greater light exposure opportunity at the most sensitive circadian time for phase delay shifts according to our PRCs (see Figs. 4 and 5). The intensity of the light exposure around bedtime in the home environment is not as bright as the light tested in the current study; however, studies in adolescents (Agostini et al., 2017) and adults (Burgess and Eastman, 2004; Zeitzer et al., 2005) suggest that indoor room light in the evening can phase delay the circadian system.
Several PRCs to bright white light have been constructed from young adults mostly in their 20s and 30s (Honma and Honma, 1988; Czeisler et al., 1989; Minors et al., 1991; Khalsa et al., 2003; Kripke et al., 2007; St. Hilaire et al., 2012). Protocol differences, however, make direct comparisons to our adolescent PRC challenging. The duration of the light stimuli, for example, varied among these studies and ranged from 1 to 6.7 h. The most similar light duration to the 80 min used in the current study was the PRC constructed by St. Hilaire and colleagues (2012), who tested a 1-h bright white light stimulus in young adults aged 18 to 30 years. The light intensity was as high as ~8000 lux for at least half of the 1-h exposure as gaze was directed toward the bright light for 6 min out of every 12-min block. St. Hilaire and colleagues accounted for the natural drift (free-run) associated with intrinsic circadian period (tau) over 3 days by drawing the no-phase-shift line at −0.54 h, which is the assumed phase change given the average tau (24.18 h) of a separate sample (Czeisler et al., 1999) (−0.18 h × 3 days = −0.54 h). By contrast, we subtracted out each individual’s tau to compute phase shifts in the current study. When using the adjusted no shift line at -0.54 h, their young adult PRC (their Figure 3C) and the PRC of older adolescents (Figure 4) show similarities: maximum phase delay shifts occurred about 2 h after DLMO, and the crossover point from delays to advances occurred about 6 h after DLMO. Both PRCs also showed advances for about 12 h after the crossover point, which would correspond to the end of habitual sleep and the first half of the waking day. The adolescent PRC, however, showed a discrete peak advance about 9 h after the DLMO and a secondary peak advance about 18 to 20 h after the DLMO. A peak advance is not obvious in the young adult PRC reported by St. Hilaire and colleagues, although the highest part of the fitted curve is about 18 h after the DLMO, around the time of our adolescent PRC’s secondary peak. Nevertheless, similarities between the older adolescent PRC and the young adult PRC exist. These similarities may not be surprising since many of the young adults were in their late teens and early 20s, when their physiology is similar to that of an older adolescent.
If we continue to use the −0.54 h no-shift line, maximum delay and advance shifts were descriptively smaller in the young adult PRC (~ −1.2 h and ~1.0 h, respectively) of St. Hilaire and colleagues (2012) compared with the adolescent PRC (−1.8 h and 1.5 h). This is likely because the young adults in St. Hilaire’s study received bright light on one 24-h cycle, whereas the adolescents in the current study received bright white light on 3 consecutive cycles. Also, comparisons of phase shift sizes between the two studies should be done with caution given the many other methodological differences, including light intensity (~5000 lux vs. ~8000 lux), light delivery (single light box vs. a ceiling bank of lights), and adjustments for tau. The sleep (dark) schedules also differed between the two studies; St. Hilaire and colleagues scheduled two 8-h sleep (dark) opportunities between the phase assessments at times when a dark pulse would likely facilitate the phase shift, whereas we scheduled sleep (dark) across the 24 h to minimize the effect of a dark pulse on the resulting phase shift. A direct comparison between adolescents and middle-aged or older adults using the same methods may still be needed to determine whether differences in amplitude in PRCs to bright white light exist.
Kripke and colleagues (2007) constructed a PRC in 2 age groups: young adults between 18 and 31 years and older adults between 59 and 75 years. Very healthy participants spent 5 to 6 days living on a 90-min ultradian light-dark (wake-sleep) protocol (60 min light, 30 min dark), except during bright light exposures. Participants received bright white light (3 h of ~3000 lux) at the same clock time on 3 consecutive days. Phase shifts were derived from the urinary melatonin metabolite, 6-sulfatoxymelatonin (aMT6s), collected during the last 24 h of the ultradian protocol before the bright light exposure (baseline) and during 24 h after the light exposure (final). Kripke and colleagues’ PRCs that plot aMT6s onset shifts (their Fig. 5A and 5B) are the most appropriate for comparing to our PRCs, which plot phase shifts of salivary melatonin onset. Differences between the studies, however, include these: (1) Kripke and colleagues averaged phase shifts into 2-h bins, whereas we used a 2-harmonic function to estimate the curve; (2) they plotted the time of the bright light exposure relative to the middle of the continuous 3-h exposure, whereas we used the beginning of our intermittent train of light pulses; and (3) they corrected for the free-run using the average tau of 24.38 h obtained from a separate sample run in the same 90-min ultradian protocol without bright light (Kripke et al., 2005), while we used each participant’s individual free-running period.
The amplitude of the phase delay and phase advance regions in the PRCs reported by Kripke and colleagues (their Fig. 5B) did not differ between the 2 adult groups. Both groups showed descriptively larger delays (~2.5 h) and advances (~3 h) when accounting for tau compared with our adolescent PRC to bright light. This likely reflects the difference in bright light exposure duration (80 min vs. 3 h). Their young adult PRC shows that average delay shifts of more than 1 h occurred between midnight and 0600 h, with the peak at about 0200 h. Average phase advances greater than 1 h occurred between 0800 h and noon. The crossover point between delays and advances occurred at about 0700 h, which was near the end of their average sleep episode before the study (0033 to 0832 h measured from actigraphy). Recall, however, that Kripke and colleagues plotted the approximate time of the midpoint of the 3-h light exposure on the x-axis. If we shift their curves to the left by 1.5 h to correspond to our PRCs, which plotted the time that light exposure began, then their maximum delay shift would be at 0030 h (at their young adults’ average bedtime), average advances greater than 1 h would be from 0630 h to 1030 h (times surrounding their average wake time), and the crossover point would be at 0530 h, about 1 h after the midpoint of their average sleep episode before the study. Thus, the PRC reported by Kripke et al (2007) for young adults (18-31 years old) is similar to our PRCs for older adolescents (14-17 years old), despite the differences in methods. The peak advance, peak delay and crossover points of the young adult group was about 2 to 4 h later than the older adult group, which may suggest that adolescents between 14 and 17 years also have a delayed PRC compared with older adults. PRCs constructed from adolescents and older adults using the same methods would be needed to fully test this hypothesis.
The PRC to short wavelength (blue) light of Revell and colleagues (2012) was constructed from young adult subjects (age 18-41 years) in our laboratory using a protocol very similar to that of the current study. The ultradian protocol was also a 4-h LD cycle, but with 1.5 h of sleep alternating with 2.5 h of wake. Participants received blue light at the same clock time for 3 consecutive days. They sat at the same round table as in the current report, each with one small (11.2 × 6.6 cm) blue light-emitting device (GoLite) directed at their face, which was turned on intermittently (three 30-min exposures with 15 min of dim room light in between; total lights-on time = 90 min). Unlike the current PRCs, the blue light PRC was plotted using 3-h bins. Delays occurred from about 1.5 h before the DLMO to about 7.5 h after the DLMO. Advances occurred between approximately 10.5 and 19.5 h after the DLMO. Thus, the adolescent white light PRCs and the young adult blue light PRC constructed in our laboratory both show delays around bedtime. They also show advances to light exposure after waking, as well as later in the daytime. One noticeable difference is that the blue light PRC does not have advances near the end of sleep, which could be due to light wavelength or an artifact of binning with small sample sizes. The maximum phase delays and advances (when binned) were between 0.5 and 1.0 h, although individuals delayed as much as 2 to 2.5 h and advanced as much as 1.5 to 2 h. The smaller amplitude of the blue light PRC compared with the adolescent PRC could be due to the different sizes of the light boxes, light wavelength, advances, and delays occurring in the same 3-h bin and averaging out to smaller values, or a combination of these reasons.
The adolescent PRCs presented here provide a valuable tool to time bright light in adolescents. If phase advancing is the goal, these PRCs show that seeking morning light just before usual wake time and avoiding light around bedtime can phase advance circadian rhythms of adolescents. Furthermore, these data may suggest that bright light exposure during the day, even in the afternoon, can advance rhythms; follow-up studies are needed to confirm this finding. Limitations to our approach, however, should be considered when applying these data to adolescents when they are attending school. Participants in the current study were on summer vacation and were given a fixed 9-h sleep schedule before entering the laboratory; thus, their sleep was not restricted like it is during the school year. Sleep restriction can partially reduce the size of phase shifts in response to a bright light box (Burgess, 2010). In addition, an adolescent’s bedtimes and wake-up times will likely not be as consistent as those in the current study. We recommend using average midsleep times to prescribe light treatment because the midpoint of sleep correlates well with the DLMO in adolescents during the summer and school year (Crowley et al., 2006) and thus can serve as a proxy for DLMO when it is not available. Finally, all of the adolescents included in this study were healthy and without sleep complaints. It is unknown whether the adolescent PRCs reported here are the same as the PRCs for adolescents with clinically diagnosed delayed sleep-wake phase disorder.
Footnotes
Acknowledgements
This work was supported by a grant from the National Heart, Lung, and Blood Institute (NHLBI) (R01 HL105395) awarded to S.J.C. The content is solely the responsibility of the authors and does not necessarily represent the official views of the NHLBI. The NHLBI had no involvement in the design of the study; the collection, analysis, and interpretation of data; the writing of the manuscript; or the decision to submit the manuscript for publication. The Sunbox Company donated the fluorescent lamps used in the study. We thank Thomas Molina, Christina Suh, Marissa Dziepak, Amy Feehan, Julia Kleinhenz, Brock Peiffer, Gabriela Velazquez, Asantewaa Ture, Jazmin Garcia, James Farrell, Victoria Tomaka, Anna Kathryn Ishikawa, Ieva Misiunaite, Neha Singla, Andrew Kalweit, Athina Bouroukas, Chelsea Fournier, William Kwateng, Jennifer Austiff, Elizabeth Dimaggio, Samantha Evans, John Glines, and Sabrina Velez for assisting with data collection. We thank Louis F. Fogg, PhD, for statistical analysis guidance and Carrie Drazba, MD, for examining participants for Tanner stage. We acknowledge the participants and their families for their dedication and cooperation while participating in this research project.
Conflict of Interest Statement
The author(s) have no potential conflicts of interest with respect to the research, authorship, and/or publication of this article.