
Abstract
Normal physiology undergoes 24-h changes in function that include daily rhythms in circulating hormones, most notably melatonin and cortical steroids. This study focused on N-acetyltryptamine, a little-studied melatonin receptor mixed agonist-antagonist and the likely evolutionary precursor of melatonin. The central issue addressed was whether N-acetyltryptamine is physiologically present in the circulation. N-acetyltryptamine was detected by LC-MS/MS in daytime plasma of 3 different mammals in subnanomolar levels (mean ± SEM: rat, 0.29 ± 0.05 nM, n = 5; rhesus macaque, 0.54 ± 0.24 nM, n = 4; human, 0.03 ± 0.01 nM, n = 32). Analysis of 24-h blood collections from rhesus macaques revealed a nocturnal increase in plasma N-acetyltryptamine (p < 0.001), which varied from 2- to 15-fold over daytime levels among the 4 animals studied. Related RNA sequencing studies indicated that the transcript encoding the tryptamine acetylating enzyme arylalkylamine N-acetyltransferase (AANAT) is expressed at similar levels in the rhesus pineal gland and retina, thereby indicating that either tissue could contribute to circulating N-acetyltryptamine. The evidence that N-acetyltryptamine is a physiological component of mammalian blood and exhibits a daily rhythm, together with known effects as a melatonin receptor mixed agonist-antagonist, shifts the status of N-acetyltryptamine from pharmacological tool to candidate for a physiological role. This provides a new opportunity to extend our understanding of 24-h biology.
Keywords
N-acetyltryptamine is a structural analog of melatonin (5-methoxy N-acetyltryptamine) (Figure 1) and its likely evolutionary precursor (Klein, 2004, 2006). Whereas thousands of publications over the last half century focused on melatonin and the role it plays as the hormonal output signal of the circadian system (Wood and Loudon, 2014), N-acetyltryptamine has received considerably less attention. This is surprising because it has been known for decades from pharmacological studies that N-acetyltryptamine is a mixed melatonin receptor agonist-antagonist, albeit with much lower affinity than melatonin (Dubocovich et al., 2010). These include investigations using amphibian skin by Heward and Hadley (Heward and Hadley, 1975), avian and mammalian retina by Dubocovich and colleagues (Dubocovich, 1984, 1985), mammalian suprachiasmatic cells by Mason and Brooks (Mason and Brooks, 1988), and amphibian melanocytes and chicken brain by Sugden and coworkers (Chong and Sugden, 1994; Sugden et al., 1995).
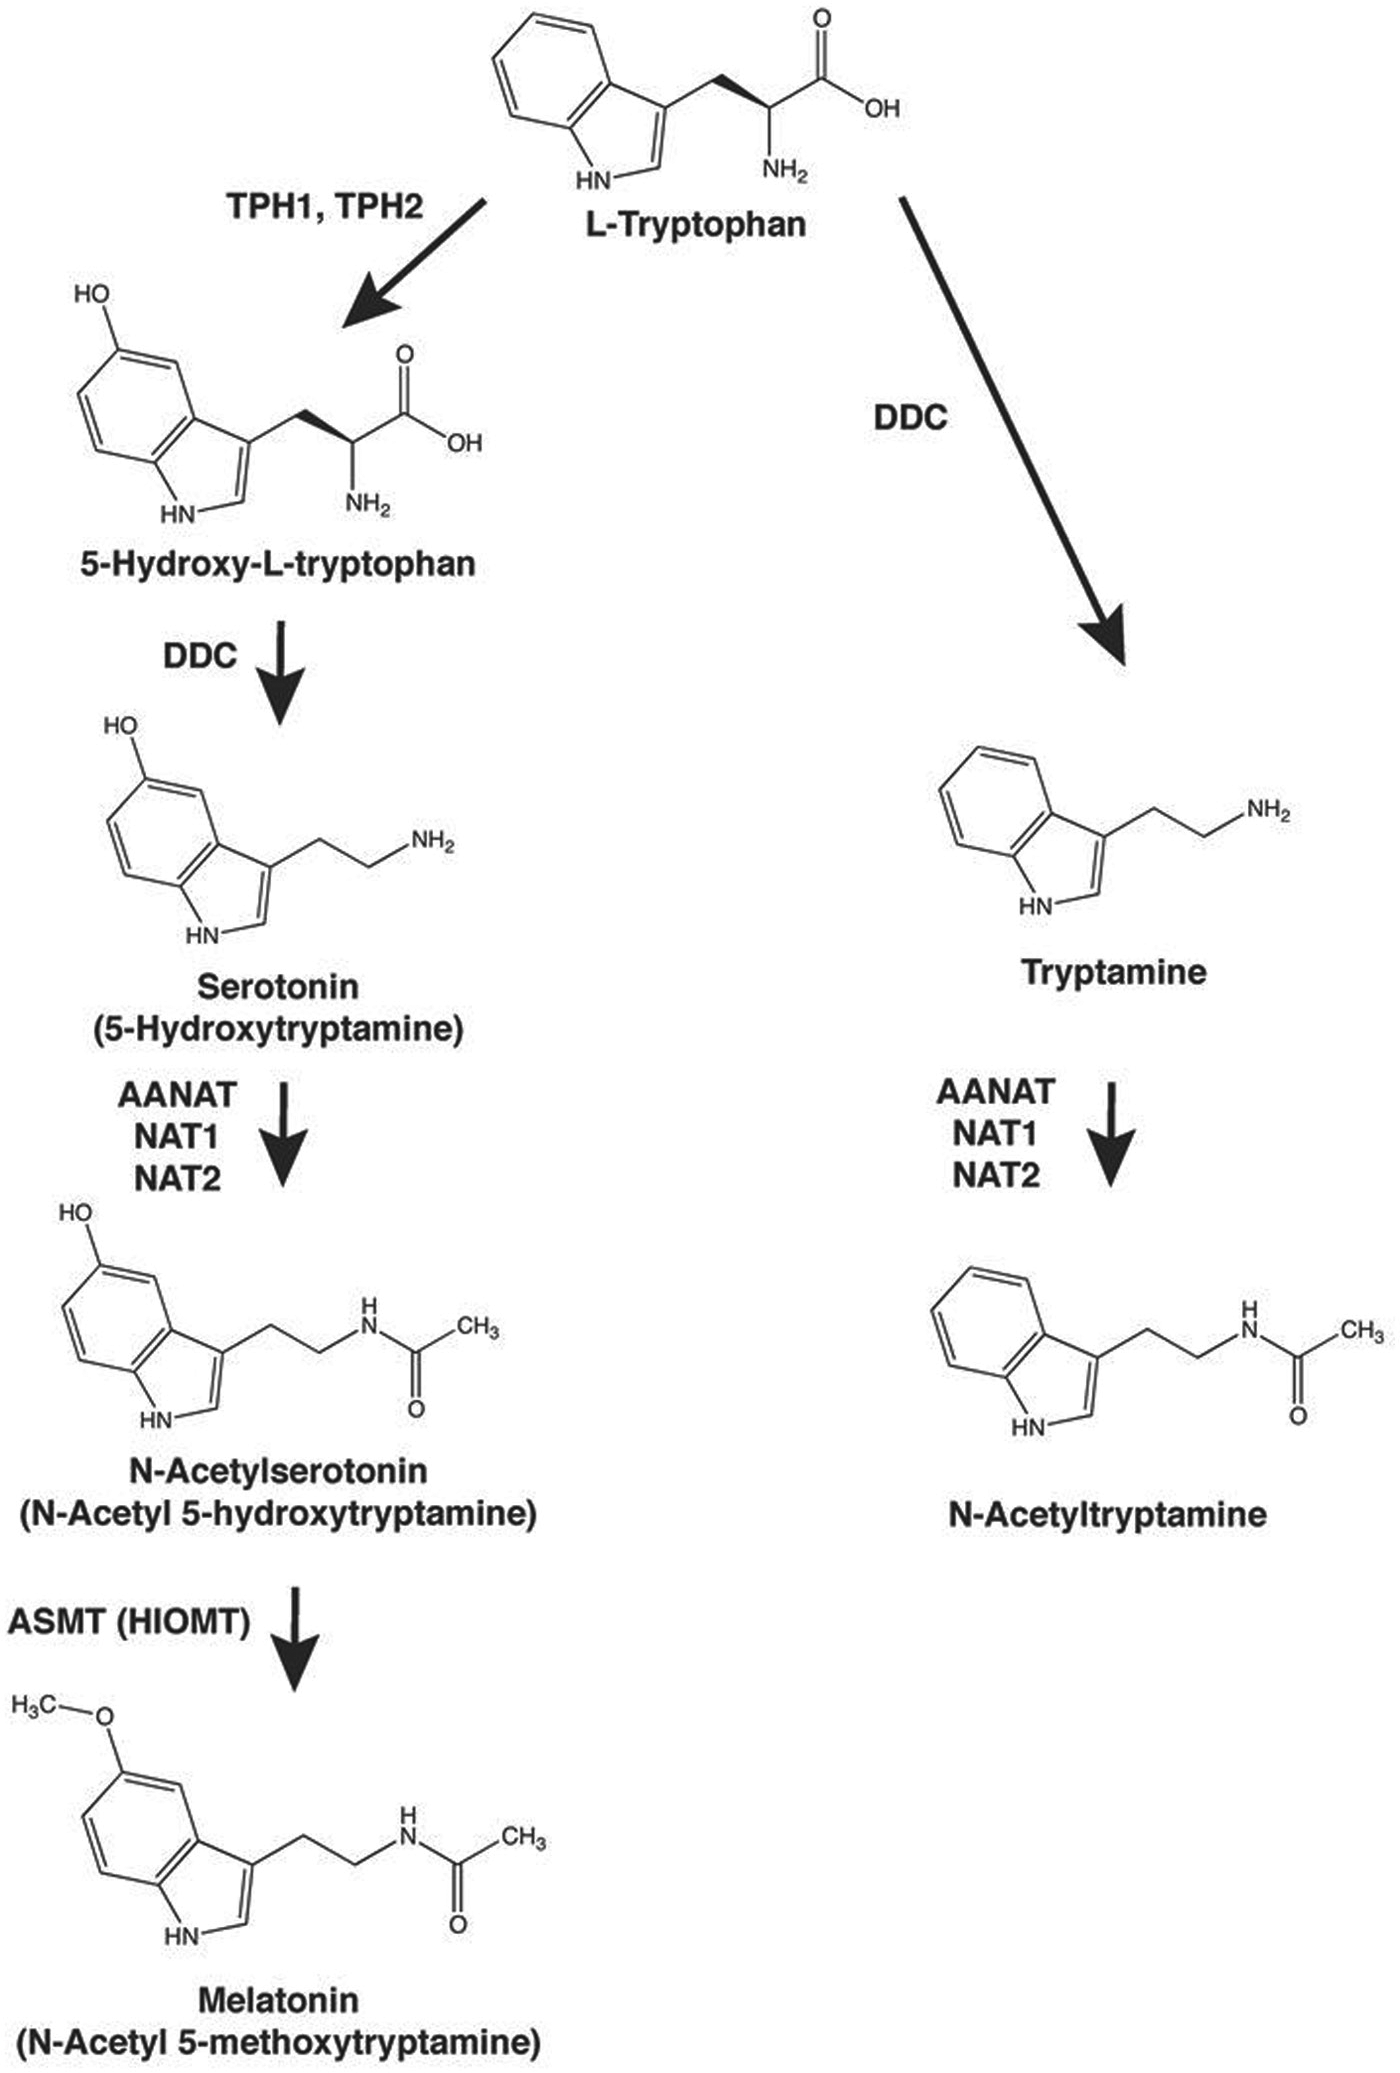
Synthesis of N-acetyltryptamine and melatonin from tryptophan. The biosynthesis of N-acetyltryptamine from tryptophan by a pathway sharing enzymes with the melatonin pathway is described. TPH1, tryptophan hydroxylase 1; DDC, dopa decarboxylase; AANAT, arylalkylamine N-acetyltransferase; NAT1, arylamine N-acetyltransferase 1; NAT2, arylamine N-acetyltransferase 2; ASMT, acetylserotonin O-methyltransferase; HIOMT, hydroxyindole-O-methyltransferase.
Both N-acetyltryptamine and melatonin are derivatives of tryptophan (Figure 1). Synthesis of N-acetyltryptamine involves decarboxylation of tryptophan to tryptamine by a broadly distributed aromatic amino acid decarboxylase (DOPA decarboxylase, DDC); the next step in the conversion is N-acetylation. The latter can occur in vertebrates through the action of 2 enzyme families.
The first is the arylalkylamine N-acetyltransferase (AANAT) family, members of which selectively and efficiently acetylate arylalkylamines (Falcon et al., 2014; Klein, 2007; Pavlicek et al., 2010); AANAT controls the daily rhythm in pineal melatonin synthesis (Klein, 2007). In addition to being highly expressed in the pineal gland, AANAT is present in vertebrate retinas at variable levels and at distinctly lower levels in the pituitary gland (Coon et al., 2002a; Coon et al., 1995; Fleming et al., 1999; Iuvone et al., 2005; Tosini et al., 2008) and brain (Gaudet et al., 1991; Gaudet and Namboodiri, 1993). A single AANAT gene is found in most vertebrate genomes; however, several are present in fish genomes (Klein, 2007).
The second family of enzymes that can acetylate arylalkylamines (Steinberg et al., 1969) includes arylamine N-acetyltransferase 1 and 2 (NAT1 and NAT2), which catalyze the acetylation of arylamines and hydrazines. The ability of these enzymes to acetylate arylalkylamines may explain the observation that N-acetylserotonin is a minor metabolite of serotonin by perfused rat liver (Tyce et al., 1968a, 1968b). NAT1 is expressed widely across human tissues, whereas human NAT2 is expressed primarily in the liver and gastrointestinal tract. Human NAT2 has been of special interest because it exhibits a common polymorphism resulting in rapid, intermediate, and slow acetylator phenotypes (Hein, 2009).
The paucity of knowledge about the biology of N-acetyltryptamine may reflect its status as a pharmacological tool and that it has far lower affinity than melatonin at melatonin receptors (Dubocovich et al., 2010). In addition, and perhaps most important, the physiological presence of N-acetyltryptamine has not been reported. Here, this issue was addressed using mass spectrometry, a method that has been used previously to measure circulating and tissue levels of melatonin (Carter et al., 2012; Lewy and Markey, 1978). The results of this study established that N-acetyltryptamine is physiologically present in plasma and exhibits a daily rhythm. Accordingly, it is reasonable to consider the possibility, albeit tenuous, that N-acetyltryptamine plays a role in chronobiology through melatonin receptors or other targets.
Materials and Methods
Biological Materials
Rhesus Macaques
The rhesus macaques (Macaca mulatta) used in this study came from 2 sources. Those used for 24-h plasma collection (2 males, 6 and 20 years old; 2 ovariectomized females, 8 years old) were housed at the Oregon National Primate Center indoors under controlled lighting comprising 12 h of light and 12 h of darkness per day (12:12 light-dark; lights-on at 0700 h). The light level in the cages was approximately 300 lux. Care was in accordance with the National Research Council’s Guide for the Care and Use of Laboratory Animals at the Oregon National Primate Center. Monkey chow (LabDiet High Protein Monkey Chow; LabDiet, Inc., St. Louis, MO), supplemented with fresh fruit and vegetables, was provided daily at 0800 h and 1500 h, and fresh drinking water was available ad libitum. Serial blood samples were collected across the day and night using a surgically implanted subclavian vein catheter and a remote blood sampling system in which animals were undisturbed, conscious, and unrestrained (Urbanski, 2011b; Urbanski et al., 2014). Plasma samples were prepared and stored at −20 °C until shipment to Bethesda, Maryland, in dry ice; they were subsequently stored at −80 °C. The animals were part of unrelated previous studies.
The rhesus macaques used for RNA sequencing and liquid chromatography tandem mass spectroscopy (LC-MS/MS) analysis of tissues were obtained through the Veterinary Resources Program Primate Recycle Program of the National Institutes of Health (NIH) over a period of 11 years (protocols 99-012 and 11-055). These animals were 3 to 33 years of age, male and female, 4 to 14 kg body weight. All protocols and handling of the animals conformed to the Guidelines for Care and Use of Laboratory Animals (NIH Publication 80-23). Animals were housed under a 12:12 light-dark lighting regimen (lights-on at 0600 h) in NIH facilities for at least 6 weeks. The light level in the cages was approximately 325 lux. Animals (3 per time point) were sacrificed between 1100 and 1300 h (day), 1700 and 1900 h (dusk), 2300 and 0100 h (night), and 0500 and 0700 h (dawn). Animals were anesthetized by intramuscular injection (0.1 mL/kg body weight) of ketamine HCl, 100 mg/mL. A catheter was subsequently placed in the saphenous vein prior to transport to the procedure room. Animals were sacrificed using Euthasol (Virbac, Fort Worth, TX) or Beuthanasia D (Schering Plough, Union, NJ) administered through the catheter. Animals sampled at night or dawn were anesthetized and blindfolded under dim red light provided by a headlamp (Micro water resistant; Petzl, Salt Lake City, UT) fitted with 2 layers of red filter (AP8320; Apollo Design, Fort Wayne, IN). The blindfold was removed after decapitation. Tissue sampling was complete within 45 min; in addition to the pineal gland and retina samples, samples of the corpus callosum, frontal cortex, cerebellum, thalamus, hippocampus, caudate, medulla, pituitary, heart, liver, lung, kidney, skeletal muscle, small intestine, testis, and ovary were obtained. The intervals between euthanasia and freezing for pineal glands and retinal tissues were 15 to 20 min and 20 to 45 min, respectively. Following dissection, tissues were immediately placed in containers on dry ice except the retina, which was washed (phosphate-buffered saline; 0.5-1 min) prior to freezing. Tissue was stored at −80 °C.
Rats
Rats (male Sprague Dawley, 200-250 g) were bred and raised in facilities at the NIH. The lighting cycle was 14:10 h light-dark with lights-on at 0600 h. Blood was collected at 1300 h from CO2-euthanized rats immediately following decapitation; animals were handled in accordance with NIH guidelines.
Humans
Thirty-two human donors (Suppl. Table S1) were recruited through the Research Donor Program of the NIH Blood Bank (Department of Transfusion Medicine, Research Support Services); donors were anonymized. Blood was drawn (from 0730 to 1400 h) into EDTA-treated tubes and stored at 4 °C prior to plasma preparation. Samples were analyzed individually and also were used to prepare a pool for methods development.
Materials
The following were obtained: melatonin (RBI Research Biochemicals, Natick, MA); d4-N-acetyl-5-methoxytryptamine [α,α,β,β-d4, 98% d] (Medical Isotopes, Inc., Pelham, NH); N-acetylserotonin (Sigma-Aldrich, St. Louis, MO); N-acetyltryptamine (Tocris Bioscience, Bristol, UK); d7-N-acetylserotonin [α,α,β,β, acetyl-d7] (NIMH Chemical Synthesis and Drug Supply Program; https://nimh-repository.rti.org/index.cfm). Deuterium-labeled N-acetyltryptamine (d3-N-acetyltryptamine [acetyl-d3]) was synthesized from tryptamine and acetic anhydride-d6 (MP Biomedicals, Solon, OH) on wet ice in 0.1 M phosphate buffer (pH 7.0), following a procedure based on the Schotten-Baumann reaction (Smith and March, 2007). The product was extracted into chloroform and the extract was washed sequentially with 5 volumes of water (2×), 1 M NaOH (2×), 1 M HCl (2×), and water (2×) to remove acetic acid, salts, and unreacted tryptamine. The chloroform was dehydrated (MgCl2) and taken to dryness. The residue was redissolved and crystallized (Desilva and Snieckus, 1978). The product (MP = 74-75 °C, MW = 205.2) comigrated with N-acetyltryptamine and was greater than 99% pure according to thin layer chromatography and high-performance chromatography-mass spectrometry.
LC-MS/MS Measurement of N-acetyltryptamine, N-acetylserotonin, and Melatonin
Sample Preparation
Pineal glands and retinal samples were weighed and then homogenized in 500 µL of phosphate-buffered saline containing 1% RNaseOUT (Thermo Fisher, Waltham, MA). Samples of the homogenate were subsequently used for LC-MS/MS analysis of N-acetyltryptamine, melatonin, and N-acetylserotonin and for analysis of total RNA, which was used for normalization.
A sample was prepared for analysis by mixing a 0.2- to 1-mL volume of plasma or homogenate with a 20-µL volume of methanol and water (1:1) containing the following deuterated standards: 100 pg (0.42 pmol) of d4-N-acetyl-5-methoxytryptamine [α,α,β,β-d4], 100 pg (0.44 pmol) of d7-N-acetylserotonin [α,α,β,β, acetyl-d7], and 100 pg (0.49 pmol) of d3-N-acetyltryptamine [acetyl-d3]. Two volumes of acetonitrile were then added; the tubes were vortexed, chilled on ice for 10 min, and centrifuged (10,000 × g, 15 min). The supernatant was collected, dried by vacuum centrifugation, and solubilized in 0.5 mL of 2% ammonium hydroxide in water. The resulting sample was applied (30 mg/1 mL) to a Strata-X 33-µm polymeric solid phase extraction (SPE) column (Phenomenex, Torrance, CA) that had been preequilibrated (0.5 mL of methanol followed by 2 × 0.5 mL of 2% ammonium hydroxide in water). The column was washed (2 × 0.5 mL of 2% ammonium hydroxide water and methanol [95:5]), bound compounds were eluted (0.5 mL of 2% acetic acid in methanol), the eluent was dried by vacuum centrifugation, and the residue was dissolved in 50 µL of methanol and 0.1% formic acid in water (1:1).
Chromatography
A 10-µL volume of the sample eluted from the SPE column was injected onto an Acquity UPLC BEH C18 (1.7 µm) column (2.1 × 150 mm) (Waters Corporation, Milford, MA) equilibrated with Solvent A (deionized water/0.1% formic acid) at 45 °C. Compounds were eluted over 15 min at a flow rate of 0.3 mL/min, using a gradient from 0% to 5% Solvent B (acetonitrile/0.1% formic acid) from 1 to 2 min and 5% to 30% B from 2 to 12 min. Solvent B was held at 30% from 12 to 13 min and returned to 0% B in a linear gradient from 13 to 15 min and then reequilibrated for 2 min.
MS/MS Detection
Compounds were ionized by electrospray ionization in positive ion mode using an Agilent Jet Stream source (350 °C) and detected using an Agilent 6460 QQQ mass spectrometer (Agilent Technologies, Santa Clara, CA). Data were collected by multiple reaction monitoring (MRM) scans, using the following transitions, fragmented at a constant collision energy of 20 V: N-acetyltryptamine (203.2/144), d3-N-acetyltryptamine (206.2/144), N-acetylserotonin (219.2/160), d7-N-acetylserotonin (226.2/164), melatonin (233.2/174), d4-melatonin (237.2/178). Under these conditions, N-acetyltryptamine eluted at 12.68 min, N-acetylserotonin at 7.68 min, and melatonin at 12.13 min. The area under the curve for each transition was calculated, and the ratio of the peak areas of N-acetyltryptamine and melatonin to their respective internal standards was determined. The concentration was calculated from the measured peak ratios, using a standard curve generated from known amounts of authentic standard added to a fixed amount of deuterated standard. All values presented represent triplicate analytical determinations, 97% of which were within 10% of the mean.
Assays of Plasma Tryptophan, Kynurenine, Cortisol, DHEAS, and Testosterone
Plasma tryptophan and kynurenine were measured using LC-MS/MS (Drug Study Unit, Department of Bioengineering and Therapeutic Sciences, University of California, San Francisco, CA [Huang et al., 2013]; tryptophan was also measured by Mayo Medical Laboratories, Mayo Clinic, Rochester, MN). Plasma cortisol, dehydroepiandrosterone sulfate (DHEAS), and testosterone were assayed using a chemiluminescence-based automatic clinical platform (Roche Cobas e411; Roche Diagnostics, Indianapolis, IN), as previously described (Urbanski et al., 2014); these assays show intra-assay coefficients of variation of less than 6% for nonhuman primates (Lemos et al., 2009).
Determination of Acetylation of Arylamines and Arylalkylamines by NAT1 and NAT2
The NAT nomenclature used has been published (Vatsis et al., 1995).
Enzyme Preparation
Human NAT1 and NAT2 were recombinantly expressed in yeast cells. Briefly, the coding regions of the NAT1*4 (high NAT1 activity), NAT1*14B (low NAT1 activity), NAT2*4 (rapid NAT2 acetylator), and NAT2*5B (slow NAT2 acetylator) were amplified by polymerase chain reaction (PCR) using previously constructed plasmids as previously described (Fretland et al., 2001a, 2001b; Leff et al., 1999). The yeast vector pESP-3 and PCR products (Stratagene, La Jolla, CA) were digested with NdeI and AscI at 37 °C overnight. Purified PCR products and 80 ng of digested plasmid were ligated overnight at 16 °C with T4 DNA ligase (New England Biolabs, Inc, Beverly, MA). Ligated plasmids were transformed into XL-10 Gold Ultracompetent Escherichia coli (Stratagene). Plasmids were isolated from cultures grown from selected colonies using the Qiagen Plasmid Midi kit (Qiagen, Valencia, CA) and sequenced. Constructs were then transformed into competent Schizosaccaromyces pombe and expressed following the manufacturer’s instructions (Stratagene). Mock transformed yeast used pESP-3 vector with no NAT insert. Total cell lysates were prepared by vigorous agitation of yeast in 20 mM sodium phosphate, 1 mM EDTA, and 0.2% Triton-X-100, pH 7.4, containing acid-washed glass beads (Stratagene) for 10 min at 4 °C. Liquid fractions were collected from the lysed cells and centrifuged at 13,000 × g for 20 min. Supernatants were collected, aliquoted, and stored at −80 °C until used for enzymatic assays.
Catalytic Assays
Yeast lysates containing recombinant human NAT1 4, NAT1 14B, NAT2 4, or NAT2 5B were added to reactions containing p-aminobenzoic acid (reference substrate with selectivity for human NAT1), sulfamethazine (reference substrate with selectivity for human NAT2), serotonin, or tryptamine (300 µM) in combination with acetyl coenzyme A (1 mM). Total protein in cell lysate was measured by the Bradford assay using the Bio-Rad protein assay reagent (Bio-Rad, Hercules, CA). All N-acetyltransferase assays were conducted at 37 °C at protein concentrations and over time periods in which the reactions were linear. Negative controls substituted water for acetyl coenzyme A and substituted buffer for enzyme. N-acetyltransferase activities were measured using high-performance liquid chromatography (HPLC) to separate N-acetyltryptamine product from tryptamine substrate. HPLC assays for the N-acetylation of p-aminobenzoic acid and sulfamethazine were performed as described previously (Fretland et al., 2002; Hein et al., 1997). The HPLC method was modified for the separation of tryptamine and N-acetyltryptamine using the following linear gradient of sodium perchlorate pH 2.5 to acetonitrile: 98:02 to 75:25 over 5 min. The retention times of tryptamine and N-acetyltryptamine were 6.2 and 9.3 min, respectively. HPLC separation of serotonin and N-acetylserotonin was achieved using a linear gradient of 98:02 sodium perchlorate pH 2.5: acetonitrile to 50:50 sodium perchlorate pH 2.5: acetonitrile over 5 min. The retention times of serotonin and N-acetylserotonin were 8.8 and 9.8 min, respectively.
Genotyping of Human NAT2
Genomic DNA was isolated from frozen whole blood samples using the QIAamp DNA Mini Kit (Qiagen) according to the manufacturer’s instructions. NAT2 haplotypes, genotypes, and deduced phenotypes were determined as previously described (Doll and Hein, 2001). Briefly, single nucleotide polymorphism (SNP)-specific PCR primers and fluorogenic probes were designed using Primer Express (Applied Biosystems, Foster City, CA). The fluorogenic probes are labeled with a reporter dye (either FAM or VIC) and are specific for 1 of the 2 possible bases identified at 7 SNPs in the NAT2 coding region. Controls (no DNA template) were run to ensure that there was no amplification of contaminating DNA. Subjects were classified as rapid, intermediate, and slow acetylator phenotypes. Individuals possessing 2 of the NAT2 alleles associated with rapid acetylation activity (NAT2*4, NAT2*12, and NAT2*13) were classified as rapid acetylators; individuals possessing 1 of these alleles and 1 allele associated with slow acetylation (NAT2*5, NAT2*6, NAT2*7, and NAT2*14) were classified as intermediate acetylators; and individuals possessing 2 slow acetylation alleles were classified as slow acetylators.
RNA Preparation, Sequencing, and Data Analysis
RNA Preparation
Total RNA was extracted from pineal or retinal homogenates, individual pineal glands, or pieces of other tissues (2- to 4-mm3 pieces) with TRIzol reagent (Invitrogen, Carlsbad, CA), followed by clean-up using an RNeasy Micro Kit with on-column DNase treatment as per the manufacturer’s protocol (Qiagen). The amount and quality of RNA were determined using a NanoDrop spectrophotometer (NanoDrop, Wilmington, DE) and an Agilent 2100 Bioanalyzer (Agilent Technologies). RIN values were more than 9 for all tissues. Two mixed-tissue RNA samples were prepared (Day, male; Night, female) by adding equal amounts of RNA extracted from 16 tissues, not including the pineal gland or retina.
Library Construction
RNA-Seq libraries were constructed from 0.7 to 1 µg total RNA using the TruSeq Stranded Total RNA Sample Prep Kits (Illumina Cat. No. RS-122-2301; Illumina, San Diego, CA) following the manufacturer’s instructions. Insert sizes were approximately 175 bp. Unique barcode adapters were applied to each library. Equal volumes of individual libraries were pooled and run on a MiSeq instrument (Illumina). The libraries were then repooled based on the MiSeq demultiplexing results. The pooled libraries were sequenced on a HiSeq2000 (Illumina) using version 3 chemistry.
RNA-Seq Alignment
Reads were aligned with the RNA-STAR aligner (v. 2.3.0e), using a rhesus rheMac3 genome build. Quality control metrics were calculated and visualized using FastQC and in-house written scripts; GC artifacts and k-mer abnormalities were not found. The mean alignment rates were 89.19% and 85.78% for the retina and pineal gland, respectively. Uniquely aligned reads were kept for further analysis, and reads mapped to more than 1 locus were discarded. The average mean GC content was 43% (SD = 10). Of the aligned read-pairs, 33.1% mapped at least partially to the exon of a known gene, 11% were mapped to 3′ UTRs and 4% to 5′ UTRs. Of the remaining aligned read-pairs, 44% mapped to intronic regions of known genes, while 8% mapped to intergenic regions. All processed reads were mapped to the correct strand by use of strand-specific alignment and read assignment. The large proportion of reads mapping to intronic regions is typical of sequencing results derived from libraries that were ribodepleted, which captures mature and immature transcripts (Li et al., 2014). The sequences reported in this paper have been deposited in the National Center for Biotechnology Information Gene Expression Omnibus, http://www.ncbi.nlm.nih.gov/geo (GEO series accession number GSE78165) and are accessible at http://www.ncbi.nlm.nih.gov/geo/query/acc.cgi?token=epkvmssmvhmrlmf&acc=GSE78165.
Statistics
Unless otherwise indicated, all values are presented as mean and variations are presented as the standard error of the mean (SEM).
Human Plasma N-acetyltryptamine and Melatonin Analysis
Far outliers were defined as X > Median + 3*(IQ), where IQ is the interquartile distance (Tukey, 1977).
Rhesus Plasma N-acetyltryptamine and Melatonin Analysis
The mean levels of N-acetyltryptamine and melatonin during 6-h periods (night, 2100-0300 h; day, 0900-1500 h) were calculated (N = 4). The significance of differences between day and night was determined using a 2-tailed Student t test, with equal variance (type 2).
N-acetyltransferase Activity
Differences in N-acetyltransferase activity between recombinant NAT1 and NAT2 phenotypes were tested for significance by Student t test (unpaired) using GraphPad Software, Inc. (San Diego, CA).
Transcript Abundance Analysis
Read counts were provided by R sub-reads package (featureCounts function) with parameters specifying paired-end reads and reverse-complement for the second strand. Annotation for assigning the reads was derived from Gencode v.19 human annotation. Gene coordinates were lifted over using RheMac3/hg19 liftover chains, and only sequences that shared no less than 95% homology were kept, resulting in a total of 50,308 genes. Differential expression analysis was performed using DESeq2 (Love et al., 2014). Fold-change estimates were calculated via DESeq2 using the parameter estimates from the model fit. Differential expression analysis and changes in expression levels (in log2 scale) were calculated for each pair of time points, including the nonadjacent ones (i.e., dawn-dusk). Statistical analysis was performed using Wald’s test, deriving the p values. All p values were adjusted for multiple testing using the FDR method of Benjamini and coworkers (Benjamini and Hochberg, 1995; Benjamini and Yekutieli, 2001). Outlier detection was performed using Cook’s distance, a measure of the difference between fitted coefficients with and without each individual sample (Cook, 1977). The pineal and the retina versus mixed-tissue analyses followed a slightly different method. Two separate comparisons were run: comparison of all 12 pineal replicates versus mixed-tissue (2 replicates) and comparison of 12 retina sample replicates versus 2 mixed-tissue replicates. Statistical analysis was identical as in the pineal gland–retina time point differential expression analysis. The raw data and differential expression analysis results have been deposited in the National Center for Biotechnology Information Gene Expression Omnibus, http://www.ncbi.nlm.nih.gov/geo/ (GEO series accession number GSE78165).
Pineal Gland and Retina Analytes
Differences were analyzed using a Student t test.
Graphing
Figures 3 to 5 were generated using pro Fit v7.0.8 (QuantumSoft 8707 Uetikon am See, Switzerland). Figure 6 was generated using ggplot2, v. 2.1.0 (http://ggplot.yhathq.comb) and in-house written R scripts, under R v. 3.3.2.
Results
LC-MS/MS Detection of N-acetyltryptamine, N-acetylserotonin, and Melatonin
Calibration curves were generated adding known amounts of each compound to a fixed amount of labeled internal standard (Figure 2A). A linear response was obtained for all compounds with lower limit of quantitation values for amounts injected on the column between 1 fmol and 0.8 fmol for these compounds. The responses were linear from 0.02 to 10 nM (coefficient of determination = 0.9996, sum of squares of residuals = 0.0505 for N-acetyltryptamine, 0.9992 and 0.0172 for N-acetylserotonin, and 0.9971 and 1.89 for melatonin).
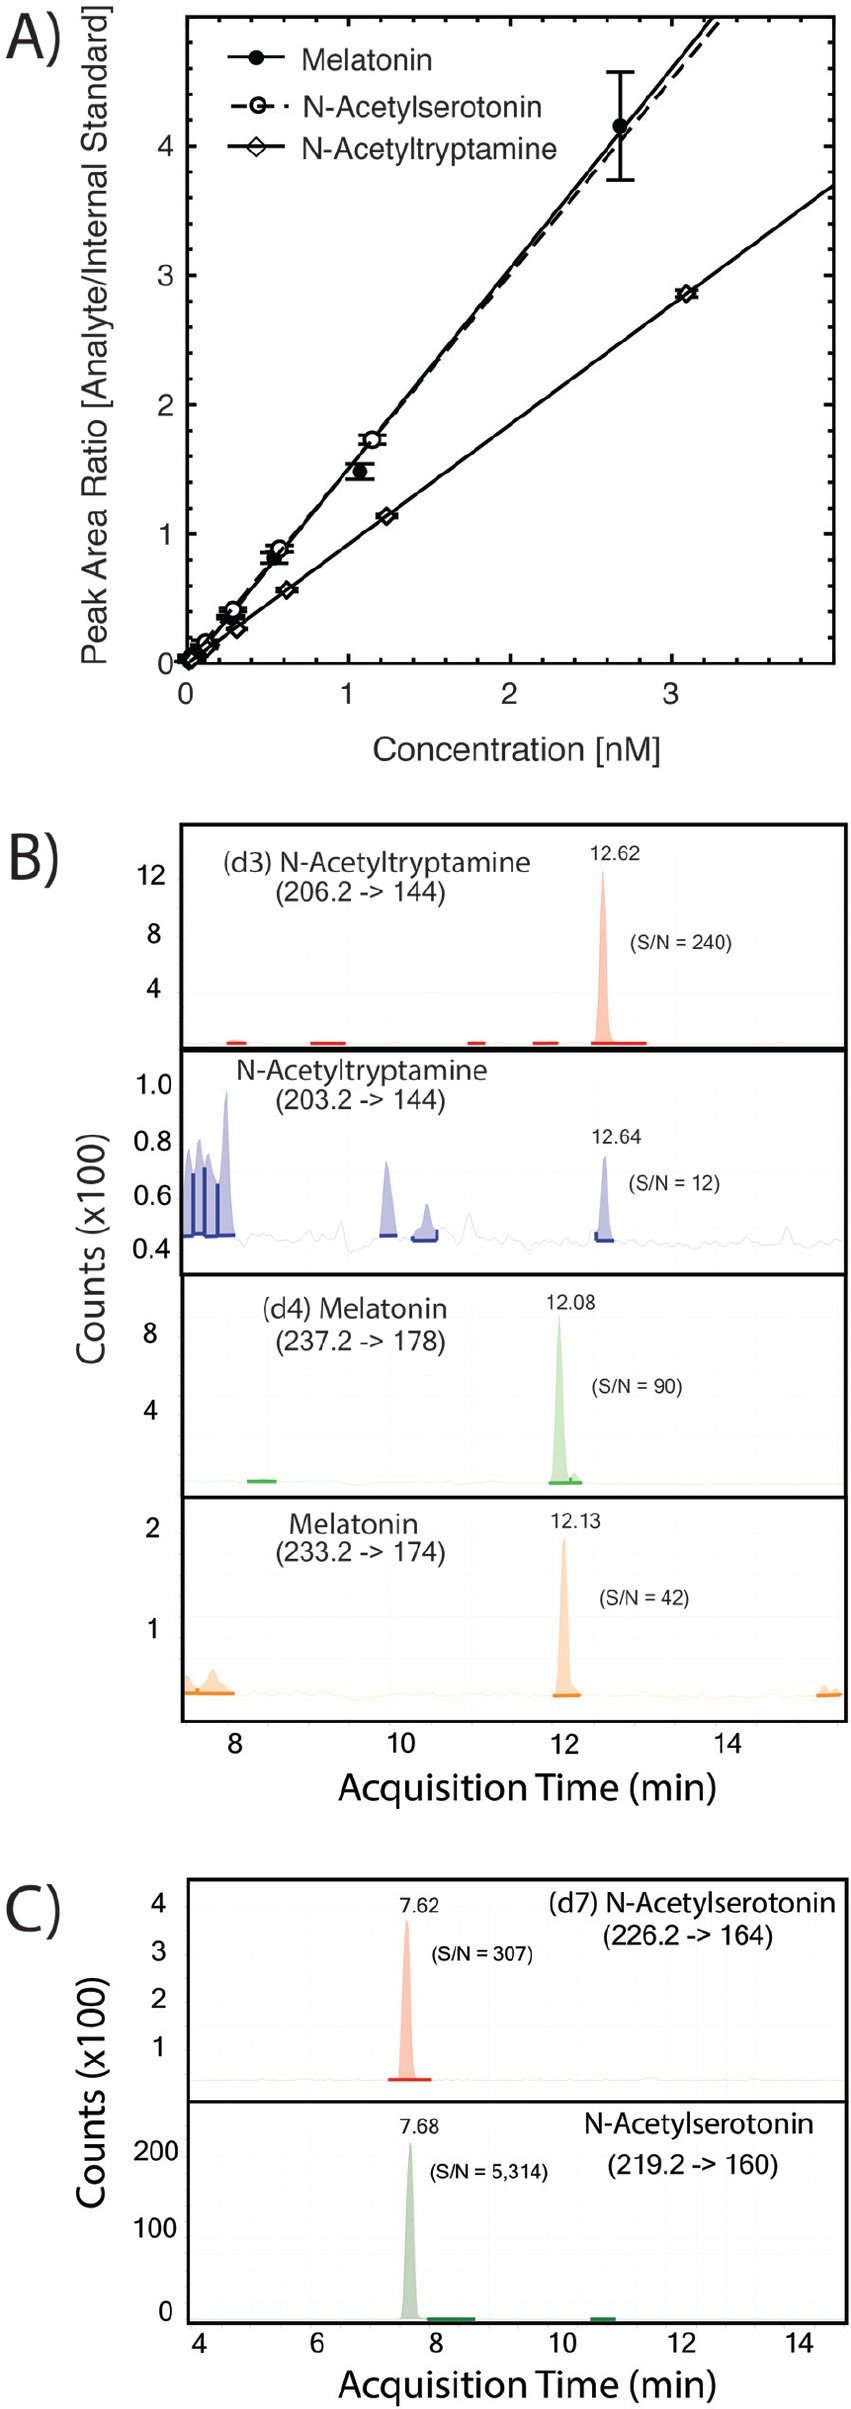
Detection of N-acetyltryptamine, N-acetylserotonin, and melatonin by LC-MS/MS. The SPE extract (10 µL of 50 µL total) from 1 mL of human plasma was injected onto the UPLC RP column and eluted as described. N-acetyltryptamine, N-acetylserotonin, melatonin, and the internal deuterated standards were analyzed by MRM mass spectrometry, monitoring the indicated transitions. (A) Calibration curves for N-acetyltryptamine, N-acetylserotonin, and melatonin. The indicated concentrations of N-acetyltryptamine, N-acetylserotonin, and melatonin (from 0.01 to 6 nM) were added to a constant concentration of deuterated internal standards (d3-N-acetyltryptamine and d7-N-acetylserotonin and d4-melatonin). The integrated peak of MRM signal intensity was quantified, and the ratio of analyte to internal standard was calculated. Each point indicates the mean ± SEM (n = 3), and a linear fit to the data points was calculated for each compound. (B) N-acetyltryptamine and melatonin in human plasma. Top: MRM signal for internal standard (98 fmol) d3-N-acetyltryptamine. Second from top: MRM signal for plasma N-acetyltryptamine (12.64 min). Second from bottom: MRM signal for the internal standard (85 fmol) d4-melatonin. Bottom: MRM signal for plasma melatonin (peak at 12.13 min). (C) N-acetylserotonin in rhesus pineal tissue. Top: MRM signal for internal standard (198 fmol) d7-N-acetylserotonin. Bottom: MRM signal for N-acetylserotonin (peak at 7.68 min) in extracts from rhesus pineal gland (1.5 mg tissue) collected at dawn. Further details appear in the Materials and Methods section.
Recovery of the labeled standards ranged from 80% to 90%. When human plasma extracts were analyzed, peaks were observed eluting from the reversed-phase LC column with the same retention time and specific MRM transitions as authentic N-acetyltryptamine and melatonin (Figure 2B). Analysis of rhesus pineal extracts revealed a peak eluting with the same retention time and specific MRM transitions as authentic N-acetylserotonin (Figure 2C). Within-day variance of triplicate determinations for N-acetyltryptamine and melatonin in a plasma pool were −5% to 12% and −13% to 16%, respectively, and for N-acetylserotonin in a pineal gland extract were 4% to 8%.
Daytime Plasma N-acetyltryptamine and Melatonin
N-acetyltryptamine and melatonin were detected in daytime rat, rhesus macaque, and human plasma; N-acetylserotonin was not (Table 1). The amounts of N-acetyltryptamine and melatonin in daytime rat and rhesus plasma ranged from 0.05 to 0.5 nM. The average human plasma N-acetyltryptamine and melatonin values obtained from 32 healthy donors (22-69 years of age; 24 males and 8 females; admitted between 0730 and 1400 h) were 0.03 and 0.06 nM, respectively (Figure 3, Suppl. Table S1). Human daytime plasma N-acetyltryptamine values ranged from a minimum of 0.005 nM to a maximum of 0.25 nM (median = 0.014 nM, first quartile = 0.01 nM and third quartile = 0.028 nM). Two of the donors were identified as far outliers for plasma N-acetyltryptamine, with values 5- and 8-fold higher than the average. Plasma melatonin levels had a minimum concentration of 0.003 nM and a maximum of 0.4 nM (median = 0.037 nM, first quartile = 0.017 nM and third quartile = 0.079 nM). One of the donors was identified as a far outlier for plasma melatonin. A correlation was not observed between N-acetyltryptamine and melatonin values. Tryptophan and kynurenine levels in the outlier’s plasma were within the range of the population studied; an association of plasma N-acetyltryptamine levels with NAT2 phenotype was not apparent (Suppl. Table S1).
Daytime levels of N-acetyltryptamine and melatonin in rat, human, and rhesus macaque plasma.
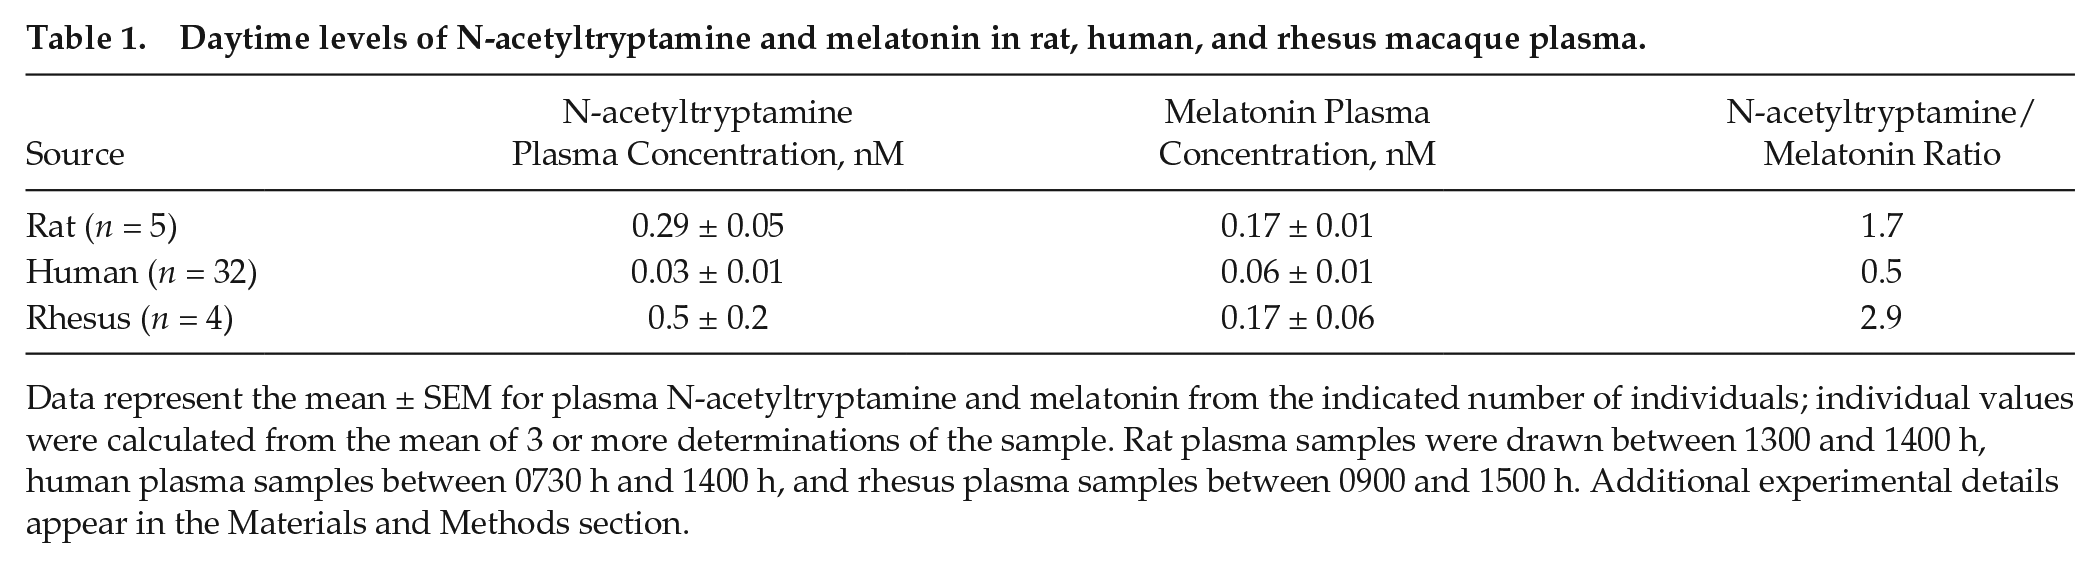
Data represent the mean ± SEM for plasma N-acetyltryptamine and melatonin from the indicated number of individuals; individual values were calculated from the mean of 3 or more determinations of the sample. Rat plasma samples were drawn between 1300 and 1400 h, human plasma samples between 0730 h and 1400 h, and rhesus plasma samples between 0900 and 1500 h. Additional experimental details appear in the Materials and Methods section.
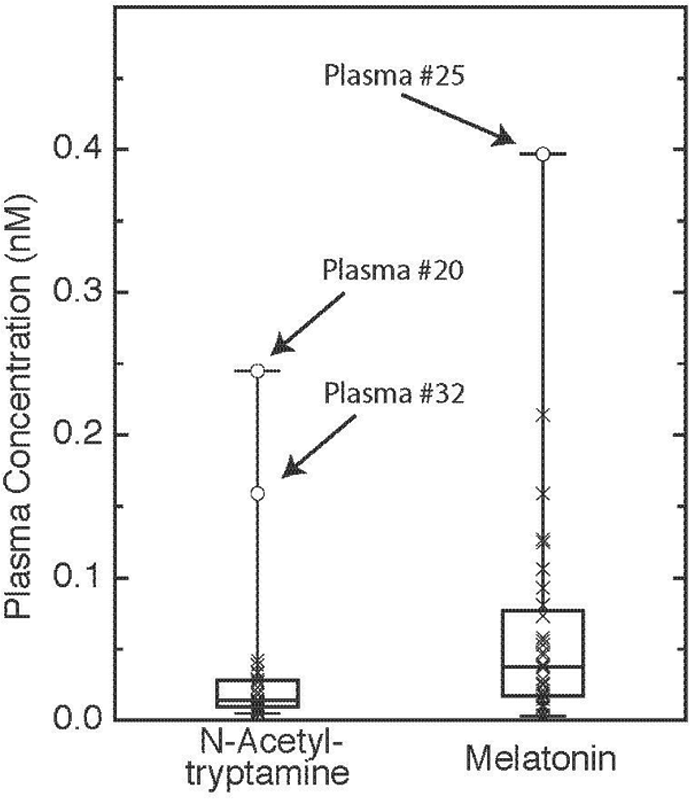
Daytime human plasma N-acetyltryptamine and melatonin. Box plot of daytime plasma N-acetyltryptamine and melatonin values in 32 healthy donors (22-69 years of age; 24 males and 8 females). Samples were collected between 0730 and 1400 h. Close and far outlier cutoff values are calculated as X > Median + 1.5 *(IQ) and X > Median + 3*(IQ), respectively, where IQ is the interquartile distance (Tukey, 1977). The close and far outliers for melatonin are >0.13 nM and >0.22 nM, respectively. Close and far outliers for N-acetyltryptamine are >0.04 nM and >0.07 nM, respectively. Far outliers are indicated by subject identifying numbers in the figure; 2 melatonin near outliers (Samples 10 and 32) and 1 N-acetyltryptamine near outlier (Sample 25) were also identified. Suppl. Table S1 provides details of subject age, sex, weight, and genotype and plasma values for N-acetyltryptamine, melatonin, tryptophan, and kynurenine. Further details appear in the Materials and Methods section.
Plasma N-acetyltryptamine Exhibits a 24-h Rhythm in the Rhesus Macaque
Plasma was prepared from blood obtained over a 24-h period from 4 unrestrained rhesus macaques (Urbanski, 2011a) (Figure 4). Plasma N-acetyltryptamine and melatonin levels in individual animals were higher at night (p < 0.05), based on mean values calculated from samples collected during 6-h “day” (0900-1500 h) and “night” periods (2100-0300 h). The absolute concentrations of N-acetyltryptamine and melatonin at similar times of the day varied significantly between individual animals. The individual-to-individual variation in melatonin and the magnitude of the nocturnal increase in melatonin are consistent with published reports regarding cerebral spinal fluid melatonin in restrained rhesus macaques (Perlow et al., 1981; Reppert et al., 1979a, 1979b).
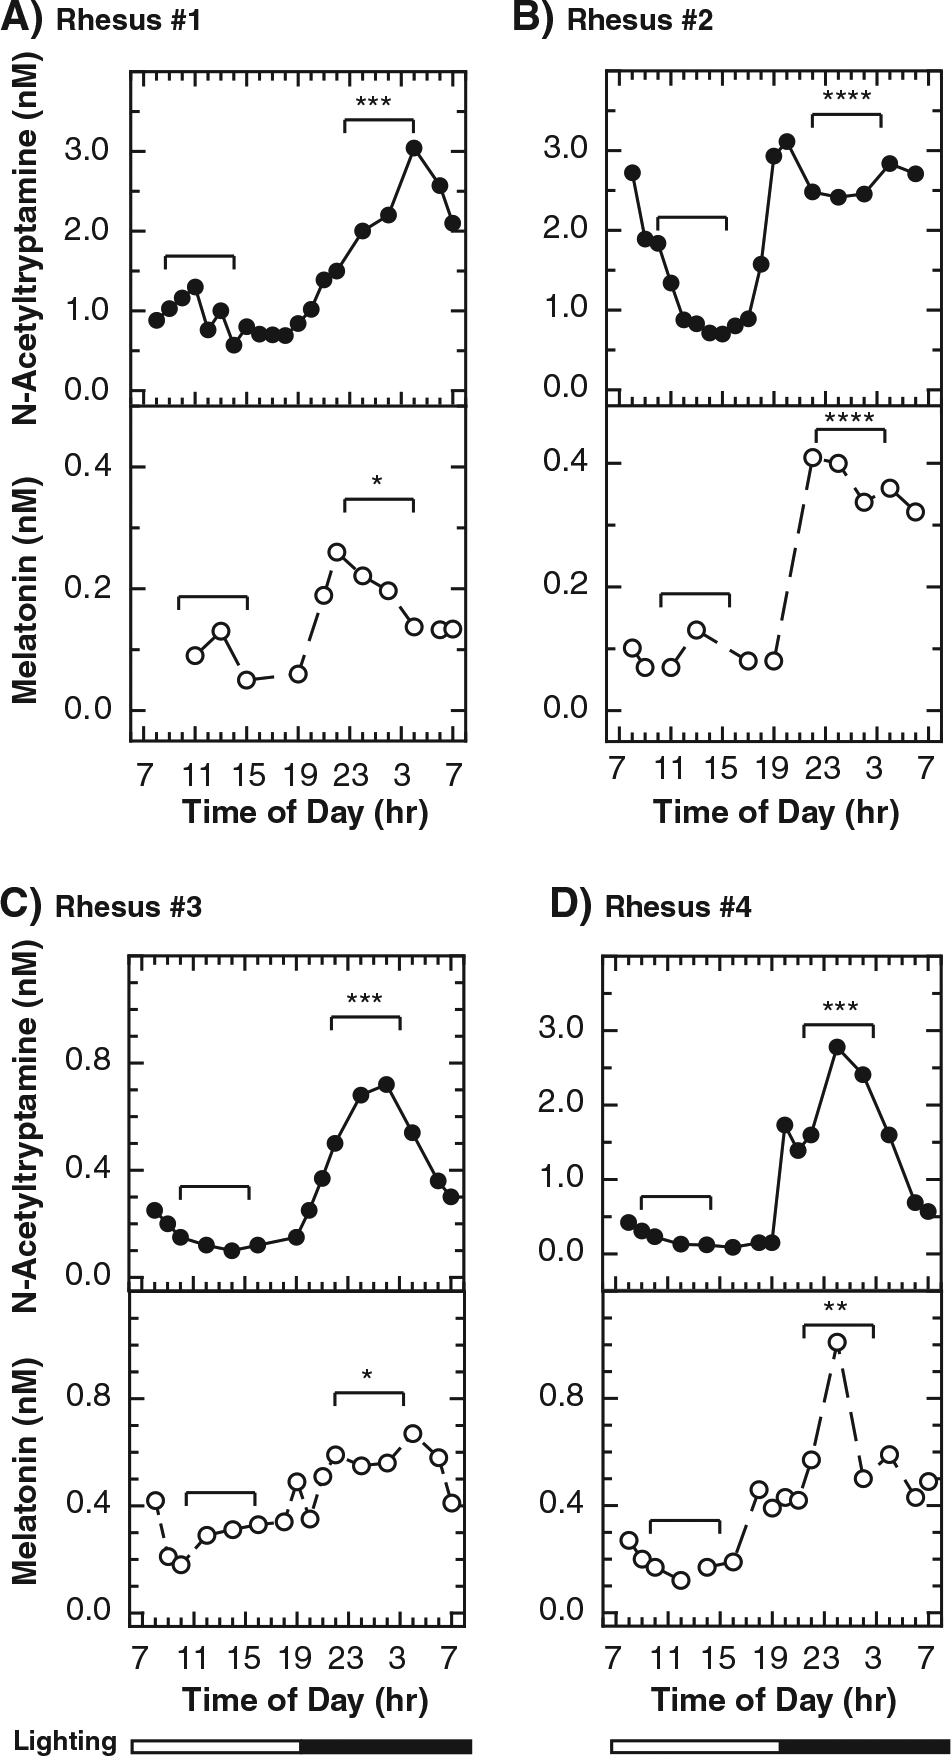
Daily changes in plasma N-acetyltryptamine and melatonin in the rhesus macaque. Two ovariectomized (OVX) females (Rhesus 1 and Rhesus 2; A and B) and 2 males (Rhesus 3 and 4; C and D) were studied. Animals were undisturbed, conscious, and unrestrained (Urbanski, 2011a). Blood was obtained continuously and remotely and in 10- to 30-min fractions over a 25-h period. The lighting schedule was 12:12 (light-dark) with lights-on at 0700 h. As required, sequential day samples were pooled to increase the melatonin signal strength to detectable levels. For each animal, N-acetyltryptamine and melatonin levels (mean ± SEM) for samples collected within the 6-h night (2100-0300 h) and day (0900-1500 h) periods were calculated. The significances of differences between day and night were determined using a 2-tailed Student t test, with equal variance (type 2). The p values of night versus day differences are indicated as follows: *0.01-0.05, **0.001-0.01, ***0.0001-0.001, ****<0.0001.
Plasma Cortisol, DHEAS, and Testosterone Levels during a 24-h Period
Cortisol, DHEAS, and testosterone in the plasma samples used in Figure 4 were determined (Figure 5) and found to exhibit 24-h patterns that were generally similar to those previously reported for unrestrained rhesus macaques (Jacoby et al., 1974; Lemos et al., 2009; Perlow et al., 1981; Sitzmann et al., 2014; Sorwell et al., 2014; Urbanski et al., 2014). This provides evidence of the physiological normalcy of the circadian system of the animals used in the present study.
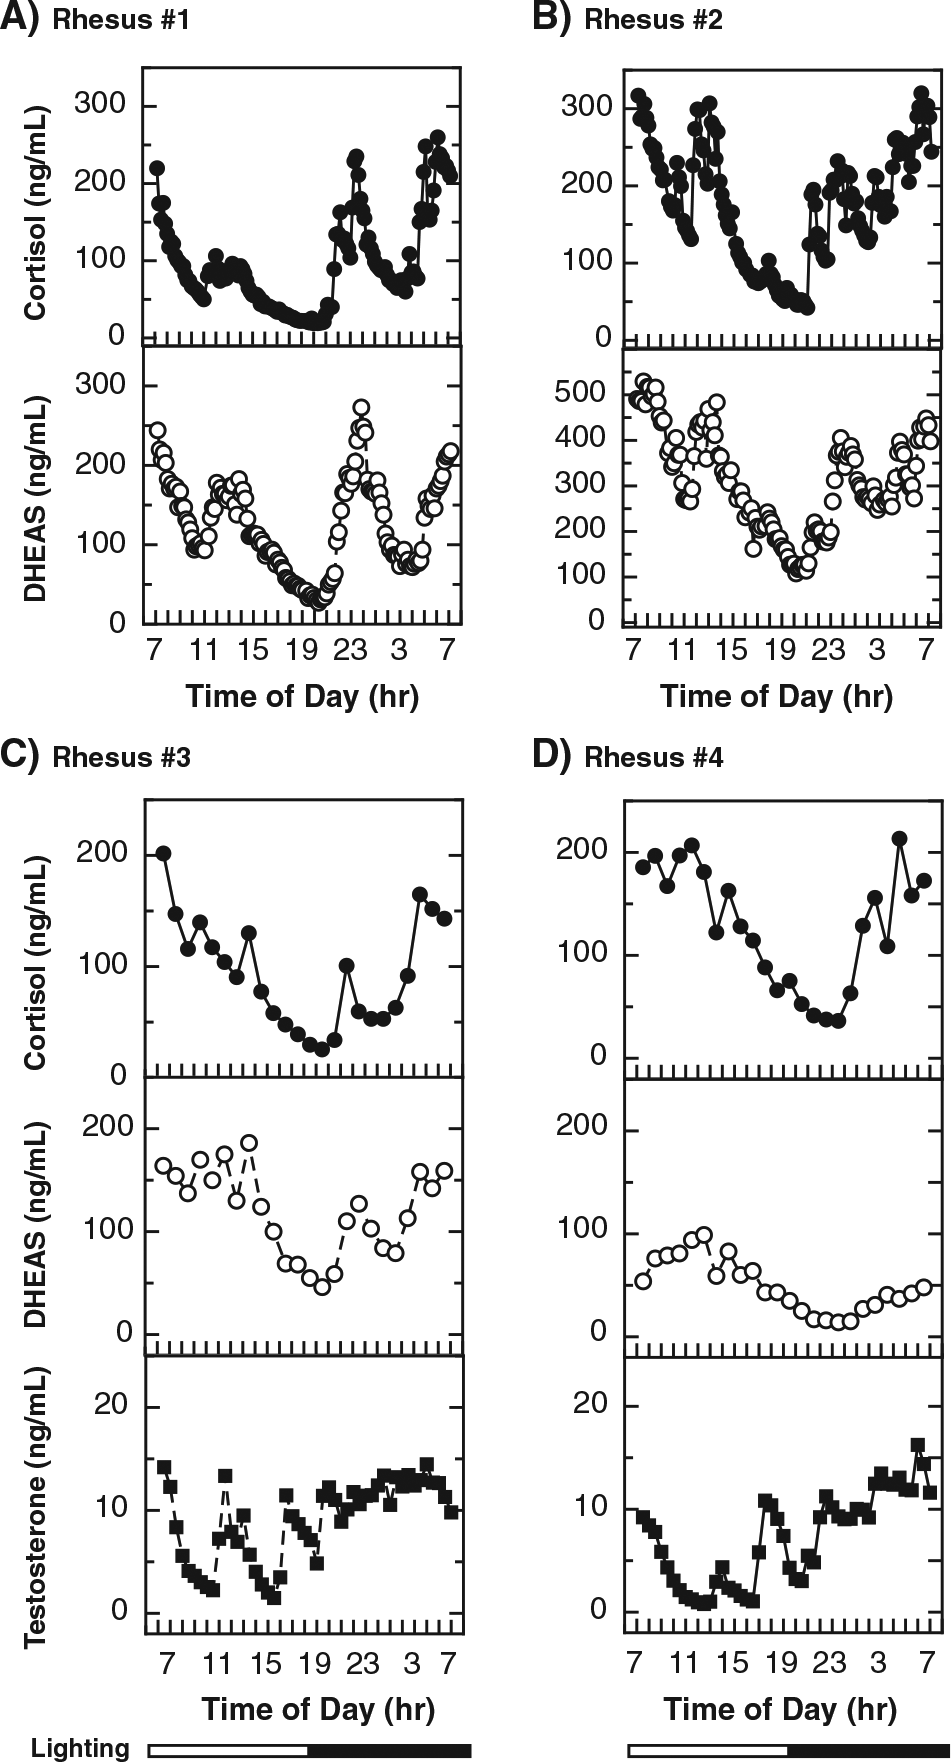
Plasma cortisol, DHEAS, and testosterone over 24 h in rhesus macaques. Aliquots of the plasma samples used in Figure 4 for N-acetyltryptamine and melatonin determinations were also analyzed for levels of cortisol, DHEAS (A-D), and testosterone (in males, C and D). Steroid levels were measured in samples obtained at 10- or 30-min intervals. Additional experimental details are provided in the Materials and Methods section.
Expression of Melatonin Synthesis-related Genes in the Rhesus Macaque Pineal Gland and Retina
Limited data are available regarding the 24-h pattern of expression of genes in the melatonin/N-acetyltryptamine synthesis pathway in the rhesus pineal gland and retina (Coon et al., 2002a). This was expanded here using RNA sequencing data obtained at 4 times of the day from RNA extracted from the pineal gland, retina, and a mixture of tissues. As expected, TPH1, DDC, AANAT, and ASMT (Figure 1) transcripts were detectable at all 4 times in the pineal gland and retina (Figure 6, Suppl. Table S2). Analysis of the average expression levels for all 4 time samples indicated that AANAT transcript levels were ~10% lower (p < 0.001) in the pineal gland (52 ± 2, n = 12) compared with the retina (58 ± 5, n = 12). In contrast to this similarity, marked differences were observed in the levels of TPH1 and ASMT transcripts, which encode enzymes required to convert tryptophan to melatonin. Pineal transcripts encoding TPH1 (584 ± 32, n = 12) and ASMT (148 ± 8, n = 12) were ~ 50-fold more abundant (p < 0.001) in the pineal gland compared with the retina (TPH1, 12 ± 2; ASMT, 3 ± 1, n =12) (Figure 6, Suppl. Table S2). TPH2 transcript levels in the pineal gland (1.13 ± 0.36, n = 12) and retina (0.02 ± 0.03, n = 12) were more than 500-fold lower than those of TPH1 in these tissues (p < 0.001), indicating that at these sites TPH2 is unlikely to contribute significantly to tryptophan hydroxylation. NAT1 and NAT2 transcript abundances in both tissues (pineal NAT1, 0.37 ± 0.03, n = 12; retina NAT1, 0.02 ±.02, n = 12; pineal NAT2, 0.22 ± 0.04, n = 12; retina NAT2, 0.15 ± 0.03, n = 12) were more than 100-fold lower than AANAT. Pineal and retina NAT1 and NAT2 appeared to be 4- to 8-fold lower than those in a mixture of tissues (NAT1, 1.26; NAT2, 1.91) based on limited observations (n = 2). DDC transcript levels were 3400-fold lower (p < 0.001) in the retina (0.3 ± 0.86, n = 12) than in the pineal gland (93 ± 11, n = 12), consistent with the role of the pineal gland as the source of circulating melatonin.
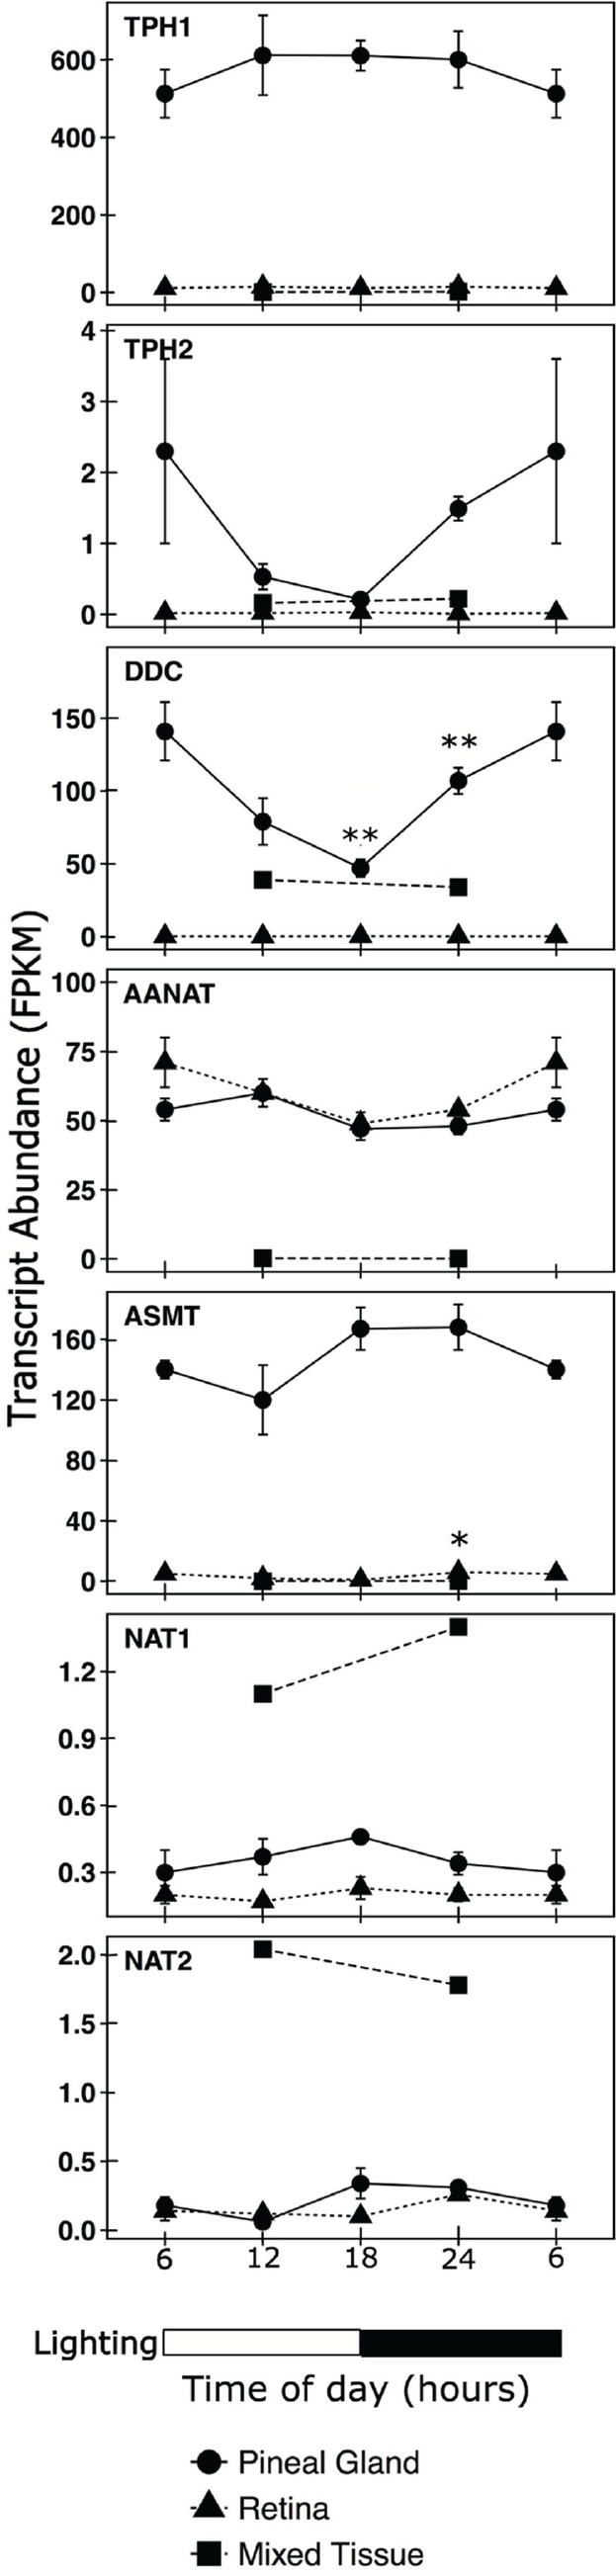
Daily changes in transcripts linked to N-acetyltryptamine and melatonin synthesis. Values are given as the mean fragments per kilobase of exon per million fragments mapped (FPKM) ± SEM (n = 3) in extracts of pineal glands (solid circles, solid line) and retinas (solid triangles, short dashed line) obtained at the indicated times. The 6 hour time points are doubled plotted. Transcript abundance values in single samples of a mixture of RNA (mixed tissue, solid squares, long dashed line) prepared from RNA extracted from 16 tissues removed at the time indicated are provided for comparison. The absence of an error bar indicates that it is covered by the symbol. Lighting is indicated by the horizontal bar on the bottom of the figure. Differential analysis was performed using DESeq2 software package (Love et al., 2014), and p values were adjusted for multiple testing using the procedure of Benjamini and Hochberg (1995). *Differentially expressed relative to midday value, adjusted p < 0.002; **differentially expressed relative to midday and dawn values, adjusted p < 0.001. The average values of TPH1, DDC, and ASMT transcript abundance in pineal samples (n = 12) are significantly higher than in the retina samples (N = 12), p < 0.001. Data in the figure are available in Supplemental Table S2 and have been deposited in the National Center for Biotechnology Information Gene Expression Omnibus, http://www.ncbi.nlm.nih.gov/geo/ (GEO series accession number GSE78165). Additional details appear in the Materials and Methods section.
Moreover, time-of-day changes in AANAT mRNA were not observed, confirming previous findings (Coon et al., 2002a), consistent with the view that the 24-h rhythm in AANAT activity in the rhesus macaque does not involve transcriptional regulation but rather is dependent on posttranslational modifications. However, time-of-day-dependent changes in the abundance of DDC transcripts in the pineal gland and ASMT transcripts in the retina were observed, which argues for a role of these enzymes in controlling daily changes in the melatonin/N-acetyltryptamine pathways.
Indoleamines Are Poor Substrates of NAT1 and NAT2
The broad distribution of NAT1 and NAT2 in the body and the extant evidence that arylamine N-acetyltransferase acetylates the arylalkylamine serotonin (Steinberg et al., 1969) pointed to the possibility that these enzymes might contribute to the circulating N-acetyltryptamine. This led us to study indoleamine acetylation using recombinant human NAT1, NAT2, and variants of these enzymes expressed in yeast (Table 2). Both enzymes were found to acetylate tryptamine and serotonin. Genetic polymorphisms were exhibited toward the N-acetylation of tryptamine and serotonin by recombinant human NAT1 and NAT2. The rate of tryptamine N-acetylation catalyzed by NAT1 4 was significantly (p < 0.005) higher than that of NAT1 14B; in addition, the rates of N-acetylation of both indoleamines were significantly (p < 0.005) higher when catalyzed by the reference NAT2 4 than those associated with slow acetylator phenotype (i.e., NAT2 5B). Although the rates of N-acetylation by recombinant human NAT1 and NAT2 are not relevant to absolute rates of acetylation in human tissues, it is noteworthy that the rates of N-acetylation of tryptamine and serotonin by recombinant human NAT1 4 were 28,000-fold and 100,000-fold lower, respectively, than that for p-aminobenzoic acid. Similarly, the rates of tryptamine and serotonin N-acetylation catalyzed by recombinant human NAT2 4 were 275- and 1000-fold lower, respectively, than that for sulfamethazine. Thus, it is clear that whereas arylamines are preferred substrates of NAT1 and NAT2, these enzymes can also acetylate arylalkylamines, albeit at levels that are orders of magnitude lower.
N-acetylation of arylamines and arylalkylamines by NAT1 and NAT2.
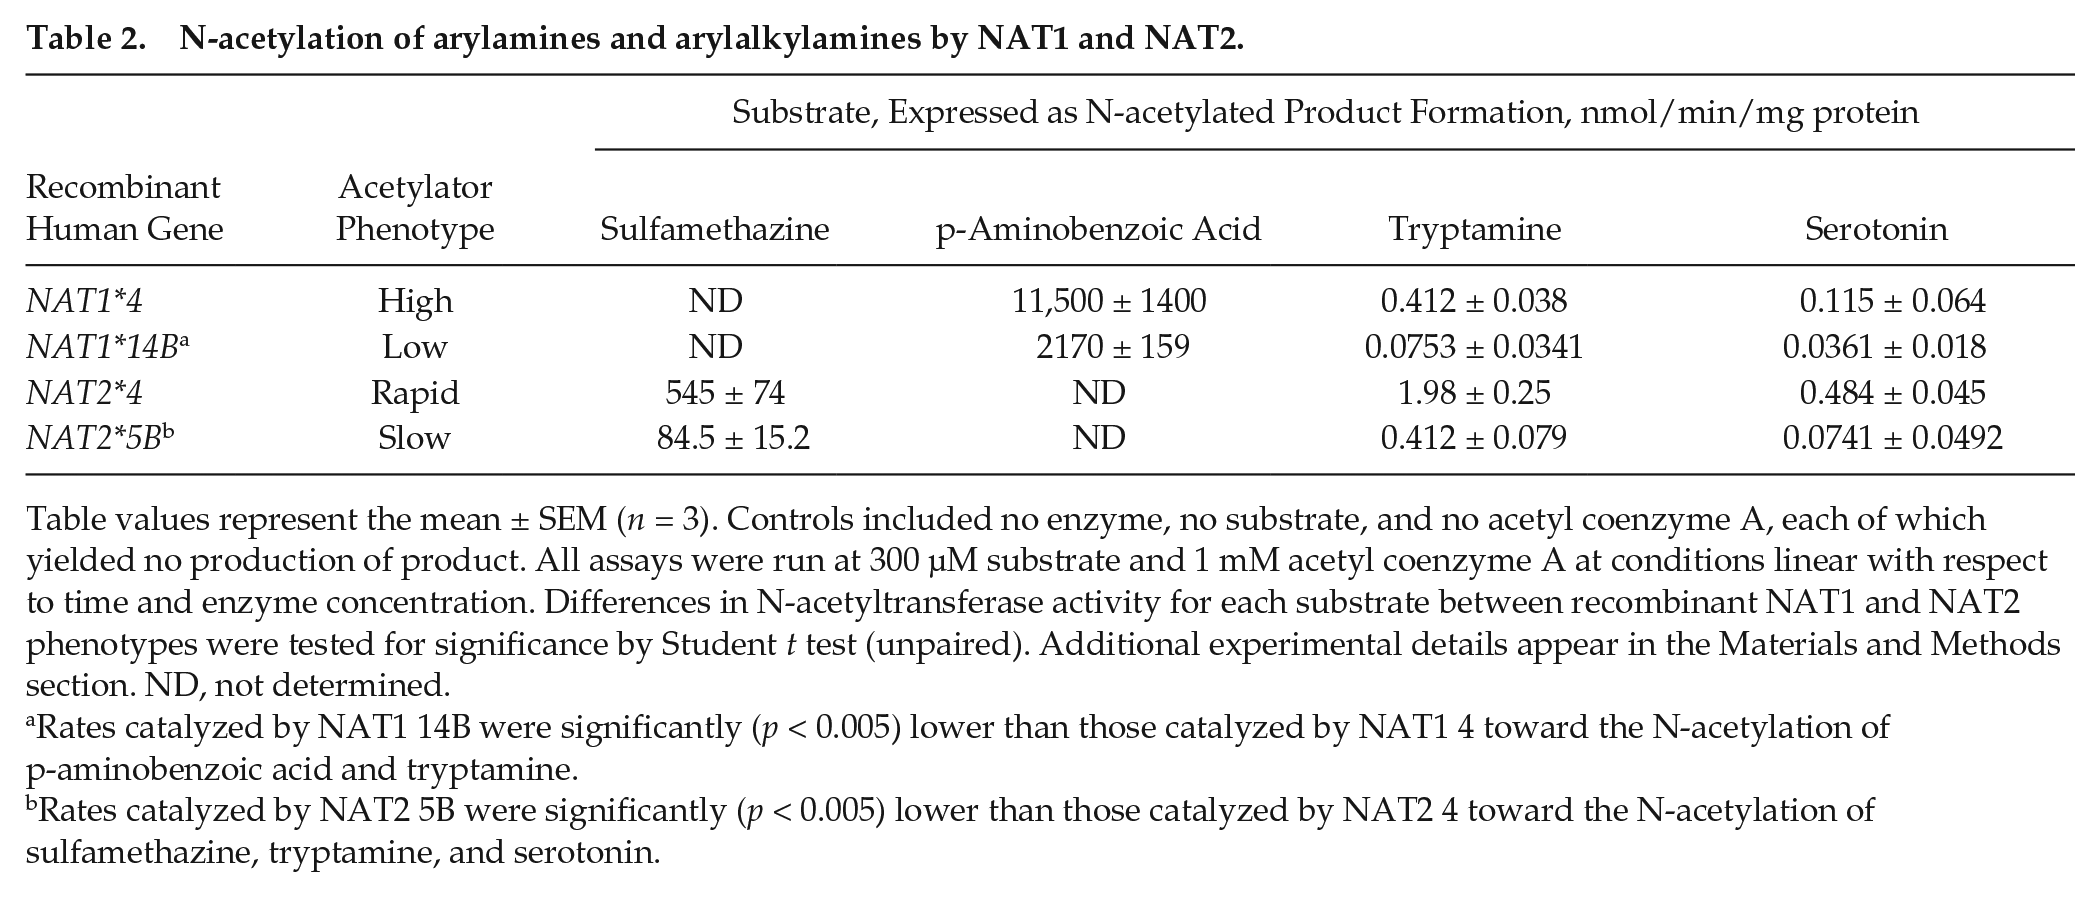
Table values represent the mean ± SEM (n = 3). Controls included no enzyme, no substrate, and no acetyl coenzyme A, each of which yielded no production of product. All assays were run at 300 µM substrate and 1 mM acetyl coenzyme A at conditions linear with respect to time and enzyme concentration. Differences in N-acetyltransferase activity for each substrate between recombinant NAT1 and NAT2 phenotypes were tested for significance by Student t test (unpaired). Additional experimental details appear in the Materials and Methods section. ND, not determined.
Rates catalyzed by NAT1 14B were significantly (p < 0.005) lower than those catalyzed by NAT1 4 toward the N-acetylation of p-aminobenzoic acid and tryptamine.
Rates catalyzed by NAT2 5B were significantly (p < 0.005) lower than those catalyzed by NAT2 4 toward the N-acetylation of sulfamethazine, tryptamine, and serotonin.
N-acetyltryptamine, N-acetylserotonin, and Melatonin in Rhesus Pineal and Retinal Extracts
Analysis of extracts of the rhesus pineal gland and retina obtained throughout the day (n = 12; Table 3) revealed that the concentrations (fmol/µg RNA) of melatonin and N-acetylserotonin (pineal melatonin, 11,200 ± 2600, n = 12; pineal N-acetylserotonin, 4600 ± 2500, n = 12) were more than 1000-fold higher than in retinal extracts (retinal melatonin, 0.48 ± 0.21); retinal N-acetylserotonin was below the level of detection (n = 12) (Table 3). There was a marked time-of-day difference in pineal N-acetylserotonin, which was undetectable at midday (n = 3), 16,000 ± 13,000 (n = 3) at midnight, and detectable at dusk and dawn (Table 3). This is consistent with previous reports of a nocturnal increase in pineal N-acetylserotonin in the rat (Mefford et al., 1983). N-acetyltryptamine was detected in both tissues, with pineal levels (10 ± 1) ~10-fold higher than those in the retina (0.51 ± 0.2, n = 12); significant time-of-day differences in N-acetyltryptamine levels were not detected.
N-acetyltryptamine, N-acetylserotonin, and melatonin in rhesus macaque pineal and retinal extracts.
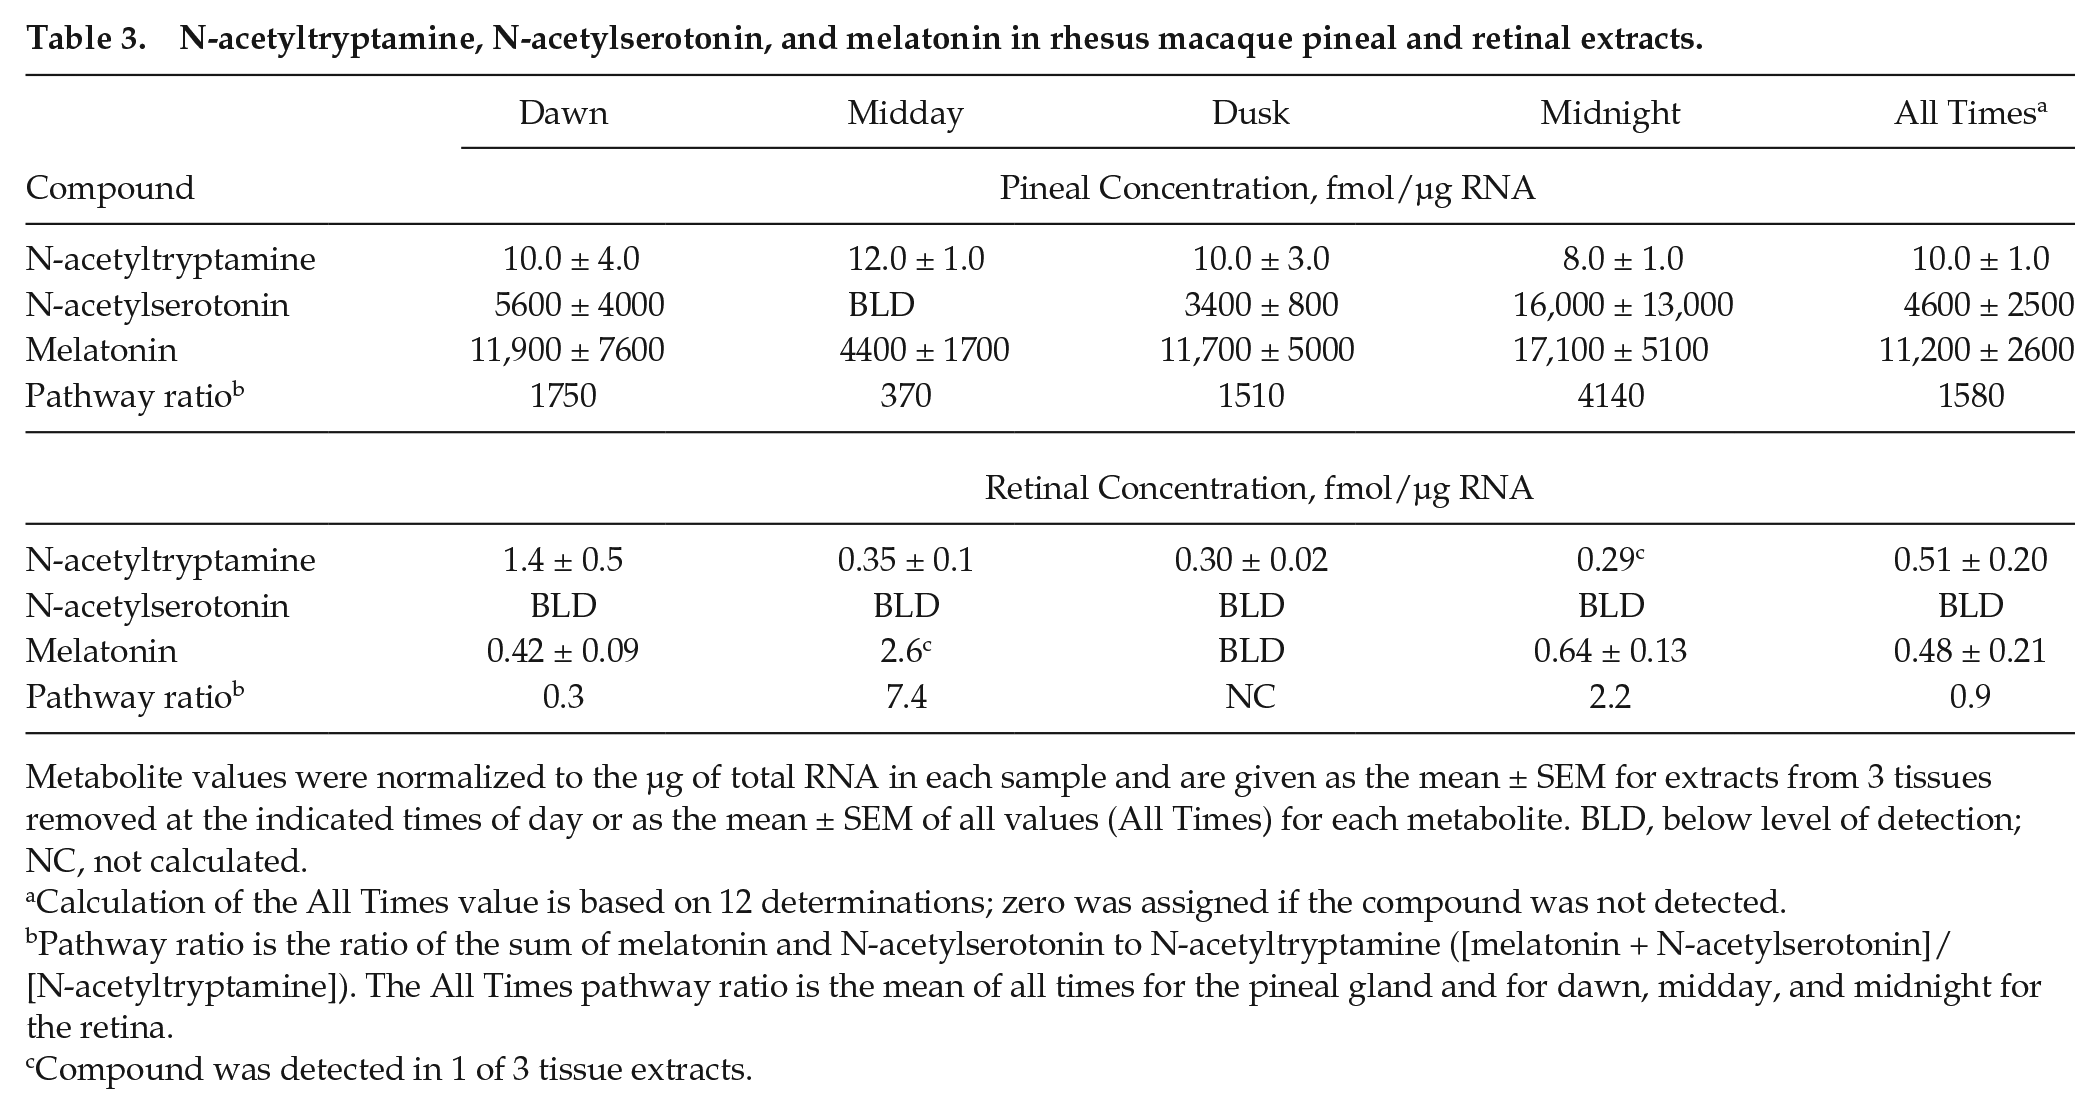
Metabolite values were normalized to the µg of total RNA in each sample and are given as the mean ± SEM for extracts from 3 tissues removed at the indicated times of day or as the mean ± SEM of all values (All Times) for each metabolite. BLD, below level of detection; NC, not calculated.
Calculation of the All Times value is based on 12 determinations; zero was assigned if the compound was not detected.
Pathway ratio is the ratio of the sum of melatonin and N-acetylserotonin to N-acetyltryptamine ([melatonin + N-acetylserotonin]/[N-acetyltryptamine]). The All Times pathway ratio is the mean of all times for the pineal gland and for dawn, midday, and midnight for the retina.
Compound was detected in 1 of 3 tissue extracts.
The results of analyte determination were used to obtain an approximate indicator of the relative capacity of each tissue to synthesize N-acetyltryptamine, compared with the capacity to synthesize N-acetylserotonin and melatonin; this indicator, termed the pathway ratio (Table 3), was calculated for each sampling time. Based on the average of 4 times (all times), it appears that in the retina, tryptophan is converted to melatonin + N-acetylserotonin at a relatively similar rate as it is to N-acetyltryptamine, whereas in the pineal gland it is 1000-fold more likely that tryptophan will be converted to N-acetylserotonin + melatonin (Table 3).
Discussion
This report provides a new perspective on N-acetyltryptamine by establishing that it is a physiological constituent of blood in mammals including humans and that it exhibits a daily rhythm based on studies in the rhesus macaque. The method presented here can be readily established where the required equipment is available. It is especially attractive because the use of internal deuterated standards enhances the reliability and accuracy of determinations. In addition, the LC-MS/MS method essentially eliminates interference, which is a common concern with assays based on immunodetection.
It is reasonable to suspect that the rhythm in N-acetyltryptamine is a common feature of vertebrate biology, a possibility that deserves further study to determine whether it, like melatonin and cortisol, is a useful circadian marker, including demonstration that the rhythm persists in constant darkness. Alternatively, it is possible that the observed rhythm is not driven by an endogenous circadian clock. The N-acetyltryptamine rhythm generally follows the profile of the melatonin rhythm, characterized by a nocturnal increase. The question of whether the N-acetyltryptamine rhythm also contributes to circadian signaling awaits future investigation. As discussed below, advances in this report raise a number of issues, including the sources of circulating N-acetyltryptamine, the mechanisms controlling its biosynthesis, and the possible physiological roles it might play as an agonist or melatonin antagonist. In addition, the discovery of N-acetyltryptamine far outliers in humans and the question of whether N-acetyltryptamine interferes with radioimmunoassay detection of melatonin are addressed.
Source of N-acetyltryptamine
The evidence that N-acetyltryptamine can be synthesized from tryptamine catalyzed by AANAT, NAT1, or NAT2 raises the possibility that there are multiple potential sources. However, there are several reasons to ignore NAT1 and NAT2 in this regard. First, the activity of these enzymes for tryptamine is significantly lower than that for arylamines, their preferred substrates (Table 2). Second, the finding that there was no association between plasma N-acetyltryptamine levels and NAT2 acetylator genotype in humans argues against a significant contribution by human NAT2. Rather, the rhythmic nature of plasma levels provides reason to suspect that it might be produced in either or both of the 2 tissues that strongly express AANAT and are known to have daily rhythms in AANAT activity, the pineal gland (Coon et al., 1995; Klein, 2007; Klein et al., 1997; Klein and Weller, 1970) and the retina (Bernard et al., 1997a; Coon et al., 2002a; Haque et al., 2011; Iuvone et al., 2005; Pozdeyev et al., 2006; Tosini et al., 2006).
The view that the retina might contribute to circulating N-acetyltryptamine in the rhesus macaque is supported by the findings reported here and elsewhere that the AANAT transcript is abundant in the retina and that there is a daily rhythm in AANAT activity in the retina (Coon et al., 2002b); in addition, retinal and pineal levels of AANAT mRNA and activity are similar. The very low levels of transcripts encoding enzymes required for melatonin synthesis in the retina, TPH1 and ASMT, and the low levels of melatonin in this tissue argue that retinal AANAT is primarily dedicated to N-acetyltryptamine synthesis, whereas pineal AANAT is primarily dedicated to melatonin synthesis. This is supported by the observation that the ratio of N-acetyltryptamine to melatonin in the retina is 1:1, whereas that in the pineal gland is 1:1000.
Other sites of AANAT expression should not be ignored, however, as potential contributors to circulating N-acetyltryptamine. These include the pituitary gland and brain (Coon et al., 1996; Coon et al., 1995; Fleming et al., 1999; Gaudet et al., 1991; Gaudet and Namboodiri, 1993; Paulin et al., 2015). Further investigation is required to determine whether activity increases at night in these tissues and whether they produce N-acetyltryptamine.
Additional support for the view that the retina is a source of N-acetyltryptamine comes from the finding that N-acetyltryptamine was detected in retinal tissue obtained at 4 times of the day in that tissue. However, the average value for midnight retina N-acetyltryptamine was not statistically higher than other averages. This might reflect individual-to-individual variation in N-acetyltryptamine production, as seen with plasma values, where daily rhythms in individuals were obvious, although absolute values varied considerably between individuals. Another possible contributing factor is that retinal N-acetyltryptamine may have been extracted during the 0.5- to 1-min wash that preceded freezing; this extraction might have varied in an uncontrolled manner among samples, thereby unintentionally introducing individual-to-individual variation.
Possible Physiological Role of N-acetyltryptamine
It is natural to consider whether N-acetyltryptamine has a role in chronobiology, consistent with the evidence of a marked rhythm in the circulation and given that it is a melatonin receptor mixed agonist-antagonist (Dubocovich, 1983, 1984; Dubocovich et al., 2010). However, the low relative affinity of N-acetyltryptamine for the melatonin receptor (Dubocovich et al., 2010) and plasma levels that are similar to those of melatonin make it seem unlikely that N-acetyltryptamine acts as a second melatonergic hormone. Rather, it seems more likely that N-acetyltryptamine could act as a paracrine or autocrine signal at sites of synthesis where it could be released at sufficiently high levels so as to interact locally with melatonin receptors and act as an agonist or antagonist of melatonin, thereby modulating melatonin receptor-mediated responses. In this light, circulating N-acetyltryptamine would be an indication of overflow from sites where it acts as a local regulator. Such a local role of N-acetyltryptamine is consistent with the colocalization of melatonin receptors and AANAT in the retina and pituitary gland (Dubocovich et al., 2010; Fleming et al., 1999; Klein, 2007; Vanecek, 1988, 1998).
Similarly, it is possible that N-acetyltryptamine interactions with melatonin receptors in the vertebrate brain might also be involved in local signaling (Brooks and Cassone, 1992; Davies et al., 1994; Dubocovich, 1991, 2010; Paulin et al., 2015). One could envision such N-acetyltryptamine-mediated communication within discrete brain regions through mechanisms similar to those which operate in the pineal gland and retina to control AANAT activity (Bernard et al., 1997b; Bolliet et al., 1997; Iuvone et al., 2005).
A nonmelatonergic mode of action of N-acetyltryptamine might also exist, as suggested by recent pharmacological studies by Iuvone and coworkers, who reported that N-acetylserotonin (Figure 1) influences neuroprotection in the retina through a direct interaction with brain-derived neurotrophic factor receptors (Iuvone et al., 2014). Based on structural similarity, it is reasonable to suspect that N-acetyltryptamine might play this role alone or in combination with N-acetylserotonin. The former is supported by the finding that retinal extracts contain N-acetyltryptamine but not detectable levels of N-acetylserotonin. It is also possible that N-acetyltryptamine might bind to characterized nonmelatonin receptors and to uncharacterized orphan receptors.
Human N-acetyltryptamine Outliers
Our analysis of human daytime plasma revealed the existence of 2 outliers among the 32 healthy individuals studied (Figure 3, Suppl. Table S1). The reason for this was not revealed in our studies, which failed to find a strong association of high N-acetyltryptamine with high levels of plasma tryptophan or low kynurenine levels. This suggests to us that mechanisms other than those involving tryptophan availability and tryptophan conversion to kynurenine are the underlying causes of outliers. Similarly, high levels of N-acetyltryptamine were not found in individuals with a rapid acetylator phenotype, which point away from human NAT2 as an explanation. Moreover, we did not find that high levels of N-acetyltryptamine were associated with high levels of melatonin, suggesting that a mechanism or a combination of mechanisms specific for production or degradation of N-acetyltryptamine, but not affecting melatonin, might be involved. The basis of the outlier observation remains a mystery; perhaps the solution lies in the levels of AANAT activity in the retina or other tissue or in differences in the timing of the rhythmic 24-h pattern of AANAT activity in the source of N-acetyltryptamine relative to that in the pineal gland. This might reflect a genetic variation in one or more components of the biological clock (i.e., per or clock) or the synthesis or degradation of N-acetyltryptamine. Of special interest is the question of whether N-acetyltryptamine might be a useful biomarker, perhaps for diseases affecting retinal biology or behavior, and whether N-acetyltryptamine might be linked to chronotype (Roenneberg, 2015).
Interference by N-acetyltryptamine with Immunoassay of Melatonin
The question of whether N-acetyltryptamine interferes with detection of melatonin in the circulation is important because of the wide use of melatonin assays based on antimelatonin antisera. Whereas interference has been reported for one antiserum (Kennaway et al., 1977), there is no evidence that any of the antisera used for detection of melatonin in commercial kits are more than 1/100 as sensitive toward N-acetyltryptamine than melatonin, based on product literature, communications with sources, and publications (Kennaway et al., 1982). Accordingly, the potential for interference seems unlikely. However, the possibility that this might occur when plasma melatonin is low and N-acetyltryptamine levels are exceedingly high cannot be ignored, especially in view of our finding of the existence of outliers with high values of N-acetyltryptamine (Figure 3, Suppl. Table S1). This issue is of special relevance in studies where accurate determinations of low levels of melatonin play an important role: for example, the diagnostic use of melatonin to describe dynamic changes in the central circadian clock and chronotype (Lack et al., 2009; Lewy, 1999; Lewy and Sack, 1989).
Final Comment
The evidence that N-acetyltryptamine is present in the circulation and undergoes a 24-h rhythm in abundance leads to the important question of the physiological roles it might play independent of melatonin or as a melatonin antagonist. This encourages reexamination of melatonergic signaling including special consideration of the proposal that N-acetyltryptamine has a paracrine or autocrine role.
Footnotes
Acknowledgements
This work was supported by funds from the Intramural Research Program of the Eunice Kennedy Shriver National Institute of Child Health and Human Development, National Institutes of Health (P.S.B., S.L.C., D.C.K.); by NIH grants AG-036670, AG-029612, and OD-011092 (H.F.U.); and by the Bert L. and N. Kuggie Vallee Foundation, the WorldQuant Foundation, NASA (NNX14AH50G, 15-15Omni2-0063), and the Bill and Melinda Gates Foundation (OPP1151054) (C.E.M. and M.B.). We greatly appreciate the expert animal management by Daniel Abebe (NICHD) and generous chemical synthesis support provided by Chad Brouwer (National Cancer Institute, National Institutes of Health).
Conflict of Interest Statement
The author(s) have no potential conflicts of interest with respect to the research, authorship, and/or publication of this article.
Notes
References
Supplementary Material
Please find the following supplemental material available below.
For Open Access articles published under a Creative Commons License, all supplemental material carries the same license as the article it is associated with.
For non-Open Access articles published, all supplemental material carries a non-exclusive license, and permission requests for re-use of supplemental material or any part of supplemental material shall be sent directly to the copyright owner as specified in the copyright notice associated with the article.