
Abstract
The pineal gland produces the hormone melatonin, and its volume may influence melatonin levels. We describe an innovative method for estimating pineal volume in humans and present the association of pineal parenchyma volume with levels of the primary melatonin metabolite, 6-sulfatoxymelatonin. We selected a random sample of 122 older Icelandic men nested within the AGES-Reykjavik cohort and measured their total pineal volume, their parenchyma volume, and the extent of calcification and cysts. For volume estimations we used manual segmentation of magnetic resonance images in the axial plane with simultaneous side-by-side view of the sagittal and coronal plane. We used multivariable adjusted linear regression models to estimate the association of pineal parenchyma volume and baseline characteristics, including 6-sulfatoxymelatonin levels. We used logistic regression to test for differences in first morning urinary 6-sulfatoxymelatonin levels among men with or without cystic or calcified glands. The pineal glands varied in volume, shape, and composition. Cysts were present in 59% of the glands and calcifications in 21%. The mean total pineal volume measured 207 mm3 (range 65-536 mm3) and parenchyma volume 178 mm3 (range 65-503 mm3). In multivariable-adjusted models, pineal parenchyma volume was positively correlated with 6-sulfatoxymelatonin levels (β = 0.52, p < 0.001). Levels of 6-sulfatoxymelatonin did not differ significantly by presence of cysts or calcification. By using an innovative method for pineal assessment, we found pineal parenchyma volume to be positively correlated with 6-sulfatoxymelatonin levels, in line with other recent studies.
The pineal gland secretes the hormone melatonin in response to signaling from the suprachiasmatic nuclei (SCN), which controls the release and generates the circadian rhythm of melatonin. Melatonin is normally secreted during darkness in a 24-h pattern, peaking in the middle of the night under natural light-dark conditions (Wright and Lack, 2001). The volume of the pineal gland is highly variable, with up to a 20-fold difference between individuals (Hasegawa et al., 1987; Schmidt et al., 1995). Pineal volume may reflect melatonin production since approximately 80% of the mammalian gland is composed of pinealocytes that secrete melatonin (Chemineau et al., 2002; Reiter, 1981). Parallel to the variation reported in pineal volume, a considerable range across individuals has been seen in the amount of melatonin secretion (Arendt, 2006; Bergiannaki et al., 1995).
The pineal volume is determined at an early age, and melatonin secretion appears to decrease with age (Kunz et al., 1999; Waldhauser et al., 1988; Wetterberg et al., 1999). In the short-term, melatonin levels can be modified by various exposures, among which inhibition of its secretion by light has the strongest effect (Gooley et al., 2011; Lockley et al., 1998). Other factors that can inhibit its secretion are benzodiazepines (McIntyre et al., 1988), β-blockers (Cowen et al., 1985; Rommel and Demisch, 1994), nonsteroidal anti-inflammatory drugs (NSAIDs) (Murphy et al., 1994; Surrall et al., 1987), and alcohol consumption (Cocco et al., 2005; Kuhlwein et al., 2003; Rupp et al., 2007). In contrast, antidepressants (selective serotonin reuptake inhibitors) can elevate melatonin levels (Skene et al., 1994), and other factors that may affect the amplitude of the rhythm include body mass index (BMI), sleep, relative daytime background illumination (Mishima et al., 2001), and menstrual phase (Parry et al., 2010).
To our knowledge, none of the methods for pineal volume measurements described so far have measured each composition of the gland separately: parenchyma, cyst, and calcification. Here we describe a pilot study of a volumetric assessment of the pineal gland using magnetic resonance imaging (MRI) of 122 men and address the association of baseline characteristics with pineal parenchyma volume, secretion capacity of the gland, and presence of cysts or calcification. As a proof of concept, we examined the cross-sectional association between pineal parenchyma volume and levels of morning urinary void 6-sulfatoxymelatonin, the primary metabolite of melatonin, under the hypothesis that men with larger parenchymal volume have higher 6-sulfatoxymelatonin levels (Arendt, 1995).
Methods
Study Participants
Participants were sampled from men enrolled in a prior study of melatonin and prostate cancer risk (Sigurdardottir et al., 2015) among participants in the AGES-Reykjavik cohort (Harris et al., 2007; Saczynski et al., 2009). Cohort members (2337 men and 3145 women) attended a detailed 3-day clinical assessment between September 2002 and February 2006, including completion of self-report questionnaires, biospecimen collection (including a first morning void urine sample), and MRI. MRI of the brain was completed for 2020 men, of whom 1770 fulfilled eligibility criteria, which included the following: providing informed consent; providing complete responses to questions about sleep; having a recorded time of urine sample delivery to the laboratory; and having first morning urine void 6-sulfatoxymelatonin levels measured at study entry. We randomly selected a pilot sample of 150 men for analysis. Because cancer patients may have altered melatonin secretion (Bartsch and Bartsch, 1999; Sigurdardottir et al., 2015), we excluded 27 individuals who had been diagnosed previously with any cancer at time of MRI assessment. In addition, we excluded 1 subject with extremely large pineal gland volume (670 mm3). Therefore, 122 men remained in our pilot analysis.
Brain MRI Acquisition
The MRI acquisition protocol has been described in detail elsewhere (Sigurdsson et al., 2012). Briefly, participants were offered brain MRI scans with a 1.5-T Signa Twinspeed EXCITE system (General Electric Medical System, Waukesha, WI) using a multichannel phased-array head cap coil. The structural image protocol consisted of T1-weighted 3-dimensional spoiled gradient echo (3D-SPGR) sequence (time to echo, 8 msec; repetition time, 21 msec; flip angle, 30°; field of view, 240 mm; matrix, 256 × 256). Additionally, a proton density/T2-weighted fast spin-echo sequence and a fluid attenuated inversion recovery (FLAIR) sequence were acquired. All images were acquired in the axial plane.
Pineal Anatomy and Image Analysis
The pineal gland develops as an outgrowth from the third ventricle of the brain and remains attached to its posterior wall via 2 habenulae (Gray, 1918). Floating in cerebrospinal fluid (CSF) outside the blood-brain barrier, the gland is located in the midline and at the base of the brain (Figure 1) (Osborn, 1994).
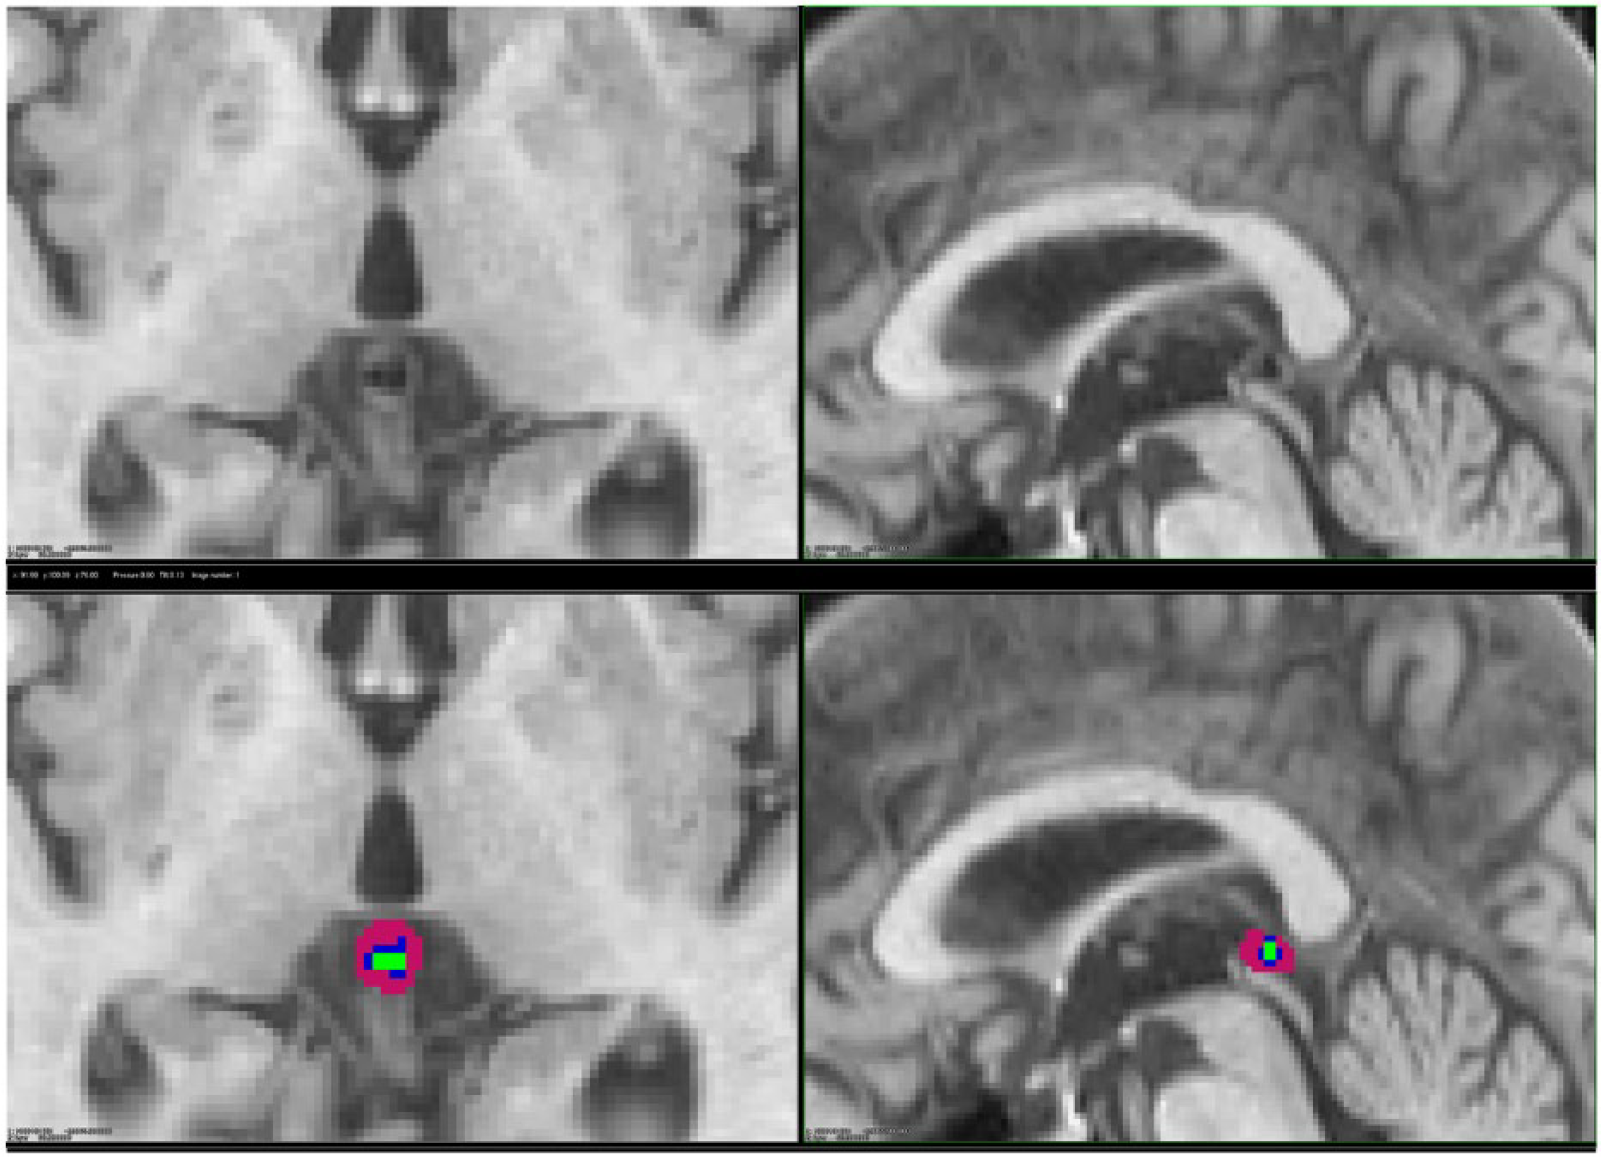
Magnetic resonance image of the brain showing pineal gland of 1 study participant, without (top) and with (bottom) manual labeling. Pink is for parenchyma, blue for cyst, and green for calcification: axial (left) and sagittal (right).
Visual inspection of MRIs and labeling of 3 pineal components (parenchyma, calcification, and cyst) were done using the T1-weighted 3D-SPGR images and a workstation with customized software developed in-house. The axial images were reconstructed into coronal and sagittal views. The slice thickness was 1.5 mm and the in-plane pixel size 0.94 mm × 0.94 mm; thus, each voxel, which represents a single sample of volume unit, was equivalent to 1.33 mm3. To obtain the pineal volume in mm3, we manually calculated the number of voxels for each pineal composition and multiplied by 1.33 mm3 per voxel. To avoid labeling error, given that distinguishing the boundaries of the pineal and adjacent structures is subjective, the pineal glands were labeled using the axial sections with simultaneous adjacent views of the sagittal and coronal images (Sun et al., 2008).
Each voxel was labeled by means of a consensus, with 1 of 3 colors representing the composition of the pineal gland: pink for parenchyma, green for calcifications, and blue for cysts (Figure 1). The composition of the glands was estimated by a comparison of the MRI signal with CSF, a lower signal being equivalent to calcification, an equal signal equivalent to cysts, and a higher signal equivalent to pineal parenchyma. If it was not clear whether a gland with calcification also included a cyst, we considered it to include only the calcification, and not a cyst. For transition zones between parenchyma and calcification/cyst/CSF/vein, half of the voxels were marked as parenchyma. Two reviewers—a radiographer and a physician—who were blinded to clinical information about the study sample analyzed all images separately and by means of the above consensus.
Reliability and Level of Agreement for the Pineal Measurements
To assess the reliability and the level of agreement for our method of labeling, we randomly selected 30 subjects from the total sample that 1 reviewer labeled twice with at least a 2-week “wash-out” delay. One outlier (670 mm3) was excluded; therefore, 29 measures were used, and intraclass correlation was calculated. We also used the Bland-Altman (BA) method to demonstrate the agreement between the first and second reading.
The reliability and level of agreement for the total pineal and parenchyma volumes were high. The intraclass correlation was 0.91 (95% CI 0.83-0.96) for total pineal volume and 0.88 (95% CI 0.77-0.94) for parenchyma volumes. As can be seen on the BA plot, all measurements were within a 2.00 SD limit (Figure 2).
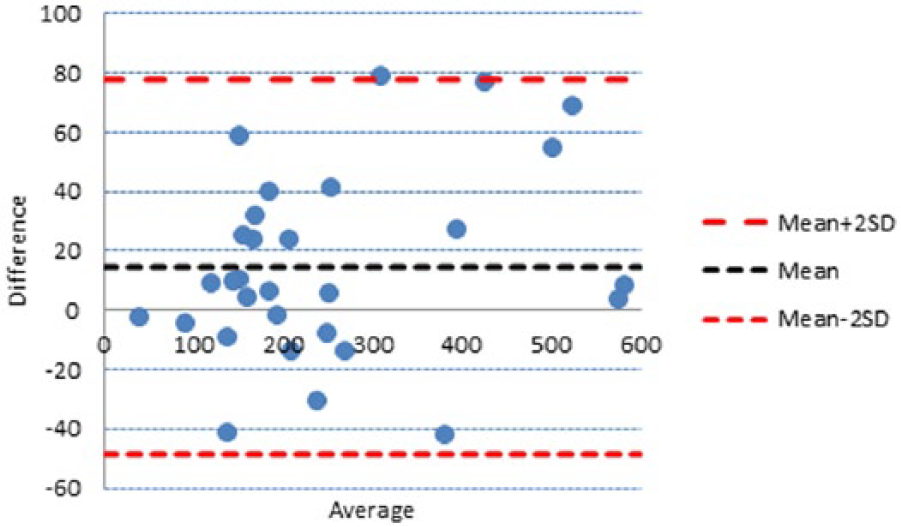
Agreement between manual labeling of the pineal gland volume. Bland-Altman plot demonstrates the agreement between the first and second labeling. Dashed lines are the mean bias and limits of agreement (2.00 standard deviation). The y-axis displays mean difference between first and second labeling and the x-axis the average volume of the first and second labeling.
Covariates and Outcomes
We assessed several factors that may correlate with pineal gland volume. From the questionnaire completed at study baseline, we obtained information on age, season at MRI acquisition (summer or winter), highest educational level attained (elementary school, secondary school, college, or university), smoking status (never smoked, past smoker of at least 100 cigarettes or 20 cigars in lifetime, or current smoker), alcohol use (g/week), current β-blocker medication (yes or no), and sleep problems (not falling asleep within 30 min, waking up during the night with difficulty falling back asleep, waking up early in the morning with difficulty falling back asleep, or taking medication to aid sleep). We combined the sleep problem questions (affirmative responses to all 4 sleep questions, once a week or more often) into a “very severe sleep problem” construct, as addressed in our previous study (Sigurdardottir et al., 2013).
Information on height (meters), weight (kilograms), and BMI (m/kg2) was obtained from clinical examination.
We also obtained information on 6-sulfatoxymelatonin and creatinine levels that were measured from first morning void urine collected at baseline and described in our previous study (Sigurdardottir et al., 2015).
Statistical Analyses
Basic descriptive statistics (mean, median, and range) were calculated for total pineal volume and for each of the 3 components separately (parenchyma, cyst, and calcification). To correct for hormonally inactive pineal parenchyma, cystic and calcified volumes were excluded from the main analyses (Mahlberg et al., 2009). We assessed the correlation of pineal parenchyma volume and 6-sulfatoxymelatonin levels using Pearson correlation and created a scatterplot. Using linear regression models, we compared pineal parenchyma volume with 6-sulfatoxymelatonin levels, adjusting for potential confounders based on their known or suspected association with melatonin and pineal volume: age, BMI, very severe sleep disruption, smoking, alcohol, β-blocker medication, and creatinine. Further, the pineal parenchyma volume was compared with baseline characteristics of the participants and their pineal cystic and calcified volume, using multivariable-adjusted linear regression models.
Given the large variability of pineal volume and melatonin levels, we then evaluated pineal secretion capacity, calculated as 6-sulfatoxymelatonin levels (ng/mL) per mm3 of pineal parenchyma. We used multivariable linear regression to compare pineal secretion capacity with respect to selected characteristics.
Finally, we evaluated the association between the presence of pineal cysts or calcifications with 6-sulfatoxymelatonin levels and the selected baseline characteristics using logistic regression models.
Sensitivity analyses for the regression results were made by applying a cube root, square root, and logarithmic transformation of the response variable (volume) to achieve better approximation to normally distributed errors. This did not affect the conclusion drawn from the results.
All analyses were conducted using SPSS Software version 20.0 (SPSS Inc. 2010; IBM, Chicago, IL), and all p values were 2-sided with significance set at p < 0.05.
Ethical Approval
The Icelandic Ethical Review Board and the Icelandic Data Protection Authority approved the study protocol. The AGES-Reykjavik Study has been approved by the Icelandic National Bioethics Committee, which acts as the institutional review board for the Icelandic Heart Association, and by the institutional review board for the Intramural Research Program of the National Institute on Aging, U.S. National Institutes of Health. Informed consent was obtained from all participants. All MRI brain images were screened by a neuroradiologist for evidence of brain pathology that warrants medical intervention.
Results
Pineal Gland Volumes, Shape, and Composition
The pineal glands varied substantially in volume, shape, and composition. The mean total pineal volume for the 122 participants was 207 mm3 and mean parenchyma volume 178 mm3 (Table 1). More than half of the glands included cysts (n = 72, 59%) and about 20% included calcifications (n = 26).
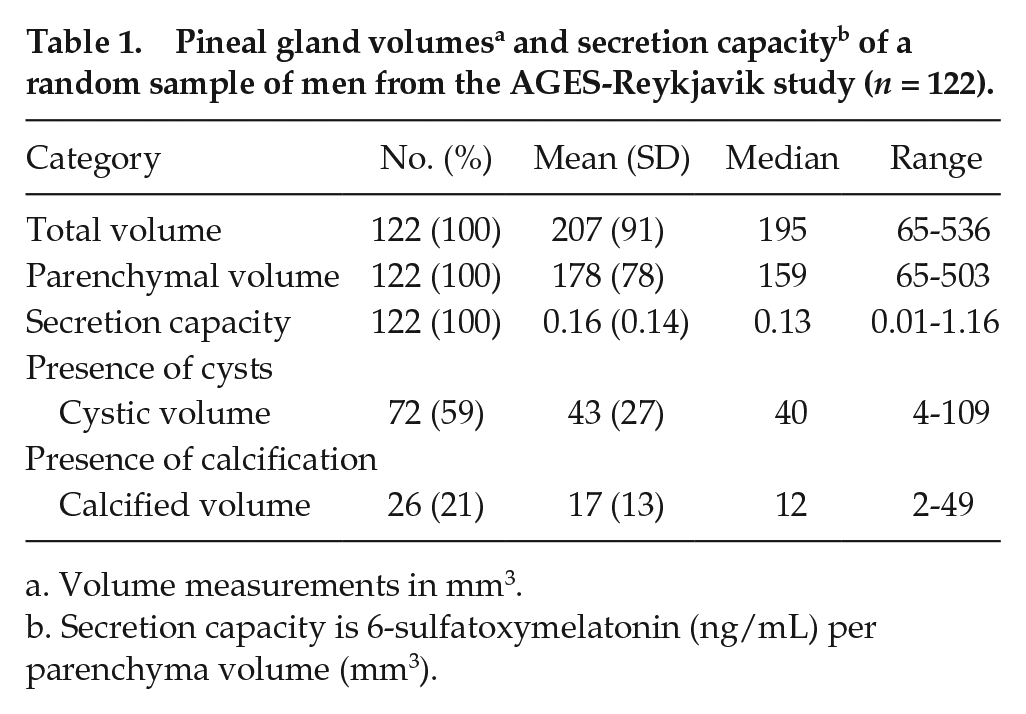
Volume measurements in mm3.
Secretion capacity is 6-sulfatoxymelatonin (ng/mL) per parenchyma volume (mm3).
Baseline Characteristics According to Pineal Parenchyma Volume and Secretion Capacity
The mean age of the men was 75 years and mean BMI was 27 kg/m2. Nine percent reported very severe sleep problems, and 34% took β-blocker drugs (Table 2).
Association between baseline characteristics and lifestyle factors with pineal parenchyma volume and pineal secretion capacity among 122 men in the AGES-Reykjavik cohort.
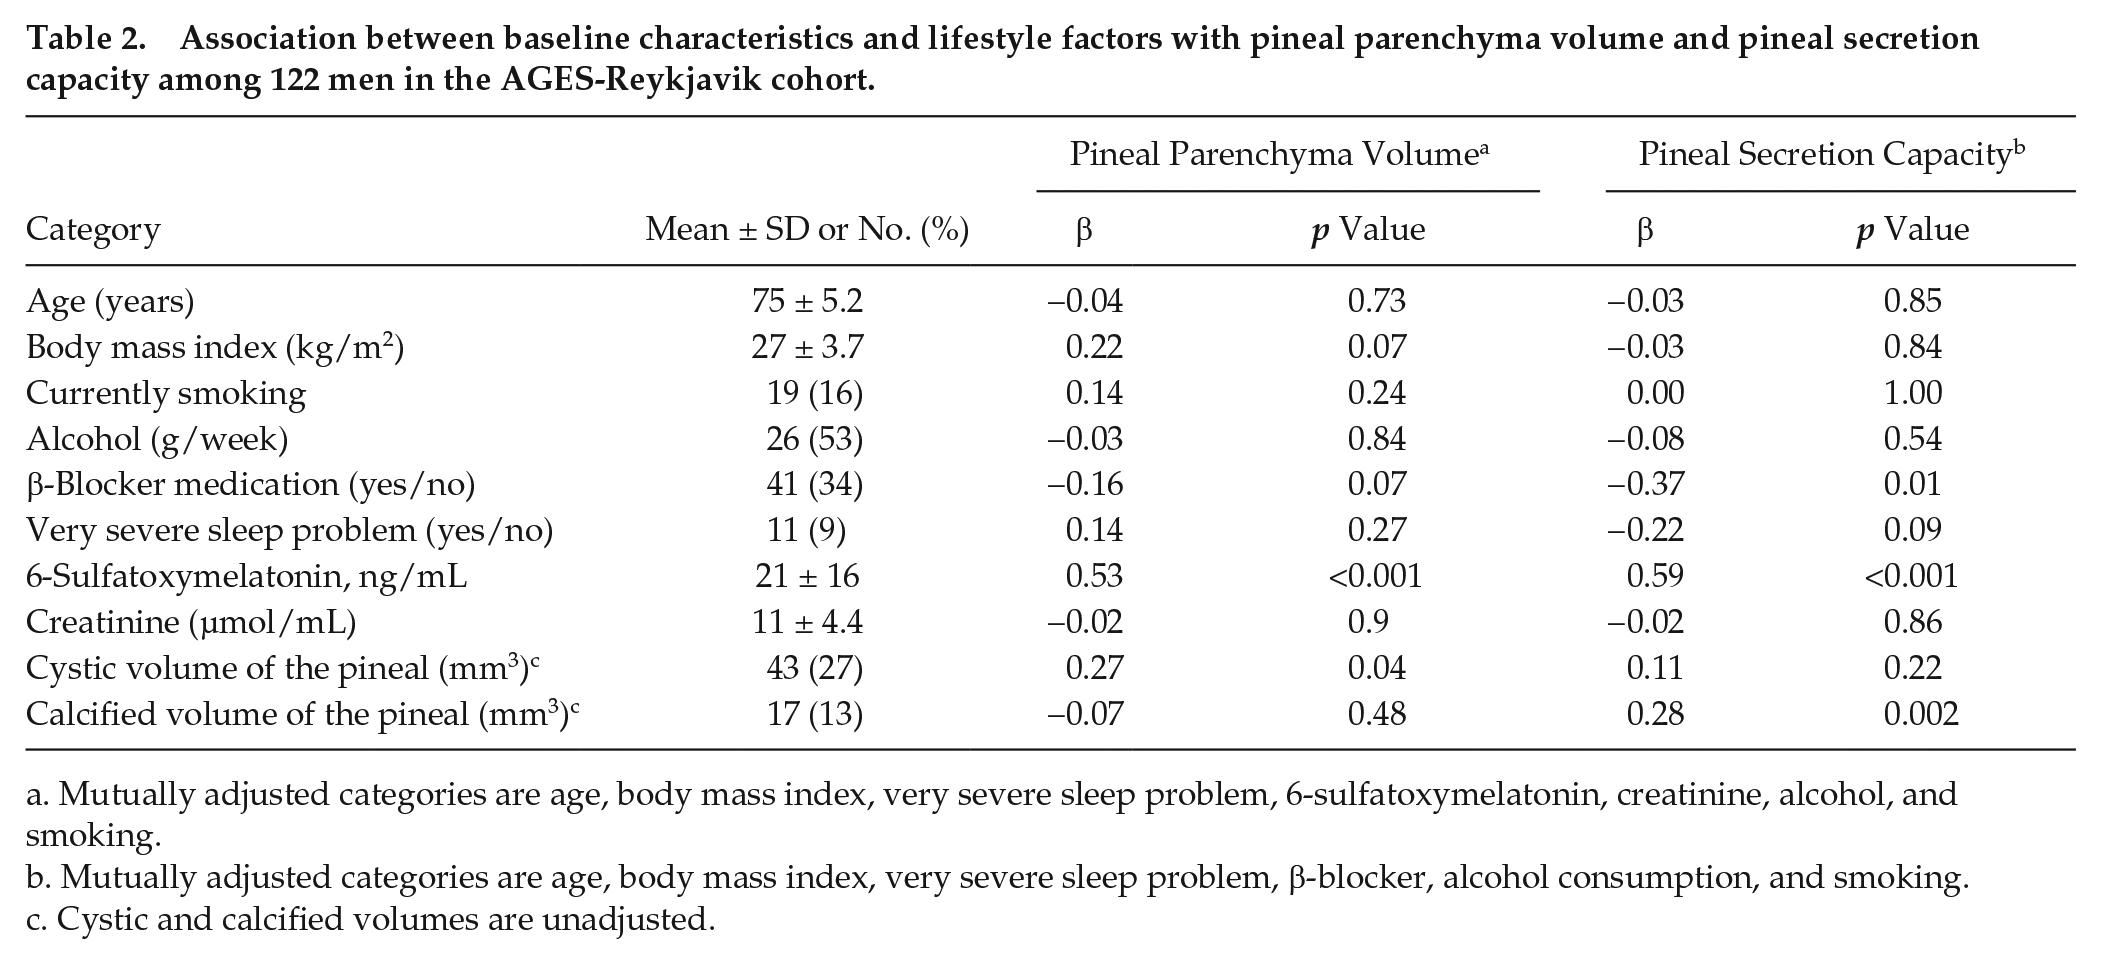
Mutually adjusted categories are age, body mass index, very severe sleep problem, 6-sulfatoxymelatonin, creatinine, alcohol, and smoking.
Mutually adjusted categories are age, body mass index, very severe sleep problem, β-blocker, alcohol consumption, and smoking.
Cystic and calcified volumes are unadjusted.
Neither pineal volume nor secretion capacity was associated with height or weight alone (data not shown). The pineal size did not vary between times of year (summer vs. winter). Men with higher levels of attained education had lower pineal parenchyma volumes (age-adjusted β = −0.18, p = 0.02) and marginally significant lower secretion capacity (age-adjusted β = −0.18, p = 0.06). No other characteristics were statistically significantly associated with parenchyma volume, but BMI was marginally positively associated with parenchyma volume (β = 0.22, p = 0.07) (Table 2). In a multivariable adjusted model, pineal secretion capacity was inversely associated with current use of β-blocker medication (β = −0.37, p = 0.01) and marginally associated with very severe sleep disruption (β = −0.22, p = 0.09). In an unadjusted model, calcified volume of the pineal gland was positively associated with pineal secretion capacity (β = 0.28, p = 0.002) but not independently with pineal parenchyma or 6-sulfatoxymelatonin levels (not shown). Excluding 41 men taking β-blocker medication did not appreciably alter the association (not shown).
Baseline Characteristics According to Presence of Pineal Cysts or Calcification
Men with cystic pineal glands were younger (β = −0.09, p = 0.02) and marginally more likely to be current smokers (β = 1.11, p = 0.06) in comparison with men without cystic pineal glands. No other traits were associated with presence of pineal cysts (not shown). Men with calcified pineal glands were marginally more likely to be current smokers (β = 0.95, p = 0.08), but no other traits were associated with pineal calcification. Further, we found no association between levels of 6-sulfatoxymelatonin levels and the presence of pineal cyst or calcification (Table 3).
Association between baseline characteristics and lifestyle factors with the presence of pineal cysts or calcification among 122 men in AGES-Reykjavik cohort.
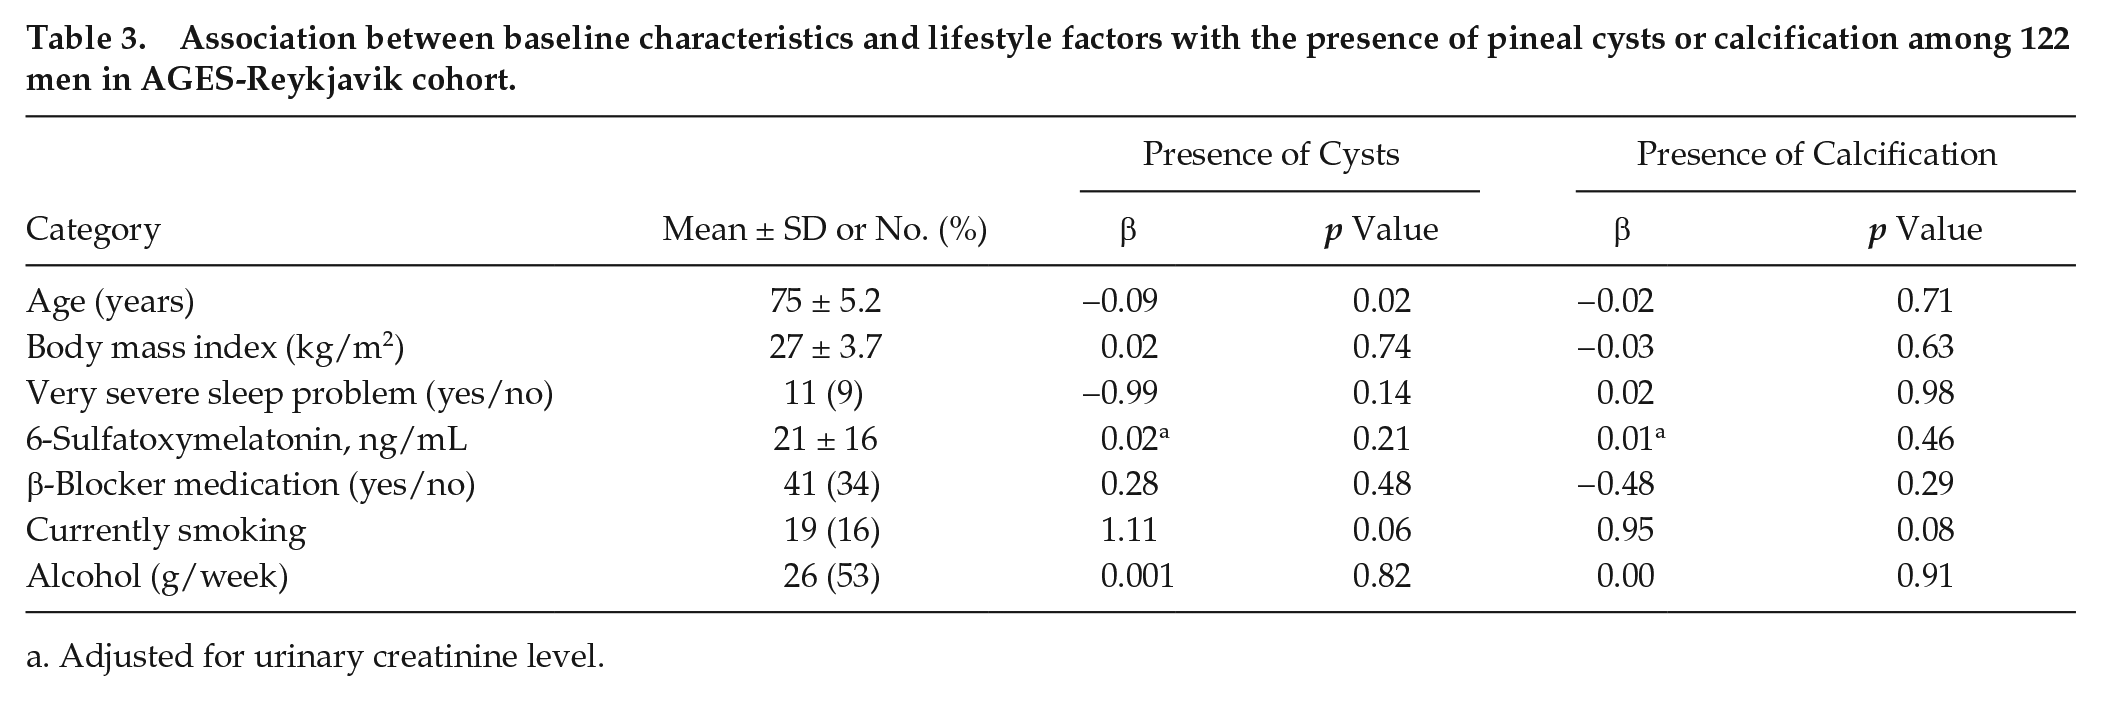
Adjusted for urinary creatinine level.
Pineal Volume and 6-Sulfatoxymelatonin Levels
Pineal parenchyma volume and 6-sulfatoxymelatonin levels were positively correlated (Figure 3) (Pearson r = 0.33, p < 0.001). After adjustment for age, BMI, very severe sleep problems, and urinary creatinine, the association persisted (p < 0.001, Table 2).
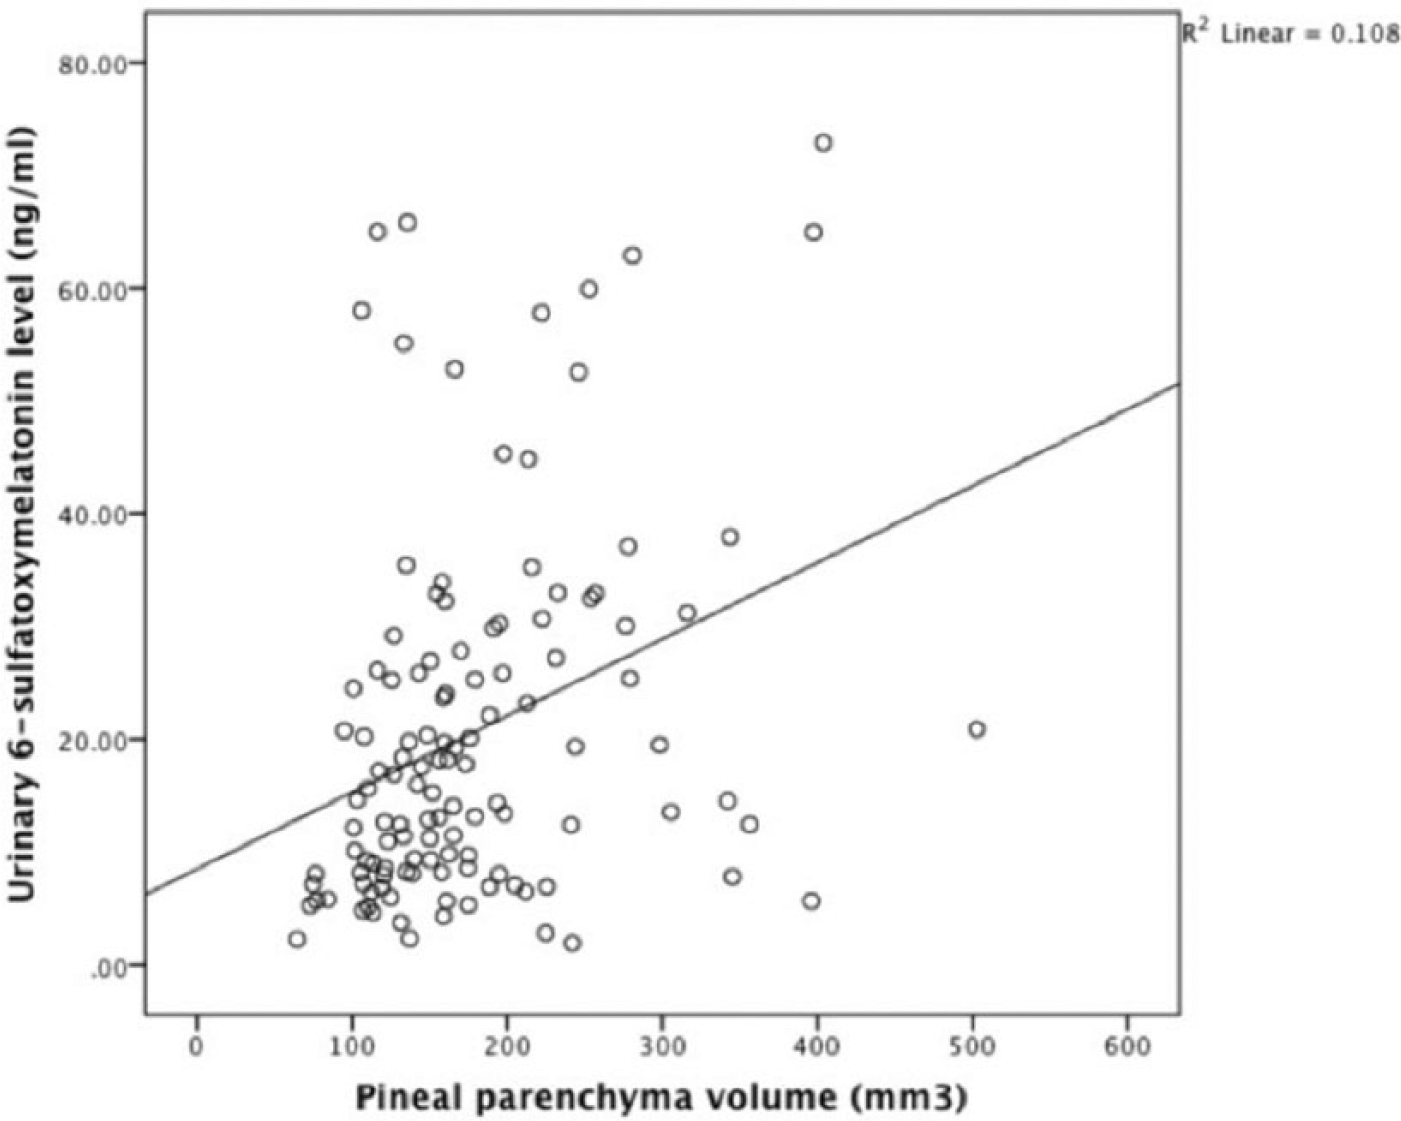
Simple scatterplot showing correlation between concentration of first morning urinary void 6-sulfatoxymelatonin and pineal parenchyma volume among the 122 study participants. Pearson r = 0.33, p < 0.001 (unadjusted).
Discussion
We have described a reliable method for quantifying 3 pineal gland components (parenchyma, calcification, and cyst) using T1-weighted 3D-SPGR images and a workstation with customized software developed in-house. This method has previously been described for other areas of the brain (Sigurdsson et al., 2012).
We found mean total pineal volume (207 mm3) in the upper range of previously published reports using the same scale. Rajarethinam et al. (1995) reported similar pineal volume means from imaging patients with schizophrenia (208 mm3, n = 45, mean age 30 years) and healthy controls (213 mm3, n = 86, mean age 27 years); however, the investigators did not describe how they traced the volume. In a recent study by Liebrich et al. (2014), the mean pineal volume was 256 mm3 among 103 healthy male and female subjects aged 18 to 23 years.
Other studies on pineal volumetric MRI assessment have used the caliper method, with volume calculated as ½ × length × width × height. Using this method in a recent study, Bumb et al. (2014) estimated the pineal volume by defining pineal borders manually on transversal reconstructed 3D T1-weighted images (MPRAGE sequence); the mean volume of 27 healthy subjects was 79 mm3. In this same study, the mean pineal volume was found to be smaller among subjects with untreated insomnia (49 mm3). In a study by Sumida et al. (1996), the average pineal volume of 57 mm3 among 223 subjects remained stable in the age group 2 to 20 years, and Sun et al. (2009) reported a mean pineal volume of 95 mm3 among 66 healthy males with mean age 24.7 years. Thus, the caliper method seems to result in overall smaller pineal volumes compared with ours and others’ methods.
The prevalence of cysts (59%) and calcification (21%) and the mean cystic volume of 43 mm3 among our study participants were similar to findings of a recent report that included much younger participants with mean age of 23 years (Liebrich et al., 2014). In contrast, another study also among young participants found a cyst prevalence of only 25% (Sun et al., 2009). The estimation of cysts may depend on the method used. In our study, the presence of cysts or calcification was not associated with melatonin production.
The differences in pineal volume measurements across studies may be due to the heterogeneous structure of the pineal gland, which often makes it difficult to distinguish from adjacent structures such as the internal cerebral veins and challenging to estimate parenchyma volume accurately. It is possible that the methods yielding larger volume may have included some of these structures in their reports or that the methods giving smaller volumes inappropriately excluded relevant structures. Variability in the different methods used for estimating volume and measurement error cannot be excluded in comparison of the studies. An advantage of our method lies in the direct measure of each pineal volumetric unit (voxel) for each of its 3 composite. Other advantages of our approach include high reliability of measurers, relatively large sample size compared with previous reports, and information on possible confounders.
We found a positive correlation between first morning urinary void 6-sulfatoxymelatonin levels and pineal parenchyma volume (r = 0.33) in a pilot sample of 122 elderly men who had not been diagnosed with cancer. This finding is consistent with previous studies. In a recent study of 103 healthy individuals, Liebrich et al. (2014) found a positive correlation (r = 0.28) between uncalcified solid pineal volume and saliva melatonin levels collected at 4 time points within 24 h. Similarly, Nölte et al. (2009) found that pineal parenchyma volume correlated linearly to 24-h melatonin measured every 2 h for 24 h (r = 0.64) among 15 healthy young males and that the correlation was higher for solid than for cystic glands. Further, Kunz et al. (1999) reported that the pineal volume of 24 study participants was significantly correlated (r = 0.49) with 24-h urinary 6-sulfatoxymelatonin levels. Also there was a positive correlation between pineal parenchyma and cystic volume; therefore, larger glands included larger cysts. Although it is more difficult to measure pineal volume than melatonin levels, it offers an interesting alternative biomarker of the circadian system.
Published reports have suggested that pineal volume varies 20-fold in weight and dimension among the general population (Hasegawa et al., 1987; Schmidt et al., 1995). We found 8-fold range of pineal volume and 10-fold with the outlier included. The evidence has been inconsistent for the age-related decline in melatonin secretion. We did not find an association between volume or secretion capacity and age. Moreover, none of the baseline characteristics, such as age, BMI, β-blockers, or sleep problems, were strongly associated with pineal parenchyma volume and secretion capacity, although some were marginally associated. In a recent study, patients with insomnia had smaller pineal glands compared with healthy controls (Bumb et al., 2014). We found that men with very severe sleep problems had marginally lower pineal secretion capacity, although they did not have lower parenchyma volume. Men currently taking β-blockers had lower pineal secretion capacity. This finding is in line with previous reports that men taking β-blockers have up to 50% reduction of melatonin production (Cowen et al., 1985; Rommel and Demisch, 1994).
Our study is limited by the small sample size, although this is among the largest pineal volume studies reported, and we may have lacked adequate power to detect true associations of modest magnitude. Also, our population was limited to older Icelandic Caucasian men. Even though our method is reliable, there is a possibility that the values do not represent the true values since the pineal gland has the same signal as the adjacent veins and therefore it can be challenging to tell them apart.
In summary, using an innovative method of pineal assessment, we found that the pineal glands of 122 older men were larger in volume when compared qualitatively with the caliper method used in previous studies. Further, with this method for volume quantification, pineal parenchyma volume was directly correlated with first morning urinary void 6-sulfatoxymelatonin levels. In future study, we will address this association further in a larger sample and investigate the association of pineal gland composition with prostate cancer risk.
Footnotes
Acknowledgements
This study was supported by RANNIS (the Icelandic Research Fund). The AGES-Reykjavik is supported by Contract N01-AG-12100 from the National Institutes on Aging Intramural Research Program; Hjartavernd (the Icelandic Heart Association); the Althingi (the Icelandic Parliament); and the Harvard Catalyst Award. This study is approved by the Icelandic National Bioethics Committee, VSN: 00-063. S.C.M. is supported by the National Cancer Institute at the National Institutes of Health Training Grant NIH T32 CA09001. L.A.M. and J.R.R. are supported by the Prostate Cancer Foundation. The funding agencies had no role in the design of the study, the collection of the data, or the data analysis.
Conflict of Interest Statement
The author(s) have no potential conflicts of interest with respect to the research, authorship, and/or publication of this article.