
Abstract
The first German Charité Jet Lag Scale (CJS), based on the only validated English questionnaire, was introduced in a former study. In addition to providing further jet lag investigations, this second method-comparison study aims to evaluate the CJS. Consistent interviewing methods are essential for future research in identifying possible cross-cultural tendencies, advancing jet lag definition, and establishing potential alleviation methods. Jet lag in 17 German chorus members (5 male, 12 female, mean age 42.35 ± 13.06 years) was monitored on their 2½-week trip from Germany to Argentina and back by use of actigraphy, sleep diaries, and the CJS. Cronbach’s alpha, Pearson and Lin correlations, and Bland-Altman diagrams were applied to assess CJS reliability and validity between all measurement methods. CJS study analysis results reconfirmed the prevalence of jet lag at approximately 60%. Moreover, the study assessed high Cronbach’s alpha values and significant positive correlations for several corresponding and related sleep parameters and CJS items such as total sleep time (TST) and sleep onset latency (SOL). The confidence limits in the Bland-Altman diagrams remained within the limits of earlier studies (TST ± 1 h, SOL ± 30 min). Overall, jet lag measures in this study confirmed previous jet lag studies. Evidence indicates positive reliability and validity of the CJS, with lower specificity in some parameters. We conclude that the CJS is applicable for complex jet lag studies. The findings provide support for further development of the scale and its capability as a consistent jet lag interviewing method.
The number of commercial aircraft passengers increases every year. The importance of business travel is undiminished despite Internet and new media. The physical problems caused by travel across multiple time zones, however, remain unsolved. Flyers struggle with various postflight symptoms such as insomnia, irritability, and memory impairment, symptoms that constitute a definition of jet lag.
The American Academy of Sleep Medicine (AASM, 2014) defines jet lag according to the International Classification of Sleep Disorders (ICSD-3) with 3 different criteria:
Insomnia or sleepiness with impaired total sleep time (TST) after a minimum of 2 time zone crossings
Impairment of daytime function, general malaise, or somatic symptoms within 1 or 2 days of travel
The absence of other causes of the above complaints
Despite treatment of jet lag as a sleep-wake cycle disorder, various definitions exist with respect to its specific symptoms (Waterhouse et al., 1997; Waterhouse et al., 2002; Waterhouse et al., 2003; Waterhouse et al., 2005; Waterhouse et al., 2007). Even the definition in the new ICSD-3 (AASM, 2014) does not consider the variability of symptoms arising each day after arrival at a new destination or their changes during daytime, although research has previously addressed these aspects (Spitzer et al., 1999; Waterhouse et al., 2003).
Studies often use questionnaires to analyze jet lag and its symptoms, even though the AASM does not recommend questionnaires as a diagnostic method (AASM, 2014). Questionnaires vary in their symptom focus since they are often designed for a particular study. Nevertheless, 3 questionnaires dominate in various studies concerning jet lag definition: the Stanford Sleepiness Scale (Hoddes et al., 1973), the Liverpool Jet Lag Questionnaire (Waterhouse et al., 2002), and the Columbia Jet Lag Scale (Spitzer et al., 1999).
The Columbia Jet Lag Scale is the only questionnaire that achieves level 1 for evidence-based medicine (Morgenthaler et al., 2007b; Sack et al., 2007). On the basis of this scale and other symptom definitions most relevant in previous studies, we developed the Charité Jet Lag Scale (CJS), the first jet lag questionnaire in German (Becker et al., 2015b). In development of the CJS, we initially translated the Columbia Jet Lag Scale to German. We then had this German version of the CJS checked by a bilingual expert and then back-translated to English by 3 English educationalists. We subsequently applied the first version of the scale to test 73 participants professionally affected by jet lag (airline pilots). Their responses led to minor changes in phrasing and item scope. The revised version was reviewed by sleep medicine specialists, including physicians and a psychologist, which finally resulted in the latest version of the CJS (Becker et al., 2015b).
In an initial study with the CJS, it proved effective, inter alia, by assessing jet lag prevalence of 60% (Becker et al., 2015b; Becker et al., 2015a). Cronbach’s alpha achieved good values as a sign of internal consistency.
In this second study, we have attempted to gain deeper insights into evaluation of the CJS by applying a method-comparison approach with sleep diaries and actigraphy.
Actigraphy is an activity-based sleep monitoring system using a wristwatch-like unit, worn on the wrist, which senses and stores arm movement data. It is accordingly used as an indirect assessment of sleep parameters such as TST, sleep onset latency (SOL), and wake time after sleep onset (WASO) (Sadeh and Acebo, 2002; Lichstein et al., 2006; Morgenthaler et al., 2007a). These parameters are closely correlated with polysomnography (PSG) (Sadeh and Acebo, 2002; Lichstein et al., 2006; Morgenthaler et al., 2007a). Therefore, actigraphy is recommended in the research of sleep-wake rhythm disorders such as shift work, advanced or delayed sleep phase disorder, and jet lag (Morgenthaler et al., 2007b). Actigraphy may serve as a supplementary option to other recording methods or even as a recommended diagnostic tool or guideline in studies (Morgenthaler et al., 2007b). Sadeh and Acebo (2002) stated that actigraphy is an important complement to other investigative methods of sleep research.
One reason for the use of actigraphy instead of PSG is the flexibility of actigraphy in application. In jet lag research, the application of actigraphy in combination with sleep diaries is the alternative of choice for participants who travel extensively (Burgess et al., 2003; Beaumont et al., 2004; Eastman et al., 2005). However, laboratory simulation studies with PSG (Burke et al., 2013; Moline et al., 1992; Morgenthaler et al., 2007b) do not accurately reflect realistic travel conditions, since many variables from real life—such as those associated with food intake times, light, and hotel beds—cannot be realistically simulated in a laboratory. Studies have estimated good correlation between actigraphy and sleep diaries in parameters such as TST and sleep efficiency (SE) (Monk et al., 2001; Morgenthaler et al., 2007a).
One interesting point in this regard is the specific definition of sleep duration calculated by the actigraph algorithm. For example, Wolfson et al. (2003) differentiated between assumed sleep and actual sleep time quantified by the actigraph. One important point emerges here when we consider comparisons between sleep values assessed by sleep diaries and by the actigraph. In most cases, some data from sleep diaries provide essential parameters used in actigraph algorithms (Wolfson et al., 2003; Morgenthaler et al., 2007a). Data for beginning and end of sleep often depend on subjectively recorded time points. Positive correlation between these values is a logical consequence. Nevertheless, the use of actigraphy complemented with tools such as sleep diaries is generally the approved solution in research (Sadeh and Acebo, 2002; Morgenthaler et al., 2007a; Morgenthaler et al., 2007b). Since a jet lag questionnaire is not yet available in German, the only diagnostic tools for jet lag evaluation in field studies are actigraphy and sleep diaries. We were therefore interested in comparing the new CJS with sleep diaries and actigraphy.
When different methods are applied to evaluate such data, it is essential to compare these data to analyze agreement. In method-comparison studies, Pearson correlation coefficients with significance levels up to 0.05 are often the method of choice to investigate concordance of parameters (Acebo et al., 1999; Reid and Dawson, 1999; Wolfson et al., 2003; Sadeh, 2004; Lichstein et al., 2006; Morgenthaler et al., 2007a). Criticism of the Pearson correlation coefficient has been directed to its limited ability to identify scale shifts and location shifts (Altman and Bland, 1983; Bland and Altman, 1986; Grouven et al., 2007; Koch and Spörl, 2007). A more suitable correlation coefficient that accounts for these possible biases is Lin’s correlation coefficient (Lin, 1989; Lin et al., 2002; Koch and Spörl, 2007).
A different approach for comparing methods is the interpretation of Bland-Altman diagrams, which are sometimes preferred when interpreting the concordance of 2 measurement types (Kwiecien et al., 2011; Hartnack, 2014). Bland-Altman diagrams are based on graphical comparison of 2 measurement methods on the x and y axes (square scatterplots). A plot representing the mean and mean difference of both values on each axis (Altman and Bland, 1983; Bland and Altman, 1986, 1990) subsequently identifies the limits of agreement (LOAs). The LOAs describe the upper and lower limits of the mean difference ± 1.96 SD (standard deviation).
In study practice, both versions of comparison are applied, although use of correlation coefficients is evidently more common. Comparison may also be performed in conjunction with t tests or 1-way analyses of variance (ANOVAs), with split total variance within and between subject measures. In general, these procedures aim for assessment of linear conformity (Muller and Buttner, 1994; Wolfson et al., 2003; Lichstein et al., 2006). Nevertheless, studies also demonstrate a mix of the verification methods described above (Hedner et al., 2004).
The present study uses a larger set of correlation coefficients and Bland-Altman diagrams to minimize the errors and side effects of each method. It is the first study using a method-comparison approach for a jet lag questionnaire.
Methods
Participants
A German chorus was studied while on a concert tour from Hamburg, Germany (HAM), to Buenos Aires, Argentina (EZE), and on a short boat and bus excursion to Montevideo, Uruguay, for a 2½-week tour festival. Seventeen participants attended the study for the westerly trip: 5 male and 12 female volunteers: mean (± SD) age 42.35 ± 13.06 years. Fifteen choir members (5 male, 10 female; mean age: 42.8 ± 13.76) participated the study for the easterly trip. The destination in Argentina (Coordinated Universal Time (UTC – 3h)) is 5 time zones behind the starting point in Germany (UTC + 2 h). The westerly flight to South America was a night flight via Frankfurt, Germany (FRA), with takeoff at 1925 h local time (LT) in Hamburg and landing on the next day 0700 h LT in Buenos Aires (total travel time 16 h 35 min; HAM-FRA 1 h 15 min, FRA-EZE 14 h 00 min). The easterly flight was a night flight via Frankfurt, Germany, as well. Departure time in Buenos Aires was 1640 h, with landing in Hamburg 1305 h on the next day (total travel time: 15 h 25 min; EZE-FRA 13 h 05 min, FRA-HAM 1 h 05 min).
Instrumentation
Before departure, all test participants received a test package including the following questionnaires:
Predeparture questionnaires: Berlin Questionnaire (Netzer et al., 1999), Epworth Sleepiness Scale (ESS; 1997 version) (Johns, 1991), Insomnia Severity Index (ISI) (Morin et al., 2011), Restless Legs Syndrome Diagnostic Index (RLS-DI) (Benes and Kohnen, 2009), and Short Form (SF)-12 (Ware et al., 1996).
Follow-up questionnaires: sleep diaries, CJS (see supplementary online material)
All predeparture questionnaires were completed prior to the first flight of the trip. The follow-up questionnaires were filled out between 3 days before the trip and until 6 days after the flight to Argentina. To ease the burden on the participants, the test cycle for the return trip started again 2 days before the return flight and lasted until 6 days after the flight. The sleep diary and the CJS were to be completed each day before going to bed and after awakening. Furthermore, the volunteers completed the midday report of the CJS between 1200 h and 1500 h local time every study day.
The overall rate of missing values for the questionnaires was 7.2%, including protocols that were partially or entirely overlooked by participants.
Additionally, each participant obtained an actigraph with an explanation of its operation. We used the Actiwatch Plus (AW-64, Cambridge Neurotechnology Ltd., Cambridge, UK; epoch length, 1 min; sensitivity, 0.05 g) with its specific software algorithm (sensitivity level: medium), supplemented by sleep diaries. Participants wore the actigraph on the wrist of the nondominant hand. They also noted every removal of the actigraph in a log file. The relevant data assessed by the actigraph software for this study were TST, SOL, WASO, and SE. Sleep diaries were used to supplement the actigraph data for bedtimes and wake times and also included relevant data concerning TST, SOL, and WASO to record length of nocturnal awakenings.
The actigraph data for 4 participants for the westerly and 6 participants for the easterly trip were not evaluable due to fragmentary data. This amounts to a 30% rate of missing data. Former studies on actigraphy reported a rate of missing data of about 28% as normal due to artifacts or missing records (Acebo et al., 1999; Sadeh and Acebo, 2002).
Jet Lag Evaluation
In addition to noting each jet lag symptom itself, the CJS enables computation of a jet lag score (Becker et al., 2015b): the sum of every 15 jet lag items per morning, noon, and evening protocol. The described jet lag score is calculated for each of the 3 sections of the day, with subsequent computation of the daily average. The jet lag score ranges between 0 (no items observed, score 0) and the maximum value of 60 (all items observed, very strong, score 4). The jet lag score reflects the severity of jet lag measured for each participant.
All 15 items per report are clustered in 5 symptom groups, which represent sleep-related, mental, physical, vegetative, and cognitive symptoms. In the context of method comparison, the items concerning sleep-related symptoms are of particular importance.
Daily jet lag scores and their courses were calculated for the trip to Argentina and back. The thresholds for jet lag presented in a previous study (Becker et al., 2015b) can aid in determining the prevalence of jet lag. In the previous study, a reference group of 34 participants filled in the CJS on 3 consecutive days but remained in their home time zone. Since jet lag items can also be nonspecific, some items can occur in a nontraveling population as well. Only a sum of symptoms can indicate jet lag disorder. In total, over 100 study days represented a random sample without participant jet lag (Becker et al., 2015b). We analyzed the distribution of all jet lag scores and then adopted percentiles from the decimal system to establish thresholds for jet lag. Scores above the 90th percentile are outliers. Participants having jet lag scores below this value constitute our reference group for persons not having traveled across more than 1 time zone. Severe jet lag therefore occurs beginning with the 90th percentile (jet lag score ≥ 6.23), whereas a sum of symptoms representing a jet lag score as high as the 80th percentile represents moderate jet lag (jet lag score ≥3) (Becker et al. 2015b). To analyze jet lag, we separated the group of participants, according to these thresholds, into participants with at least moderate jet lag or no jet lag. In this study, we applied these thresholds to analyze the courses of jet lag for each travel direction in each group.
In a previous study, we identified the mathematical description of jet lag after travel. The mathematical reference is a formula (y = 19.257 e−0.378x) describing the decreasing jet lag value after travel. The course of jet lag in this study was graphically compared with this mathematical reference. In addition, we analyzed the variation of jet lag throughout the day by a graph showing the courses of jet lag for the morning, noon, and evening protocol.
CJS Questionnaire Evaluation
Reliability
Cronbach’s alpha was used to assess the internal consistency of the CJS. Here, Cronbach’s alpha values above 0.8 represent good reliability (Kline, 2011).
Validity
To verify the validity of the CJS, we focused on comparing data from all 3 measurement methods: actigraph, sleep diaries, and the CJS. At this point, it is important to mention that sleep diary data are sometimes entered in the actigraph software to adjust algorithms. Parameters being adjusted are bedtime and wake-up time (or get-up time). These data are therefore excluded from the comparison.
Four different comparison groups represented the possible data matches of the 3 methods. All compared data were expressed as the daily averages for all participants. For some parameters, direct comparison of the values was not possible. The measurements were in fact different but represented the same symptom or protocol item. We accordingly established 2 composition proceedings:
Direct comparison—same data measurement
Parameter: TST, SOL Method
Pearson correlation coefficient Lin correlation coefficient Square scatterplots with linear regression lines Bland-Altman diagrams
Indirect comparison—different data measurement
Parameter: Awakenings/ability to sleep through, WASO/insomnia, sleep efficiency/sleep impairment/cluster sleep items Method
Pearson correlation coefficient Diagrams representing transformed items per study day
For the TST we decided on the actual sleep time (nocturnal sleep without naps), calculated by the actigraph, to be compared with the other 2 methods. The CJS and the sleep diaries represent personal estimations of these data, whereas the actigraph measures these data by its internal algorithm based on wrist activity monitoring. The reason for our definition is the above-explained possible correlation between the 2 methods of actigraphy and sleep diaries, in data relating to bedtime and wake time (assumed sleep).
This study was approved by the ethics committee at Charité–Universitätsmedizin Berlin and therefore was performed in accordance with the ethical standards laid down in the 1964 Declaration of Helsinki. Before inclusion in the study, all participants provided informed consent.
Results
Predeparture questionnaires revealed that no participants suffered from any preexisting sleep disorders.
Jet Lag Evaluations
The thresholds of the average jet lag score introduced in an earlier study (Becker et al., 2015b) indicated that 58.82% of participants (10/17 participants) suffered from at least moderate jet lag symptoms after travel to Argentina. This corresponds to a westerly time difference. After the easterly time shift, 66.66% (10/15 participants) showed values above the threshold for moderate jet lag symptoms. The cutoff values corresponding to severe jet lag symptoms revealed a jet lag of 29.41% (5/17 participants) among participants after westerly and 33.33% (5/15 participants) after easterly travel.
If we plot the average jet lag scores for each subgroup (i.e., a group with at least moderate jet lag or no jet lag) on one graph, the course of the average jet lag score for the no-jet-lag group indicates values above the threshold for moderate jet lag only on the first day of travel. On the following days, the score ratings are below the threshold value for moderate jet lag. This applies for both time zone differences. Participants presumed to experience at least moderate jet lag showed values above this limit for almost all study days after the trip (Fig. 1a). The jet lag score increased after travel in each direction. Subsequently, it decreased, but a steadily descending gradient was not obvious. There was a small increase after travel in the score on day 4 (easterly) and on day 5 (westerly).
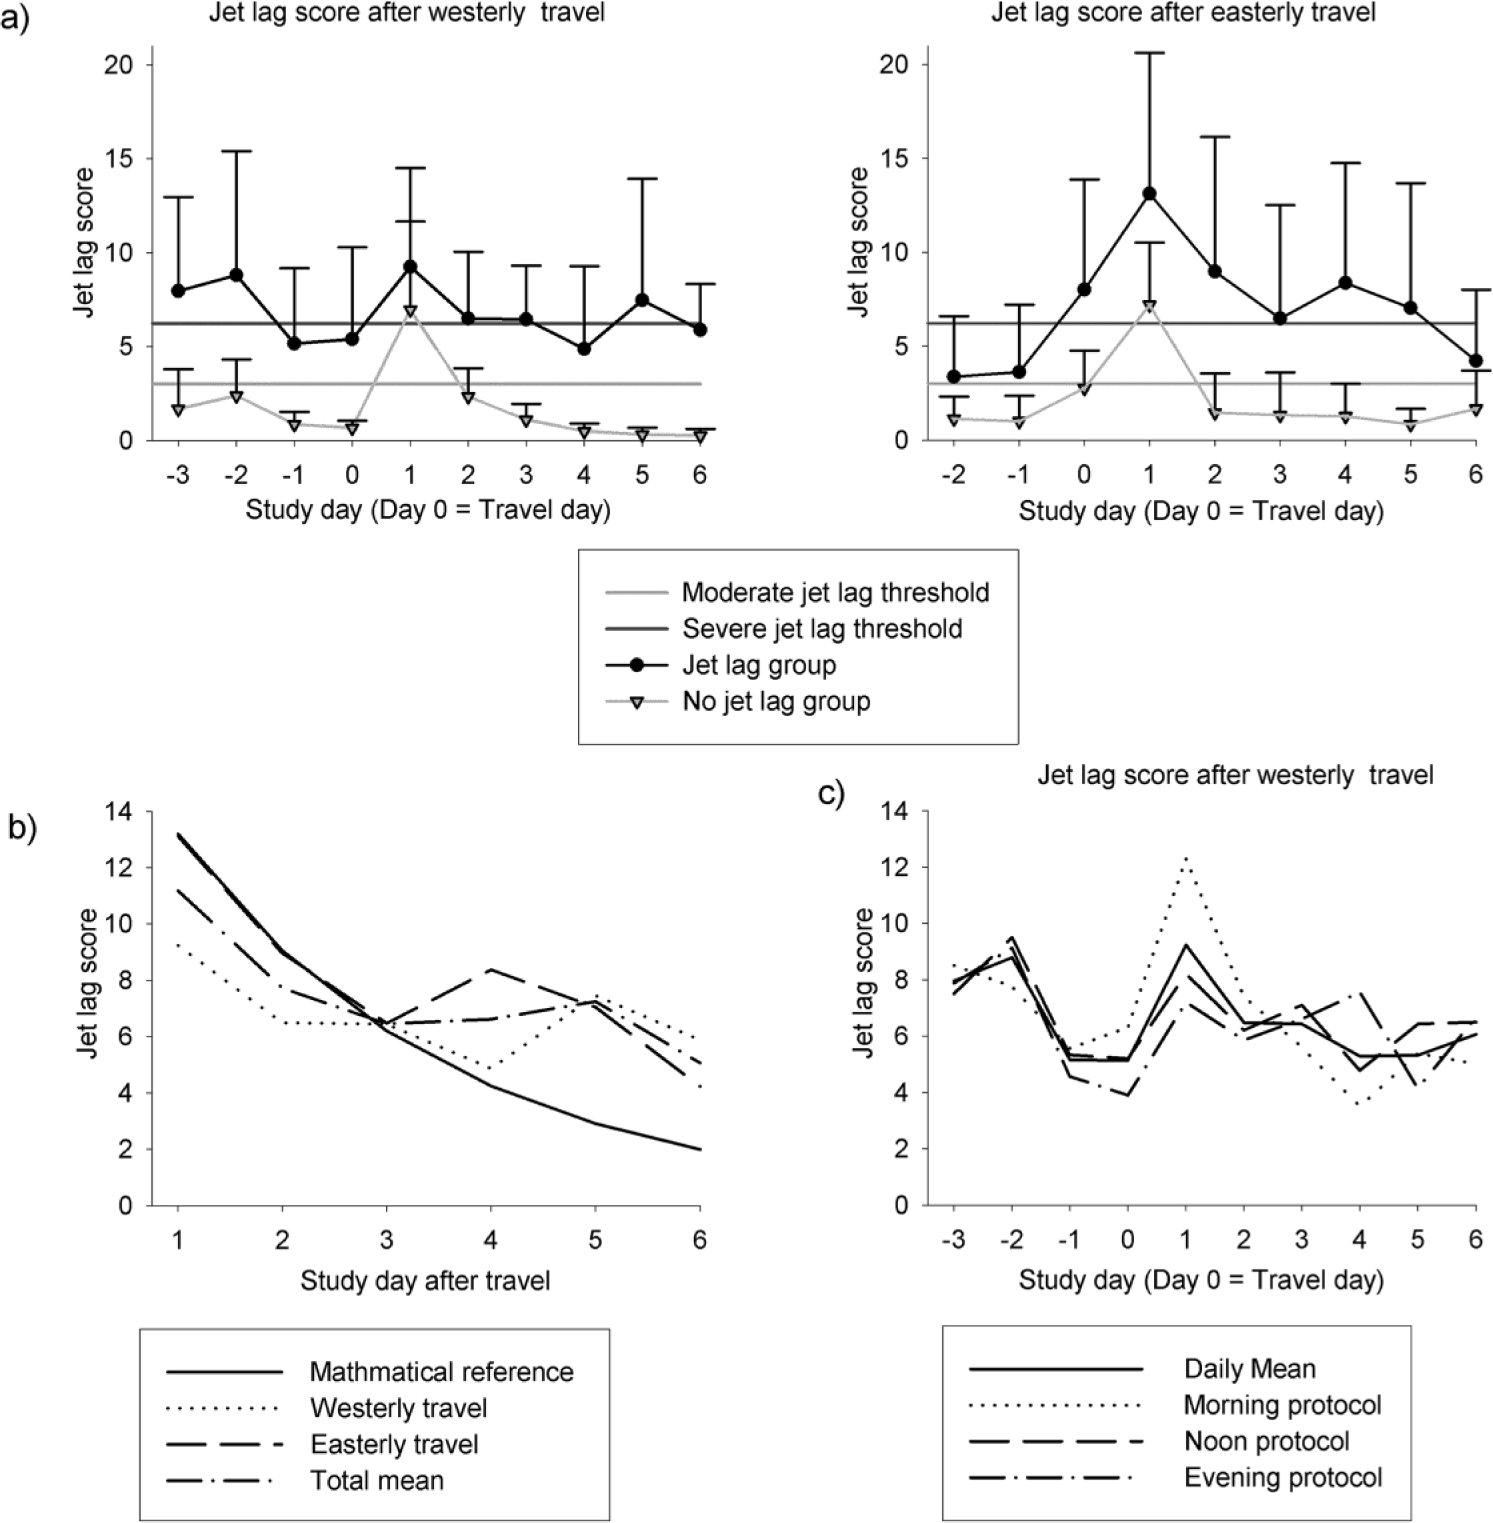
Jet lag score. (a) The time course of the mean jet lag score per study day (day 0 = travel day) after westerly and easterly travel is displayed beside the error bars representing their corresponding standard deviation (SD). The participants are split into groups with at least moderate jet lag and those without jet lag (jet lag and no jet lag group). The horizontal thresholds represent the cutoff values for moderate and severe jet lag presented in a former study (Becker et al. 2015b). (b) Mean jet lag scores of participants having at least moderate jet lag after travel differ for easterly and westerly time zone transitions. The mathematical reference line represents the assessed reference of the general jet lag trend (Becker et al. 2015a). (c) The jet lag score for westerly travel is displayed in the group having at least moderate jet lag, with its 3 daily protocols (morning, noon, and evening).
Figure 1b displays an excerpt of the trend of the jet lag score in the group with at least moderate jet lag after westerly and easterly travel, in relation to the presumed jet lag course identified in a previous study (Becker et al., 2015a). The easterly travel direction nearly exactly follows the mathematical reference line during initial days. As stated above, we observed small rises in each curve.
Daily jet lag scores varied throughout the day. Figure 1c, for example, shows the protocol characteristics after westerly travel. The noon protocol for westerly travel showed the greatest similarities to the mean curve, whereas the morning protocol in most instances disclosed higher jet lag score values than the mean and evening protocol.
Questionnaire Evaluation
Reliability
Cronbach’s alpha for the reliability or internal consistency of the CJS varied between 0.752 and 0.978 (Table 1) for all study days. On study day 2 for westerly travel, test results were 0.752, the only test result below 0.8.
Test of internal consistency—Cronbach’s alpha.
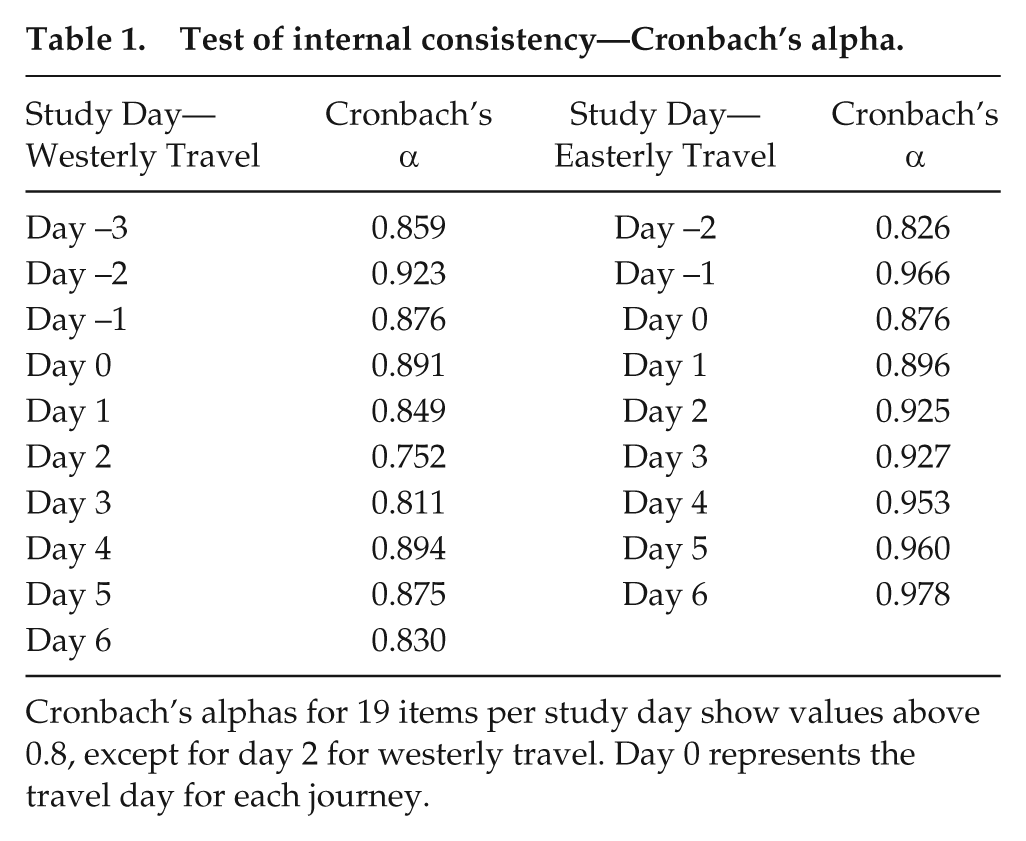
Cronbach’s alphas for 19 items per study day show values above 0.8, except for day 2 for westerly travel. Day 0 represents the travel day for each journey.
Validity
Direct comparison of corresponding data from CJS, sleep diary, and actigraphy
All 3 methods showed high comparison correlations (r > 0.8, p < 0.01) in Pearson and Lin testing for TST. Actigraph values were most often lower than values from sleep diaries and the CJS (Fig. 2). Lin testing estimated mean shifts between 0.008 and 0.455 h. In total, the correlation coefficients for the easterly travel were slightly higher, and the shifts were lower (Table 2). The 6 square scatterplots (Fig. 3a) for the westerly and easterly travel confirmed these biases, with linear regression lines directly adjacent to the line of equality. Furthermore, the Bland-Altman diagrams rarely showed outliers, with LOAs between −0.9 and 0.764 h for westerly travel (Fig. 3c). For the easterly time difference, the LOAs were slightly higher, between −0.2 and 1.06 h (Fig. 3d). With regard to SOL, greater differences were measured between the actigraph and the other methods. Consequently, high correlations arose only for westerly travel based on the CJS and sleep diary (r = 0.795; p < 0.01) (Table 2). The Lin coefficient indicated a value of r = 0.791 with a mean shift of 0.075 min (Table 2). In addition, the Bland-Altman diagrams showed significant correlations between these 2 parameters (Fig. 4c and 4d). The LOAs ranged from −3.76 to 4.26 min. For the easterly travel, the differences narrowed and the mean values of all methods showed high correlations (r = 0.831-0.978) at a significance level of p < 0.01. In addition, the Lin coefficients ranged from r = 0.779 to 0.907, with mean shifts up to 0.085 min. The square scatterplots and the Bland-Altman diagrams revealed LOAs from −20.46 to 18.894 min (Fig. 4).
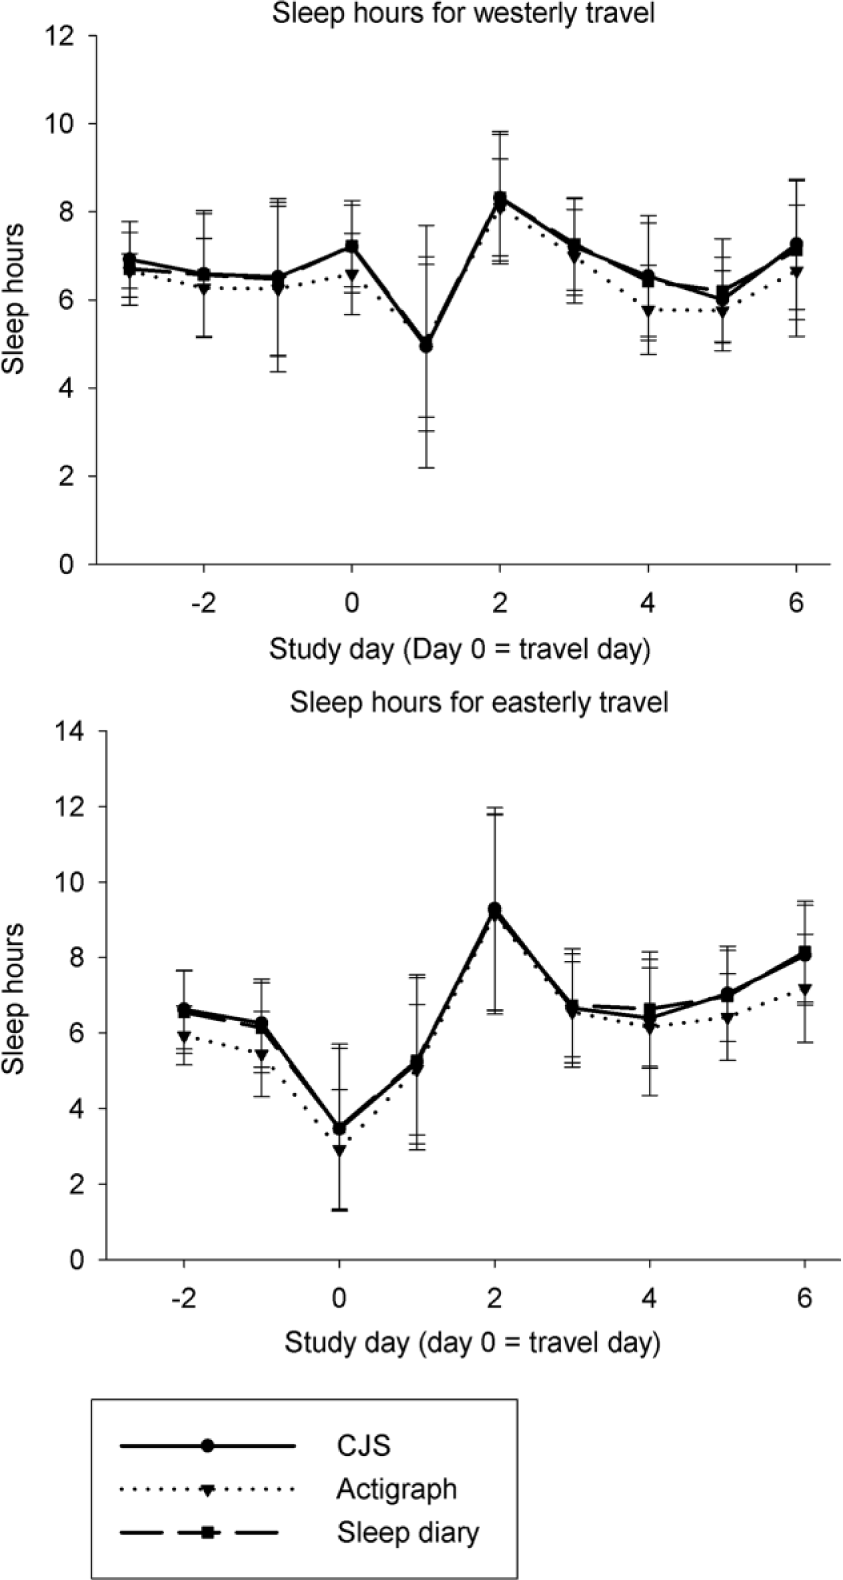
Total sleep time (TST) after westerly and easterly travel. The trend of the mean TST for all 3 measurement methods (actigraphy, sleep diaries, and Charité Jet Lag Scale [CJS]) with their related standard deviation shows similarities in the easterly and westerly travel directions (day 0 = travel day).
Method comparison—Pearson and Lin correlations.
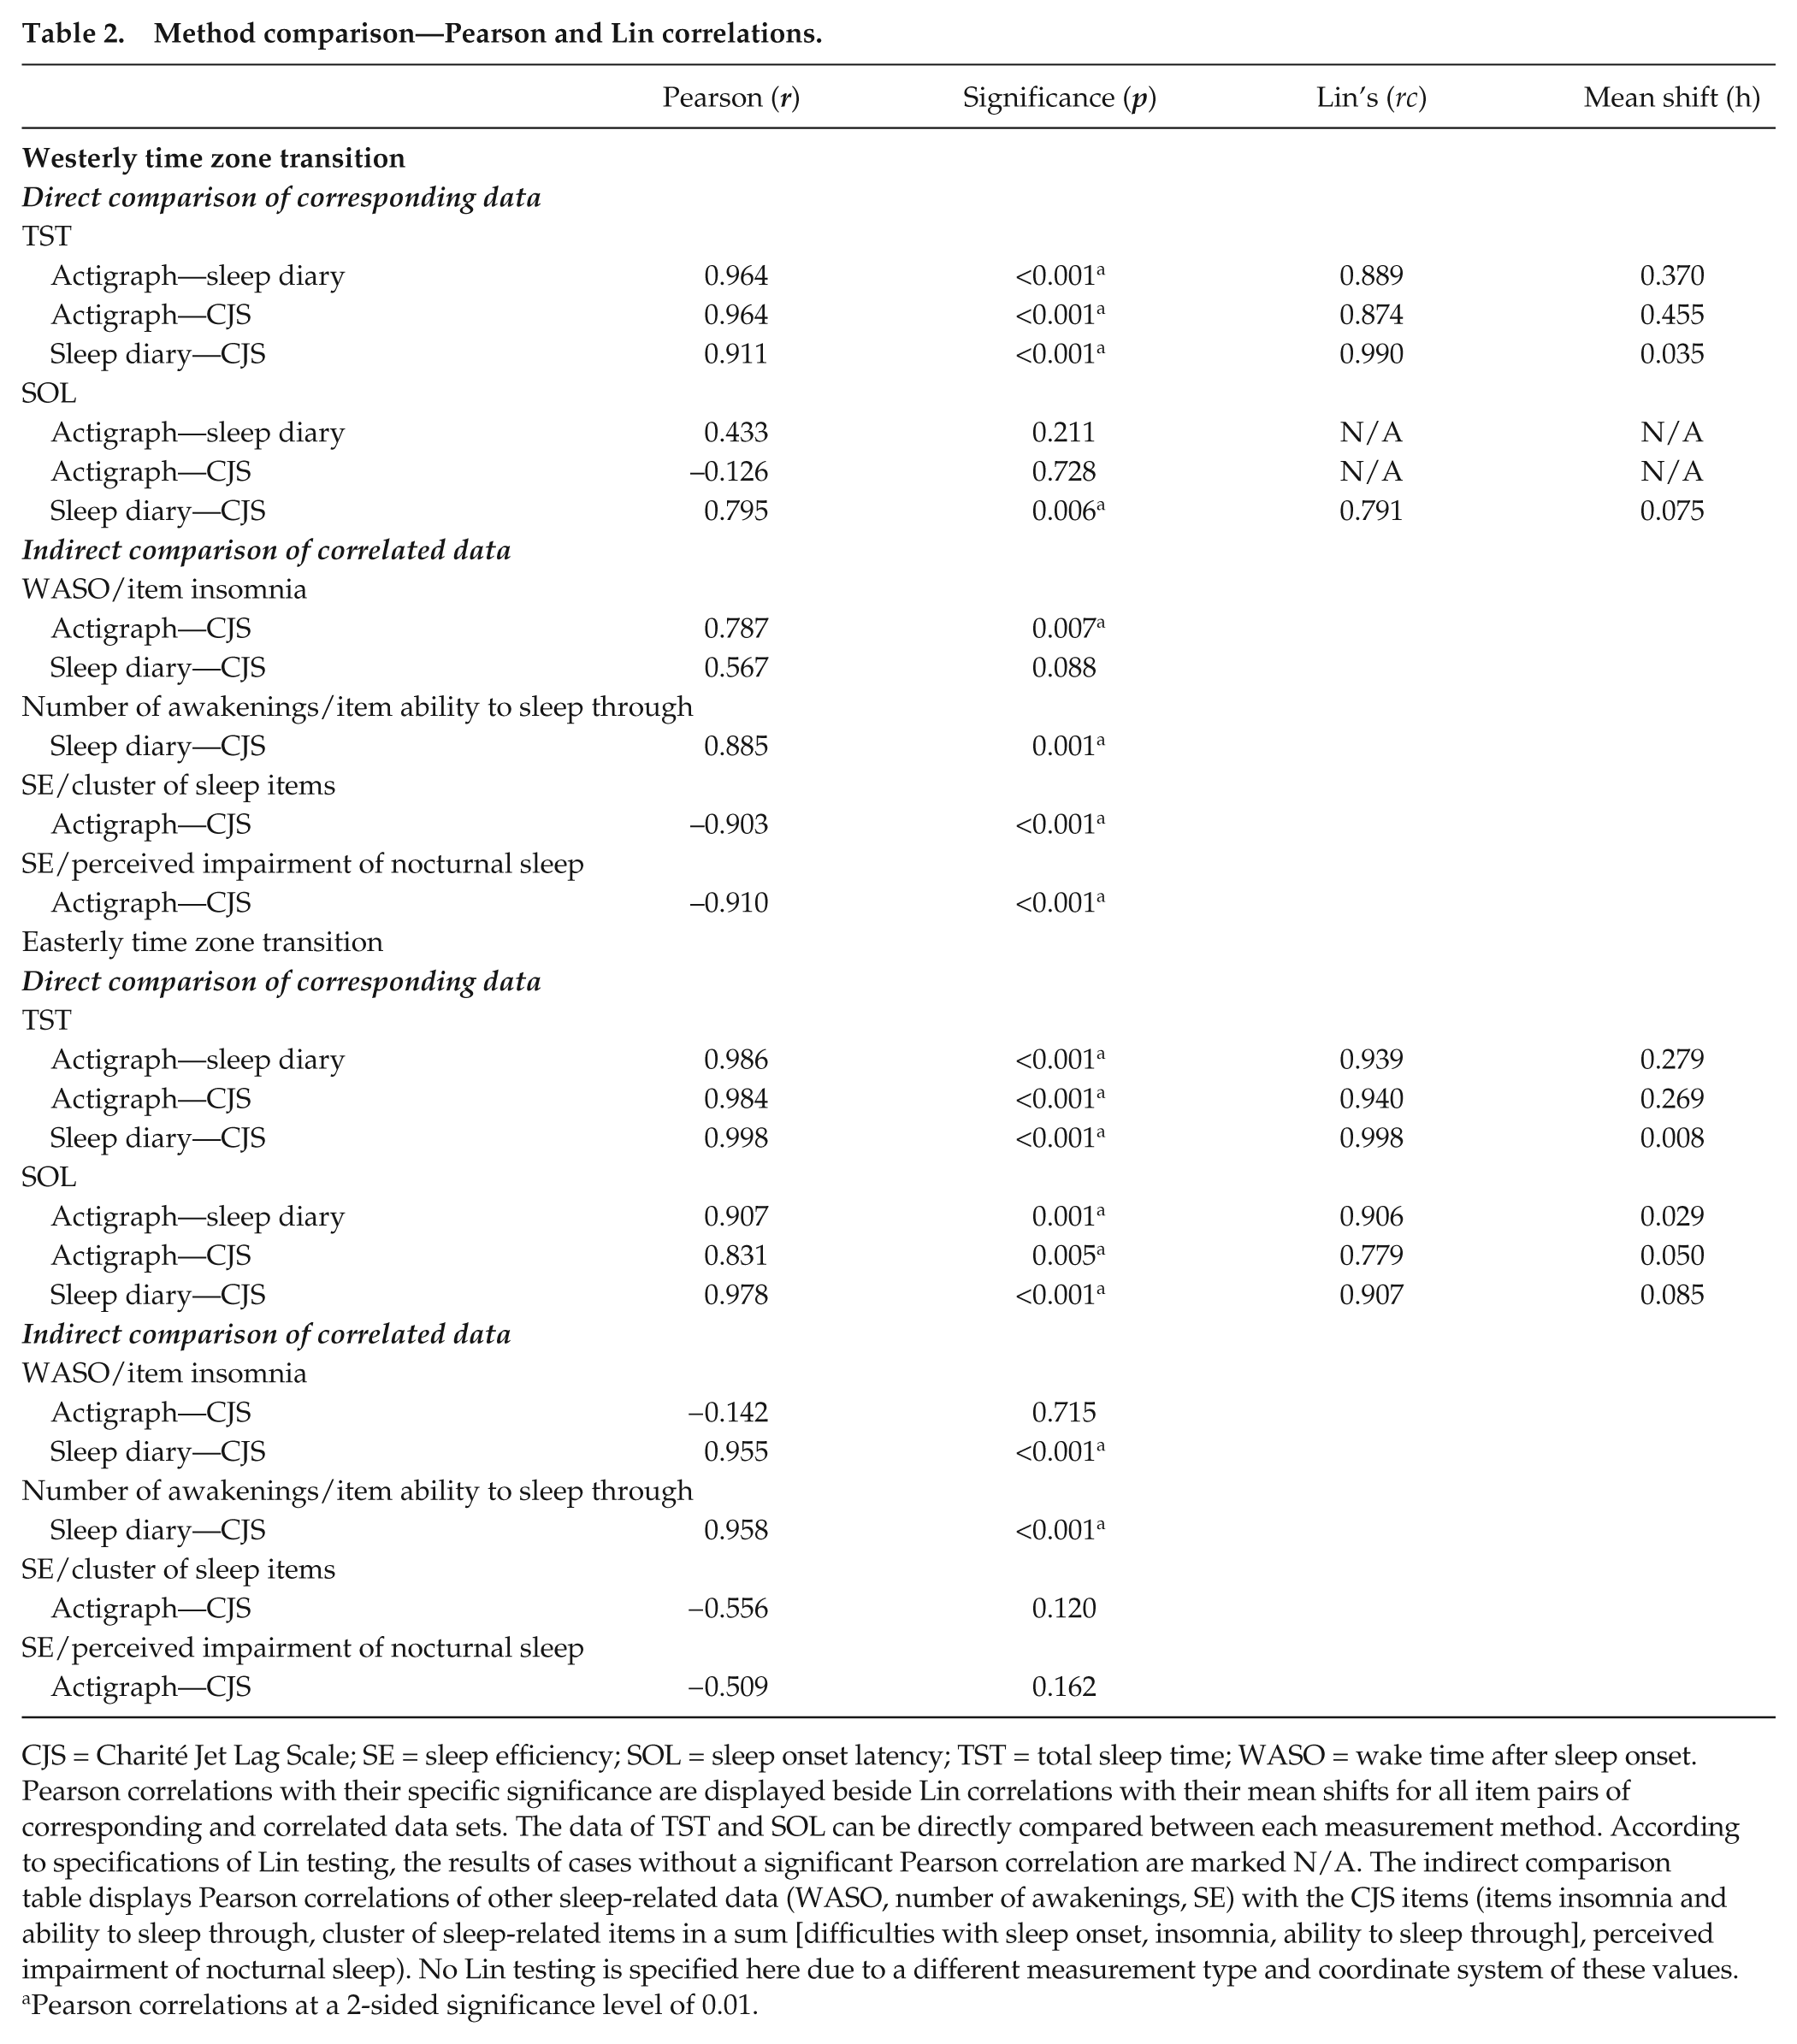
CJS = Charité Jet Lag Scale; SE = sleep efficiency; SOL = sleep onset latency; TST = total sleep time; WASO = wake time after sleep onset. Pearson correlations with their specific significance are displayed beside Lin correlations with their mean shifts for all item pairs of corresponding and correlated data sets. The data of TST and SOL can be directly compared between each measurement method. According to specifications of Lin testing, the results of cases without a significant Pearson correlation are marked N/A. The indirect comparison table displays Pearson correlations of other sleep-related data (WASO, number of awakenings, SE) with the CJS items (items insomnia and ability to sleep through, cluster of sleep-related items in a sum [difficulties with sleep onset, insomnia, ability to sleep through], perceived impairment of nocturnal sleep). No Lin testing is specified here due to a different measurement type and coordinate system of these values.
Pearson correlations at a 2-sided significance level of 0.01.
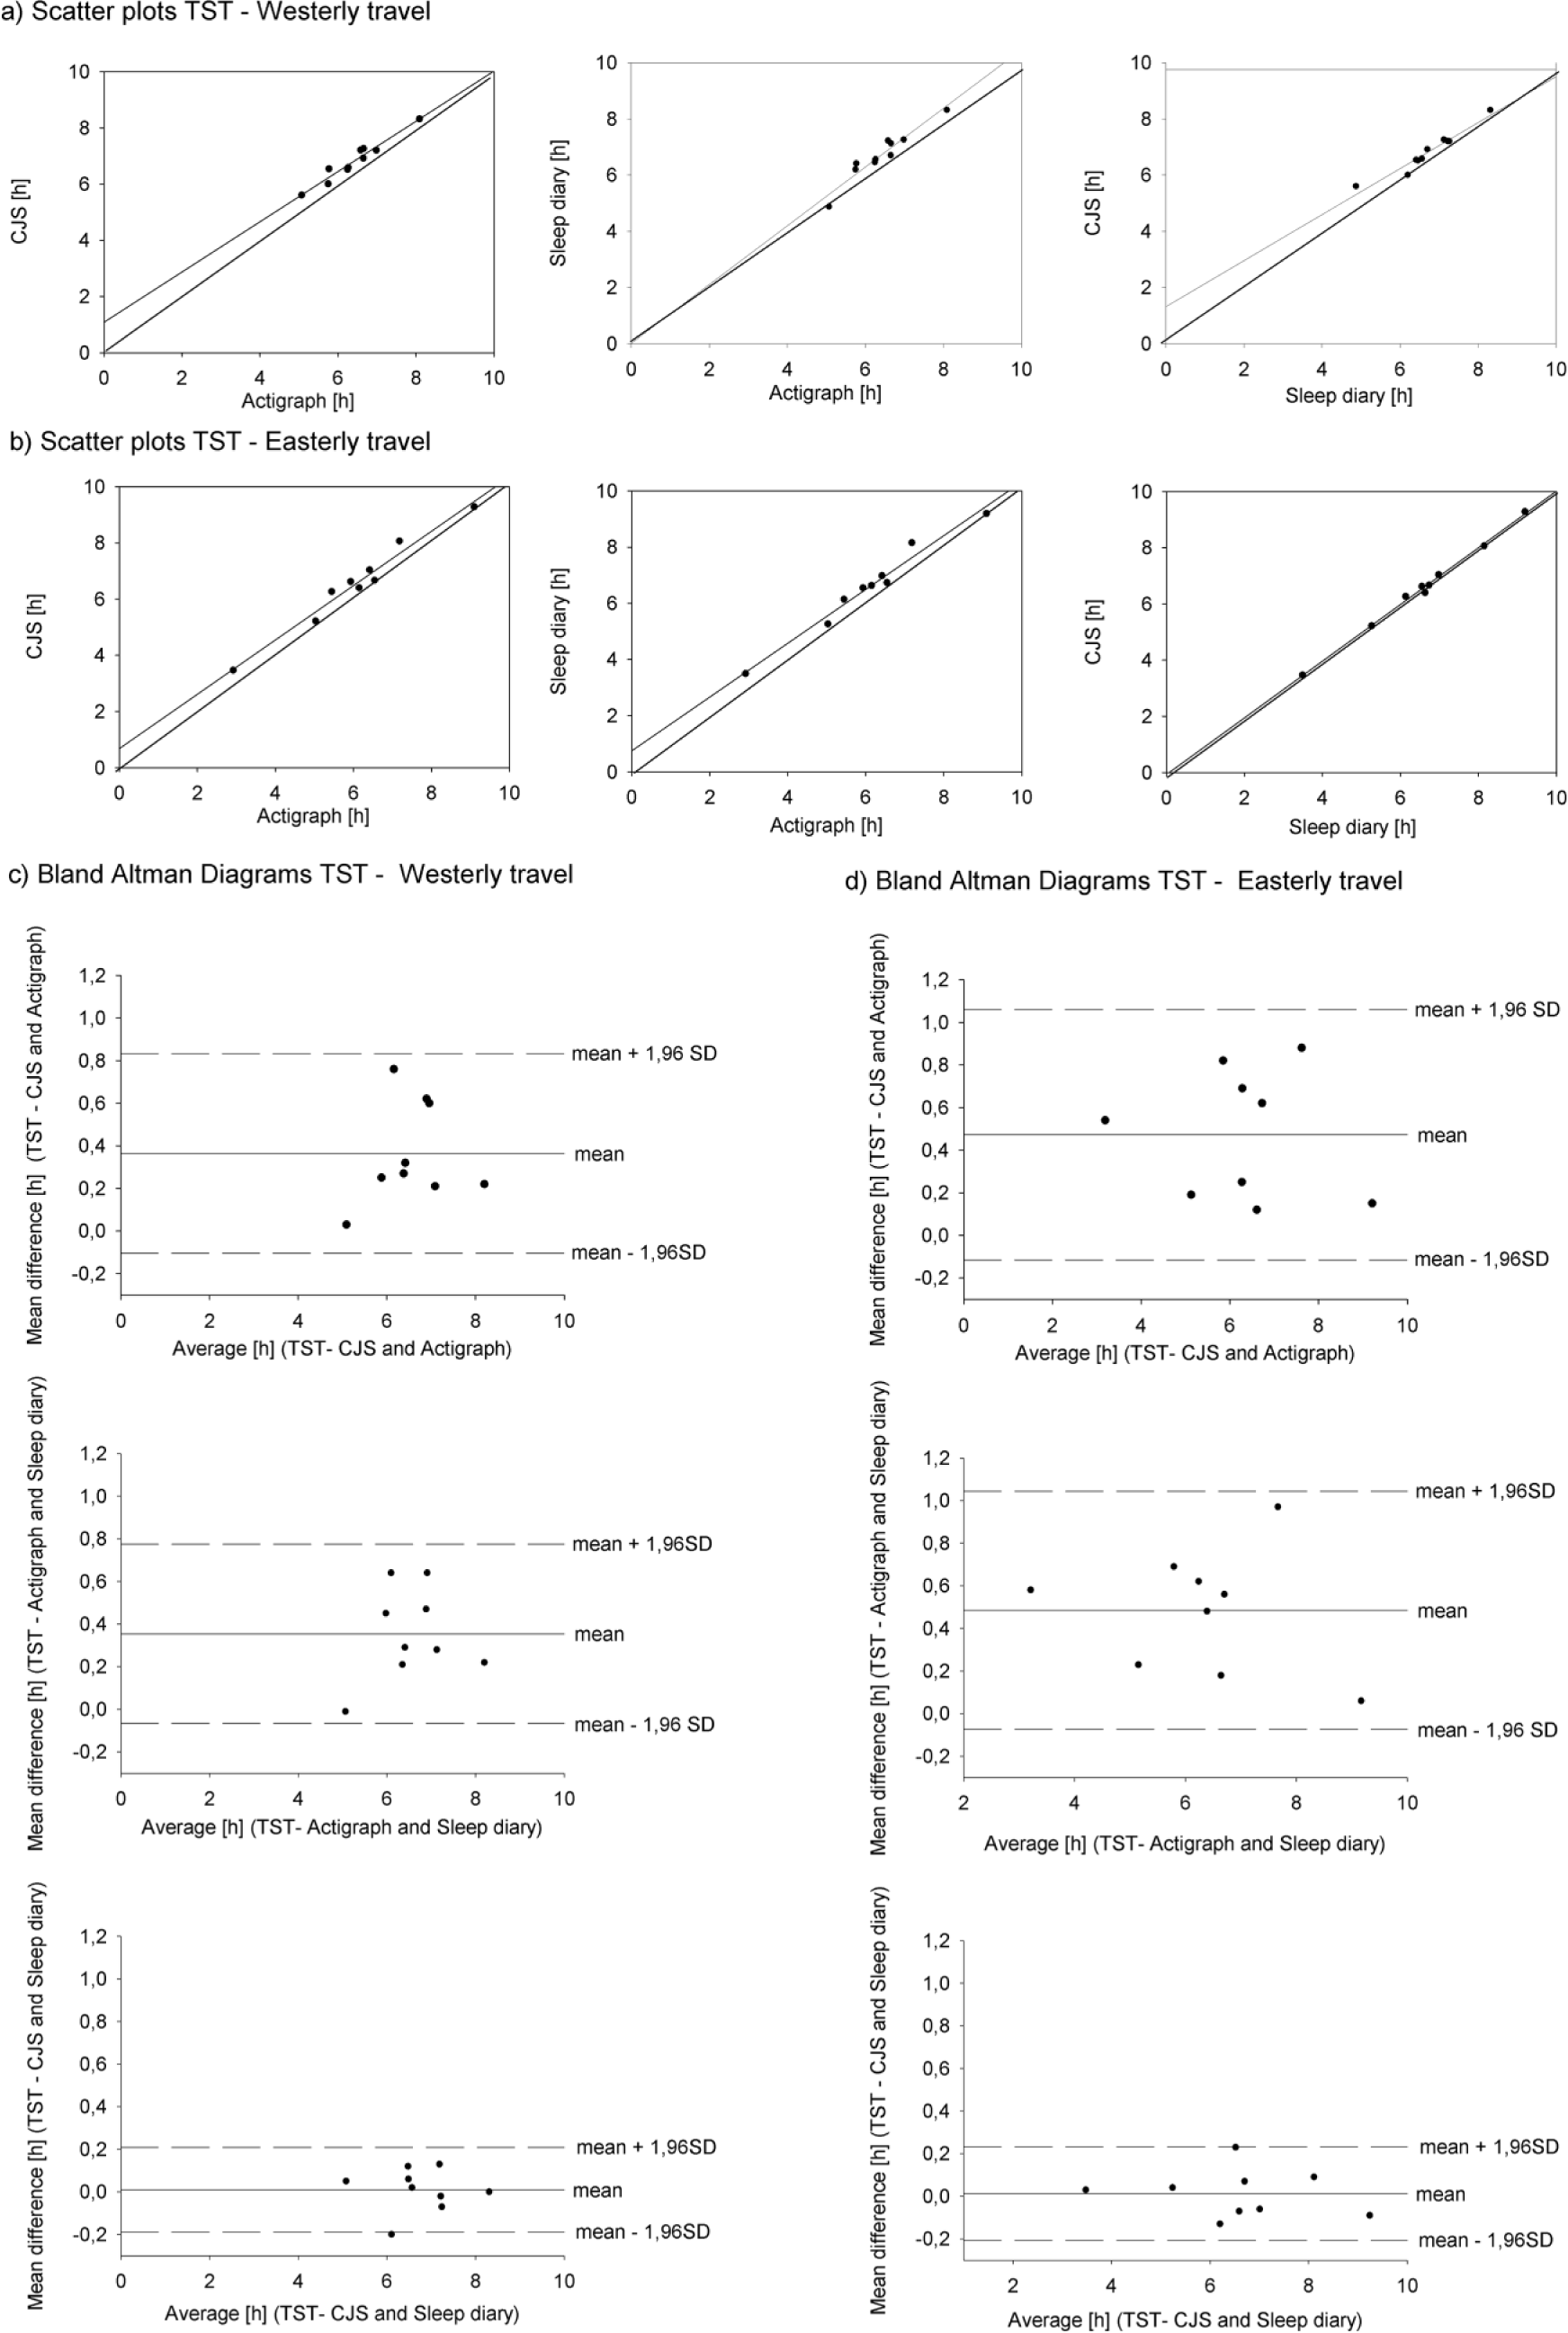
Square scatterplots and Bland-Altman diagrams of total sleep time (TST). (a, b) The line of regression for all 3 methods of measurement in pairs of TST in hours is presented in addition to the line of equality in each scatterplot. (c, d) The x-axis of the comparative Bland-Altman diagrams shows the mean values of TST between the measurement methods, and the y-axis shows the mean differences between these values. The limits of agreement (LOAs) shown stand for mean ± 1.96 SD of this difference. CJS = Charité Jet Lag Scale.
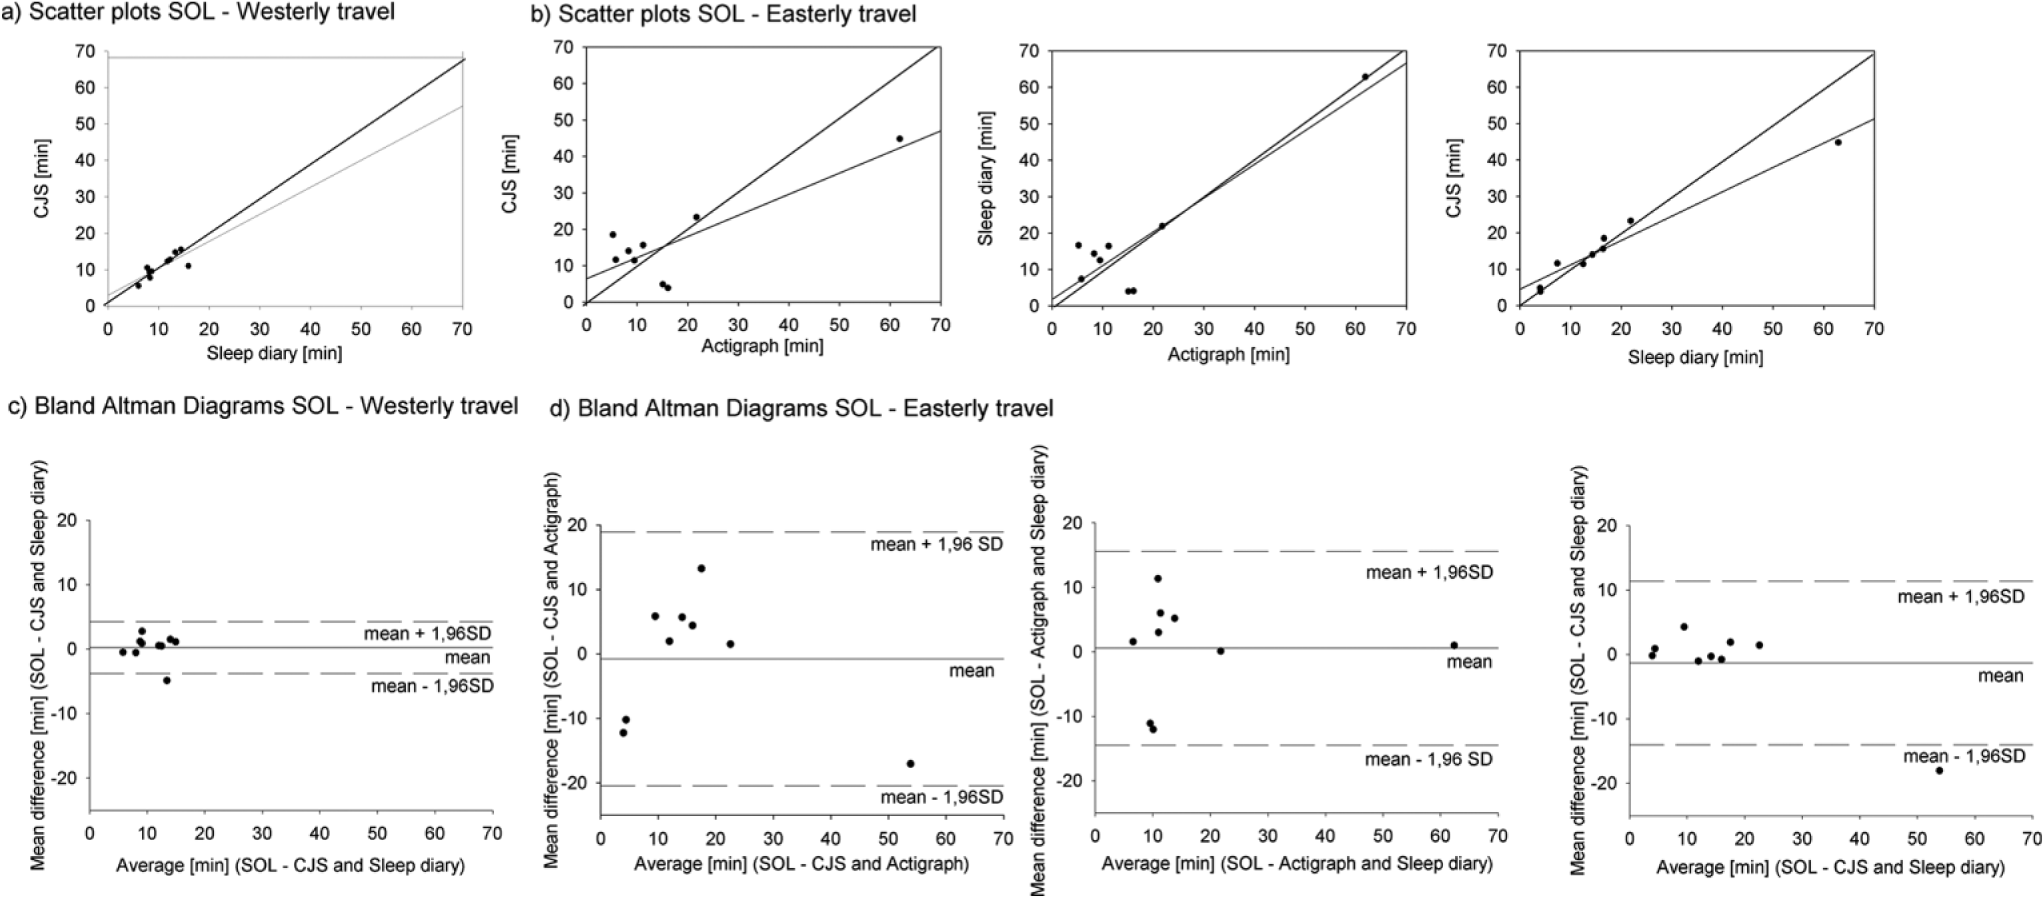
Square scatterplots and Bland-Altman diagrams of sleep onset latency (SOL). (a, b) Besides the mean SOL in minutes for all 3 methods of measurement, the scatterplots show the line of regression for each data set in addition to the line of equality. The cases without significant Pearson correlations are omitted. (c, d) The x-axis of the comparative Bland-Altman diagrams shows the mean values of SOL between the measurement methods, and the y-axis shows the mean differences between these values. The LOAs shown stand for mean ± 1.96 SD of this difference. CJS = Charité Jet Lag Scale.
Indirect comparison of correlated data
The CJS recognizes various items for assessment of sleep. The item for night insomnia relates to the WASO in each night, whereas the ability to sleep through corresponds to the number of awakenings in nocturnal sleep. The WASO had only 1 high Pearson correlation coefficient for each travel direction between the CJS and the actigraph or sleep diary (Table 2), whereas the number of awakenings (sleep diary) showed high correlations (r = 0.885 westerly; r = 0.958 easterly; p ≤ 0.01) (Table 2) to the CJS item with respect to the ability to sleep through in both directions. The data plots likewise underline the results of these calculations (Fig. 5a and 5b). Before the data were plotted, they were Z-transformed with subsequent T-transformation to align the data in 1 coordinate system. The curve progression of the awakenings and ability to sleep through followed the same pathway, whereas deviations were apparent in the characteristics of the wake times (WASO) and CJS item insomnia on the westerly flight. Regarding the easterly time zone transition, a significant correlation between the CJS item insomnia and sleep diary data of WASO was also obvious in the data plots (Fig. 5b). Here there was a similar pattern between the CJS and the sleep diary, whereas the actigraph data plots followed a different characteristic. This corresponds to the missing significant correlation between these data sets.
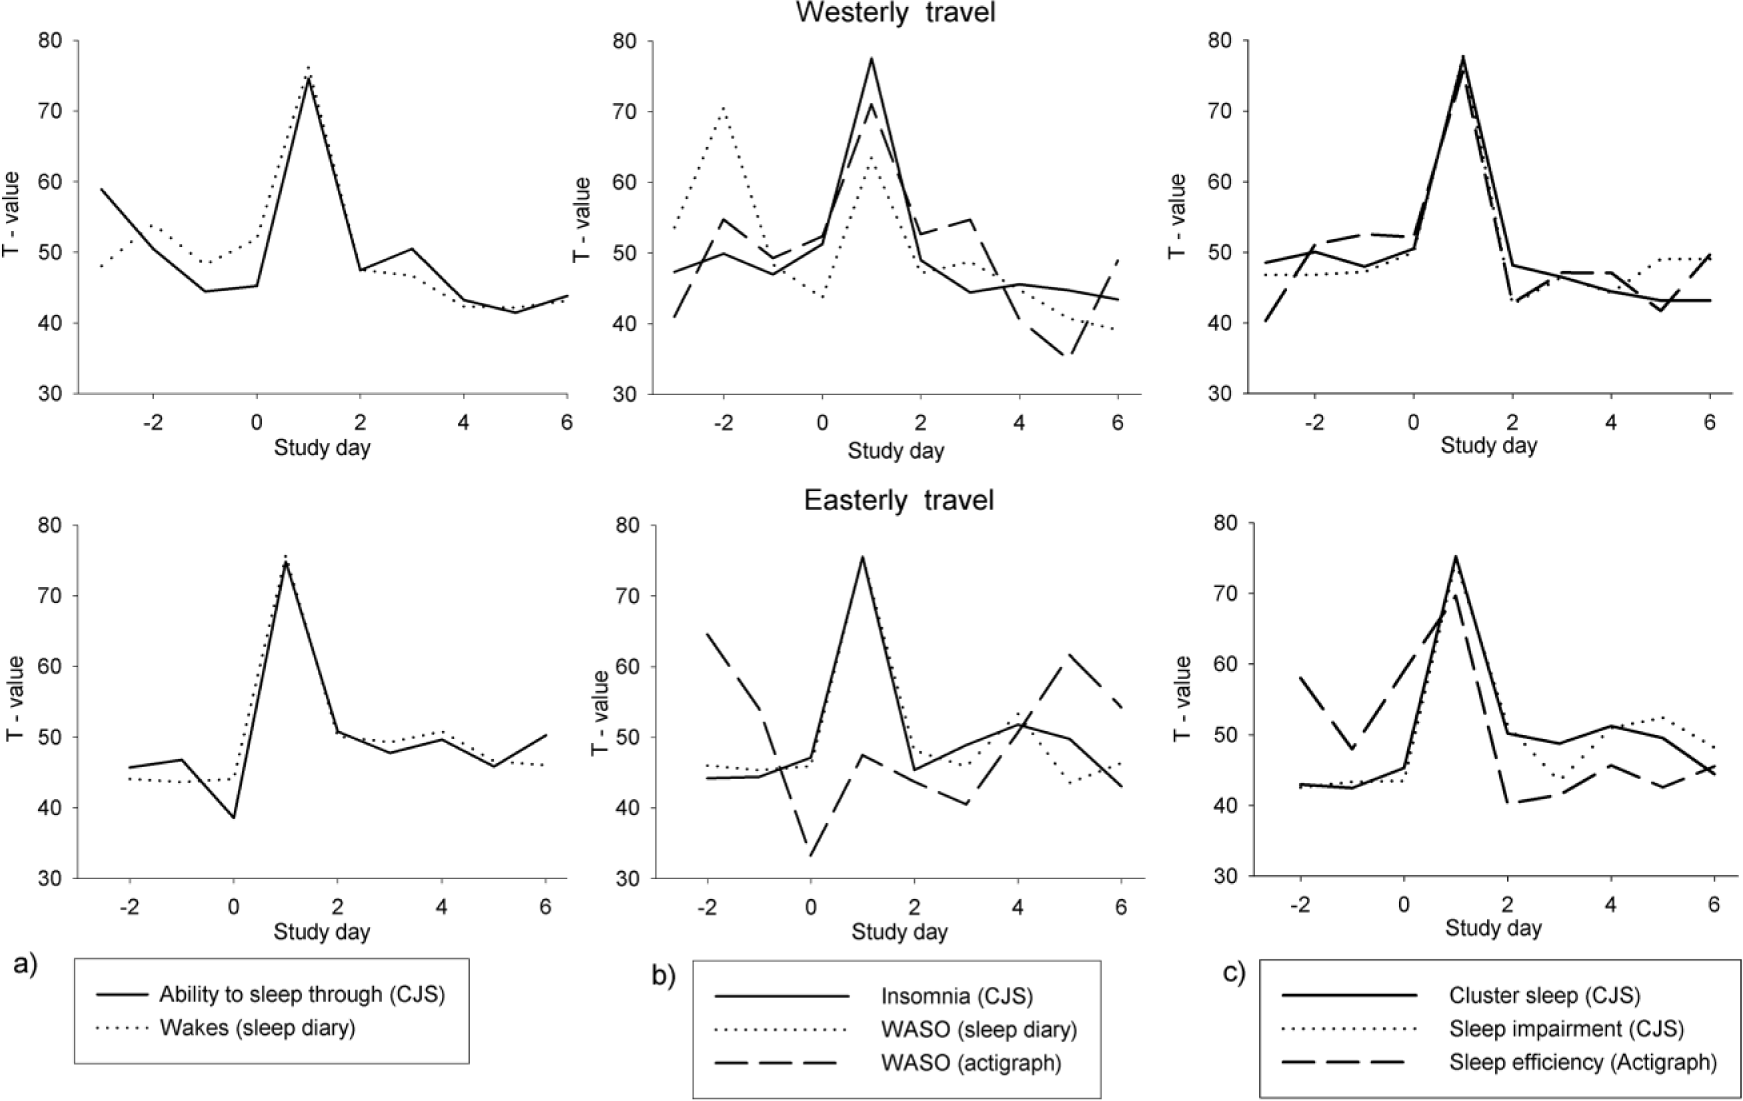
Mean T value diagrams for related items. The mean values for each item were first Z-transformed with subsequent T transformation. The data accordingly have no units of measurement (day 0 = travel day). CJS = Charité Jet Lag Scale; WASO = wake time after sleep onset.
With regard to sleep efficiency, we rated the changes in the efficiency in this method comparison. The internal algorithm of the actigraph calculates the efficiency of nocturnal sleep and outputs it in percentages. As the efficiency of sleep decreases after time-zone transition, it behaves in the opposite direction to the parameters of the CJS. The scores rose with jet lag; given this fact, we considered sleep efficiency (SE) as the difference from 100%. As before, we plotted the T values of related items of the CJS (perceived impairment of sleep by the participant cluster reflecting all sleep-related items in a sum [difficulties with sleep onset, insomnia, ability to sleep through]) and the sleep efficiency in a combined graph (Fig. 5). All 3 parameters followed the same trend on westerly travel, whereas sleep efficiency on easterly travel revealed higher values before the travel and lower levels after the journey. The correlations also reflected these findings. For the westerly flight, the SE was highly correlated with the perceived impairment of sleep (Pearson r = −0.911; p < 0.01) and the cluster of sleep items (Pearson r = −0.903; p < 0.01). However, Pearson correlations were not significant on the return journey.
Discussion
The study results point to positive validation and to reliability of the CJS. The data of the method comparison between TST and SOL corresponded quite well, whereas the data lacked positive correspondence in subareas of WASO and SE. Moreover, the study was able to replicate the results related to jet lag evaluations. The decrease in jet lag symptoms over the initial days after travel, and the prevalence at approximately 60%, corresponded well with findings from the previous related study.
Several other studies have used questionnaires to evaluate prevailing jet lag, although questionnaires are not mentioned as a diagnostic tool for jet lag in the ICSD-3 (AASM, 2014). A consistently applied jet lag questionnaire would be an essential milestone in jet lag research, which is an effective avenue of research that reflects the need for mobile investigations. Due to the extensive travel of participants encountering jet lag, laboratory testing does not enable realistic jet lag research.
Only 1 questionnaire until now has reached level 1 for evidence-based medicine (Morgenthaler et al., 2007b): the Columbia Jet Lag Scale. The CJS, the first German jet lag questionnaire, represents a holistic approach in jet lag research based on the Columbia Jet Lag Scale. Our next important step was evaluation of the questionnaire. In addition to comparison of our jet-lag-related results with other studies, the reliability and validity of the questionnaire are important steps on the way to its promotion.
One important tool for the evaluation of jet lag via the CJS is the jet lag score. As stated in the Methods section, the jet lag score is a daily sum of all protocols from morning, noon, and evening. It is the criterion for the prevalence of jet lag. Two previously described thresholds (see Methods) differentiate between participants without jet lag and those with moderate or even severe symptoms. Participants with least moderate jet lag represent the jet lag group and therefore the prevalence of jet lag among travelers being questioned. This new approach toward jet lag frequency reveals a 60% prevalence of jet lag. The CJS was introduced in a previous study (Becker et al., 2015b). The prevalence of jet lag was assessed once before. With the aid of self-assessment of the Columbia Jet Lag Scale, Spitzer et al. (1999) revealed a prevalence of 63%. The prevalence of jet lag evaluated in the present new study was approximately 60% for both time differences. However, traveling in easterly direction resulted in higher jet lag percentages. The travel direction could well contribute to this higher rate, since eastward travel often manifests itself in more pronounced jet lag (AASM, 2014). In the previous study, we assumed higher rates for the easterly travel direction, as nearly all participants at that time had traveled in the westerly direction (Becker et al., 2015b). With regard to the development of jet lag during the days subsequent to travel, the present study cannot achieve exactly the same mathematical description as the previous study (Becker et al., 2015a). Nevertheless, the courses demonstrate more than an approximation: The curve for the easterly time difference virtually exactly follows the same curve assumed for general jet lag during the first days after travel (Fig. 1b). At this point, it is important to mention that only members of a chorus with a tight schedule in Argentina participated in this study. This could be the reason for higher jet lag score values after the third day after travel. The beginning of the chorus festival/concerts on the evening of study day 4 (westerly travel) may impede further adaptation to the environment. On the fourth day after the easterly travel, it is possible, from an anamnestic standpoint, that the first chorus rehearsal was performed after the return journey to Germany. At any rate, we did not assess the schedules of the individual participants after the easterly travel back to Germany, which is one of the limitations of our study. Nevertheless, the characteristics of the jet lag score evaluated by the CJS in this and the previous study have demonstrated the same type of curve found in other earlier studies that evaluated types of jet lag score (e.g., Spitzer et al., 1999; Columbia Jet Lag Scale).
Another important point is the variation of jet lag score in accordance with the time of day. The CJS offers the opportunity of distinguishing between the mean jet lag score and all separate protocols (morning, noon, and evening). The figure for westerly travel (Fig. 1c) shows that the noon protocol was closest to the daily mean value, whereas the morning protocol after travel initially demonstrated higher values and the evening protocol lower values than the average. This pattern changed during one day (day 4), with higher values in the evening also resulting in higher values for the following morning protocol. This accords with previously described increases in mean jet lag score curve and with the chorus schedule during the related days.
Since reliability is one important quality measure for a questionnaire, we investigated this factor by applying Cronbach’s alpha. The values found in the present study, with only one below 0.8, demonstrate good data for internal consistency of the CJS (Kline, 2011). The previous study also reflected respectable values above this threshold of 0.8 for reliability (Kline, 2011).
For validation of the CJS, we decided on a method-comparison approach. This technique has been used to validate other questionnaires (Wolfson et al., 2003; Sadeh, 2004). Our study represents the first validation of a jet lag questionnaire by different measurement tools. The AASM encourages the combination of flexible evaluation methods (Morgenthaler et al., 2007b) such as actigraphy and sleep diaries to enable broader insights into individual symptoms and to supplement data for monitoring sleep pattern processes (Burgess et al., 2003; Eastman et al., 2005). Evidence for the validity of the CJS is assessed by the comparison of corresponding and related data from the various methods. Sadeh (2004) applied this procedure in questionnaire validation. Our approach of using different comparison tools such as correlations and Bland-Altman diagrams represents a reasonable method for reducing the overall limitations of comparison (Hedner et al., 2004; Penzel et al., 2004).
Comparison of different measurements of TST showed high correlations between all 3 methods. Lin correlation coefficients for TST underlined the existence of a bias between the methods, in addition to high correspondence among values. In former studies, the differences between actigraphy, PSG, and sleep diaries evaluating TST increased to 1 hour (Cole et al., 1992; Hauri and Wisbey, 1992; Jean-Louis et al., 1996; Lockley et al., 1999; Kushida et al., 2001; Hedner et al., 2004; Lauderdale et al., 2006). The direction of the deviations alter between methods; here, actigraphy overestimated or underestimated sleep duration (Lockley et al., 1999; Vallieres and Morin, 2003; Morgenthaler et al., 2007a). Overall, the LOAs for TST found in this study (−0.9 to 1.06 h) emphasize the same level of accuracy between the 3 methods and provide initial positive feedback for evaluation of CJS validity. One reason for the generally lower values of actigraph parameters could be our definition of the actual sleep time as reference value.
For the easterly travel, all measurement methods for SOL have significant correlations, whereas westerly travel shows significant correlations only between the sleep diary and CJS. Nevertheless, the existent correlations and the LOAs—with values for westerly travel of up to 4.26 min and easterly travel of −20.46 to 18.894 min—point to positive validation of the scale, especially since the LOAs lay within a range found in former studies. Various studies have reported discrepancies of the SOL between actigraphy, PSG, and sleep diaries of up to 30 min (Cole et al., 1992; Vallieres and Morin, 2003; Hedner et al., 2004). One reason for the greater divergence of actigraph data in this respect could be lack of differentiation between inactivity, restlessness during sleep, and sleep itself in the actigraph measurements (Sadeh et al., 1995; Kushida et al., 2001). Most problems with actigraphy arise during the transition phases of sleep, which could also be a factor leading to these differences (Sadeh and Acebo, 2002; Lockley et al., 1999). Nevertheless, data for insomnia related to the WASOs measured by actigraphy or sleep diary were correlated for at least 1 of the travel directions (east or west). However, the number of awakenings had high correlations with the CJS for both types of measurement and directions of travel. Here, the results also point to positive validation of the CJS.
The last compared item was objective sleep efficiency (actigraphy) in relation to subjective sleep impairment or cluster of sleep items (CJS). The results showed good correlations for the westerly flight. However, the data lacked good correlations for the return journey. Problems with the correlation of sleep efficiency data between PSG and actigraphy were similarly documented earlier (Reid and Dawson, 1999).
The results from method comparison between actigraphy, sleep diaries, and CJS support overall positive validation of the CJS.
A number of limitations arise due to study design. One methodological limitation is sample size, including data missing owing to technical problems. A greater number of participants covering broader sex and age ranges would have been beneficial. Despite the considerable burden for participants, however, a high percentage of the chorus agreed to attend the study.
Taking into account the relatively small sample size, we decided to consider mean values per study day instead of single values. From the standpoint of individual values for the items, greater scattering is obvious. Moreover, problems with evaluation of actigraphy data appeared mostly in the transition phases of nocturnal sleep and in identifying wake cycles during this time. Owing to this fact, analysis of correlations in this context was quite difficult and possibly contributed to a lack of positive results. Consideration should be given to whether actigraphy devices with mark buttons should be used in future studies. This could be one possible way of eliminating such problems.
Although the present study must be evaluated with some caution, the study results contribute to positive evaluation of the CJS. In summary, the validity test of the CJS showed good results, with less specificity in the subarea of SE and WASO. The computed values of correlations and LOAs of the Bland-Altman plots are acceptable for clinical observations. In addition to the validity check, the CJS succeeded in replicating good values for internal consistency with Cronbach’s alpha. Moreover, this is the second study in which the CJS ascertained a prevalence of jet lag of approximately 60% of participants, with characteristic development of jet lag over initial study days. In conclusion, there is evidence that the CJS is on the way toward achieving validation as a jet lag questionnaire.
In the next step, further development of the scale based on present studies should be the focus. One essential step in future jet lag research is development of a consistent jet lag questionnaire. A uniform questionnaire and its possible translations could be used to investigate jet lag and its symptoms in a cross-cultural environment. The CJS with its broader symptom spectrum and general approach could represent a possible alternative to existing questionnaires. However, more studies with a larger participant radius are needed. We are convinced that a consistent questionnaire will in the long run increase the acceptance of questionnaires evaluating jet lag. Another focus of future jet lag research should be establishment of possible jet lag alleviation methods. More baseline studies with consistent questionnaires are needed regarding this topic. In light of the increasing volume of air travel per year and the 60% prevalence of jet lag, the aim should be creation of a tool for travelers that provides recommendations for alleviation of jet lag symptoms. An even more complex step could be establishment of a tool incorporating possible cross-cultural differences in jet lag perception. To achieve this, a uniform questionnaire on jet lag symptoms is necessary. The CJS supported by the results of this study could represent a possible approach for establishing a consistent interviewing method.
Footnotes
Conflict of Interest Statement
The author(s) declared no potential conflicts of interest with respect to the research, authorship, and/or publication of this article.
Notes
References
Supplementary Material
Please find the following supplemental material available below.
For Open Access articles published under a Creative Commons License, all supplemental material carries the same license as the article it is associated with.
For non-Open Access articles published, all supplemental material carries a non-exclusive license, and permission requests for re-use of supplemental material or any part of supplemental material shall be sent directly to the copyright owner as specified in the copyright notice associated with the article.