
Abstract
Measuring real-time gene activity in the brains of freely moving animals presents a challenging issue in neuroscience research. Circadian gene expression in neurons of the suprachiasmatic nucleus (SCN), a small nucleus in the hypothalamus, is reflected in behavioral rhythmicity. Cellular oscillatory gene expression is generated by a transcription-translation feedback loop of clock genes including 2 oscillatory genes, Per1 and Per2. Here we have succeeded in real-time monitoring of Per1 and Per2 transcription separately by detecting the bioluminescence of luciferase (luc) reporters using a plastic optical fiber inserted into the SCN of freely moving rats. Per1-luc and Per2-luc rhythms peaked in the middle and late subjective day, respectively, which was confirmed by quantitative PCR-based measurements of SCN tissue samples. Studies of in vivo transcriptional states of clock genes in freely moving animals should improve our understanding of how clock gene expression is reflected in behavior.
Most physiological functions and behaviors exhibit a circadian rhythm of approximately 24 h (Hastings et al., 2008; Takahashi et al., 2008; Silver and Kriegsfeld, 2014). Circadian oscillation is generated by a transcription-translation feedback loop of the clock genes, in which the transcriptional activators CLOCK and BMAL1, as well as the repressors PER1, PER2, CRY1, and CRY2, reciprocally activate and suppress E-box-regulated genes, respectively, such as Per1 and Per2 (Reppert and Weaver, 2001; Okamura, 2004). Astonishingly, a key feature of the circadian system is that behavioral rhythmicity is regulated by a transcriptional rhythm of the clock genes expressed in the master circadian clock of the suprachiasmatic nucleus (SCN), which synchronizes the oscillations of peripheral clocks (Mohawk et al., 2012). Previously, researchers found that SCN-ablated animals lost their circadian physiological functions and behavioral rhythms (Moore and Eichler, 1972; Stephan and Zucker, 1972), and transplantation of donor neonatal SCN grafts to SCN-ablated host animals restored the circadian behavioral rhythms of the host, in which the reconstituted period length of the host depended on that of the donor SCN (Ralph et al., 1990; Sujino et al., 2003). Recent studies have also shown that SCN-targeted genetic manipulation of the clock genes causes changes in circadian behavior (Husse et al., 2011; Lee et al., 2015; Mieda et al., 2015). These results imply that circadian oscillations of individual SCN clock neurons, generated by rhythmic transcription of the clock genes, are synchronized within the SCN, and a coherent time signal is transmitted to the other brain areas, regulating the animal’s behavior.
Real-time monitoring of the expression profiles of the clock genes in freely moving animals is a promising technique to monitor clock gene transcription dynamics and in vivo circadian behavior. Previously, we performed in vivo real-time recording of bioluminescence in the SCN of transgenic mice carrying a luciferase (luc) reporter gene under the control of the Per1 promoter (Per1-luc mice; Yamaguchi et al., 2000) by using a stereotaxically inserted optical fiber connected to a photomultiplier apparatus (Yamaguchi et al., 2001). We observed a clear circadian oscillation of the bioluminescence, with peaks and troughs during the day and night, respectively. However, our previous real-time recording technique had 2 methodological disadvantages. First, the substrate of luc for light emission, luciferin, required continuous infusion into the lateral ventricle of the brain. For an adequate quantity of luciferin to be delivered to the SCN, we required an infusion rate of 15 µL/h using a syringe pump. However, this high infusion rate often caused rapid death of mice, probably due to increased intracranial pressure, and continued recording for long durations was extremely difficult. Second, the optical fiber that was connected directly to the head of the mouse and the photon-counting device was relatively stiff, and its size (0.5 mm in diameter) was rather large compared with the mouse skull. Therefore, locomotor activities of the mice were restricted.
We aimed to overcome these limitations. In this study, luciferin was supplied from an osmotic minipump and delivered to the SCN directly via the guide cannula of the optical fiber to reduce the quantity of luciferin to be infused (Fig. 1A). This decreased the infusion rate to 3 µL/h. Additionally, we installed a swivel in the optical fiber to allow rotational motion. Finally, we used rats instead of mice due to their larger size; thus, the size of the optical fiber relative to the brain was reduced.
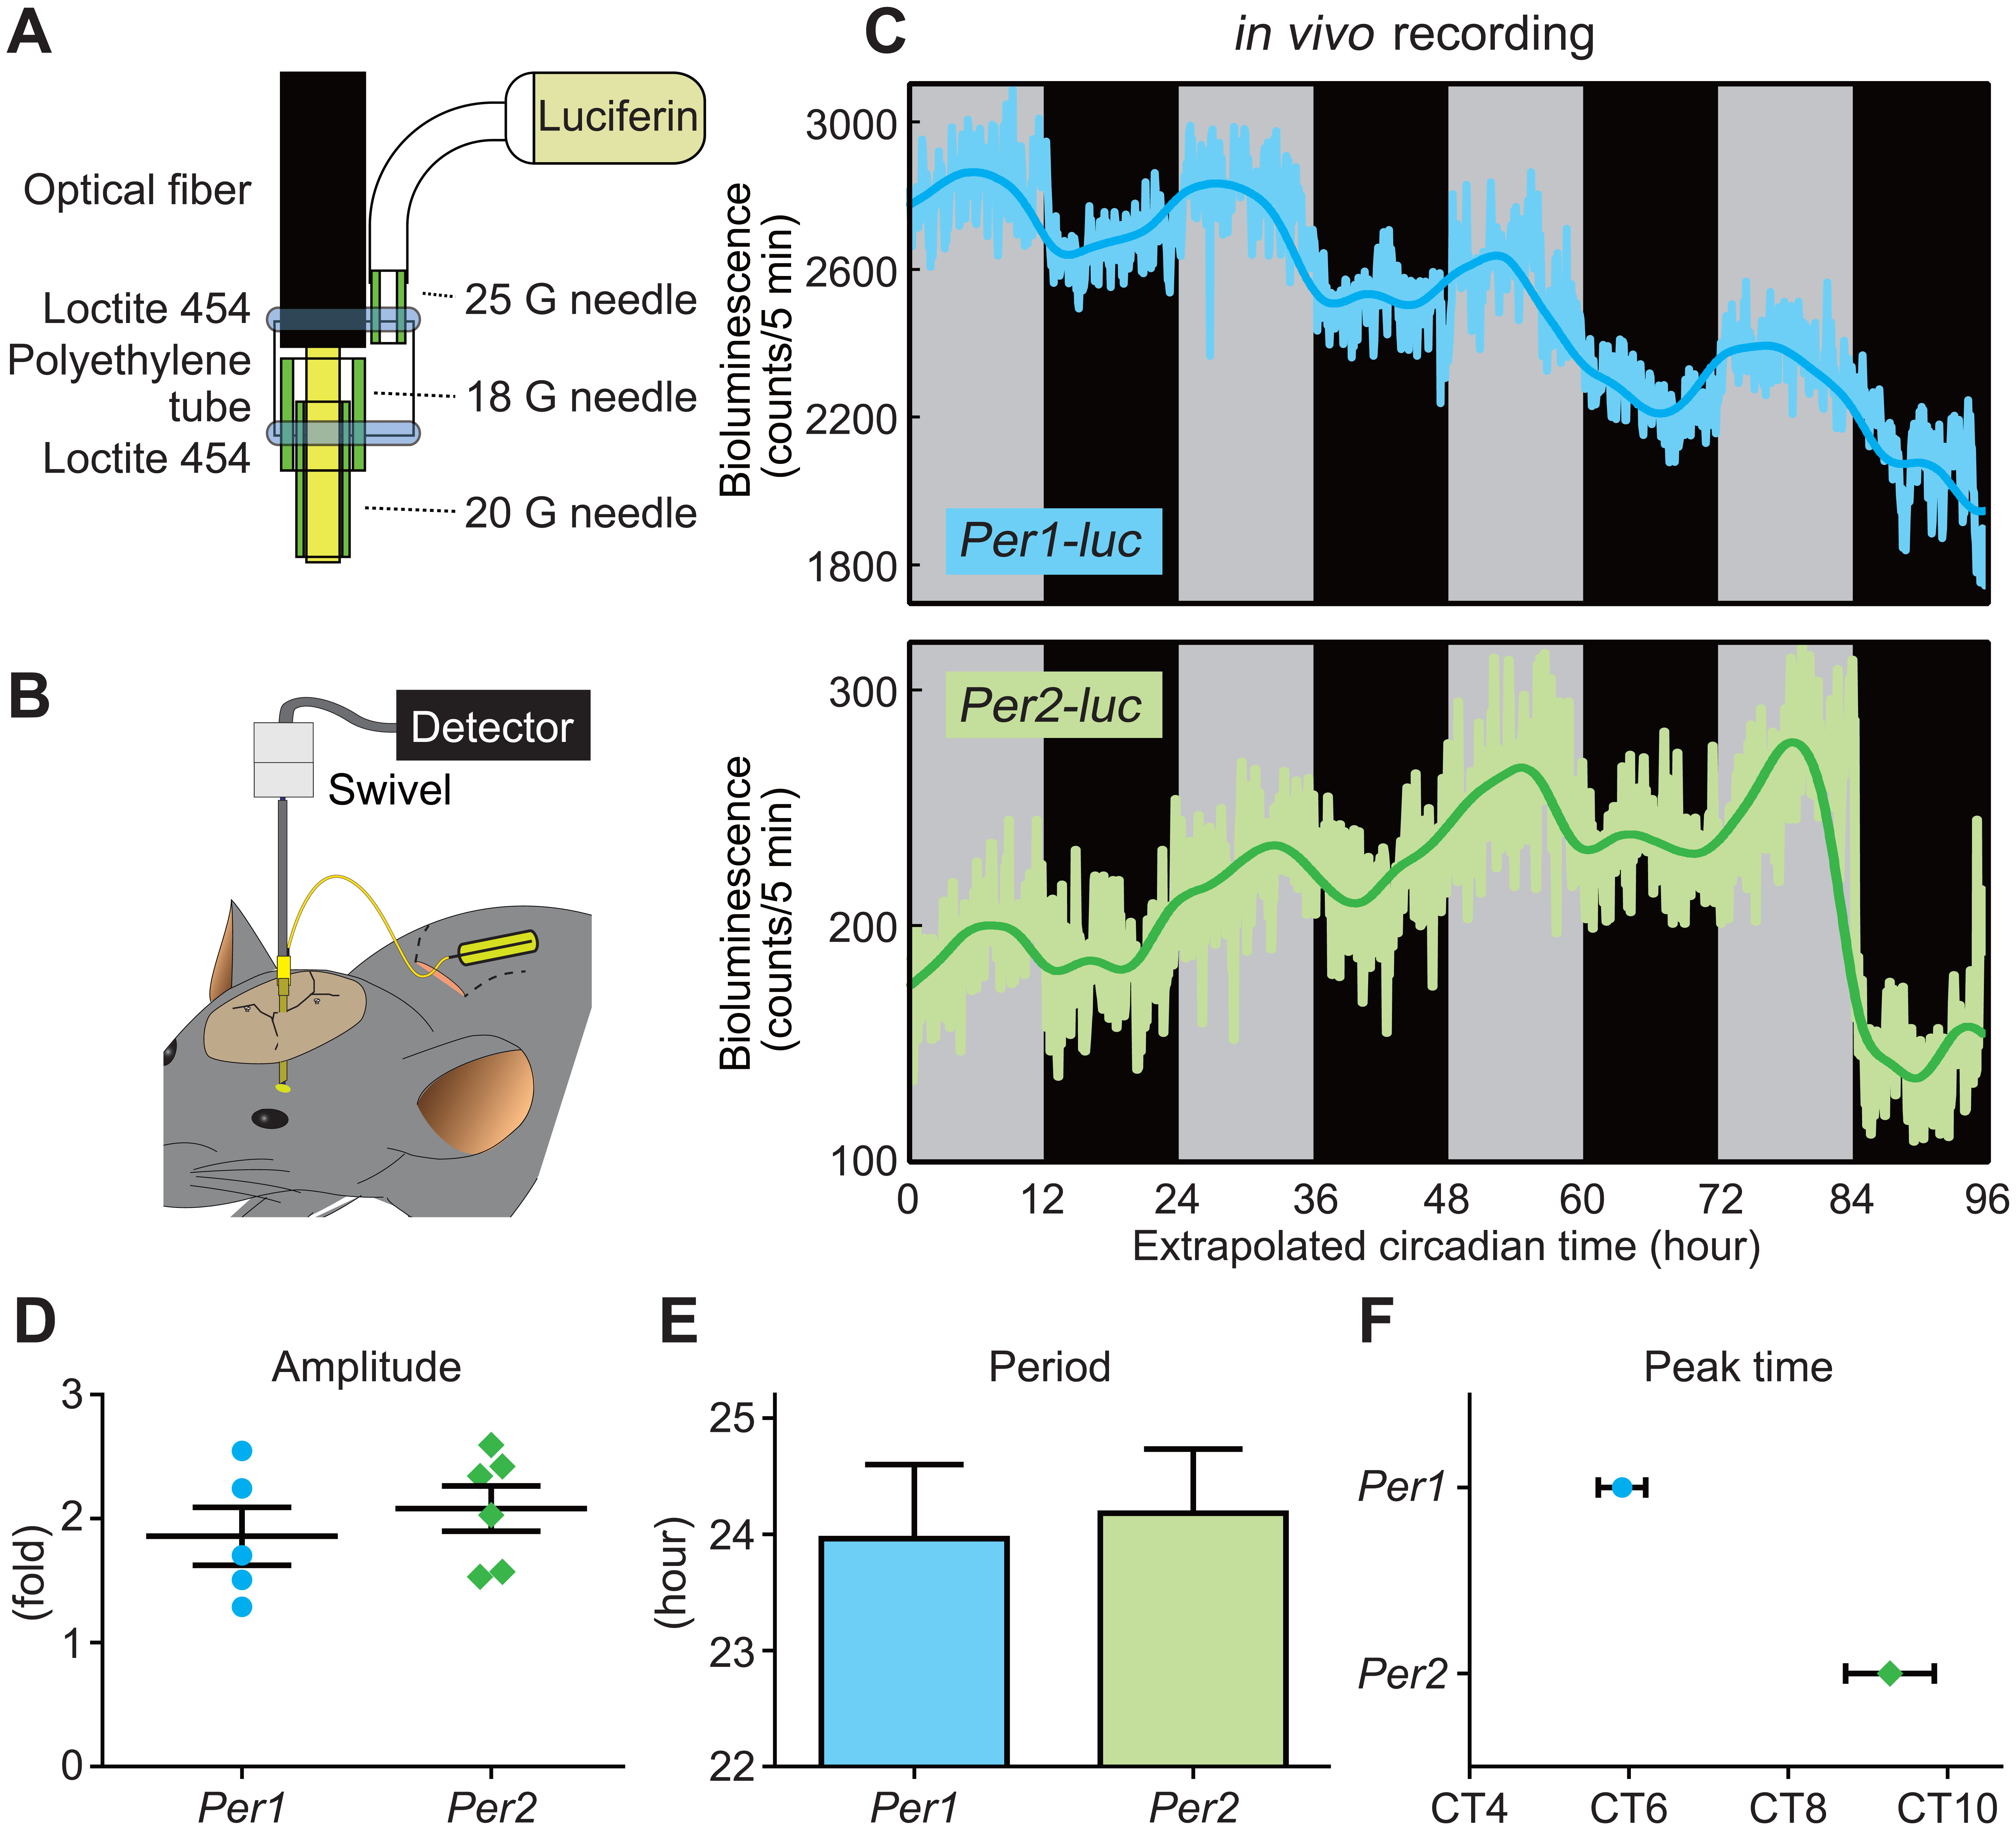
In vivo recording from SCN reveals peak time phase difference between Per1 and Per2 oscillation. (A) Illustration of the connected part of an optical fiber and a guide cannula. The guide cannula was made by connecting 18-G and 20-G needles with aron alpha. An optical fiber protruded from the tip of the guide cannula (approximately 0.5 mm) and was fixed to the guide cannula as well as to a 25-G needle connected to an Alzet minipump 2ML4 by polyethylene tube tightly glued with Loctite 454. (B) Overall view of in vivo recording. Alzet minipump 2ML4 for luciferin supply was placed in the interscapular pocket. The skull was drilled by a few screws. These screws were used as a scaffold to enhance the Loctite 454–mediated fixation of the guide cannula to the skull. Due to the swivel between the optical fiber and the detector, the rat could rotate freely. (C) Representative examples of circadian oscillations of luminescence in the SCN of Per1-luc and Per2-luc transgenic rats detected under constant dark condition. Light-colored lines represent the luminescence counts collected over 5 min, and dark-colored lines indicate the moving average with 4-h window size applied 3 times to the original data. Gray and black backgrounds indicate the subjective day and night, respectively. As the free-running circadian period of these animals is close to 24 h, circadian time was extrapolated according to the light-dark cycles before recording. (D) Amplitude of Per1-luc and Per2-luc bioluminescence rhythm. Each value is plotted as a circle and a diamond for Per1-luc and Per2-luc, respectively. Bars indicate means ± SEM (n = 5 and 6 for Per1-luc and Per2-luc, respectively). (E) Period length of Per1-luc and Per2-luc bioluminescence rhythm. Values are plotted as means ± SEM (n = 5 for both Per1-luc and Per2-luc). (F) Peak phase of Per1-luc and Per2-luc bioluminescence rhythm. Values are plotted as means ± SEM (n = 7 and 8 for Per1-luc and Per2-luc, respectively).
We placed a guide cannula just above the SCN of Per1-luc and Per2-luc transgenic rats using a stereotaxic frame and fixed the cannula in place using glue and a few screws. We then inserted a plastic optical fiber into the guide cannula (Fig. 1B). Using this advanced recording system, we continuously and longitudinally recorded light emission from the SCN of the freely moving Per1-luc and Per2-luc transgenic rats in vivo under constant darkness, confirming that the fluctuation in luminescence represented an endogenous oscillation (Fig. 1C). The luminescence showed a clear circadian fluctuation in both Per1-luc and Per2-luc rats, with a 1.5- to 2.5-fold amplitude (Fig. 1D). The circadian periods calculated from the intervals between bioluminescence peaks were 23.96 ± 0.71 and 24.18 ± 0.62 h (mean ± SEM) for Per1-luc and Per2-luc rats, respectively (Fig. 1E). These data indicate that both transgenic rat lines have a similar period of about 24 h.
In a semi-quantitative in situ hybridization study using RI-labeled cRNA probes, we previously reported that Per1 expression peaked during the middle of the day while Per2 expression peaked later under constant dark condition (Yan et al., 1999). To obtain peak Per1 and Per2 oscillation times in the rat SCN in vivo, we analyzed the oscillation patterns of bioluminescence detected in the SCN from multiple rats and found that the peak times were at CT5.91 ± 0.30 and CT9.28 ± 0.56 (means ± SEM) in Per1-luc and Per2-luc rats, respectively (Fig. 1F, where extrapolated CT0 is subjective dawn and CT12 is subjective dusk). This acrophase difference in Per1 and Per2 promoter activity was confirmed by conventional quantitative PCR (qPCR) in SCN samples collected at several time points using a laser microdissection technique (Fig. 2A). As shown in Figure 2B, Per1 expression was highest at CT6 while Per2 expression increased later at CT9 in the SCN of Per2-luc rats; consistent results were also obtained with SCN samples from Per1-luc rats (Suppl. Fig. S1). Thus, the temporal profiles of bioluminescent oscillations driven by the Per1 and Per2 promoters faithfully indicate the expression profiles of endogenous Per1 and Per2 mRNA in the rat SCN. The mechanism that underlies the phase difference between Per1 and Per2 is still unclear, but the highly effective cAMP response element activity in the Per1 promoter has been hypothesized to phase-advance the expression of Per1 compared with that of Per2 (Travnickova-Bendova et al., 2002; Brancaccio et al., 2013).
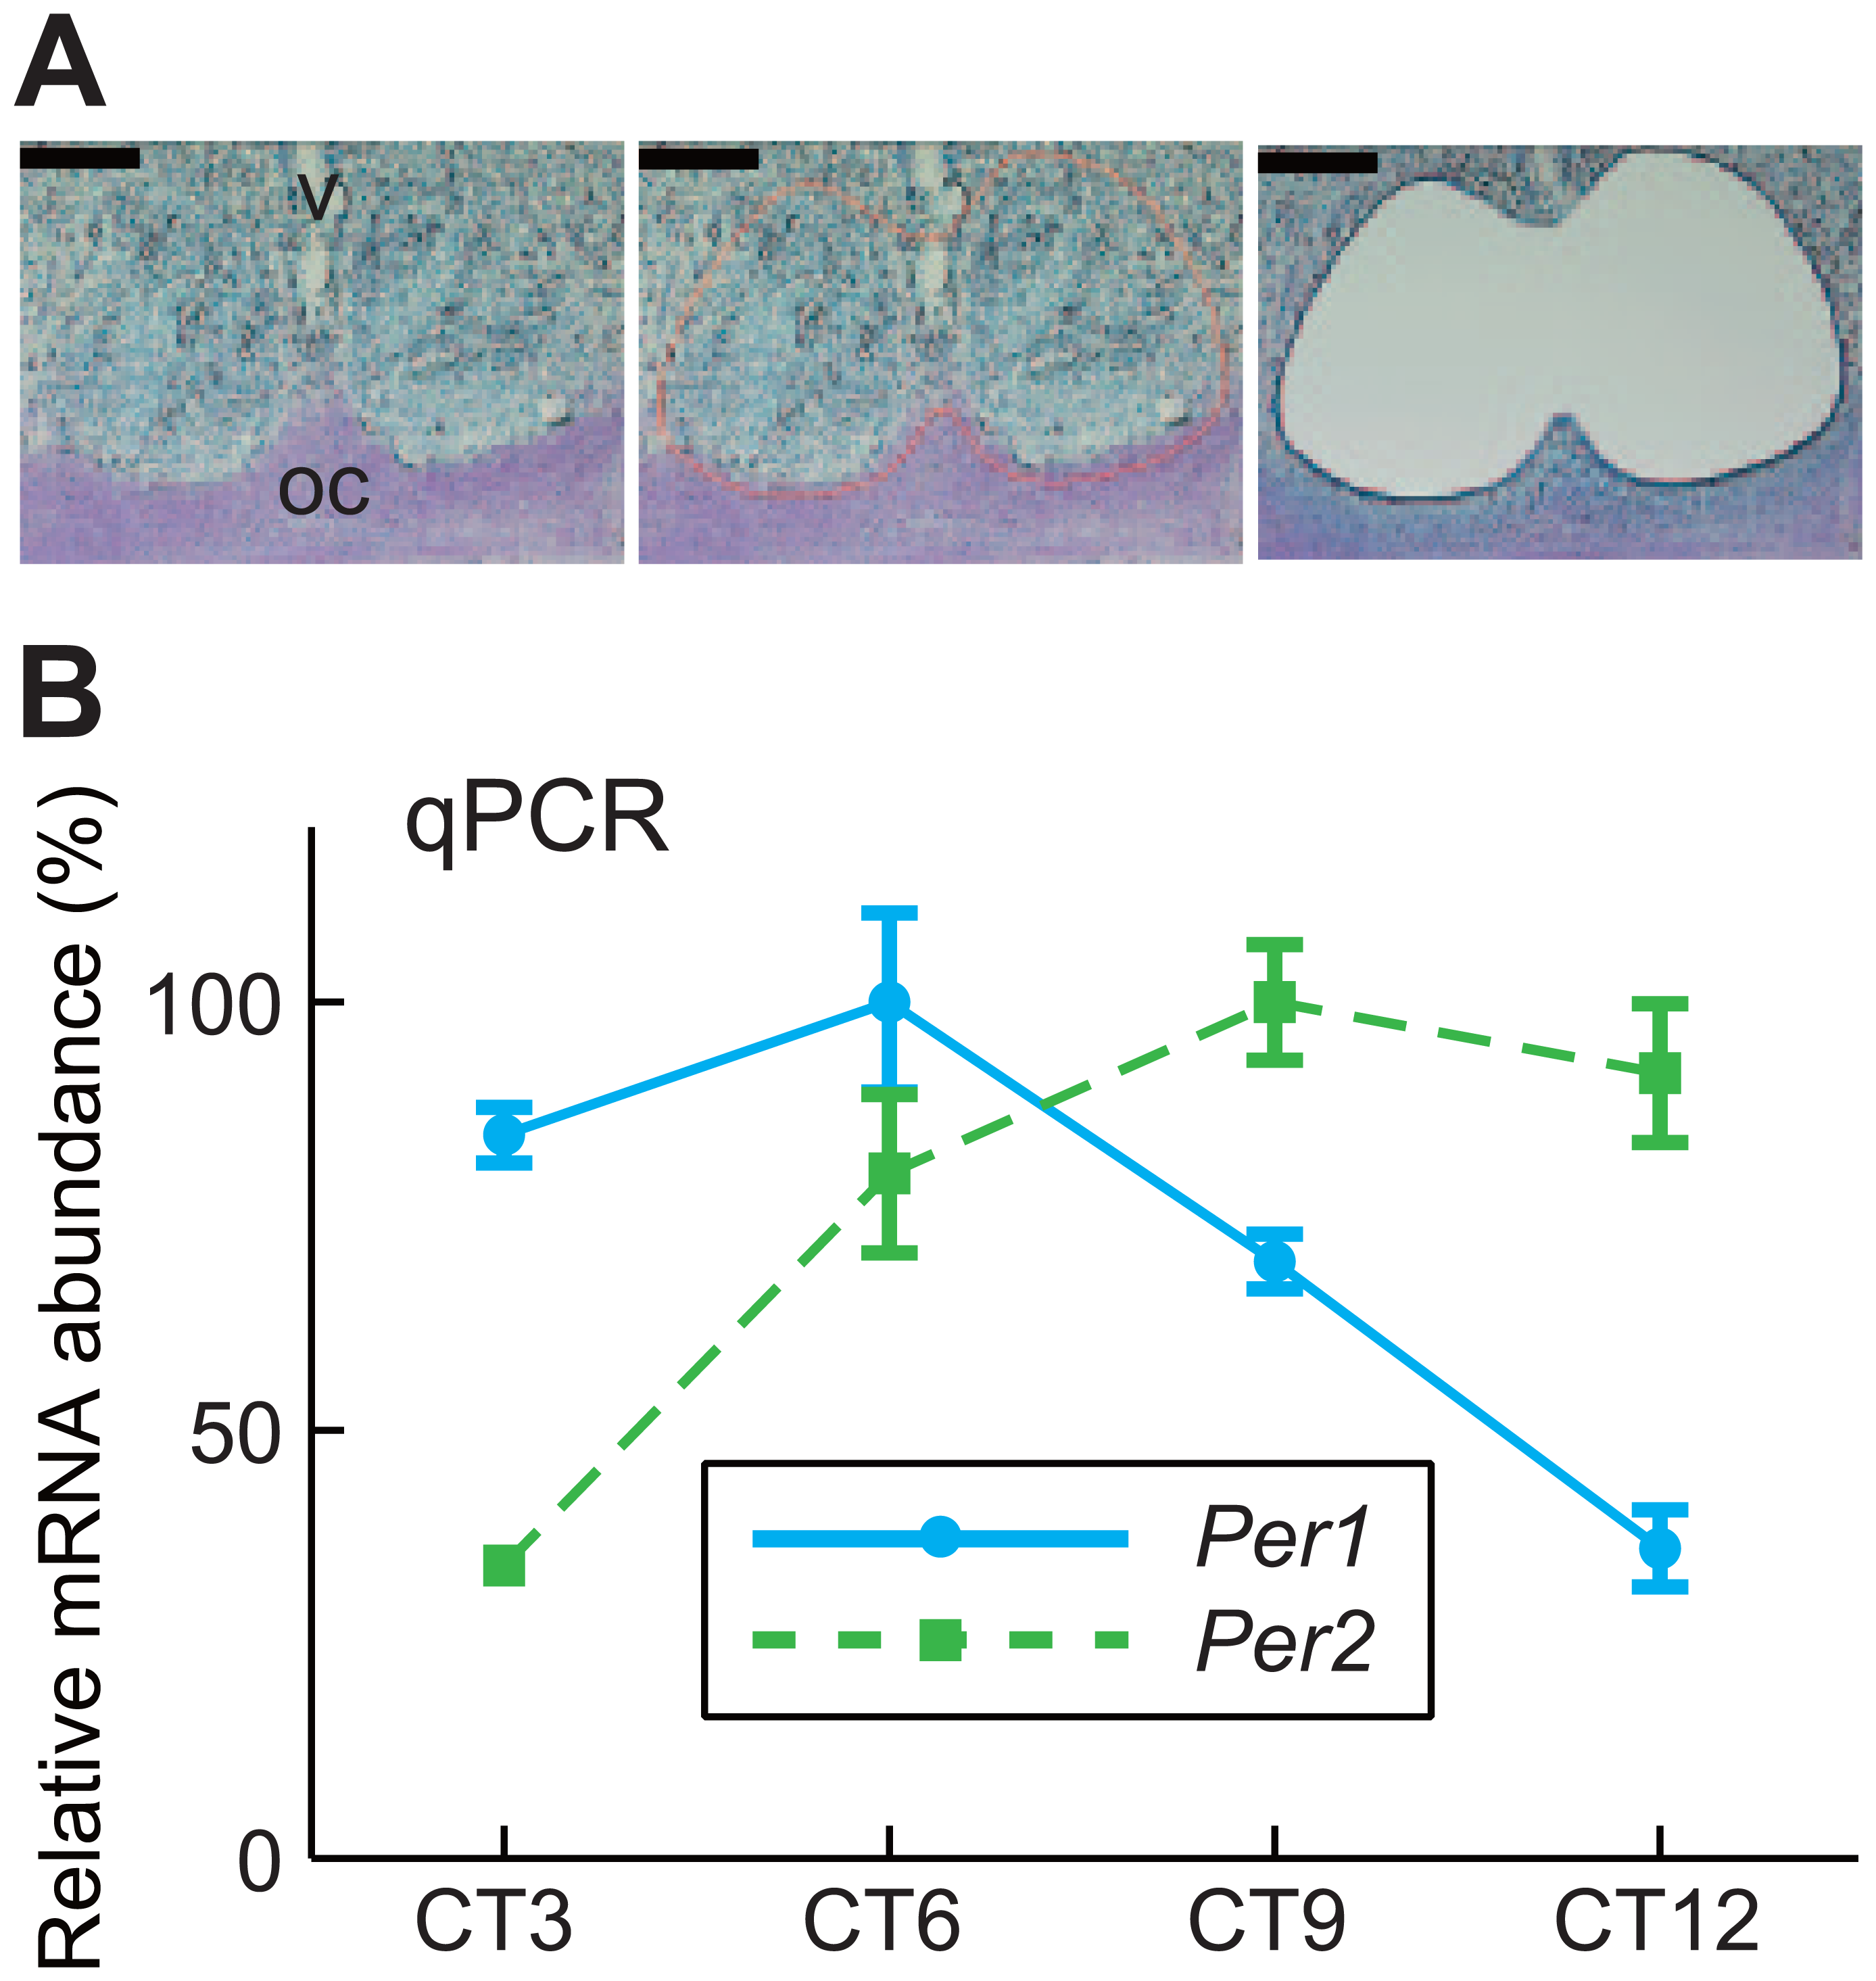
qPCR-based measurement of Per1 and Per2 expression in Per2-luc rat SCN. (A) The micrographs show a representative tissue section stained with toluidine blue before and after laser microdissection. Note the dense accumulation of stained cells in the SCN. The line delineates the laser-track. V, third ventricle; OC, optic chiasm. Bar, 200 µm. (B) Per1 (solid line) and Per2 (dotted line) expression in the SCN of Per2-luc rats under constant dark condition was measured by qPCR. Values are plotted as means ± SEM (n = 3-4 per time point) with the peak value adjusted to 100.
In this study, we successfully performed in vivo real-time recording of circadian bioluminescent oscillations in the SCN of 2 independent transgenic lines of freely moving rats, in which luciferase was expressed under the regulation of the Per1 promoter in one and the Per2 promoter in the other, demonstrating the peak time phase difference of these 2 genes in living animals. This real-time measurement of luminescence emitted from reporter transgenes using an optical fiber and a photon-counting device has potential applications. These include correlating dynamic gene expression profiles in the SCN with behavioral changes, such as light pulse-induced phase shifts of locomotor activities, at a fine time-scale. Recently, circadian gene expression in freely moving mice was monitored in the liver as well as the SCN (Saini et al., 2013; Ono et al., 2015). Thus, real-time in vivo optical imaging of gene expression, in combination with pharmacological or optogenetic approaches, should advance our understanding of the mammalian circadian system generated in the brain and organized at the system level.
Footnotes
Acknowledgements
This research was supported by Core Research for Evolutional Science and Technology (CREST), Japan Science and Technology Agency (to H.O.); scientific grants from the Ministry of Education, Culture, Sports, Science and Technology of Japan (15H01843, 24240058, and 18002016 [to H.O.], and Innovative Areas [Brain Environment, 26111710] and 15K12776 [to Y.Y.]); and grants from Kobayashi International Scholarship Foundation and SRF (to H.O.), Mochida Memorial Foundation for Medical and Pharmaceutical Research, the Ichiro Kanehara Foundation, and Takeda Science Foundation (to Y.Y.).
Notes
References
Supplementary Material
Please find the following supplemental material available below.
For Open Access articles published under a Creative Commons License, all supplemental material carries the same license as the article it is associated with.
For non-Open Access articles published, all supplemental material carries a non-exclusive license, and permission requests for re-use of supplemental material or any part of supplemental material shall be sent directly to the copyright owner as specified in the copyright notice associated with the article.