
Abstract
The retina drives various non-image-forming photoresponses, including circadian photoentrainment and pupil constriction. Previous investigators showed that in humans, photic suppression of the clock-controlled hormone melatonin is most sensitive to 460-nm blue light, with a threshold of ~12 log photons cm–2 s–1. This threshold is surprising because non-image-forming vision is mediated by intrinsically photosensitive retinal ganglion cells, which receive rod-driven synaptic input and can respond to light levels as low as ~7 log photons cm–2 s–1. Using a protocol that enhances data precision, we have found the threshold for human melatonin suppression to be ~10 log photons cm–2 s–1 at 460 nm. This finding has far-reaching implications since there is mounting evidence that nocturnal activation of the circadian system can be harmful.
The visual system mediates not only pattern vision but also non-image-forming photoresponses, including pupillary reflexes, entrainment of circadian rhythms to the light/dark cycle, and modulation of hormone secretion. Because excessive nighttime photic stimulation of this system is harmful (Bedrosian and Nelson, 2013; Amaral et al., 2014), it is important to ascertain the intensity threshold of human non-image-forming vision. To this end, researchers have assessed the photosensitivity of the circadian pathway in which retinal neurons signal through the suprachiasmatic nucleus (SCN) to the pineal gland, which secretes melatonin during subjective night. Melatonin secretion can be suppressed acutely by light, and earlier work found such suppression to be most sensitive to 460-nm light, with a threshold of ~12 log photons cm–2 s–1 (Brainard et al., 2001; Thapan et al., 2001). This threshold is surprisingly high because retinal input to the SCN is now known to be mediated by intrinsically photosensitive retinal ganglion cells (ipRGCs), which receive excitatory input from rod photoreceptors and can respond robustly to intensities as low as ~7 log photons cm–2 s–1 (Dacey et al., 2005). Mouse behavioral studies have likewise demonstrated a rod contribution to circadian photoentrainment (Altimus et al., 2010; Lall et al., 2010; Butler and Silver, 2011; Morin and Studholme, 2011). These new findings prompted us to reexamine the threshold for human melatonin suppression.
All procedures were approved by the Institutional Review Board at the University of Michigan and complied with the Declaration of Helsinki. Six authors of this article (4 Caucasians and 2 Asians, aged 19-37 years) served as subjects. All had normal color vision according to the Ishihara test. Each person served as a subject for 2 to 13 months, during which he or she adhered to the sleep/wake schedule in the 7-day protocol (Fig. 1A); proper photoentrainment was confirmed daily by actigraphy (Jawbone UP and UP24 activity trackers; Jawbone, San Francisco, CA). Throughout the protocol, each subject engaged in his or her normal daytime activities from 7:30 AM to 11 PM and slept from 11 PM to 7:30 AM, except on days 5 (the “control” session) and 7 (the “photostimulation” session), when he or she was in a completely dark room from 9 to 11 PM—the pair of sessions constituted a “trial.” In these sessions, the subject sat upright before a Ganzfeld dome, with the head stabilized by a chin rest and a forehead band, and used salivettes (SciMart, St. Louis, MO) to collect his or her own saliva every 20 min (Fig. 1A, asterisks). On the control night, the Ganzfeld dome remained dark, but on the photostimulation night, a 460-nm LED light with a half-peak width of ~25 nm (PAR20-B36; Super Bright LEDs, St. Louis, MO) was presented from 10 to 11 PM through a ceiling aperture of the Ganzfeld dome, with intensity adjusted using neutral density filters and calibrated using an S370 radiometer (Gamma Scientific, San Diego, CA). Each saliva sample was stored immediately at 4 °C for 12 to 16 h and subsequently at −70 °C for up to 2 months, before it was subjected to a melatonin radioimmunoassay (Bühlmann Laboratories, Schönenbuch, Switzerland). Each subject generated all 12 samples in every trial. To reduce inter- and intra-assay variability, all samples from each trial were analyzed in triplicate using the same assay kit. Throughout the 7-day protocol, all subjects avoided caffeine, alcohol, bananas, beverages containing artificial colorants, over-the-counter medications, melatonin supplements, and strenuous exercise.
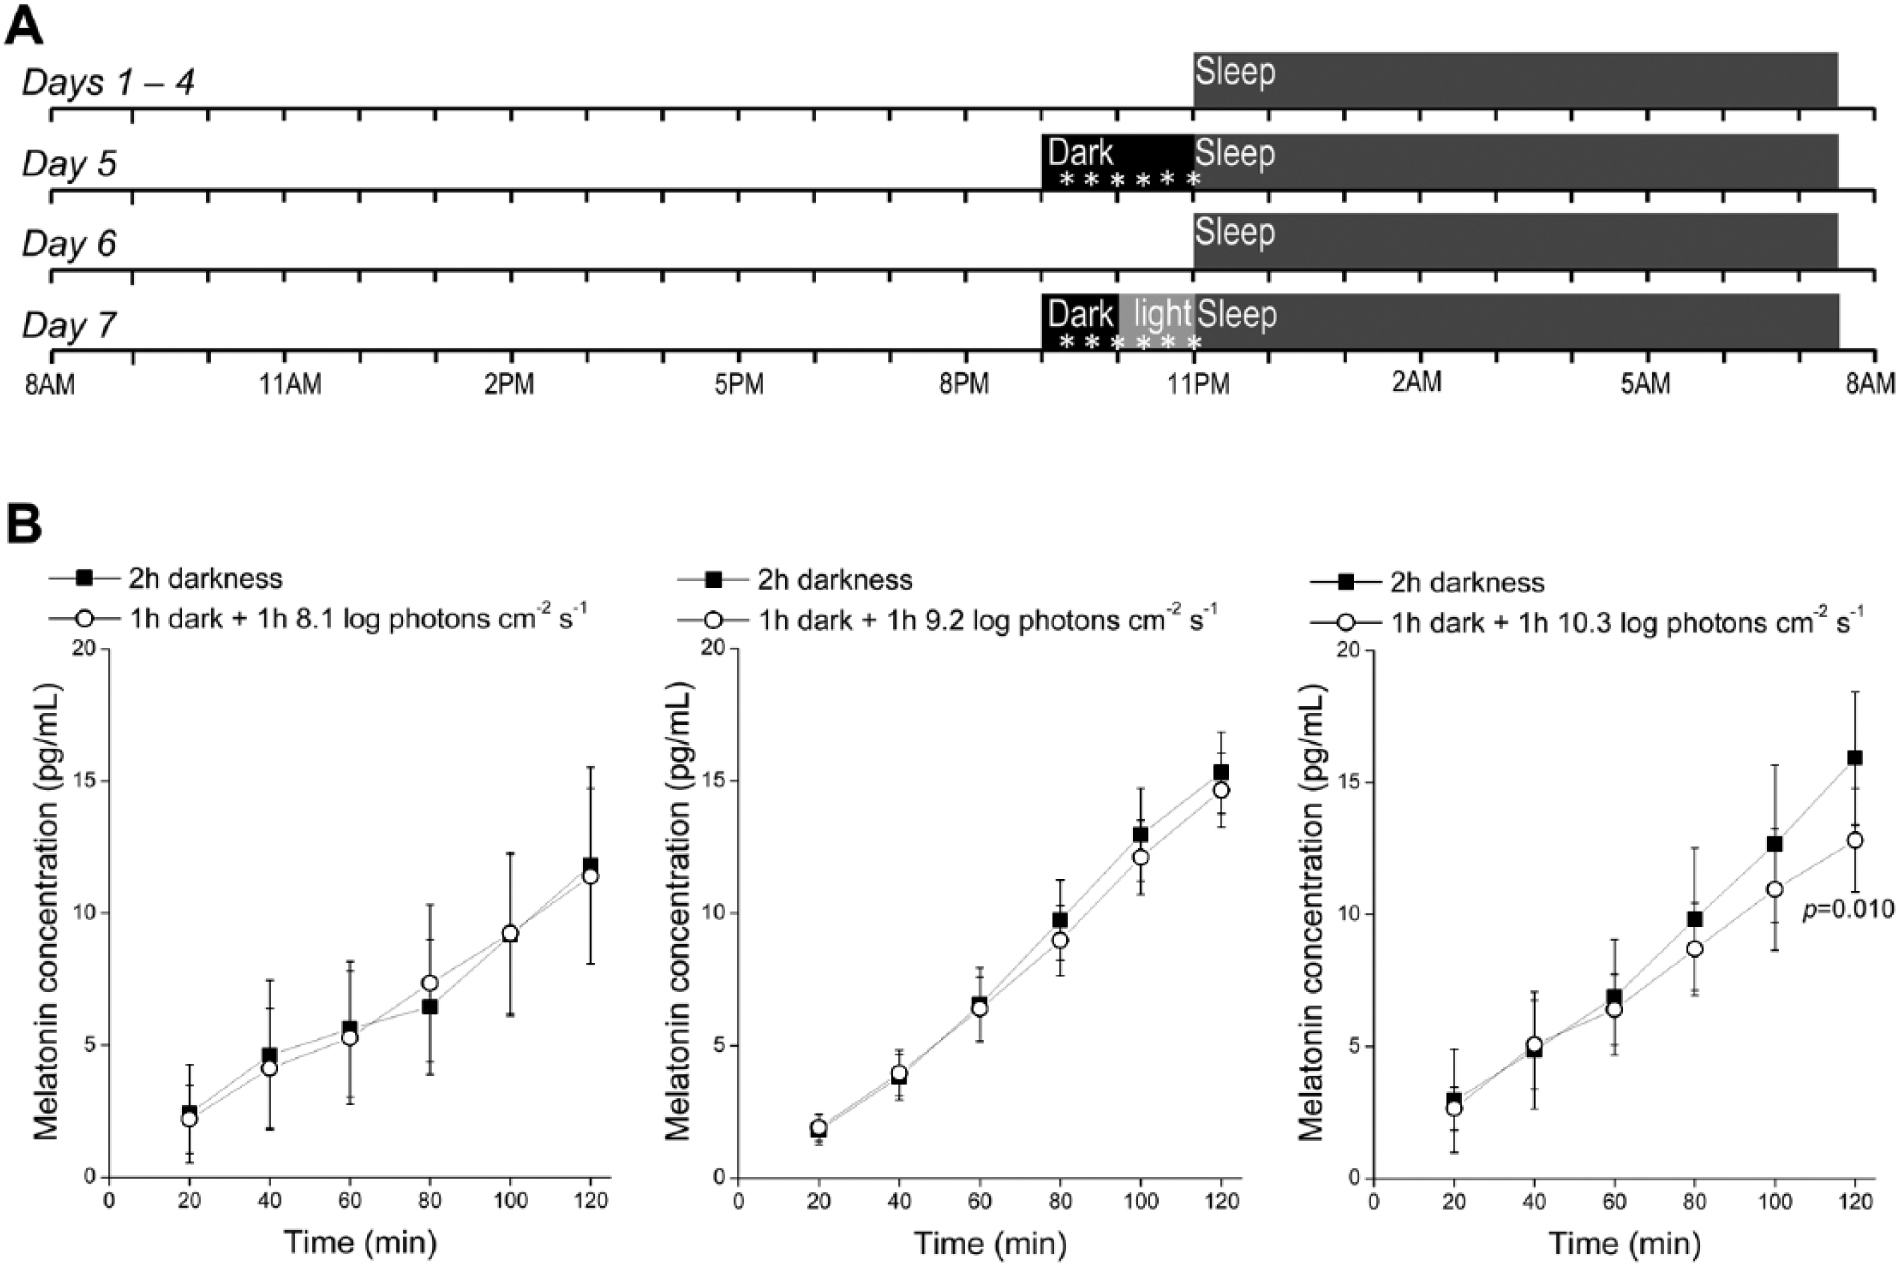
Measuring the threshold for photic suppression of melatonin. (A) The experimental protocol. Days 5 and 7 are the “control” and “photostimulation” sessions, respectively, and together they constitute 1 “trial.” The asterisks represent saliva collection. (B) In each plot, the black and white curves show data averaged from all control and photostimulation sessions, respectively. Each white curve’s last 3 data points were collected during light exposure. Left: Stimulus intensity was 8.1 log photons cm–2 s–1; n = 3 subjects, who contributed 1, 3, and 6 trials. Middle: 9.2 log photons cm–2 s–1 intensity; n = 5 subjects, who contributed 2, 2, 2, 3, and 5 trials. Right: 10.3 photons cm–2 s–1 intensity; n = 6 subjects, who contributed 1, 1, 1, 1, 3, and 4 trials. The p value was calculated using the randomization test. Error bars represent SEM.
Three stimulus intensities were examined. Each intensity was tested on 3 to 6 subjects, with each subject contributing 1 to 6 trials per intensity (see Fig. 1 legend). The data were initially analyzed using the Wilcoxon signed-rank test, a widely used nonparametric, paired-difference test. For the lowest light intensity, 8.1 log photons cm–2 s–1, the data from the control and photostimulation sessions were statistically indistinguishable at all time points (Fig. 1B, left), indicating it was too low to suppress melatonin. At 9.2 log photons cm–2 s–1, an apparent suppression was seen as all 3 data points during light treatment fell below control values (Fig. 1B, center), although these data were not significantly different between the 2 nights. The 2 nights’ data deviated further when stimulus intensity increased to 10.3 log photons cm–2 s–1, with a significant difference at the fifth time point (p = 0.034) and the final time point (p = 0.003) (Fig. 1B, right). However, the Wilcoxon signed-rank test assumes single testing of each subject, whereas our subjects often contributed multiple trials per stimulus. Thus, we reanalyzed the 10.3 log photons cm–2 s–1 data using the randomization test (Ernst, 2004), a nonparametric test compatible with our repeated-measures design (supplemental material). The control versus photostimulation difference became insignificant at the fifth time point (p = 0.143) but remained significant for the sixth time point (p = 0.010).
In conclusion, we detected significant melatonin suppression at a light intensity about 2 log units lower than previously reported thresholds (Brainard et al., 2001; Thapan et al., 2001). This difference is likely due to the higher precision of our data: all our measurements were made during the first 2 h of subjective night when melatonin level rises nearly monotonically, whereas the earlier studies were done at later time points when it fluctuates substantially. The number of subjects (6) we tested at 10.3 log photons cm–2 s–1 may seem small but is comparable to the subject numbers (5-8) that the earlier studies employed for each stimulus. There are, however, 2 plausible caveats. First, our data cannot be compared directly with the earlier studies since our photostimulation was done at early night but theirs around midnight, and the sensitivity of melatonin suppression is phase dependent (McIntyre et al., 1989). Specifically, McIntyre et al. (1989) found a higher photosensitivity at midnight than at early night, suggesting that the 2-log-unit threshold difference between our study and the earlier ones could be an underestimate. Second, our control session always preceded the photostimulation session, whereas some laboratories prefer to randomize the order of testing. We reasoned that, had the photostimulation been performed first, the light exposure could induce a circadian phase shift that would interfere with the control session conducted 2 days later. Indeed, for all 3 stimulus intensities, the control and photostimulation data were nearly identical at the first 3 time points, confirming that our protocol avoided phase shifts.
Although lower than previously published values, our threshold for melatonin suppression is still at least 3 log units above the threshold for primate ipRGCs’ rod-driven photoresponses (Dacey et al., 2005). While this fits the hypothesis that the human circadian system receives no excitatory rod input (Rea et al., 2005), it does not rule out such input. For example, our threshold could have been lower had the subjects’ pupils been dilated by mydiatrics (Gaddy et al., 1993). Furthermore, the threshold for light pulse–induced melatonin suppression appears higher than that for circadian entrainment to light-dark cycles (Zeitzer et al., 2000; Butler and Silver, 2011), suggesting that stimulus durations longer than ours could conceivably suppress melatonin at lower intensities.
Nevertheless, rods could indeed have little impact on the human circadian system. For example, nonlinearities downstream of ipRGCs could dictate the threshold for melanopsin suppression, in effect blocking low-amplitude rod-driven signals. Furthermore, retinal input to the primate SCN could be mediated by previously uncharacterized ipRGCs that receive weak rod input. Two types of primate ipRGCs have been recorded, and both exhibited robust rod-driven light responses (Dacey et al., 2005), but 5 ipRGC types have since been discovered in rodents, of which only the M1 type innervates the SCN (Ecker et al., 2010). We learned recently that while mouse M1 cells display rod-driven photoresponses as robust as those of primate ipRGCs (Zhao et al., 2014), rat M1 cells’ rod/cone-mediated responses are far weaker (Reifler et al., 2015). The SCN-projecting ipRGCs in primates could resemble those in rats.
Footnotes
Acknowledgements
We thank Josh Errickson and Prof. Kerby Shedden at the University of Michigan Center for Statistical Consultation & Research for help with statistics and Teera Parr for performing the radioimmunoassay. This work was funded by Research to Prevent Blindness (Career Development Award), the NIH National Eye Institute (P30 EY007003), and the Academy of Finland (253314).
Conflict of Interest Statement
The author(s) have no potential conflicts of interest with respect to the research, authorship, and/or publication of this article.
References
Supplementary Material
Please find the following supplemental material available below.
For Open Access articles published under a Creative Commons License, all supplemental material carries the same license as the article it is associated with.
For non-Open Access articles published, all supplemental material carries a non-exclusive license, and permission requests for re-use of supplemental material or any part of supplemental material shall be sent directly to the copyright owner as specified in the copyright notice associated with the article.