
Abstract
The levels of several coagulation factors, able to influence hemostatic balance, display circadian variations. We hypothesized that the onset and extent of hematoma expansion (HE) following intracerebral hemorrhage (ICH) also display diurnal patterns. We reviewed clinical, laboratory, and radiological data from 111 consecutive patients with spontaneous ICH who had baseline head computed tomography (CT) scans within 3 h of ICH onset and follow-up CT during the following 72 h. We defined any HE (AHE) as any increase in hematoma volume from baseline to follow-up CT and significant HE (SHE) as an absolute increase in hematoma volume >6 mL or relative increase >33%. We categorized the patients into 2 groups based on the timing of the initial CT scans—day group (from 0800 to 2000 h) and night group (from 2000 to 0800 h)—and performed logistic regression analyses. We also analyzed the differences in the rates of HE between the groups during six 4-h periods spanning 24 h, using χ2 tests. We found that the rates of AHE and SHE were higher in the day versus night group (75% vs. 48%; p = 0.009 for AHE and 47.6% vs. 25.9%; p = 0.047 for SHE). On multivariable logistic regression, day group assignment was independently associated with AHE (adjusted odds ratio = 3.53; p = 0.008) but not with SHE. Both AHE and SHE peaked in the early afternoon (1200-1600 h) and reached a nadir during the 2000 to 2400 h time period, and they were significantly different between the time periods (0000-0400, 0400-0800, 0800-1200, 1200-1600, 1600-2000, and 2000-2400 h); p = 0.002 and 0.029, respectively. These exploratory findings support the presence of a daily pattern in the occurrence of HE, with a higher risk during the day hours. Our results could have implications for future therapeutic efforts targeting HE in ICH and for the triage of ICH patients. They require further validation.
Previous studies have shown that the levels of several coagulation factors, such as factor VII, factor VIII, proteins C and S, antithrombin, and tissue factor pathway inhibitor activity, fluctuate in a circadian manner (Manfredini et al., 2005). Daily variations in platelet function and markers of fibrinolysis, such as tissue plasminogen activator, tissue plasminogen activator inhibitor 1, and D-dimer, have been also reported (Manfredini et al., 2005; Iversen et al., 2002). These variations in coagulation and fibrinolysis could influence the hemostatic balance and potentially affect intracerebral hemorrhage (ICH) onset and subsequent hematoma expansion (HE). Indeed, the onset of ICH exhibits similar daily variability with a tendency to peak during the morning hours (Nagakane et al., 2006; Wroe et al., 1992).
The daily patterns of HE in ICH patients, however, have not been formally examined. We hypothesized that the onset and extent of HE following ICH also display daily patterns, and we undertook the current study to evaluate the daily variability of HE in patients with spontaneous ICH. HE is a consistent predictor of neurological deterioration and mortality after ICH (Davis et al., 2006; Dowlatshahi et al., 2011). HE is seen in approximately 70% of ICH patients and is considered significant in approximately one-third of patients (Davis et al., 2006; Dowlatshahi et al., 2011; Brott et al., 1997). A better understanding of the daily variability of HE could have potential research and therapeutic implications.
Methods
Patients and Data Collection
We performed a retrospective review of a consecutive cohort of ICH patients admitted to Beth Israel Deaconess Medical Center between October 2007 and March 2014. Patients were included in this study if they met the following criteria: (1) spontaneous ICH, (2) baseline noncontrast cranial computed tomography (CT) was obtained within 3 h of ICH onset, and (3) follow-up CT was obtained within 72 h of the initial CT scan. The time of ICH onset was defined as either the time of symptom onset (if known) or the time the patient was last seen well if the exact time of symptom onset was unknown or if the patient woke up with stroke-like symptoms. If the time of symptom onset or the time last seen well was unavailable, then it was defined as an unclear ICH onset. Patients in whom the time of ICH onset or last seen well was unknown were excluded. Patients with secondary causes of ICH, including underlying aneurysm, vascular malformation or tumor, head trauma, venous infarction, or hemorrhagic transformation of ischemic infarction; patients with isolated intraventricular hemorrhage (IVH); and patients who underwent surgical intervention before follow-up CT were also excluded.
Because we were mostly interested in investigating the daily patterns of HE, patients were divided into 2 groups based on the timing of the initial (baseline) CT scans; day group (from 0800 to 2000 h) and night group (from 2000 to 0800 h). These time periods were selected based on earlier reports showing that platelet aggregation is higher and fibrinolytic activity is lower during the period from 2000 to 0800 h (Haus et al., 1990; Rosing et al., 1970). We used the timing of baseline CT scan as a fixed radiological reference, instead of ICH onset time, to categorize the groups because our main outcome measure is the radiological change in hematoma volume between baseline and follow-up scans.
We retrieved demographic, clinical, laboratory, and radiological information, including age, sex, time from ICH onset to initial CT, comorbid conditions (history of diabetes mellitus, hypertension, atrial fibrillation, hyperlipidemia, dementia, and prior ICH, ischemic stroke, or transient ischemic attacks), medications used at the time of ICH onset (in particular, statins, antiplatelets, and anticoagulants), smoking history, Glasgow coma scale (GCS) score, and blood pressure (BP) on initial evaluation, and laboratory results (serum glucose, creatinine, platelet count, international normalized ratio [INR], and activated partial thromboplastin time [aPTT]). The study was approved by the Institutional Review Board of Beth Israel Deaconess Medical Center.
Radiological Assessments
Hematoma volumes on CT scans were measured by MIPAV (Medical Image Processing, Analysis, and Visualization) software (CIT; National Institutes of Health, Bethesda, MD) (Hussein et al., 2013). Regions of interest (ROIs) were manually drawn by tracing the perimeters of the hematoma in each slice, throughout the hemorrhagic lesion. The traced ROIs in every slice were then summed after adjusting for slice thickness to yield a hematoma volume. Two investigators independently assessed 20 randomly selected scans. The intraclass correlation coefficients for intra- and interrater agreements for ICH volumetric measurements were 0.99 and 0.99, respectively. Therefore, only 1 operator analyzed the remaining CT images.
Any hematoma expansion (AHE) was defined as any increase in hematoma volume from baseline to follow-up CT. Significant hematoma expansion (SHE) was defined as an absolute increase in ICH volume >6 mL or a relative increase greater than 33% from baseline to follow-up CT scans (Brott et al., 1997; Demchuk et al., 2012).
Statistical Analysis
Categorical variables were summarized as counts (percentage) and continuous variables as means (standard deviations [SDs]) or medians (interquartile ranges [IQRs]), if not distributed normally. Statistical comparisons between 2 groups were performed using the Student t test or Wilcoxon rank sum test for continuous variables, as well as the χ2 and Fisher’s exact tests for categorical variables, as appropriate. All variables with a p value <0.10 on univariate analysis and the biological/pathophysiological variables that have been reported to be associated with hematoma expansion (systolic and diastolic BP, INR, aPTT, time from onset to imaging, baseline hematoma volume, warfarin use, antiplatelet drug use, and history of dementia) were entered into multivariable forward logistic regression analyses. We also analyzed the differences in the rates of HE between the groups during the following 4-h time periods (0000-0400, 0400-0800, 0800-1200, 1200-1600, 1600-2000, and 2000-2400 h), using χ2 tests. A 2-tailed probability value <0.05 was considered significant. Data analysis was performed using SPSS version 18.0 (SPSS, Inc., an IBM Company, Chicago, IL).
Results
Patient Characteristics and Circadian Variability of Hematoma Expansion
A total of 480 patients with a diagnosis of primary ICH were screened for inclusion eligibility. We excluded 300 patients because they did not have their baseline CT within 3 h of ICH onset (n = 255) or follow-up CT within the following 72 h (n = 45), 63 patients due to unavailable symptom onset or last seen well times, and 6 patients because of surgical intervention before follow-up CT. Therefore, 111 patients were eligible for this study. Included and excluded patients had comparable baseline characteristics, except that included patients had lower GCS scores and higher INR levels than did excluded patients. Fifty-one (13.8%) of the excluded patients had their baseline head CT scan within 3 h of ICH onset. There were no significant differences in median systolic blood pressure (SBP) and diastolic blood pressure (DBP) values between the 2 groups.
Of the 111 patients enrolled, 84 patients (75.7%) were in the day and 27 (24.3%) in the night groups. The baseline characteristics of the day and night groups were comparable (Table 1). We included 26 patients with warfarin-associated ICH. All of these patients received reversal therapies to correct warfarin-related coagulopathy as a routine practice at our institution. The median change in hematoma volume between initial and follow-up scans was 3.2 mL (IQR, −0.01 to 15.7) in the day group and −0.03 mL (IQR, −2.6 to 5.4) in the night group (p = 0.037). Figure 1 shows scatterplots of hematoma volume change for all patients and by group assignment. AHE occurred in 63 patients (75%) in day group and 13 patients (48%) in night group (p = 0.009), whereas SHE occurred in 40 (47.6%) and 7 (25.9%) of patients in the day and night groups, respectively (p = 0.047). The in-hospital mortality was 28.9% versus 11.4% (p = 0.043) for patients with AHE and 38.3% versus 12.5%, (p = 0.002) for those with SHE.
Comparison of Demographic, Clinical, Laboratory, and Radiological Characteristics of Patients in the Day (0800-2000 h) and night (2000-0800 h) groups.
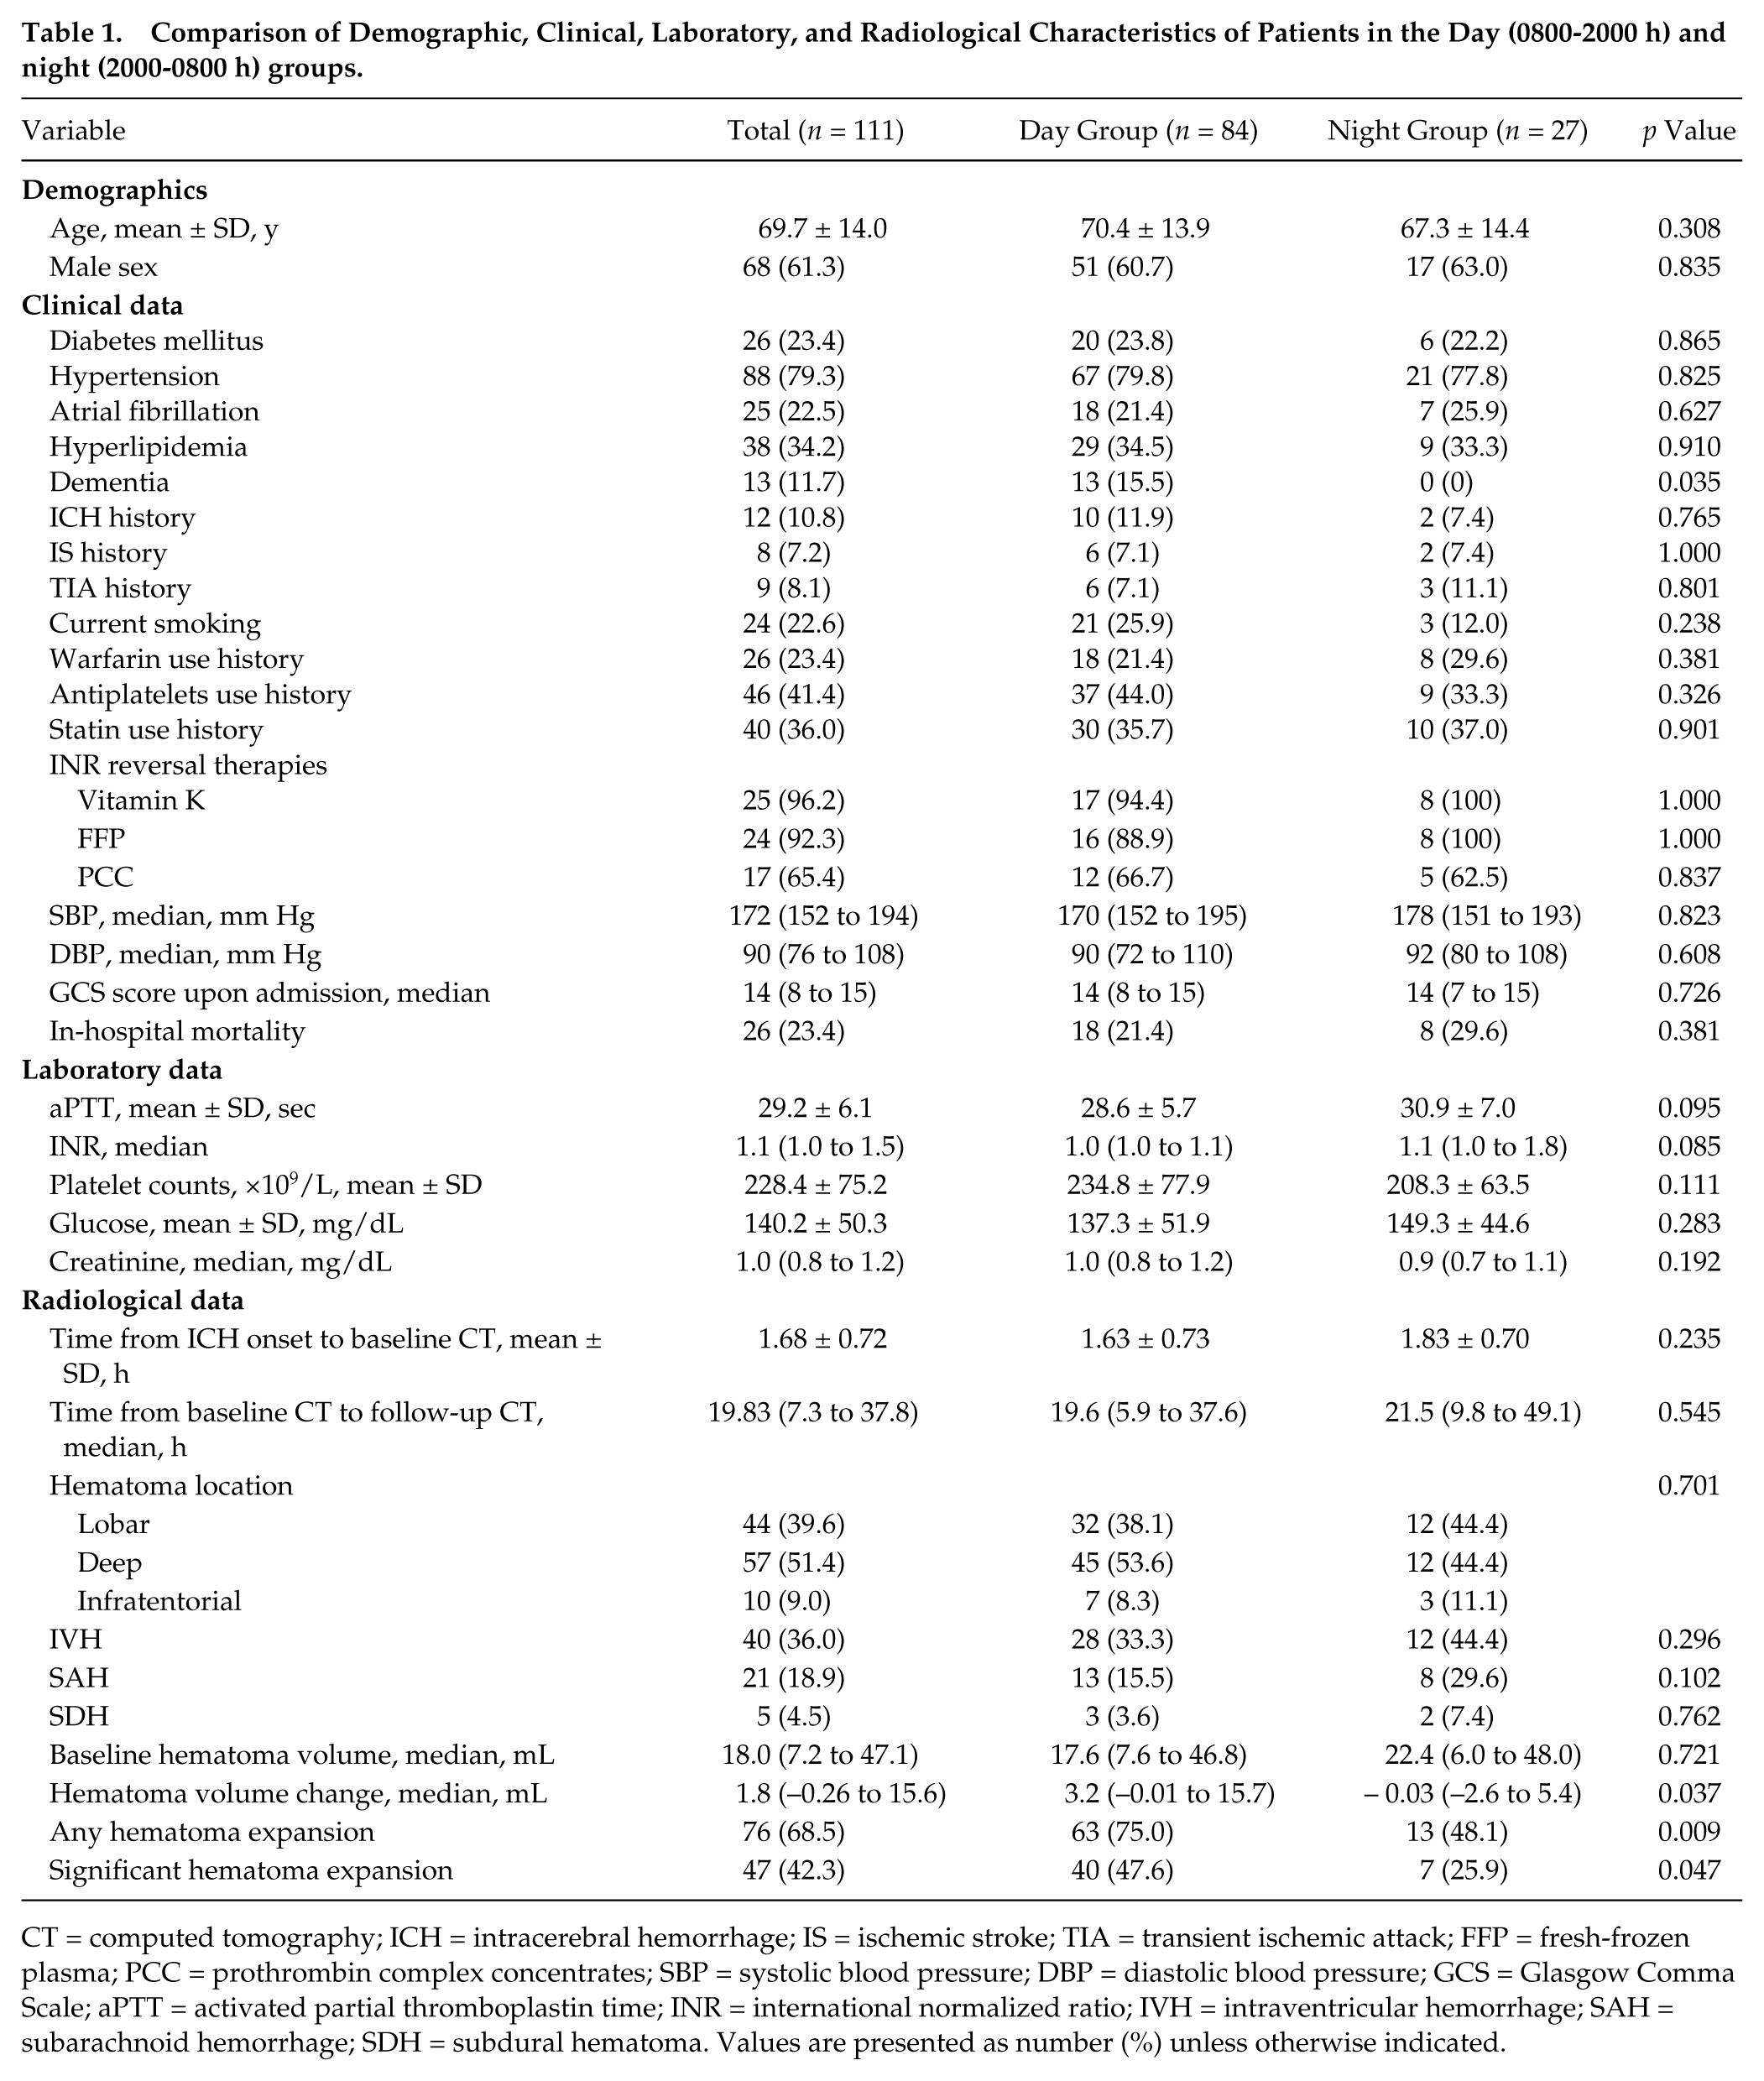
CT = computed tomography; ICH = intracerebral hemorrhage; IS = ischemic stroke; TIA = transient ischemic attack; FFP = fresh-frozen plasma; PCC = prothrombin complex concentrates; SBP = systolic blood pressure; DBP = diastolic blood pressure; GCS = Glasgow Comma Scale; aPTT = activated partial thromboplastin time; INR = international normalized ratio; IVH = intraventricular hemorrhage; SAH = subarachnoid hemorrhage; SDH = subdural hematoma. Values are presented as number (%) unless otherwise indicated.
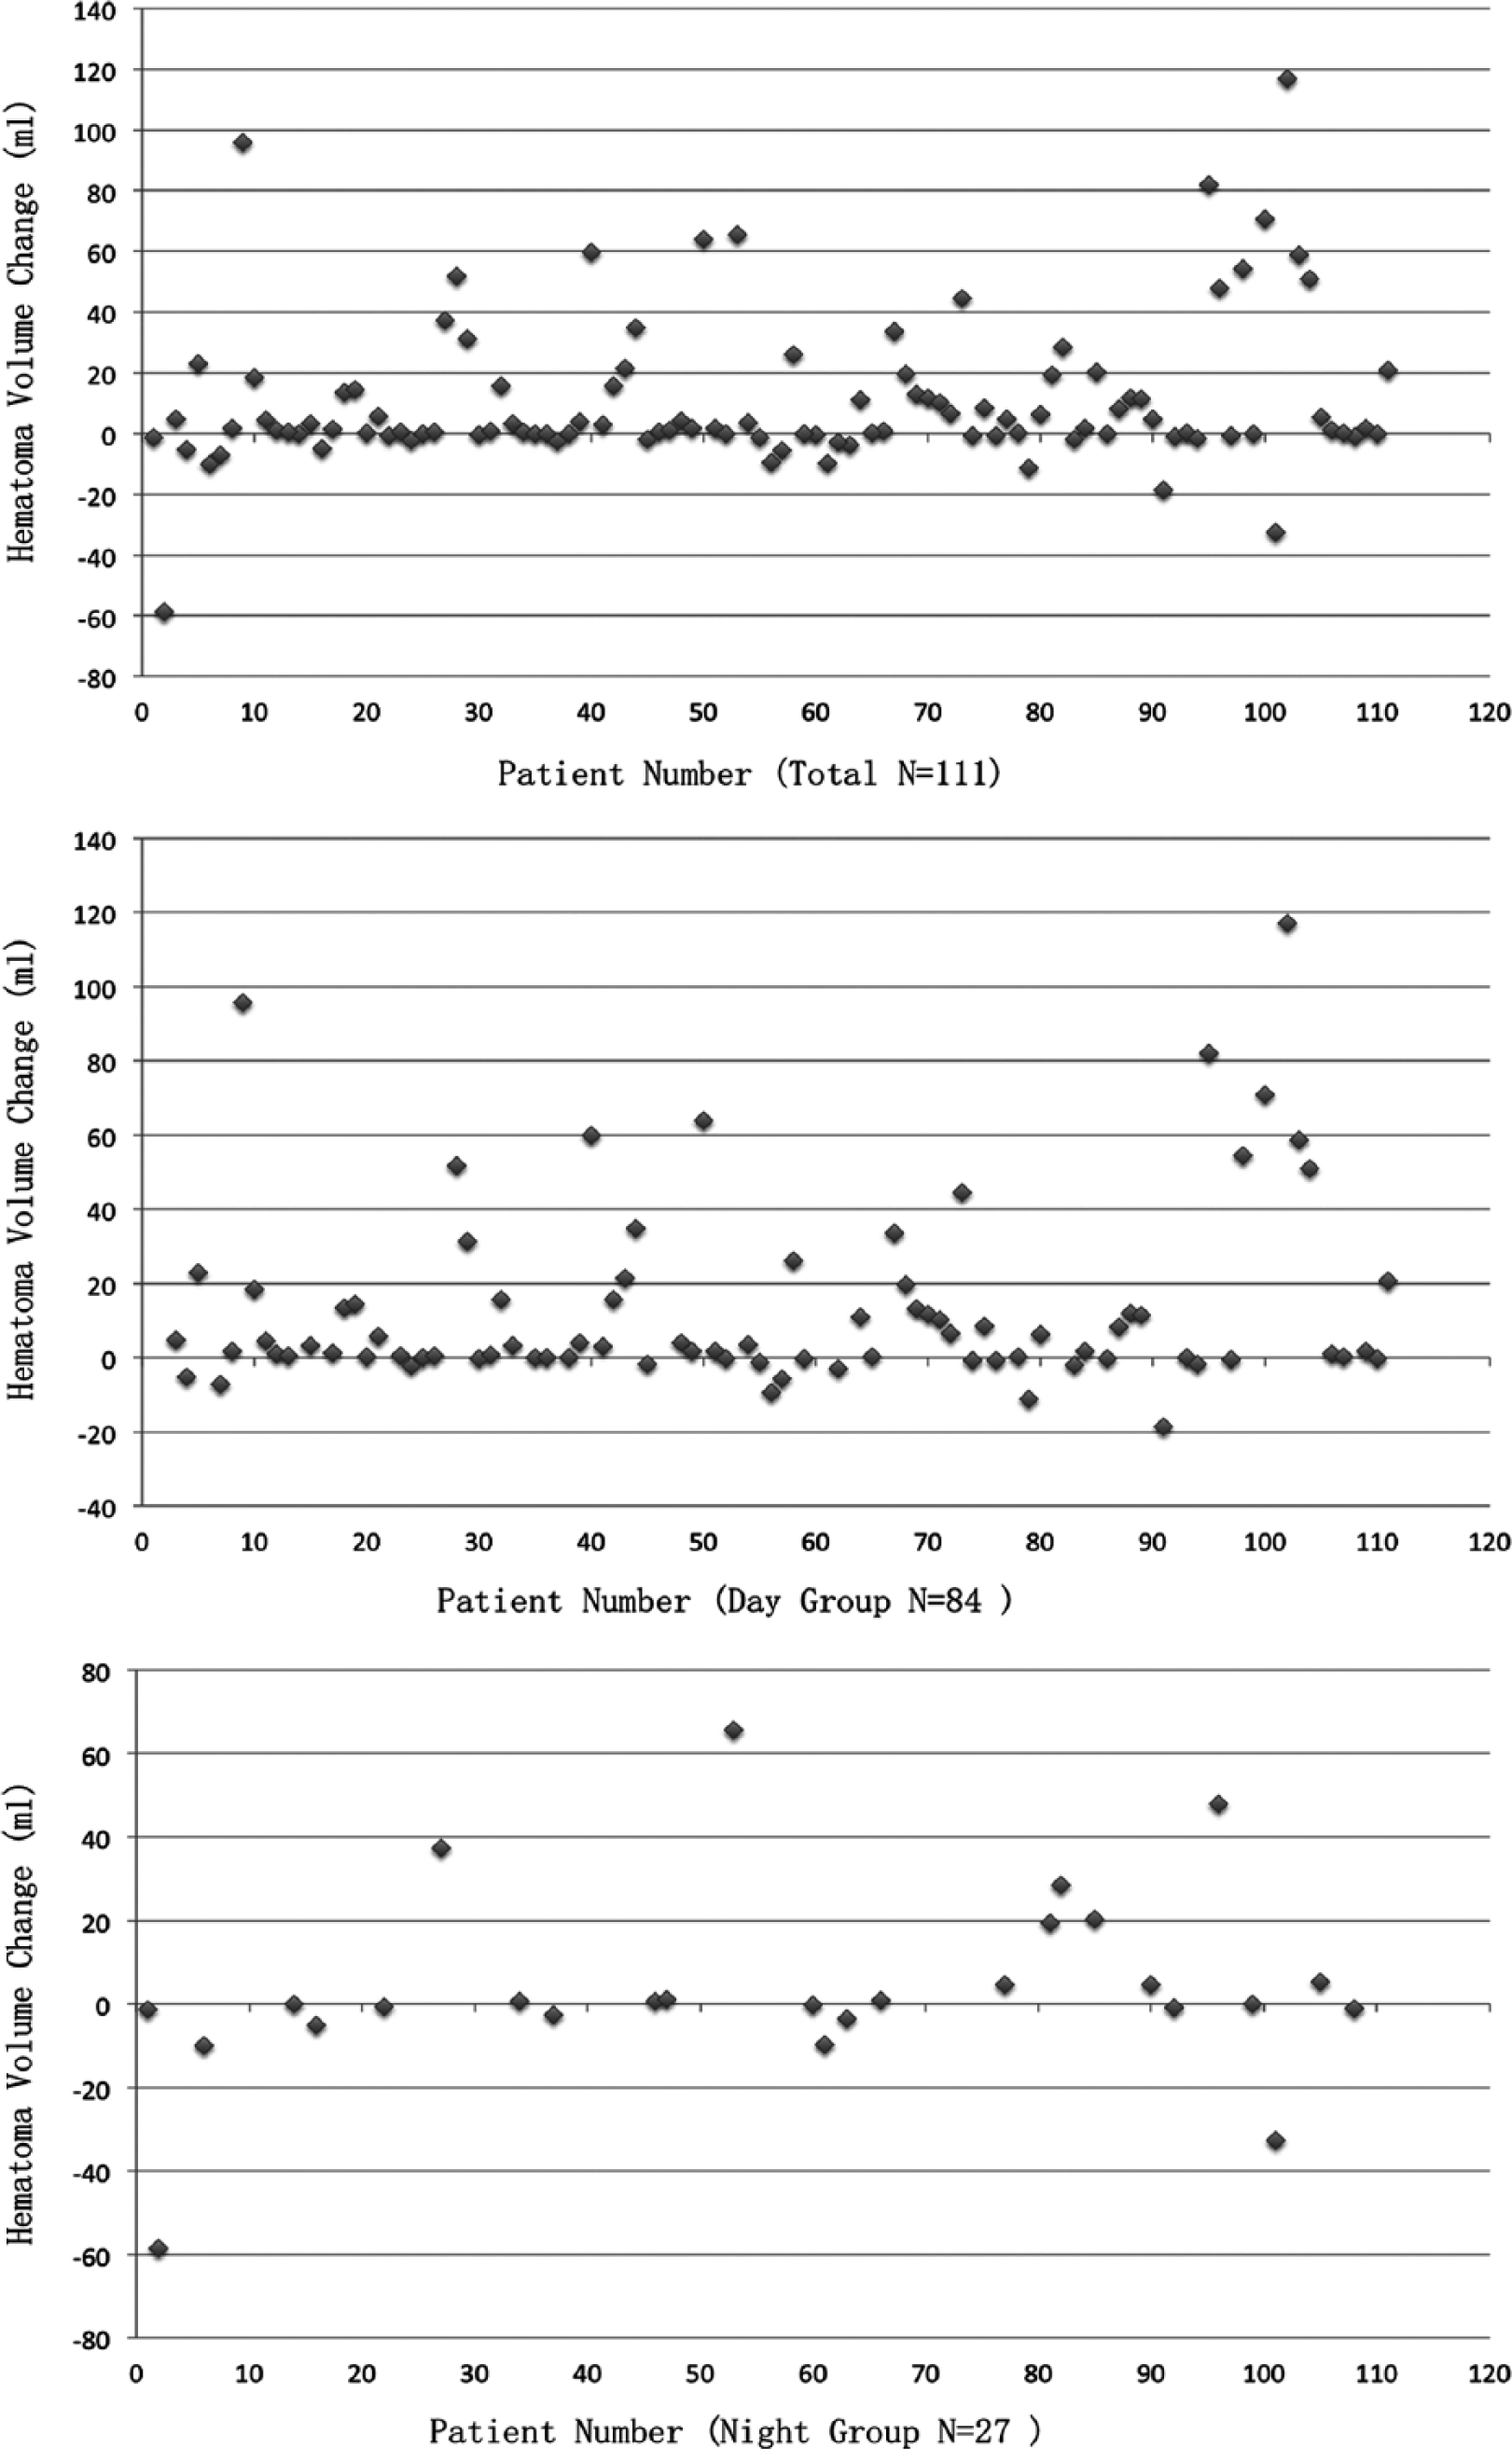
Scatterplot of hematoma volume change of all 111 patients (top), day group (middle), and night group (bottom).
Figure 2 shows the distribution of patients in each group during the 24-h period based on the extent of HE during 6 different 4-h time periods (0000-0400, 0400-0800, 0800-1200, 1200-1600, 1600-2000, and 2000-2400 h). The rates of AHE in these 6 time groups were 100%, 33.3%, 66.7%, 88.5%, 71.4%, and 37.5%, respectively (Figure 2A). The corresponding rates of SHE were 60%, 16.7%, 36.7%, 65.4%, 42.9%, and 18.8% (Figure 2C). The χ2 tests showed that the rates of AHE and SHE were significantly different between the 6 time periods (p = 0.002 and 0.029, respectively). The rates of AHE and SHE both peaked in the early afternoon (1200-1600 h) and reached a nadir during the 2000- to 2400-h time period.
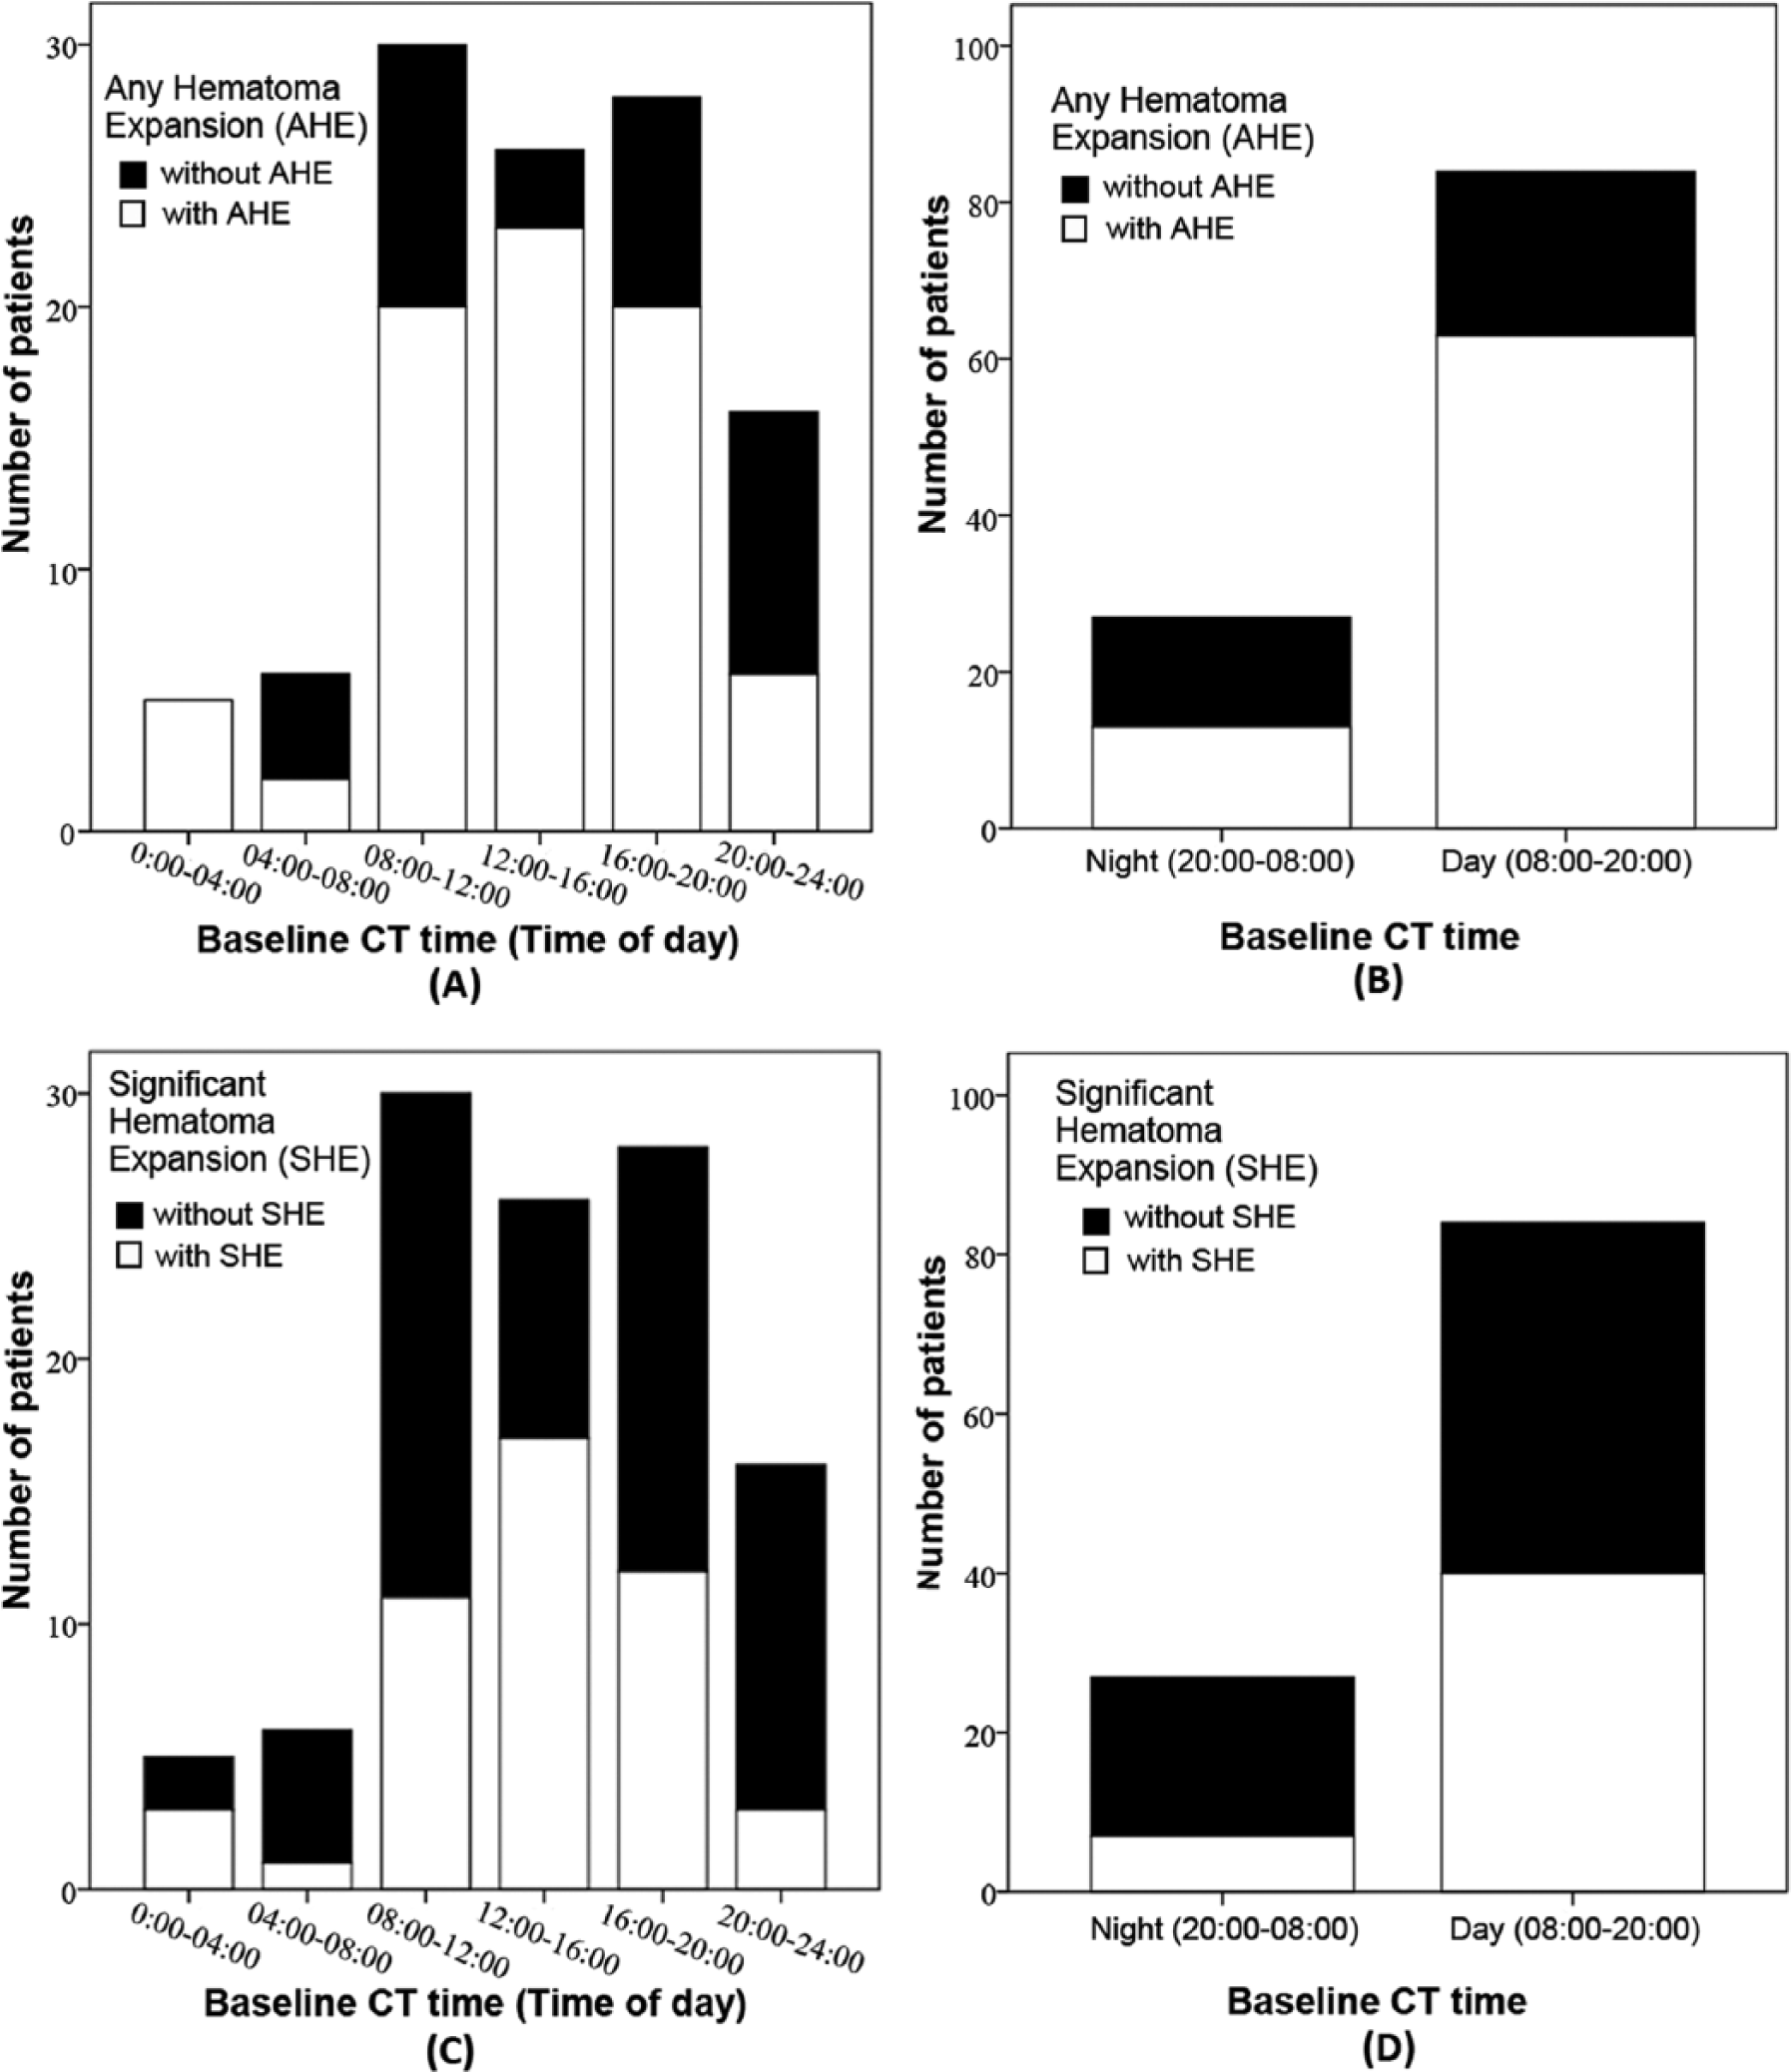
Number of the patients with any hematoma expansion (A, B) and significant hematoma expansion (C, D) based on 6 different 4-h time periods (0000-0400, 0400-0800, 0800-1200, 1200-1600, 1600-2000, and 2000-2400 h).
Predictors of Any Hematoma Expansion
Table 2 summarizes the characteristics of patients with versus without AHE. On univariate analyses, patients with AHE had significantly higher baseline serum creatinine levels (p = 0.035), and significantly higher proportions of them were current smokers (p = 0.032) and belonged to the diurnal group (p = 0.009). On multivariable logistic regression analyses, only day group assignment independently predicted AHE (odds ratio [OR], 3.53; 95% confidence interval [CI], 1.38-9.03; p = 0.008).
Univariate Analysis of Patients with and without Hematoma Expansion.
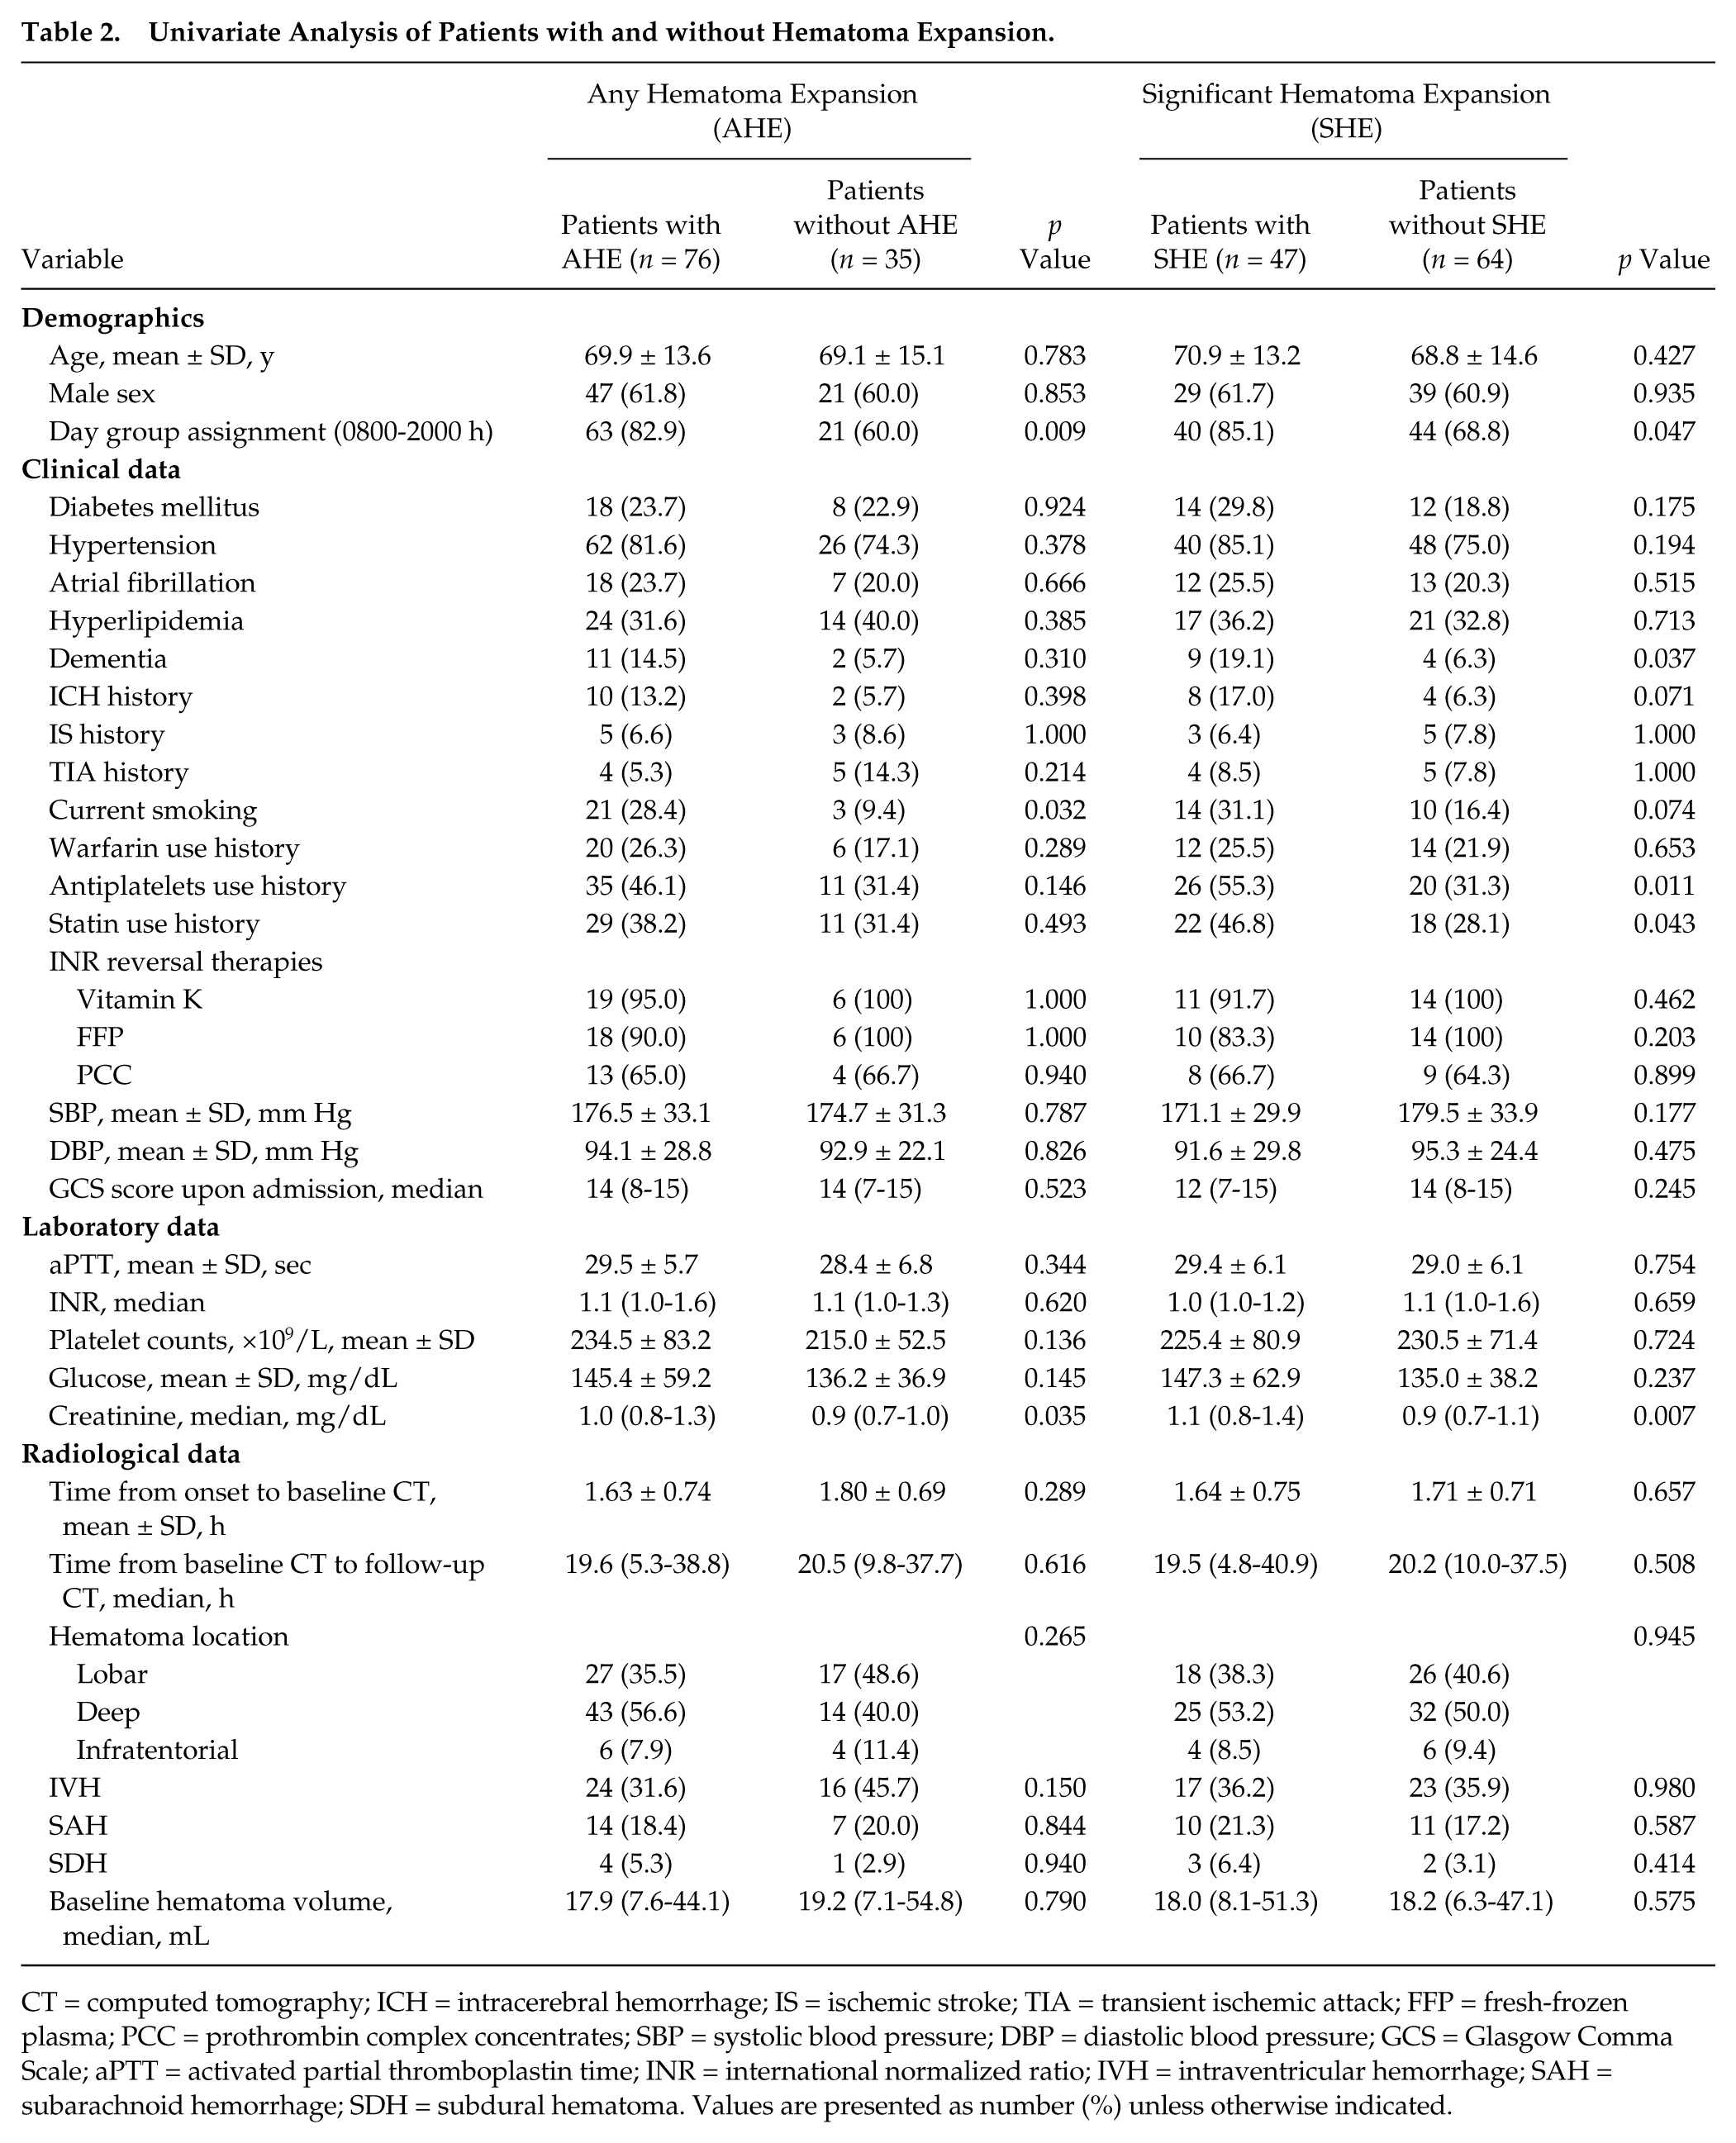
CT = computed tomography; ICH = intracerebral hemorrhage; IS = ischemic stroke; TIA = transient ischemic attack; FFP = fresh-frozen plasma; PCC = prothrombin complex concentrates; SBP = systolic blood pressure; DBP = diastolic blood pressure; GCS = Glasgow Comma Scale; aPTT = activated partial thromboplastin time; INR = international normalized ratio; IVH = intraventricular hemorrhage; SAH = subarachnoid hemorrhage; SDH = subdural hematoma. Values are presented as number (%) unless otherwise indicated.
To examine the daily variability of HE more thoroughly, we performed similar analyses after shifting the time frame for the day period from 0800-2000 to 0700-1900 h. Eighty of the 111 patients (72%) were in this newly defined day group, 60 of whom (75%) were noted to have AHE on follow-up CT. The day period (0700-1900 h) was associated with AHE (p = 0.017) on univariate analyses and still independently predicted AHE (OR, 3.143; p = 0.016) on multivariable logistic regression.
Predictors of Significant Hematoma Expansion
Table 2 summarizes the characteristics of patients with versus without SHE. Serum creatinine level (p = 0.007), history of dementia (p = 0.037), antiplatelet use (p = 0.011), statin use (p = 0.043), and day group assignment (p = 0.047) were significantly associated with SHE on univariate analyses. On multivariable logistic regression analysis, history of dementia (OR, 4.19; 95% CI, 1.01-17.43; p = 0.048) and antiplatelets use (OR, 2.47; 95% CI, 1.05-5.82; p = 0.04) were significant predictors of SHE; day group assignment was not a significant predictor for SHE (p = 0.139).
After shifting the time frame for the diurnal period, we observed a trend for an association between the day period 0700-1900 h and SHE on univariate analysis (p = 0.077) but not on multivariable logistic regression testing.
Discussion
We found that HE displayed daily variability in this cohort of ICH patients. Both AHE and SHE were more likely to occur during the day hours. Moreover, patients’ assignment to the day group (0800-2000 h) emerged as an independent predictor of AHE.
There are several possible plausible biological bases for our findings. First, circadian variability of platelet function, fibrinolysis, and coagulation factors might play a role. Daily variations in the levels of several coagulation factors, such as factor VII, factor VIII, proteins C and S, and antithrombin, have been reported (Manfredini et al., 2005). Previous studies have also shown that platelet aggregation has a circadian pattern, where it peaks during the late night or early morning hours (2000-0800 h) and declines to the trough by noon (Haus et al., 1990). Meanwhile, fibrinolytic activity tends to be highest during the day (Rosing et al., 1970). The activity of the tissue-plasminogen activator inhibitor I (PAI-1) is lowest during the day, and consequently the tissue-plasminogen activator (t-PA) peaks during the day hours (Andreotti and Kluft, 1991). Poor platelet function and high fibrinolytic activity during the day hours might make the ruptured vessels more difficult to stop bleeding during the day hours, thus resulting in greater HE. Second, high blood pressure, as a driving force, has been linked to HE in some studies (Rodriguez-Luna et al., 2013; Takeda et al., 2013). Blood pressure has a specific daily pattern, which may contribute to the daily variability of HE. Prior studies have shown that blood pressure has 2 peaks during the 24-h period: a major peak in the morning, which is largely attributed to the morning rise in the activity of the sympathetic nervous system and the renin-angiotensin aldosterone axis, and a minor one in the late afternoon (Portaluppi et al., 1996; Manfredini et al., 1996). The higher levels and larger variations of blood pressure during the daytime might contribute to rebleeding of the ruptured vessels and greater HE. The circadian variations in blood pressure and hemostatic status might be influenced by the activity cycle. There tends to be more medical care providers and more examinations and interventions during the daytime, which expose the patients to more interference from their surroundings. Resultant stress could cause changes in blood pressure, heart rate, hemostatic status, and endothelial function (Grignani et al., 1991; Gottdiener et al., 2003).
Our results might seem contradictory to an earlier study by Nagakane et al. (2006), which reported that baseline ICH volume and 30-day mortality were higher in patients who had ICH while asleep. However, it is important to point out that baseline ICH volume and hematoma expansion represent distinct variables, we did not collect long-term outcome or survival data, and we used different criteria to define day versus night group assignments. To our knowledge, this is the first study to report a daily pattern for HE following ICH. Our findings could potentially have important research and therapeutic implications. HE is a consistent predictor of morbidity and mortality following ICH and is an important target of several ongoing clinical trials in ICH. The daily variability of HE should be taken into consideration when designing future studies of therapeutic interventions aiming to limit HE to optimize the selection of potential candidates and to maximize the efficacy and safety of the tested interventions. However, our results are based on a relatively small sample size, especially in the night group, and should therefore be considered exploratory in nature. Although we found a significant diurnal predilection for AHE, a daily pattern for SHE did not reach statistical significance. This discrepancy might be a result of our small sample size. Further validation in larger prospective observational studies is needed to confirm our results.
Our study has other limitations aside from its small sample size that are largely imposed by its retrospective nature. First, it is possible that some patients might have already reached the full or near-full extent of their HE by the time they had their initial CT. Similarly, the full extent of HE might have been underestimated in some patients in whom HE continued past the follow-up scan. While it is impossible to ensure that all patients can undergo baseline CT scan at the same time interval from symptom onset even in a prospective trial, we attempted to minimize the potential confounding effect of delayed HE by expanding the time window for follow-up CT scan to 72 h from ICH onset. Previous studies have shown that most HE occurs within the first few hours after ICH onset and often reaches its peak within 24 h (Kazui et al., 1996). Second, our study could not evaluate the physiological underpinnings of the observed daily variations in HE. We did not measure coagulation factors or monitor blood pressure variability, which could possibly disclose the underlying reasons for the daily variability of hematoma expansion in our study. Future prospective studies are needed to test these possibilities. Third, we were only able to retrieve in-hospital mortality but not long-term functional outcomes. Fourth, we did not collect data on the extent and severity of small vessel and white matter disease, which could influence HE (Lou et al., 2010), and did not adjust for this confounding variable in our analyses. Last, the exploratory nature of our study and limitations of our data set, in particular its retrospective nature and inequality of the size of the day and night groups, led us to dichotomize continuous variables and use forward logistic regression to analyze the data rather than multivariable linear regression.
In conclusion, our results support the presence of a daily variability in the occurrence of HE following ICH, with a higher risk during the day hours. However, our study is exploratory and requires further prospective validation to confirm our findings and to evaluate their physiological underpinnings.
Footnotes
Acknowledgements
Dr. Yao is supported by a grant from a scholarship from Renji Hospital in Shanghai, China; Dr. Selim is partly supported by the NIH/NINDS (U01 NS074425).
Conflict of Interest Statement
The authors declare that they have no conflict of interest.