
Abstract
Brief exposure of mice to nocturnal light causes circadian rhythm phase shifts, simultaneously inducing locomotor suppression, a drop in body temperature, and associated sleep. The exact nature of the relationship between these light-induced responses is uncertain, although locomotor suppression and phase shift magnitudes are related to stimulus irradiance. Whether stimulus duration has similar effects is less clear. Here, the relationship between stimulus duration and response magnitude was evaluated further using 100 µW/cm2 white light-emitting diode pulses administered for 30, 300, 1200, or 3000 sec. The results show that, in general, shorter pulses yielded smaller responses and larger pulses yielded larger responses. However, the 300-sec pulse failed to augment locomotor suppression compared with the effect of a 30-sec pulse (44.7 ± 4.8 vs 40.6 ± 2.0 min) but simultaneously induced much larger phase shifts (1.28 ± 0.20 vs 0.52 ± 0.11 h). The larger phase shifts induced by the 300-sec stimulus did not differ from those induced by either the 1200- or 3000-sec pulses (1.43 ± 0.10 and 1.30 ± 0.17 h, respectively). The results demonstrate differential photic regulation of the two response types. Pulses ranging from 300 to 3000 sec produce equal phase shifts (present data); pulses ranging from 30 to 600 sec produce equal locomotor suppression levels. Greater suppression can occur additively in response to pulses of 1200 sec or more (present data), but this is not true for phase shifts. Nocturnal light appears to trigger a fixed duration event, locomotor suppression, or phase shift, with the latter followed by a light-refractory interval during which locomotor suppression can additively increase. The results also provide further support for the view that temporal integration of photic energy applies, at best, across a limited set of stimulus durations for both light-induced locomotor suppression/sleep and phase shift regulation.
Three primary stimulus characteristics—spectral composition, irradiance, and duration—contribute to photic regulation of the circadian rhythm phase. The importance of spectrum and irradiance has been well documented (Takahashi et al., 1984; Foster et al., 1991; Nelson and Takahashi, 1991; Boulos, 1995; Yoshimura and Ebihara, 1996; Hut et al., 2008), but the effects of stimulus duration are more obscure. Historically, the rationale governing choice of a particular duration has seldom been provided and appears to have been governed by two thoughts. One is that a pulse might be too long, with the excess altering the response being assessed (e.g., light could strike both phase advance and delay portions of the phase-response curve). The other is that a pulse might be too short and unable to induce an adequate response. As a result, light pulse duration has varied rather arbitrarily in phase shift studies from long (3-16 h; (Gander and Lewis, 1983; Honma et al., 1987; Meijer et al., 1990; Comas et al., 2006; Dewan et al., 2011; Zeitzer et al., 2011; Chang et al., 2012) to very brief (0.01-2.0 ms; Bruce et al., 1960; Joshi and Chandrashekaran, 1984; van den Pol et al., 1998; Arvanitogiannis and Amir, 1999; Vidal and Morin, 2007). Pulses ranging from 10 to 30 min have been most common (e.g., Daan and Pittendrigh, 1976; Rusak et al., 1990; Hannibal et al., 2010; Gannon et al., 2014; Griesauer et al., 2014), but 60 min has also been frequently used (Daan and Pittendrigh, 1976; Pauly and Horseman, 1985; Rusak et al., 1990). Several investigations have focused on the nominally duration-less effect of photic transition, that is, light-to-dark or dark-to-light (Albers, 1986; Aschoff, 1999; Comas et al., 2008), while others have emphasized the need to evaluate photic transitions as naturalistic gradual events such as would occur during dawn and dusk (Boulos and Macchi, 2005; Comas and Hut, 2009). Nelson and Takahashi (1991) provided the first systematic analysis of duration effects on light-induced phase shift magnitude, comparing the results to the effects of irradiance. They also invoked the concept of reciprocity between irradiance and duration, with total stimulus energy being the important characteristic assessed by the circadian system. Such temporal integration may have strong limits, however. Phase shifts increase linearly with irradiance over 3 orders of magnitude, but the duration effects are much less clear and may be applicable only to stimuli in the range of 30 to 300 sec (Nelson and Takahashi, 1991).
The use of millisecond light flashes has also revealed limitations to the concept of temporal integration. Mice, hamsters, and rats are able to show large phase shifts in response to very brief bright light flashes delivered across an interval of minutes (van den Pol et al., 1998; Arvanitogiannis and Amir, 1999; Vidal and Morin, 2007). Those results suggest that temporal integration applies to light-induced phase shifts, at best, in a limited fashion.
In addition to its effect on rhythm phase, nocturnal light exposure simultaneously induces mouse and hamster locomotor suppression, a drop in body temperature, and sleep (Altimus et al., 2008; Lupi et al., 2008; Morin and Studholme, 2009; Morin, 2013; Studholme et al., 2013). The effect of irradiance on locomotor suppression is well documented and is commonly known as “negative masking” (Mrosovsky et al., 1999; Redlin and Mrosovsky, 1999; Mrosovsky et al., 2000; Mrosovsky et al., 2001; Mrosovsky and Hattar, 2003; Thompson et al., 2008); for the preference of the term locomotor suppression rather than negative masking, see Morin (2013). In general, neither the effect of light on locomotor suppression, the drop in body temperature, nor sleep induction has received attention equivalent to that for light effects on circadian rhythm phase. Comparison of how light influences the two responses reveals a great deal of similarity (Morin, 2013). In particular, the data from millisecond stimulus studies (Vidal and Morin, 2007; Morin et al., 2010) suggest that both effects have only a limited form of temporal integration.
In the present study, mice were exposed to photic stimuli of various durations, and the simultaneously elicited phase shift and locomotor suppression responses were evaluated. The results demonstrate differential photic regulation of the two response types and provide further evidence that temporal integration across photic stimuli, if it occurs at all, apparently does so within narrow limits.
Method
Adult male C57BL/J6 mice (Jackson Laboratory, Bar Harbor, ME) were housed individually in 45 L × 20 W × 20 H cm clear polycarbonate cages under a 12 h light/12 h dark photoperiod. Each cage contained a 16.5-cm-diameter stainless-steel running wheel; food (in a wire cage lid hopper) and water were continuously available. Each wheel revolution closed a microswitch and was counted by computer. Switch closures were recorded in 1-min bins using WinCollectRT software (written by Glenn Hudson, Electronics Shop, Stony Brook University). The same software package provided data reduction capabilities, including export of running records in raster format for figure construction or associated numerical data as spreadsheet-compatible files for further analysis. The procedures were approved by the Institutional Animal Care and Use Committee of Stony Brook University and have been conducted in accordance with the principles and practices described by the Declaration of Helsinki and the U.S. National Institutes of Health Guide for the Care and Use of Laboratory Animals.
Cages were placed in an enclosed rack consisting of five shelves, each with its own light-tight door. Each shelf accommodated 4 or 5 cages. Lighting for each shelf consisted of a linear array of 48 broad-spectrum white light-emitting diodes (LEDs; LBFA-CW12, Superbrightleds.com) positioned approximately 10 cm from the wheel end (back end) of the cage. Illumination timing and irradiance within each chamber were controlled by an 8-bit D-A voltage controller, an LED dimmer (OSRAM OT DIM, Osram Sylvania, Danvers, MA), and custom software (LightControl written by Glenn Hudson, Stony Brook University) that allowed the LED light to be turned on for an integer number of seconds. Irradiance, measured in the middle of each cage with the photodetector facing upward, was about 100 µW/cm2 for all test conditions. The LEDs were turned on for 30, 300, 1200, or 3000 sec, depending on the stimulus condition being tested, providing 30, 300, 1200, and 3000 J/m2 energy, respectively. A Gigahertz Optik Optometer (model P9710; Newburyport, MA) was used to measure lux and µW/cm2 using detector models VL-3701 and RW-3703-2, respectively. The latter is sensitive across 400 to 800 nm. With these detectors, 100 lux measured about 55 µW/cm2. A curve fitted to multiple points ranging from 2 to 1000 lux had a correlation coefficient of 0.998 and a slope of 1.83.
After stable entrainment was achieved in LD12:12, the animals were exposed to constant darkness (DD) for 5 d. On day 6, all animals on a particular shelf were exposed to a single light pulse of the proper duration. Based on the activity records of days 1 to 5 in DD, the light pulse was scheduled by the LightControl software to be delivered during the interval of circadian time 13 to 14 (CT13-14). Ideally, the moment of light onset would be the same circadian time for all mice on the shelf, but usually it occurred within the CT13-14 interval for only 2 or 3 animals per shelf because the circadian clocks of the others ran too fast or too slow. Data from mice that did not experience the light pulse onset during the CT13-14 interval were excluded from further analysis. A pin photodiode detected the presence of the light pulse and sent a signal to the data collection computer.
Animals remained in DD for an additional 10 d after the light pulse. Phase shifts were calculated according to standard methods (Vidal and Morin, 2007; Vivanco et al., 2013). Briefly, raster plots of wheel-running activity were printed for each test of each animal. Fine pencil lines were drawn through the 5 daily activity onsets in DD prior to the light pulse and the 5 d of stable activity onsets in DD after the pulse. The distance between the two lines was measured with an electronic caliper to the nearest 0.01 mm on the day of the light pulse. The distance between the prepulse activity onset line and the time of pulse onset was also measured to the nearest 0.01 mm. Both distance measures were converted to hours for the purposes of data analysis and presentation.
Subsequent to the completion of all tests, the record of 1440 data points per test day for each animal was exported to a spreadsheet and reduced to include the 30-min interval prior to light pulse onset plus the subsequent 2 h. An index of locomotor suppression for each light pulse test was calculated as the number of minutes during the 2-h interval after stimulus onset in which there were zero recorded wheel revolutions. This number is referred to as zero counts (Morin and Studholme, 2009; Vivanco et al., 2013). The influence of light pulse duration on phase shift magnitude and locomotor suppression was assessed with SigmaPlot v11.0 statistical package (Systat Software, San Jose, CA). Analysis of variance (ANOVA) evaluated overall treatment effects, with the Holm-Sidak test used to determine between-group differences. Pearson correlation coefficients obtained with SigmaPlot were also used to evaluate between-variable relationships.
Results
Light pulse onsets were effectively administered between CT13 and CT14, as planned. The 4 groups did not differ in this regard, with light onset at average (±SEM) circadian times of 13.35 (0.12), 13.56 (0.14), 13.23 (0.15), and 13.43 (0.21) h for the 30-, 300-, 1200-, and 3000-sec groups, respectively.
Light pulse duration had a significant effect on phase shift magnitude (Fig. 1A; F = 9.349, df = 3, 49; P < 0.001). Post hoc analysis showed that phase shifts induced by the 30-sec pulse were significantly smaller than those induced by the 300-sec (P = 0.004), 1200-sec (P < 0.001), and 3000-sec (P < 0.001) stimuli. Responses to the 300-, 1200-, and 3000-sec stimuli did not differ.
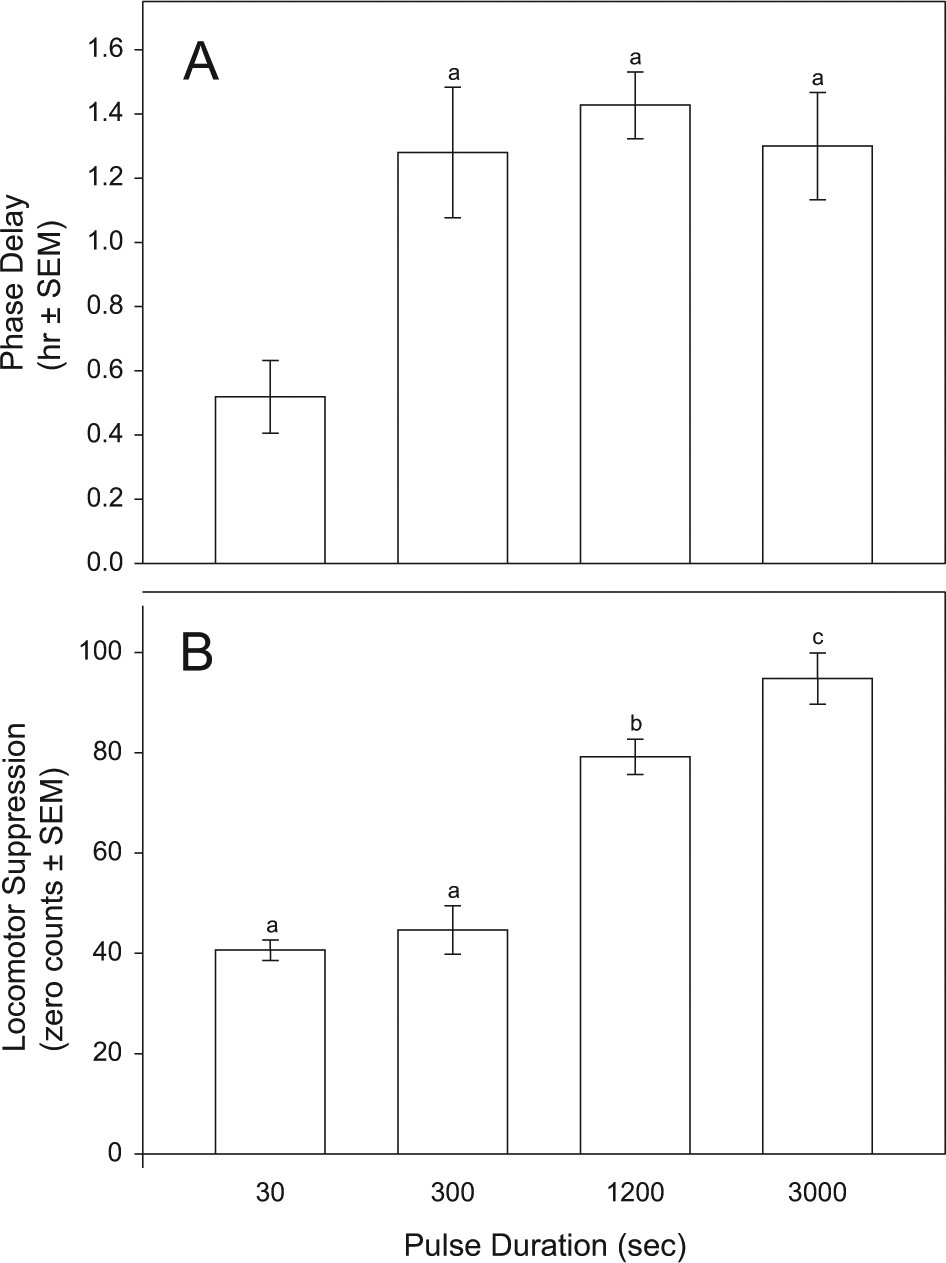
Simultaneously light-induced (A) phase delay magnitude (h) and (B) amount of locomotor suppression (zero counts; see the Method section) are differentially affected by light pulse duration. Bars bearing common letter identifiers are not significantly different (see text).
Stimulus duration also had a significant effect on the amount of time wheel running was suppressed, as indicated by the differing number of zero counts (Fig. 1B; F = 49.308, df = 3, 49; P < 0.001). Post hoc analysis showed that the effects of 30- and 300-sec pulses did not differ, but each differed from the zero counts elicited by the 1200- and 3000-sec pulses (P < 0.001 for each comparison). The suppressive effects of 1200-sec light were significantly less than those of 3000-sec light (P = 0.013).
Figure 2 shows the temporal patterns of locomotor suppression in response to the differing stimulus durations. Animals returned to 50% of prepulse activity levels a median 37.5, 42.0, 59.5, and 56.0 min after the light pulses ended (30-, 300-, 1200-, and 3000-sec groups, respectively). There was a significant effect of treatment (H = 20.36, P < 0.001, Kruskal-Wallis test), with post hoc tests showing that the effect of the 30-sec pulse differed significantly from the 1200- and 3000-sec pulse effects (P < 0.05, Dunn’s tests); there were no other significant differences.
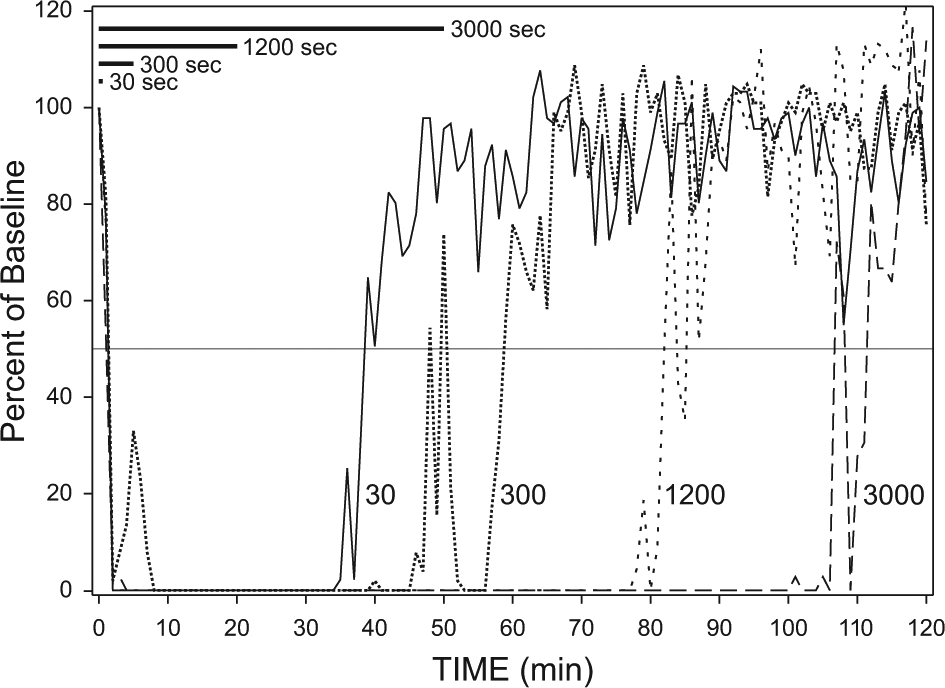
Patterns of locomotor (running wheel) suppression occurring in response to 30-, 300-, 1200-, or 3000-sec light pulses. The median amount of activity per minute is expressed as a percentage of the baseline activity during the 30-min prelight interval. Horizontal black bars indicate the relative durations of the light pulses. Light onset was at minute 0.
The relationship between locomotor suppression and phase shift magnitude was examined by assessing the correlation between the two variables. Such an assessment is useful only if the stimulus does not induce additive effects on locomotor suppression (i.e., the 30- and 300-sec light conditions). There was no correlation between the extent of locomotor suppression (as indicated by the number of zero minutes) and size of the simultaneously elicited phase shift within either the 30- or 300-sec pulse groups (r = 0.226, P = 0.384; and r = −0.157, P = 0.686, respectively). Nor did the combination of the 2 groups yield a significant correlation (r = 0.194, P = 0.546).
Discussion
In all likelihood, there is but one input pathway through which light simultaneously suppresses nocturnal locomotion, induces sleep, and causes circadian rhythm phase shifts. Each response normally depends on a mix of classical (rod/cone) and ganglion cell photoreception, as well as an intact retinohypothalamic tract (Hattar et al., 2003; Panda et al., 2003; Morin and Studholme, 2011; Morin, 2013). The present results offer further support to this view but also demonstrate response differences that imply the existence of mechanisms within the input pathway that differentially govern any of several functions modulated by photic stimulation (see Fig. 5 in Morin, 2013). This is not unexpected given that one immediate response is intrinsic to the SCN (phase change of the circadian clock), while the others (sleep induction and inhibition of locomotion) involve extensive neural circuitry extrinsic to and regulated by the SCN (Mistlberger, 2005; Hastings et al., 2014). The mechanistic relationship between stimulus and phase control of the circadian clock requires further study of cellular activity within the SCN, while the effects of light on locomotor inhibition and sleep require greater understanding of the relationship between the clock and extra-SCN locomotor/sleep circuitry.
Photic Stimulus Duration Effects on Phase Shift
Phase shift effects of light have been widely studied, but only a few investigations have directly evaluated the role of stimulus duration (Comas et al., 2006; Dewan et al., 2011; Chang et al., 2012) and only one has used a range of durations commonly investigated (Nelson and Takahashi, 1991). In hamsters, a short (30 s) stimulus elicited reduced phase shifts compared with those obtained following a 300-sec stimulus (determined to be optimal), while a stimulus many times longer (3600 s/1 h) failed to add significantly to the shift magnitude (Nelson and Takahashi, 1991). The present mouse results are consistent with those observations to the extent that shifts elicited by a 30-sec stimulus were much smaller than those elicited by an equal irradiance 300-sec stimulus. Further, neither 1200- nor 3000-sec stimuli significantly increased shift magnitude. Nelson and Takahashi (1991) noted that “the hamster circadian system appears unable to integrate light information in pulses longer than 300 sec and the response of this photic-entrainment pathway is dependent only upon the irradiance of these extended stimulus durations” (p. 131). The present mouse data are consistent with that conclusion. The inability of animals to additively lengthen phase shifts to longer duration stimuli is evidence of response saturation.
In contrast to the inability of intermediate duration stimuli (300 to 3600 s) to extend phase shift size, longer pulses do have a lengthening effect. Larger phase delays are generally associated with longer pulse durations across the range of 1 to 9 h (longer stimuli yield smaller shifts; see Comas et al., 2006, for details). The exact reasons for the larger and then smaller shifts in response to increasing stimulus duration are not known but are likely related to the manner in which the different length stimuli interact with each animal’s phase response curve.
Similar studies concerning the effect of stimulus duration on locomotor suppression/sleep induction have not been performed previously. In addition, no prior investigation has examined the relationship between light-induced locomotor suppression/sleep induction and phase shift responses, although an alerting effect of nocturnal millisecond light exposure that simultaneously induces a phase delay in humans has been observed (Zeitzer et al., 2011).
Phase Shift Response Saturation
Double pulse experiments designed to evaluate response saturation have demonstrated that the second pulse yields only a small phase shift or CREB phosphorylation, compared with that elicited by the initial pulse (Best et al., 1999; Nelson and Takahashi, 1999; Khammanivong and Nelson, 2000; Sharma and Chandrashekaran, 2000). Such results are considered evidence that a light-activated mechanism initiates a poststimulus refractory interval during which the circadian clock is largely unaffected by additional light. The refractory interval lasts between 2 and 4 h and during the first hour it is virtually absolute.
In each of the above-cited double-pulse studies, the initial photic stimulus was 15 min and elicited a substantial phase shift followed by a refractory interval. Such results are similar to the present data showing that a 5-min pulse induced a large phase shift that was not lengthened by 15 or 45 additional stimulus minutes, a response pattern also observed by Khammanivong and Nelson (2000), who used a very similar procedure. In view of this, it appears that phase shift response saturation can occur with as little as 5 min light, consistent with previous observations by Nelson and Takahashi (1991).
It is probably incorrect to view response saturation strictly as a product of exposure duration because a similar phenomenon occurs with millisecond light stimuli. For example, 10 flashes, each 2 ms long and delivered over a 5-min interval, elicit phase shifts that are equivalent to those stimulated by a single 5-min light pulse (Vidal and Morin, 2007; Morin and Studholme, 2009). Phase shift magnitude is not greatly influenced by more flashes, interflash interval, or the interval over which they are delivered once a particular threshold for these variables has been exceeded (van den Pol et al., 1998; Vidal and Morin, 2007; Morin and Studholme, 2009). The foregoing results also suggest that a photon-counting mechanism is not likely to be active beyond a certain stimulus delivery interval. In addition, even within such a delivery interval, other factors may contribute to the effectiveness of the stimulus (e.g., stimuli having abrupt increases in onset irradiance are more effective than equal energy stimuli with gradual onsets; Hut and Cooper, 2002). Response saturation could result from reduced sensitivity or response at the level of the photoreceptors or at the level of retinal target areas.
Stimulus Duration and Locomotor Suppression
Response saturation is evident in data showing an absence of phase shifts to photic stimuli longer than 300 sec (present data; Nelson and Takahashi, 1991). In contrast, the locomotor suppression response does not appear to saturate under the same stimulus conditions (present data), and an equal irradiance stimulus applied for 11 h yielded virtually complete locomotor suppression during the entire interval (Morin et al., 2010). The effect of 1200- and 3000-sec pulses on locomotor suppression appears to be more similar to the effect on light-induced FOS in the SCN than on phase shift responses to the extent that FOS induction also appears to be unsaturated after a nearly 3000-sec stimulus (Dkhissi-Benyahya et al., 2000). In other words, many cells in the SCN that do not express FOS in response to the longest-duration stimulus might very well do so in response to still longer stimuli (as with the 11-h stimulus elicitation of locomotor suppression). Conceivably, the number of cells expressing FOS after being sufficiently light activated is causally related to the initiation and prolongation of locomotor suppression/sleep induction.
The duration of locomotor suppression/induced sleep is unexpectedly constant in response to stimuli ranging from 30- to at least 600-sec long (Morin et al., 2010). A most important component of the responses is that they endure longer than the eliciting stimulus. In the present study, for example, 30- or 300-sec (0.5- or 5.0-min) stimuli induced an interval of locomotor suppression lasting about 40 to 44 min. This is approximately 80 times the 30-sec stimulus duration that elicited such responses. A prior study found the response to be 55 times longer than the stimulus (Morin et al., 2010).
A second constancy effect was observed in the present study, and it related to the amount of suppression that persisted beyond the end of the light pulse. Across all individuals, median suppression was 45.5 min from light pulse end until activity had attained a 50% recovery, with only the 30-sec pulse group having a slightly, but significantly, abbreviated postpulse suppression interval. Thus, light exposure triggers a fixed-duration suppression response to which additional light can add further suppression, but recovery from suppression also appears to be an effect of light that results from the initial light exposure, is relatively fixed in length, and is not greatly influenced by the pulse durations employed in this study.
The initial locomotor suppression/sleep-induction response appears to involve an hourglass-like timing mechanism that is triggered by a suprathreshold photic stimulus and, once activated, runs to completion in the absence of continuing light exposure. Longer light exposure can produce additive effects on locomotor suppression/sleep induction involving a mechanism that may not be directly related to that which controls the initial, light-triggered fixed-duration response (Morin et al., 2010; Morin, 2013). In the present study, such an additive effect is evident as an increase in zero counts induced by the 3000-sec stimulus compared with the 1200-sec stimulus and by the latter which is significantly greater than the number induced by the 300-sec stimulus. Double-pulse studies expressly designed to determine whether there is a poststimulus refractory interval for locomotor suppression or how long it endures after exposure to the initial stimulus have not been conducted. However, a double-stimulus (5-min pulse and 10 flashes) study suggests that any refractoriness is minimal 20 min after the initial light pulse and that locomotor suppression increases additively as more flashes are included in a test (Morin and Studholme, 2009).
Relationship between Locomotor Suppression and Phase Shift Responses
As indicated above, a result central to both this and prior investigations (Redlin and Mrosovsky, 1999; Morin et al., 2010) is the fact that a relatively brief stimulus elicits a prolonged response much longer than the stimulus itself. A second key result is the fact that longer light pulses do not additively increase phase shift magnitude, as they do for locomotor suppression. The 30-sec pulse elicited a moderate phase delay, and although a 10 times longer stimulus approximately doubled the phase shift size, neither 40 nor 100 times longer stimuli further increased the delay.
Such data provide strong evidence for an active, light-triggered mechanism governing a phasic locomotor suppression/sleep response, with a more passive mechanism capable of prolonging the response in an additive manner. This type of mechanistic distinction is not present in the phase shift data, as there is no evidence of an additive stimulatory effect in addition to the acute triggering action. Thus, it appears that each response is elicited by an acute action of light, not only with respect to its triggering effect but also with respect to the circadian time at which such actions can occur (i.e., during the subjective night; Redlin and Mrosovsky, 1999; Shuboni et al., 2012; Studholme et al., 2013). For both phase shifts and locomotor suppression/sleep induction, it also appears that the initial acute light exposure blocks subsequent triggered responses during an absolute refractory interval. Additive locomotor suppression/sleep response to light is subsequently possible during a relatively refractory interval, but this does not apply to the induction of phase shifts. We have suggested that phasic control of the circadian clock residing in SCN neurons is one action of photic input via the retinohypothalamic tract but that an SCN pass-through influence of light on postsynaptic pathways regulating a variety of output rhythms is likely (De la Iglesia and Schwartz, 2002; Muscat and Morin, 2006; Morin, 2013).
The results concur with previous reports showing that the photic induction mechanism regulating phase shifts saturates to the effects of 100 µW/cm2 light when the stimulus is 300 or more seconds. The meaning of saturate in the context of the current experiment is unclear. It cannot refer to an inability to obtain additional responses from photoreceptors engaging the non–image-forming visual system because at least one part of that system (locomotor suppression) is able to respond to long stimuli. Further, it should be recognized that the zero counts measure is an adequate proxy identifying the behavioral expression of mouse sleep (see also Pack et al., 2007; Fisher et al., 2012) and that locomotor suppression is a useful proxy for light-induced sleep (Morin and Studholme, 2009; Studholme et al., 2013). By extension of this logic, the additive effects of light on locomotor suppression actually represent an extension of the light-induced sleep interval, although this has not been explicitly confirmed.
The similarity of phase shift and locomotor suppression responses to light has been documented (Morin, 2013). Despite the similarities, the 2 non–image-forming responses to light appear to be parallel events linked through the effects of a common stimulus, rather than responses in which the magnitude of one, such as locomotor suppression, directly or indirectly influences the magnitude of the other. This conclusion is supported by the absence of any data indicating a correlation between the degree of locomotor suppression and phase shift magnitude.
The data provided here do not undermine the proposed model of light effects on several behavioral or endocrine outputs (Morin, 2013), despite showing that locomotor suppression and phase shifting are differentially responsive to stimuli of different durations. Photic input presumably alters core molecular and cellular constituents of the circadian clock located in the SCN in order to elicit phase shifts (Lowrey and Takahashi, 2011). We contend, although it has not been fully proven, that the same photic input pathway is also responsible for locomotor suppression/sleep induction. In either case, locomotor suppression/sleep induction could very well be a parallel or second-order phenomenon subject to modification by neural events not directly involving the circadian clockwork apparatus.
Footnotes
Acknowledgements
We thank Dr. I. Provencio for his close reading and constructive comments on the manuscript. This study was supported by National Institute of Neurological Disorders and Stroke (grant NS061804 to L.P.M.).
Conflict of Interest Statement
The authors have no potential conflicts of interest with respect to the research, authorship, and/or publication of this article.