
Abstract
A physiologically based mathematical model of a putative sleep-wake regulatory network is used to investigate the transition from typical human sleep patterns to spontaneous internal desynchrony behavior observed under temporal isolation conditions. The model sleep-wake regulatory network describes the neurotransmitter-mediated interactions among brainstem and hypothalamic neuronal populations that participate in the transitions between wake, rapid eye movement (REM) sleep, and non-REM (NREM) sleep. Physiologically based interactions among these sleep-wake centers and the suprachiasmatic nucleus (SCN), whose activity is driven by an established circadian oscillator model, mediate circadian modulation of sleep-wake behavior. When the sleep-wake and circadian rhythms are synchronized, the model simulates stereotypically normal human sleep-wake behavior within the limits of individual variation, including typical NREM-REM cycling across the night. When effects of temporal isolation are simulated by increasing the period of the sleep-wake cycle, the model replicates spontaneous internal desynchrony with the appropriate dependence of multiple features of REM sleep on circadian phase. In temporal isolation experiments, subjects have exhibited different desynchronized sleep-wake behaviors. Our model can generate similar ranges of desynchronized behaviors by variations in the period of the sleep-wake cycle and the strength of interactions between the SCN and the sleep-wake centers. Analysis of the model suggests that similar mechanisms underlie several different desynchronized behaviors and that the phenomenon of phase trapping may be dependent on SCN modulation of REM sleep-promoting centers. These results provide predictions for physiologically plausible mechanisms underlying interindividual variations in sleep-wake behavior observed during temporal isolation experiments.
Keywords
Human sleep and wake behavior is highly sensitive to the approximately 24-h circadian rhythm coordinated by the suprachiasmatic nucleus (SCN), the master circadian clock in the brain. When entrained to normal daily environmental cues, sleep and wake states cycle with a 24-h period in phase with the circadian rhythm, as measured through various markers including core body temperature or levels of melatonin or cortisol (Hofstra and de Weerd, 2008). For example, in the entrained state, minimum core body temperature generally occurs near the end of the normal nighttime sleep episode, and this phase relationship contributes to generating a consolidated sleep episode (Dijk and Czeisler, 1995; Dijk and Lockley, 2002). It has been estimated that in the absence of time cues, the intrinsic circadian period is slightly longer than 24 h, closer to 24.2 h (Czeisler et al., 1999). Under these conditions, sleep-wake cycle periods also lengthen, thereby remaining synchronized with the circadian rhythm (Wever, 1979).
When humans remain isolated from external time cues for extended periods of time, the sleep-wake cycle can desynchronize from the circadian rhythm and the 2 cycles may no longer run with the same period. The circadian period usually remains close to 24 h, whereas the sleep-wake cycle period has been reported to either increase or decrease (Czeisler et al., 1999, 1980a; Wever, 1979; Zulley, 1980). Specifically, subjects in temporal isolation experiments displayed increased sleep-wake cycle periods of 30-40 h or longer or shortened sleep-wake cycle periods between 15 and 20 h (Wever, 1979). In the progression to desynchrony, individual subjects showed great variability: Some subjects fell into the desynchronized state immediately upon entering isolation, others remained in a relatively synchronized state for 1-2 weeks before desynchronization began (Wever, 1979), and some displayed episodes of quasi-rhythmic shifts between their circadian and sleep-wake rhythms known as phase trapping (Kronauer et al., 1982; Wever, 1979). Importantly, although subjects in these experiments were isolated from environmental 24-h light cues, their self-selected light-dark schedules probably continued to affect their intrinsic circadian clocks.
In addition to showing these classic patterns of spontaneous internal desynchronization, subjects have been reported to display more pronounced interindividual differences under temporal isolation (Wever, 1979). Some subjects entered a bicircadian rhythm in which the sleep-wake cycle lengthened to approximately 48 h, resulting in 2 circadian cycles during each sleep-wake cycle. In these cases, the 2 rhythms could remain synchronized with peaks of core body temperature occurring at specific phases of the wake episodes. Other subjects displayed sleep-wake behavior that seemed to settle into a near 24-h synchronized pattern with the circadian rhythm for a few cycles at a time, but then, at semi-regular intervals, a significantly longer wake episode interrupted the pattern and induced a jump in the phase relationship between the sleep-wake cycle and the circadian rhythm.
During these states of spontaneous internal desynchronization, the circadian rhythm continued to influence sleep-wake behavior. In particular, the occurrence of rapid eye movement (REM) sleep showed a strong dependence on circadian phase (Carskadon and Dement, 1980; Czeisler et al., 1980b; Dijk and Czeisler, 1995; Endo et al., 1981; Lee et al., 2009; Weitzman et al., 1980; Zulley, 1980). In an analysis of REM sleep behavior in temporally isolated subjects displaying the classic pattern of internal desynchronization, it was found that the shortest latency to REM sleep, the longest REM sleep bout durations, and the highest percentage of REM during total sleep time occurred near the minimum of core body temperature (Czeisler et al., 1980b).
To investigate mechanisms underlying spontaneous internal desynchronization, we developed a physiologically based mathematical model for the interactions between the SCN and brainstem and hypothalamic neuronal populations involved in regulating waking, non-REM (NREM) sleep, and REM sleep. This model integrates a sleep-wake regulatory network model previously developed to simulate sleep in the rat (Diniz Behn and Booth, 2010; Fleshner et al., 2011) with SCN activity governed by the circadian oscillator model of Forger et al. (1999). Mechanisms of spontaneous internal desynchrony have been investigated previously using different mathematical models (Daan et al., 1984; Kronauer, 1984; Kronauer et al., 1982; Nakao et al., 1997; Phillips et al., 2011). Our results extend this work by (1) describing the transition dynamics among the 3 states of wake, NREM sleep, and REM sleep; (2) replicating the circadian dependence of multiple features of REM sleep under desynchronized conditions similar to experimental results; (3) predicting that some interindividual differences in desynchronized behavior reflect variations of the same underlying mechanism; and (4) predicting that SCN modulation of REM sleep-promoting centers can influence synchronization of the sleep-wake and circadian cycles as well as the occurrence of phase trapping.
Materials and Methods
Our human sleep-wake regulation model describes the neurotransmitter-mediated interactions among brainstem and hypothalamic neuronal populations that have been identified to promote wake, NREM sleep, and REM sleep (Suppl. Table S1 in the supplementary online material) and were included in our previous sleep-wake regulatory network model for rat sleep (Diniz Behn and Booth, 2010; Fleshner et al., 2011). These include the locus coeruleus (LC), dorsal raphe (DR), both REM-promoting and wake/REM-promoting subpopulations of laterodorsal tegmental nucleus and pedunculopontine tegmental nucleus (LDT/PPT), and the ventrolateral preoptic area (VLPO). The model also includes the SCN with a 24-h variation in firing rate that provides circadian modulation to the wake- and sleep-promoting populations (see below). Since both the LC and the DR, and the actions of their respective neurotransmitters norepinephrine (NE) and serotonin (5-HT), are thought to be primary wake-promoting agents in the brain, we simplify the model by representing the joint activity of these 2 populations and their neurotransmitters by a single wake-promoting population (LC) and neurotransmitter (NE).
Sleep-Wake Network Model
The synaptic projections among the wake-promoting, sleep-promoting, and REM sleep–promoting populations included in the model are based on established anatomy and physiology (reviewed in Saper et al., 2005) (Fig. 1). Mutually inhibitory projections between the wake-promoting population and the sleep-promoting ventrolateral preoptic nucleus (VLPO) reflect the flip-flop switch hypothesis for the regulation of transitions between waking and sleep states (Saper et al., 2001). Coupling between the wake-promoting population and the REM sleep–promoting population reflects the reciprocal-interaction hypothesis for REM sleep generation (McCarley and Hobson, 1975; McCarley and Massaquoi, 1986): Acetylcholine (ACh) has an excitatory effect on the LC, and NE has an inhibitory effect on the REM-promoting subpopulation of the LDT/PPT. Auto effects of neurotransmitters on their presynaptic populations reflect either direct effects or indirect effects involving neural areas not explicitly included in the model (Burlet et al., 2002; Sakurai, 2007).
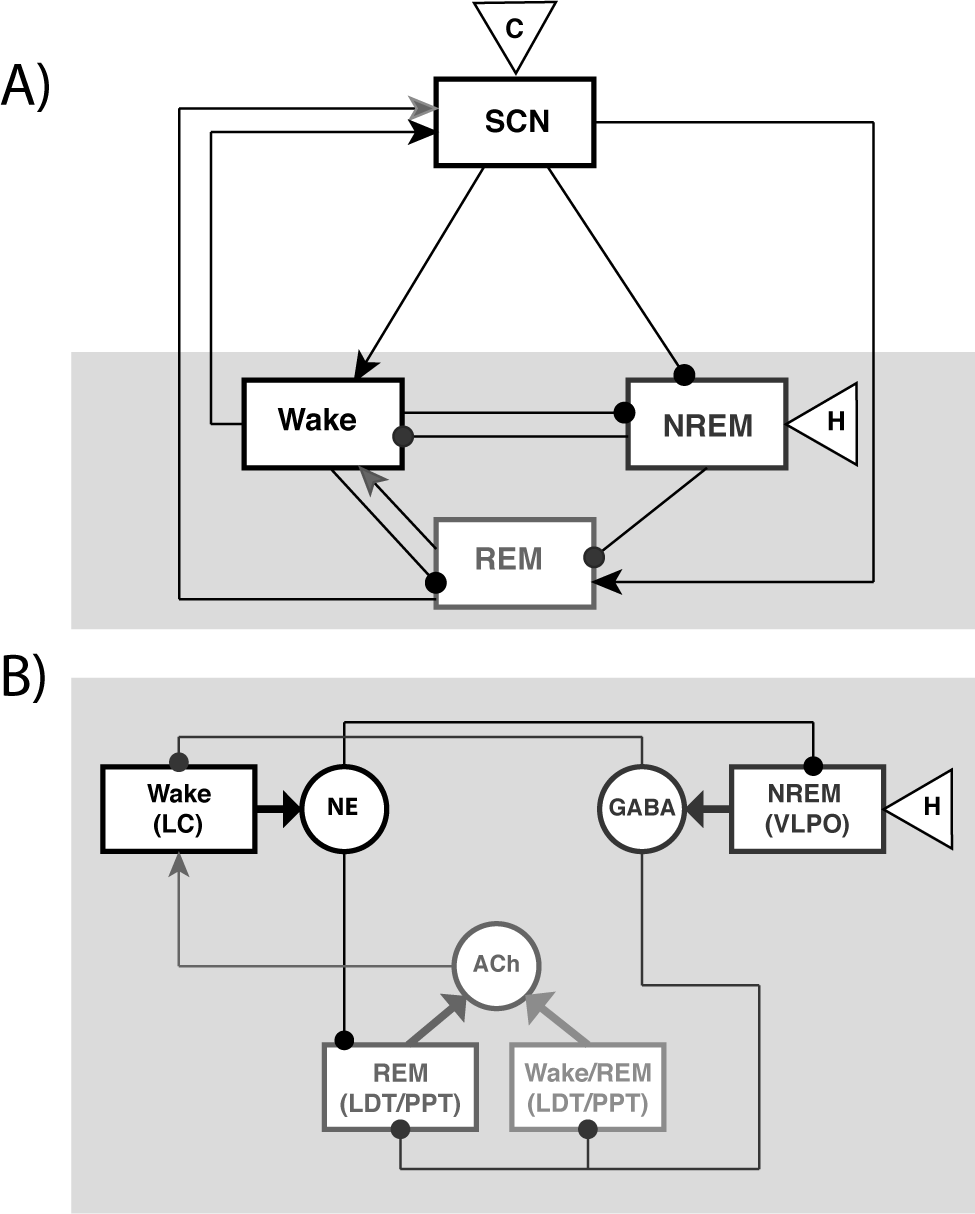
Schematic of the sleep-wake regulatory network model. (A) Reduced schematic showing synaptic projections (arrows = excitatory, circles = inhibitory) among wake-promoting, REM sleep–promoting, and NREM sleep–promoting neuronal populations, and the net feedforward and feedback interactions between these populations and the SCN. The homeostatic sleep drive, H, is incorporated by its effect on the NREM-promoting population, and SCN activity is modulated by the circadian drive C. (B) Detailed diagram of the neurotransmitter-mediated interactions among the wake-promoting, REM sleep–promoting, and NREM sleep–promoting populations (gray region in A) included in the network model (listed in Suppl. Table S1).
As in our previous model for the rat sleep-wake regulatory network (Diniz Behn and Booth, 2010; Fleshner et al., 2011), firing rates of a neuronal population FY(t) (in Hz, time in minutes) drive release of neurotransmitter ci(t) (i = N [NE] for Y = LC; i = G [GABA] for Y = VLPO; i = AR [ACh] for Y = R; and i = AWR [ACh] for Y = WR). Neurotransmitter concentration ci(t) (normalized between 0 and 1) is governed by a saturating steady-state release function
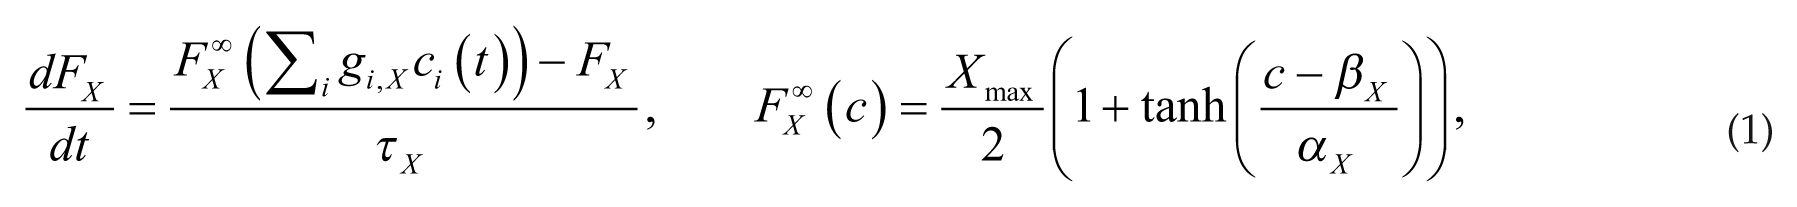
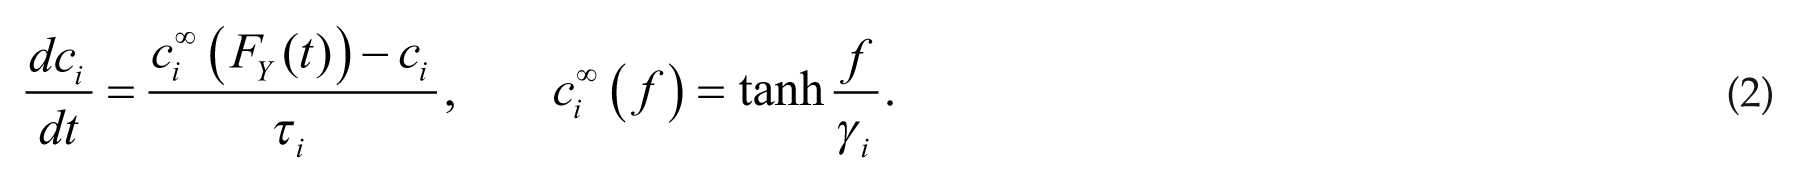
The parameters gi,X weight neurotransmitter effects on postsynaptic populations and τ X , τ i govern the time dynamics of population firing rate and neurotransmitter expression, respectively. Parameters α X , β X , and γ i dictate slope and half-activation thresholds of the steady-state firing rate and neurotransmitter expression functions. Full equations and parameter values are listed in the supplementary online material.
The homeostatic sleep drive describes the propensity for sleep that increases during time awake and decreases during sleep and is thought to involve the neuromodulator adenosine (reviewed in Basheer et al., 2004; Huang et al., 2007). We modeled the homeostatic sleep drive through the variable H(t) that approaches a maximum value (Hmax) exponentially during wake and decreases exponentially toward 0 during sleep states. Waking is determined in the model by the firing rate of the wake-promoting population FLC having values greater than the threshold θ W . The equation governing H(t) is
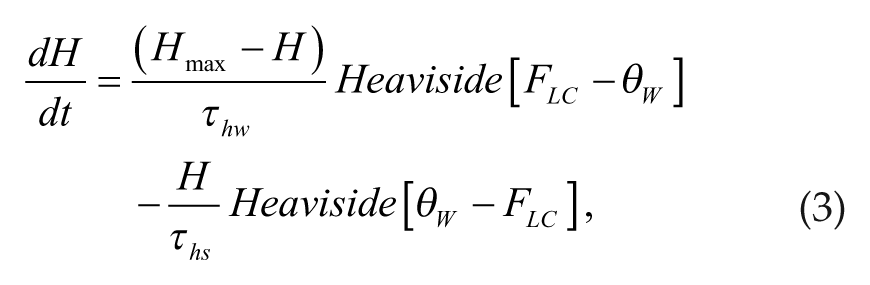
where Heaviside[Z] = 0 if Z < 0 and Heaviside[Z] = 1 if Z ≥ 0. Based on reported sleep-promoting mechanisms of adenosine (Morairty et al., 2004), the homeostatic sleep drive H(t) contributes to transitions between wake and sleep states by varying the half-activation threshold, β
VLPO
, of the VLPO steady-state firing rate function,
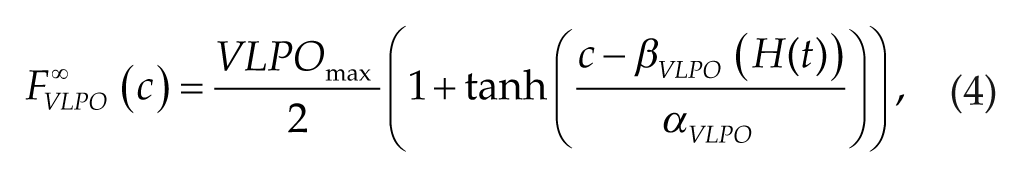
where β VLPO (H(t)) = –k·H(t) with the parameter k relating the value of H to the VLPO activation threshold. The parameters τ hw and τ hs dictate the time scale of H increase during wakefulness and decrease during sleep, respectively, and thus set the intrinsic period of the sleep-wake cycle when the sleep-wake network is uncoupled from the SCN.
Suprachiasmatic Nucleus
Our network model also includes feedforward and feedback synaptic pathways between the SCN and the brainstem and hypothalamic sleep-wake regulatory centers (see Mistlberger, 2005, for review). The majority of the feedforward projections from the SCN to sleep-wake centers are indirect, proceeding initially to the subparaventricular zone (SPZ) and continuing through the dorsomedial hypothalamus (DMH) (Aston-Jones et al., 2001; Gooley et al., 2006; Morin et al., 1994; Saper et al., 2005), although direct synaptic projections to the VLPO have been identified in the rat (Novak and Nunez, 2000). These projections are mediated by GABA and glutamate as well as multiple neuropeptides (Buijs et al., 1994, 1995; Moore and Speh, 1993; Sun et al., 2001). As in our previous model of circadian modulation of the sleep-wake regulatory network in the rat (Fleshner et al., 2011), we simplify the indirect synaptic pathway and multiple transmitters mediating SCN signaling by modeling the net synaptic signal to the postsynaptic target determined by the relays along the indirect pathway. In this way, the modeled single neurotransmitter expressed by the SCN represents the overall effect of SCN activity on downstream targets rather than the direct action of a single neurotransmitter. Anatomical studies in rodents have determined that DMH synaptic pathways target VLPO and the lateral hypothalamic area (LHA), which projects to LC, DR, LDT, and PPT (Aston-Jones et al., 2001; Chou et al., 2003; Saper et al., 2005). Less is known about the excitatory or inhibitory action of these projections on the sleep-wake centers in humans. However, behavioral and physiological evidence supports a wake-promoting and sleep-inhibiting role for SCN activity in primates (Edgar et al., 1993) and humans (Abrahamson et al., 2001). Thus, we model the net projection from SCN through the LHA to the wake-promoting (LC) and REM-promoting (LDT/PPT) populations as excitatory and the net projection from SCN to VLPO as inhibitory (Fig. 1). By specifying modeled effects of SCN activity on sleep-wake centers opposite to those proposed in our previous model for circadian regulation of sleep in the rat, we account for the diurnality/nocturnality differences between humans and rats while maintaining an appropriate relationship between SCN firing rate and time of day. Physiologically, this putative reversal of SCN effects probably occurs as the signal is relayed through the DMH (Chou et al., 2003).
Experimental work has identified feedback projections from the sleep-wake network to the SCN (Bina et al., 1993; Moore et al., 1978). The effect of these projections is apparent in the dependence of SCN firing rate on vigilance state observed in rodents (Deboer et al., 2003): SCN firing rate increases during wakefulness and REM sleep states and decreases during NREM sleep states. We assume that similar feedback projections exist in humans, and we model this effect by including excitatory monoaminergic inputs from the wake-promoting population and excitatory cholinergic inputs from the LDT/PPT to the SCN population (Fig. 1).
Firing rate activity in the SCN and the expression dynamics of its neurotransmitter are modeled as in Equations 1 and 2 above with X = SCN and i = SCN for Y = SCN. Effects of FSCN activity are integrated into the sleep-wake network by the inclusion of cSCN, multiplied by a weighting parameter gSCN,X, in the arguments of the steady-state firing rate functions
Circadian Oscillator
The circadian drive C(t) is modeled with the simplified circadian oscillator model of Forger et al. (1999) with the time units adjusted to minutes. The model consists of modified van der Pol equations that describe the 24-h circadian rhythm and its response to light input signals. In our simulations, we assume that light is gated by the sleep-wake cycle: Light intensity I(t) was set to 600 lux during waking episodes and 0 lux during sleep states. The circadian drive, C(t), oscillates between −1 and +1 with a period of 24.2 h and induces rhythmic increases and decreases in SCN firing rate, FSCN. This rhythmic variation in firing rate simulates the experimental observations in both nocturnal and diurnal animals that the overall firing rate of SCN neurons is generally higher during the light period and generally lower during the dark period (Gillette and Reppert, 1987; Schaap et al., 2003; Schwartz et al., 1983). While some subpopulations of SCN neurons show different firing profiles (Belle et al., 2009; Jagota et al., 2000; Schaap et al., 2003), we assume that SCN signaling is mediated by its average firing rate. The equations governing C(t) and the complementary variable xc are as follows:
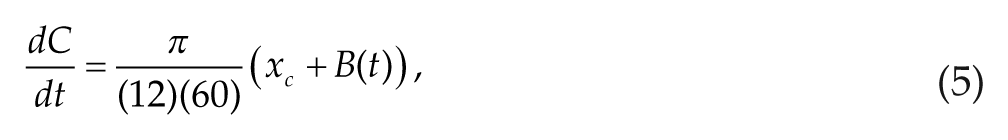
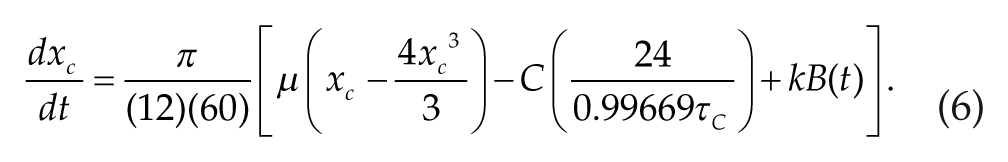
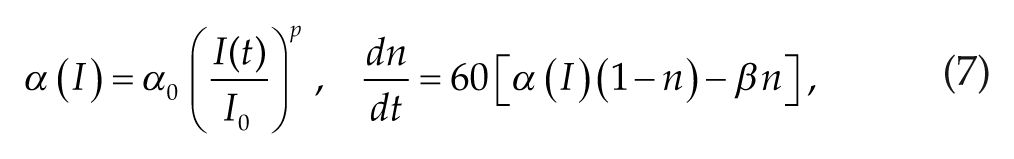
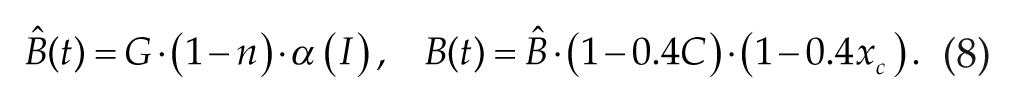
The parameters τ c and µ describe the intrinsic period of the circadian oscillator and its stiffness, respectively. The term B(t) allows for a direct effect of light on the circadian rhythm. Through the following equations, the light input I(t) is transformed to B(t) in order to take into account time-dependent modulation of circadian rhythm responses to photic stimuli and circadian modulation of rhythm sensitivity to photic stimuli (Forger et al., 1999):
Model Simulation and Analysis
Behavioral state was interpreted by applying thresholds to population firing rates. Specifically, the model was considered to be in the wake state when FLC was greater than θ w = 1 Hz; otherwise, it was considered to be in sleep. REM sleep was defined to occur when the firing rate of the REM-promoting population was greater than 2 Hz. Generally, parameter values were similar to those used in our previous model for rat sleep, with the exception of the conversion of time units to minutes and alterations to parameters governing time scales of the homeostatic sleep drive and REM bout duration to obtain basic human sleep characteristics. Model simulations were run in XPPAUT (http://www.math.pitt.edu/~bard/xpp/xpp.html) using a variable step-size fourth-order Runge-Kutta algorithm. Analyses of model results were computed in Matlab (Mathworks, Natick MA). Full equations and parameter values are listed in the supplementary online material.
Results
Synchronized Sleep-Wake and Circadian Rhythms
The sleep-wake regulatory network model replicated stereotypical human sleep patterning in the absence of external time cues with a period of 24.21 h, consisting of 15.98 h in waking and 8.23 h in sleep (Fig. 2). The circadian rhythm, as represented by the SCN firing rate, was synchronized with the sleep-wake rhythm such that maximum SCN firing rate occurred during wake, and the minimum occurred near the end of the sleep episode. This synchronized sleep-wake pattern was obtained when the period of the isolated SCN was 24.2 h and the intrinsic period of state transitions in the sleep-wake network when uncoupled from the SCN (so that transitions were solely dictated by the homeostatic sleep drive H) was 20.59 h. REM sleep patterning was characteristic for human sleep with 4 REM episodes per night, ranging in duration from 28.2 to 30.4 min, and 24.3% of total sleep time spent in REM sleep (Fig. 2B). Durations of the first 3 REM bouts increased, with the largest increase occurring from the first to the second episode, and the last episode showed a slight decrease in duration (Fig. 2C). The longest REM bouts occurred at the same time as the minimum of the circadian rhythm. Periods of NREM/REM cycles ranged from 102.13 to 107.43 min across the night. Overall, these sleep characteristics are within the range of values observed in normal human sleep (Carskadon and Dement, 2011; Clausen et al., 1974). REM bout durations and NREM/REM cycle times are slightly longer than reported due to the constraints of replicating statistical averages of REM sleep behavior with a deterministic model. Specifically, to obtain 4 NREM/REM cycles over the course of an 8.23-h sleep episode required NREM/REM cycle times of longer than the typically stated 90-min NREM/REM cycle duration. If the deterministic model had 90-min NREM/REM cycle durations, 5-6 REM bouts would be necessary in an 8-h sleep episode.
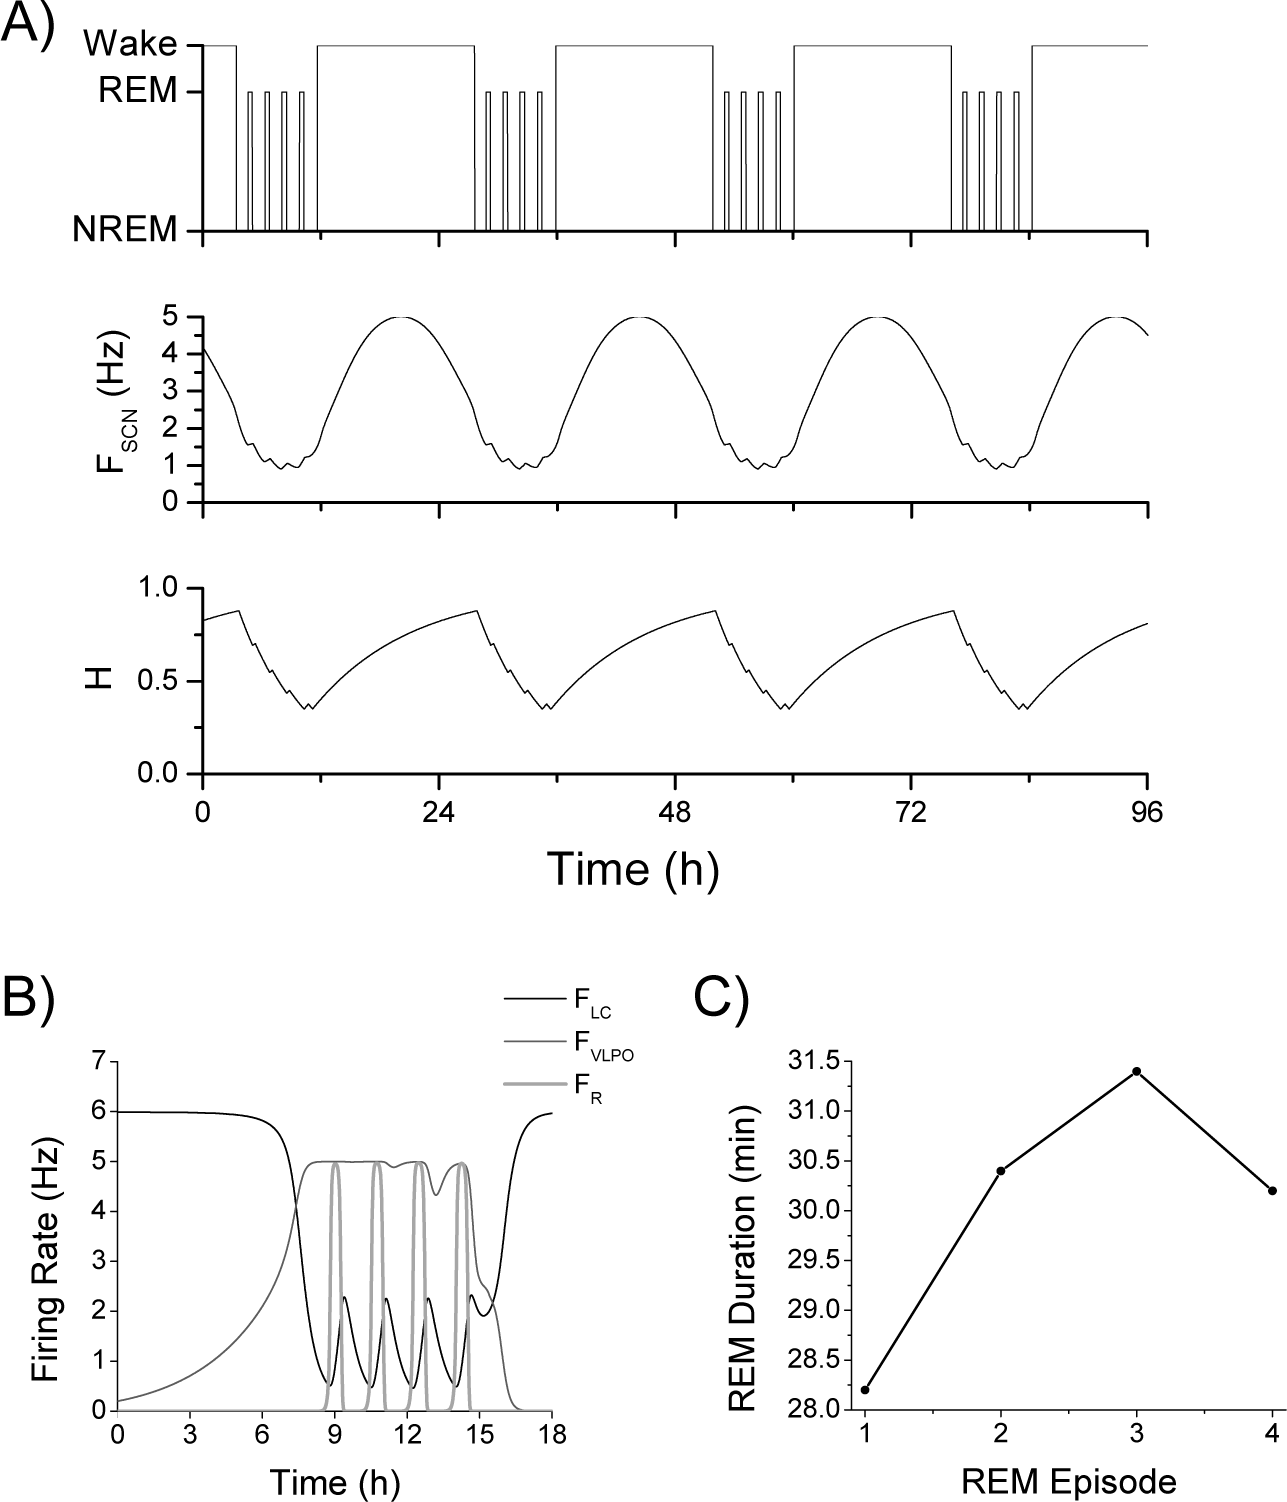
Synchronized sleep-wake and circadian rhythms. (A) Time trace of a hypnogram summarizing simulated sleep-wake behavior (upper panel); the firing rate (in Hz) of the SCN (FSCN, middle panel); and homeostatic sleep drive (H, lower panel). The sleep-wake cycle and the circadian cycle are synchronized with minimum SCN activity occurring during sleep episodes. (B) Time traces of simulated firing rates (in Hz) of representative wake-promoting (FLC, thin black), NREM sleep–promoting (FVLPO, thin gray), and REM sleep–promoting (FR, thick light gray) populations during a sleep episode. Four REM bouts occurred as indicated by increases in the firing rate of the REM-promoting population. (C) REM bout durations increased over the course of the sleep episode, with the largest increase occurring from the first to second REM bout.
The change in REM bout durations throughout the night resulted from interactions of the SCN with the wake- and REM-promoting populations and the structure of the sleep-wake network. The network structure is based on the reciprocal interaction hypothesis for REM sleep generation. In this structure, REM bouts initiate due to excitability of the REM-promoting population and are terminated by feedback inhibition from the wake-promoting population. Thus, REM bout durations are primarily determined by the time course of ACh-induced activation of the wake population. SCN activity has an excitatory effect on both the wake- and REM-promoting populations, thus contributing to their excitability and ability to activate. As SCN firing rate decreased during the beginning of the sleep episode, its decaying excitation to the wake- and REM-promoting populations decreased their excitability and particularly attenuated the ACh-induced activation of the wake population during REM sleep. While it might be expected that decreased SCN excitation to the REM-promoting population would tend to shorten REM bouts, REM bouts were lengthened due to weakened feedback inhibition from the wake-promoting population. At the end of the sleep episode, the SCN firing rate started to increase, thus increasing excitation to the wake-promoting population; this resulted in stronger feedback inhibition to the REM-promoting population and a shorter last REM episode.
Spontaneous Internal Desynchrony
To induce spontaneous internal desynchrony in response to temporal isolation, we implemented the mechanisms suggested by Kronauer et al. (1982) and increased the intrinsic period of the sleep-wake cycle governed by the homeostatic sleep drive H (Fig. 3). Both the rise and decay rates of H were increased logistically such that the intrinsic period of the sleep-wake cycle (when uncoupled from the SCN) increased slowly over the course of several weeks from 20.59 h to 25.52 h, reaching a saturating level by day 60 (data not shown). In the SCN coupled network, the interaction between the SCN and the sleep-wake network maintained synchronization of sleep-wake and circadian cycles during the first 12 days of simulated temporal isolation, with a mean period of 24.70 h (Fig. 3B). As the period of the synchronized cycles increased, sleep onset occurred at later circadian phases, as has been observed experimentally (Czeisler et al., 1980a; Wever, 1979; Zulley et al., 1981). The sleep-wake period reached about 25 h before showing daily small amplitude fluctuations starting on day 13 similar to those observed during phase trapping (Kronauer et al., 1982). During phase trapping, the mean period of the sleep-wake rhythm (25.74 h), defined as the interval between wake episodes, was similar to the mean period of the circadian rhythm (25.14 h), defined by the interval between minima of the SCN firing rate. On day 25, the sleep-wake rhythm and the circadian rhythm became desynchronized and each ran with a different mean period (sleep-wake, 29.23 h; circadian, 24.48 h). As noted by Kronauer et al. (1982), the maximum period of the sleep-wake cycle during phase trapping (27.75 h) was roughly the same duration as the minimum sleep-wake cycle duration during desynchrony (26.92 h). During desynchronized behavior, the longest sleep-wake cycles were nearly 33 h in duration, while the shortest cycles were roughly 28 h long. The circadian period shortened following desynchrony, which has also been observed experimentally (Czeisler et al., 1999).
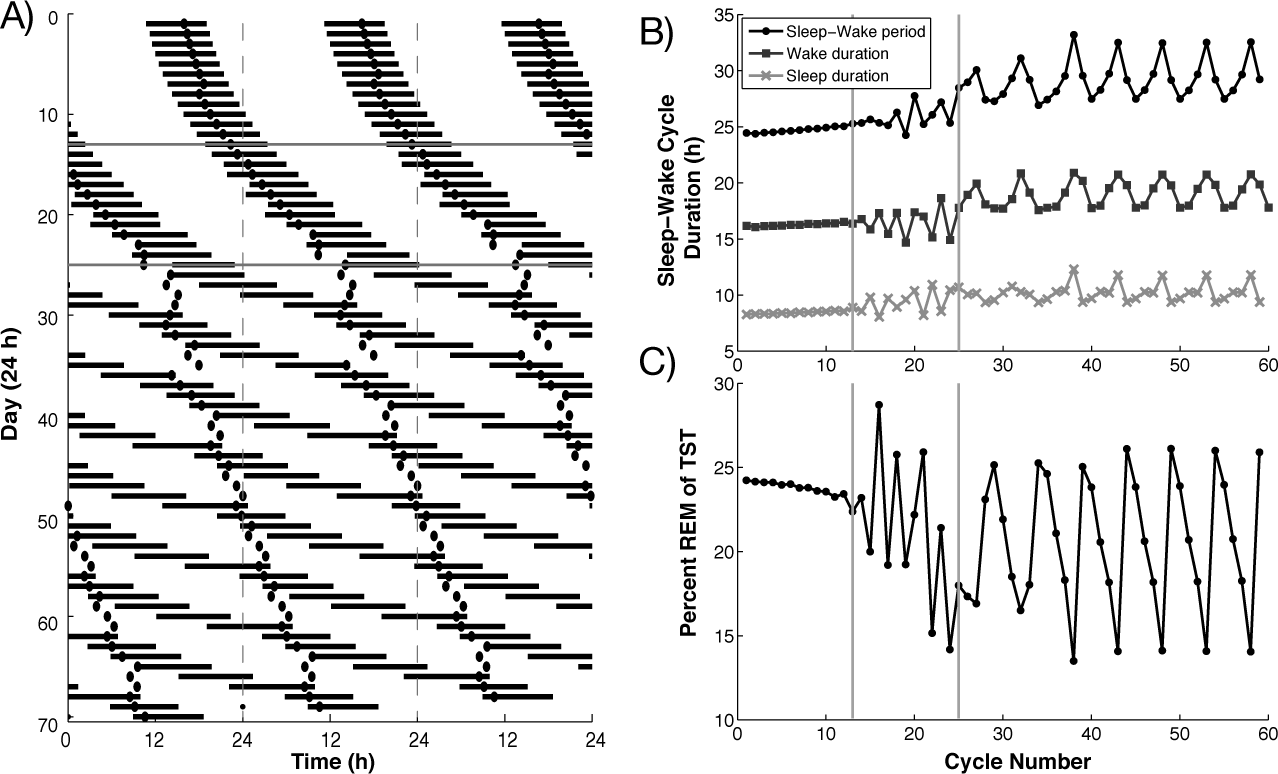
(A) Actogram for simulated evolution to spontaneous internal desynchrony under temporal isolation conditions (dark horizontal lines indicate sleep episodes, dots indicate SCN firing rate minima, vertical dashed lines indicate 24 h). Effects of temporal isolation were simulated by increasing the intrinsic period of the sleep-wake cycle from 20.59 h to 25.52 h with a logistic profile reaching saturation near day 60. Phase-trapping behavior commenced at day 13 and desynchrony at day 25 (horizontal gray lines). (B, C) The sleep-wake cycle period (B: black circles), wake durations (B: dark gray squares), and sleep durations (B: light gray xs), and percentage of sleep time spent in REM (C) during the evolution to spontaneous internal desynchrony. Vertical gray lines indicate onset of phase trapping at day 13 and of desynchrony at day 25. Cycles were defined by the onset of wake episodes.
Circadian Modulation of REM Sleep
The percentage of each sleep-wake cycle spent in sleep remained fairly constant throughout the evolution to desynchrony, with an average value of 35%, coinciding with experimental observations (Weitzman et al., 1980). Sleep percentage maintained consistency across sleep-wake cycles of varying periods because the longest sleep episode usually occurred in the same sleep-wake cycle as the longest wake episode. By contrast, the percentage of total sleep time spent in REM sleep showed much more variability in the phase trapping and desynchrony regimes, varying between 14% and 26% during the latter (Fig. 3C).
This variability reflects a strong dependence of timing and characteristics of REM sleep on circadian phase, consistent with experimental observations (Czeisler et al., 1980b) (Fig. 4). REM bout durations were longest near minimum SCN firing rates or just before 360° circadian phase, due to minimal SCN excitation to the wake-promoting population as described above (Fig. 4A). Consistent with this explanation, the shortest REM bouts occurred near 180° circadian phase, determined by SCN firing rate maxima, when SCN excitation to the wake-promoting population was strongest.
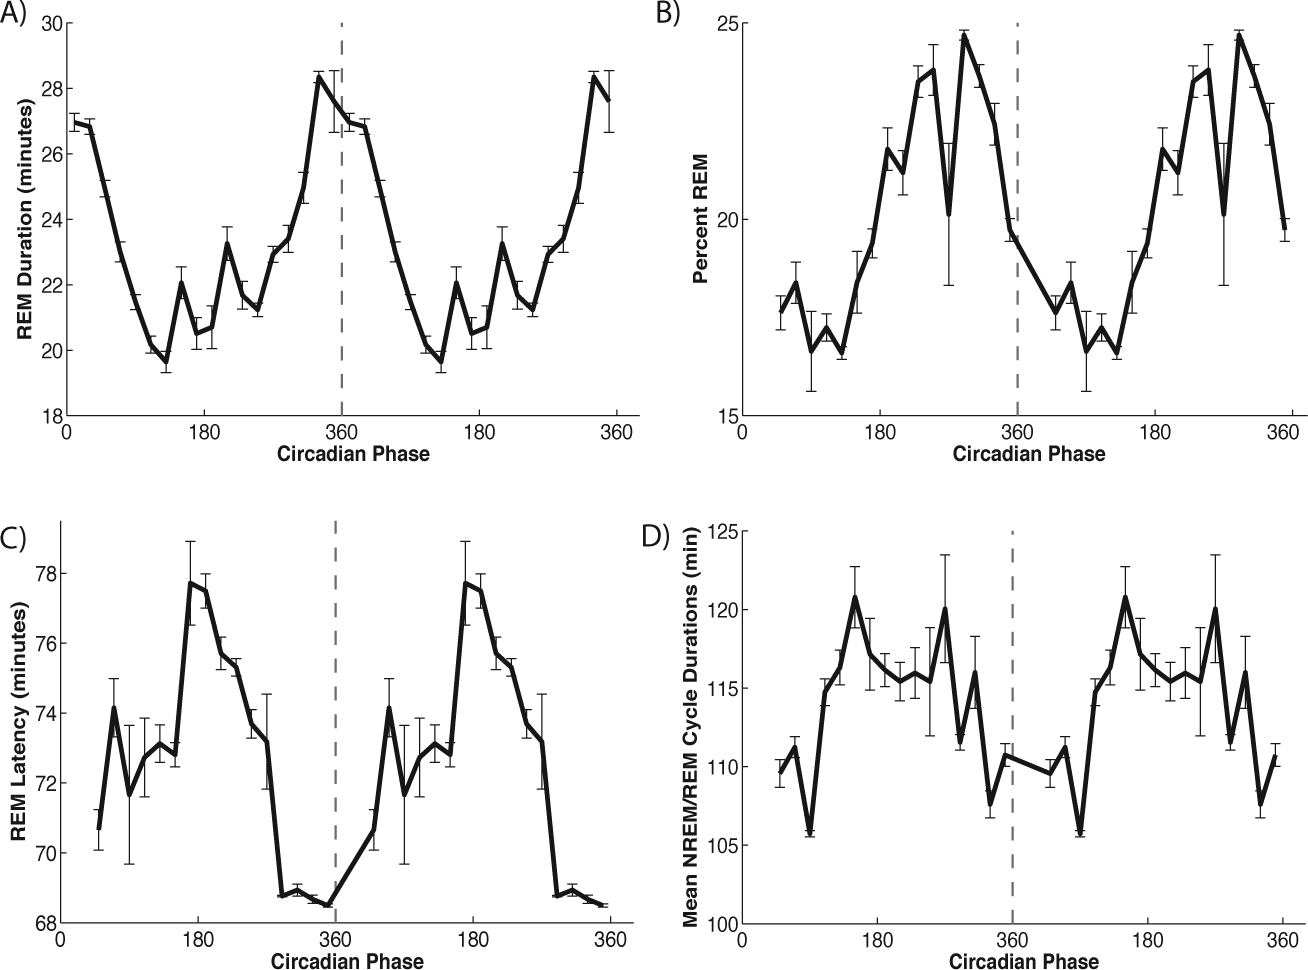
Circadian modulation of REM sleep during internal desynchrony behavior. (A) REM bout durations as a function of circadian phase at start of bout. (B, C, D) Percentage of sleep time spent in REM (B), latency to first REM bout during sleep episode (C), and mean NREM/REM cycle duration (D) as a function of circadian phase at start of sleep episode. Circadian phase was calculated as the phase relative to the SCN minimum (0°/360°). No sleep episodes initiated between 0° and 40°.
The variation in percentage of REM sleep showed a similar dependence on circadian phase (Fig. 4B). During desynchrony, the highest percentage of REM sleep occurred when sleep was initiated near 300° circadian phase so that the minimum of the SCN firing rate coincided with the end of the sleep episode. When sleep was initiated at this phase, as in the synchronized sleep-wake state (Fig. 2), the SCN firing rate decayed during the sleep episode. Although this represents a decrease in direct excitation of the REM-promoting population by the SCN, the concurrent decrease of SCN-mediated excitation to the wake-promoting population decreased the strength of the feedback-inhibition from the wake-promoting population to the REM-promoting population. As a result, REM durations increased through the sleep episode. Conversely, REM sleep percentage was least when sleep was initiated near 90° circadian phase and the SCN firing rate reached its maximum during the sleep episode.
Latency to first REM bout showed approximately opposite circadian dependence compared with REM bout duration (Fig. 4C). Latency was shortest when sleep episodes commenced just before 360° and the SCN minimum. At this circadian phase during sleep, inhibition to the REM-promoting population was at its lowest level due to low SCN excitation to the wake-promoting population. Thus, the REM-promoting population was able to activate more readily upon initiation of the sleep episode.
The average duration of the NREM/REM cycle also showed circadian variation with approximately the same phasing as REM latency (Fig. 4D). Average cycle durations across the night ranged from 106 to 121 min with the shortest cycles occurring in sleep episodes commencing just before 360° and the SCN minimum. Interestingly, although REM bout durations were longest at these circadian phases, short REM latencies led to overall shorter NREM/REM cycle times.
Individual Differences in Desynchrony Patterns
A range of individual desynchrony patterns have been observed in spontaneous internal desynchrony experiments (Wever, 1979), and our model is able to reproduce many of these reported desynchrony patterns by varying several key parameters: the effects of temporal isolation on the intrinsic period of the sleep-wake cycle and the strength of interactions between the SCN and sleep-promoting populations.
Under temporal isolation conditions, several different bicircadian rhythms have been observed in humans in which the circadian rhythm and sleep-wake cycle oscillate with an approximate 2:1 frequency mode, namely 2 circadian cycles for each sleep-wake cycle (Wever, 1979). In all of these cases, bicircadian rhythms were associated with sleep-wake cycle periods of roughly 48 h with a doubly long waking period. For some subjects, the sleep episode was of fairly normal duration, while others displayed doubly long sleep episodes (Wever, 1979). By lengthening the sleep-wake period in our model, we obtained bicircadian patterns in which the length of the sleep episode was sensitive to the strength of the inhibitory effect of the SCN on the VLPO, governed by the parameter gSCN,VLPO (Fig. 5A, B). In these simulations, the model exhibited stable synchronized sleep-wake patterning in the range of normal sleep characteristics for the initial 10 days (see Suppl. Table S5). At day 11, the intrinsic period of the sleep-wake cycle was altered to induce the desynchronized sleep-wake pattern (parameter values in Suppl. Table S4). When gSCN,VLPO was larger (increased inhibition), a regular bicircadian rhythm was obtained when the intrinsic period of the sleep-wake network (when uncoupled from the SCN) was increased to 34.45 h. In this bicircadian rhythm, the average sleep-wake cycle was 48.13 h, with sleep durations of 11.24 h and wake durations of 36.89 h, and the SCN firing rate period remained fairly steady, alternating between 23.83 and 24.09 h (Fig. 5A). By contrast, when gSCN,VLPO was smaller (weaker inhibition), a regular bicircadian rhythm was not evident until the intrinsic period of the sleep-wake network was lengthened to 44.4 h. In this bicircadian rhythm, the sleep-wake cycle was 48.73 h long, with 33.20 h of wake and a longer sleep episode of 15.53 h (Fig. 5B). The mean period of the SCN firing rate was 24.15 h. In both these bicircadian patterns, SCN firing rate and sleep-wake activity were fairly well synchronized in an approximate 2:1 frequency mode with the SCN minimum occurring at approximately fixed phases of the sleep episodes.
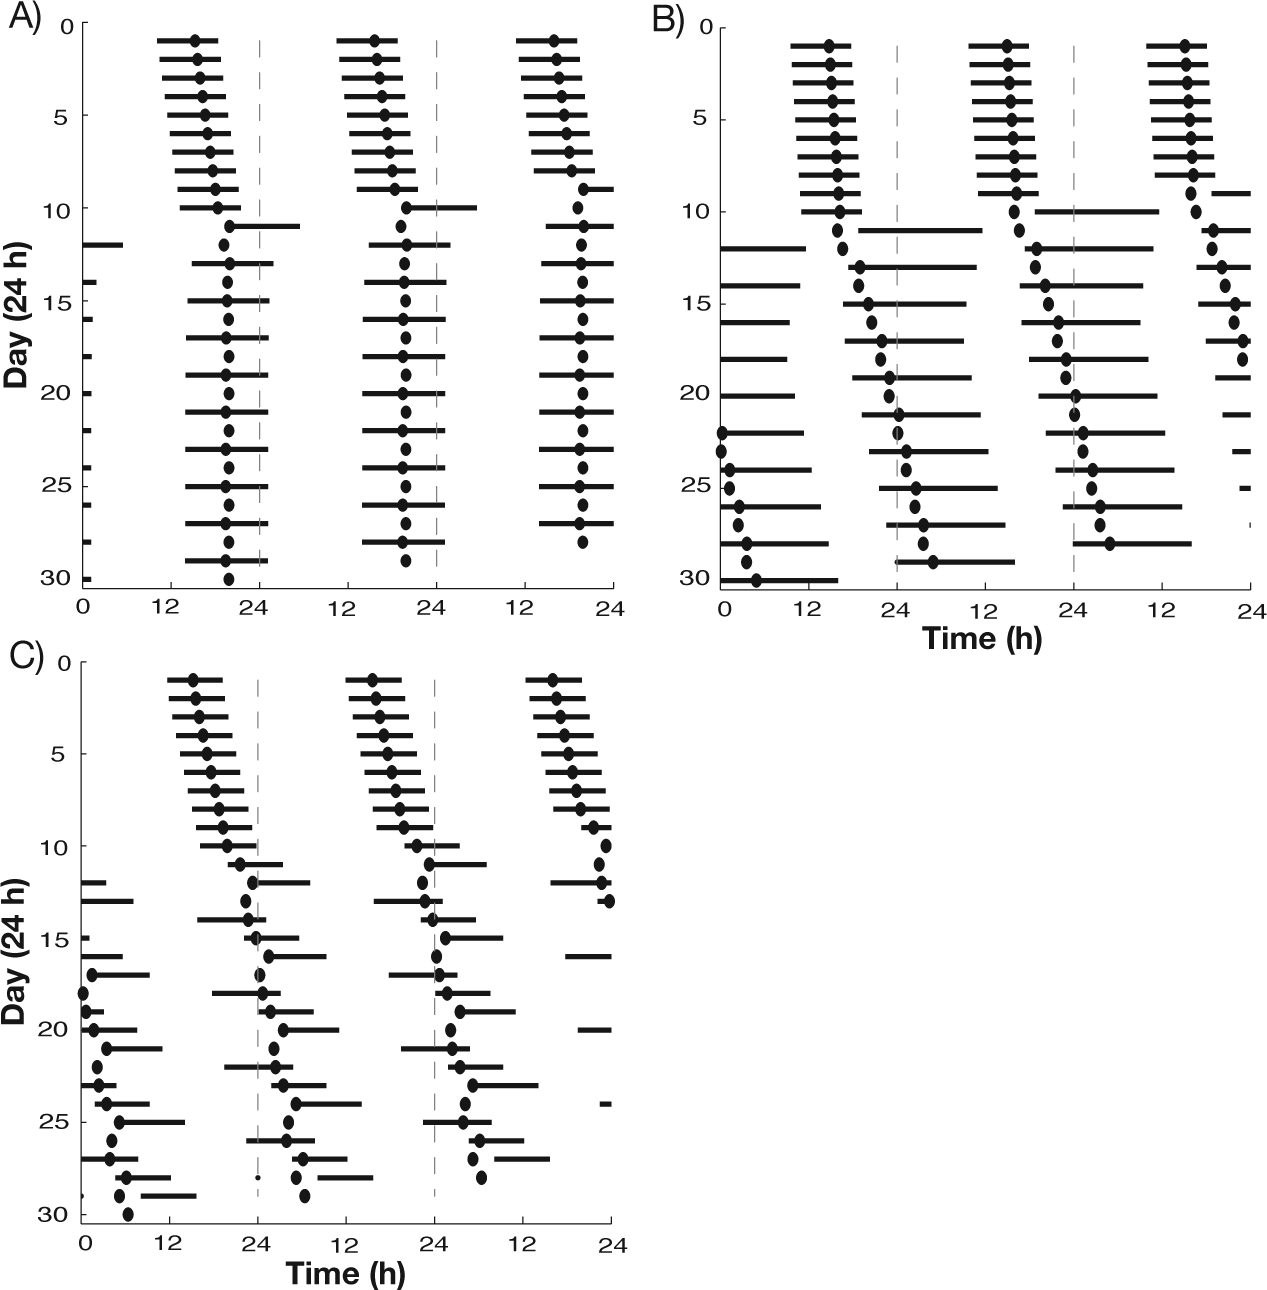
Actograms showing variations in bicircadian (A, B) and “phase jump” (C) desynchronized behaviors in response to different increases in intrinsic sleep-wake cycle period and differences in the strength of inhibition from the SCN to the NREM-promoting population (dark bars represent sleep episodes, dots represent SCN firing rate minima). Prior to day 10, all cases exhibited stereotypical synchronized sleep-wake patterns (Suppl. Table S5). On day 11, the sleep-wake cycle period was increased to induce desynchrony (parameter values in Suppl. Table S4). When inhibition from the SCN to the NREM-promoting population is strong (A: gSCN,VLPO = 0.25), bicircadian behavior exhibits sleep durations of approximately normal duration; when this inhibition is weak (B: gSCN,VLPO = 0.1), sleep durations are doubled. Stronger SCN inhibition results in phase jump desynchrony (C: gSCN,VLPO = 0.3).
Interestingly, changes in the strength of gSCN,VLPO can also account for other reported responses to temporal isolations conditions. In some cases, temporal isolation conditions caused subjects to show regular sleep-wake cycles with a period slightly greater than 24 h, but with an occasional long wake episode leading to a “phase jump” in circadian phase (Wever, 1979). For larger values of gSCN,VLPO, our model replicated this desynchronized pattern with occasional long wake episodes when the intrinsic period of the sleep-wake network was increased to simulate temporal isolation (Fig. 5C). In this pattern, the mean sleep-wake cycle duration in the regular cycles was 27.11 h, with average sleep and wake durations of 7.9 h and 19.8 h, respectively. During the phase jump cycles, the mean sleep-wake cycle duration increased to 41.43 h with an average of 32.10 h in wake, while the sleep durations showed little increase. The circadian period alternated between 23.24 h and 25.45 h, leading to almost 2 circadian cycles occurring during a single phase jump cycle.
To understand the dependence of these behaviors on the strength of gSCN,VLPO, we consider the role of gSCN,VLPO in modulating network dynamics. In the model, larger values of gSCN,VLPO generally promoted the occurrence of bicircadian cycles due to increased inhibition to the VLPO throughout the circadian cycle. Since SCN inhibition to the VLPO acts in opposition to the effects of the homeostatic drive H, the decay in SCN firing rate usually allows H to induce a transition from wake to sleep. When SCN inhibition is stronger, however, it can prevent a homeostatically induced transition to sleep during the minimum of the circadian cycle. As SCN firing rate increases past its minimum, the increase in SCN inhibition to VLPO and excitation to LC promotes LC activation and extends the wake bout through a second circadian cycle. Due to these effects, larger gSCN,VLPO values led to regular bicircadian rhythms for smaller increases in the intrinsic period of the sleep-wake network, resulting in the shorter sleep episodes in the pattern in Figure 5A compared with that in Figure 5B and the occurrence of phase jump cycles in desynchronized rhythms (Fig. 5C). These model results predict that different bicircadian patterns and phase jump behavior reflect interindividual variations of the same underlying mechanism.
Large differences have been reported in the time required for different subjects to reach the desynchronized state (Wever, 1979). While differences in the rate of increase of the sleep-wake cycle period in response to temporal isolation will certainly affect the time to desynchrony, in our model, given a fixed linear increase of the intrinsic period of the sleep-wake network, the number of days necessary for the sleep-wake network and SCN activity to become desynchronized depended on the strength of SCN excitation to the REM-promoting population, governed by the parameter gSCN,R (Fig. 6). For larger values of gSCN,R (increased excitation), the sleep-wake network and SCN activity remained synchronized for a larger range of intrinsic sleep-wake periods. For example, for gSCN,R = 0.2 (Fig. 6A), when the intrinsic sleep-wake period was increased at a fixed linear rate, desynchronization occurred around day 25, after a number of days showing phase-trapping behavior. With gSCN,R increased to 0.5 (Fig. 6B), desynchrony did not occur until day 50 in response to the same linear change in intrinsic sleep-wake period. With this higher value of gSCN,R, the overall sleep-wake period showed less variation before desynchrony occurred, as illustrated by the relatively constant slope of sleep onset times in the actogram for this case. Additionally, phase trapping, characterized by daily variations in sleep onset times, did not occur. These results indicate that in our model, SCN input to the REM-promoting population can act indirectly to promote synchronization of the SCN with activity of the VLPO and LC, which dictates sleep onset and offset. Analysis of model results suggests that the direct effect of SCN excitation to the REM-promoting population is to shorten REM latency and inter-REM intervals during sleep episodes. Through network interactions of REM-induced LC activation and homeostatic regulation of VLPO activation, shorter NREM-REM cycling acts to shorten sleep episodes, thus promoting maintenance of synchronized rhythms as the period of the sleep-wake network increases.
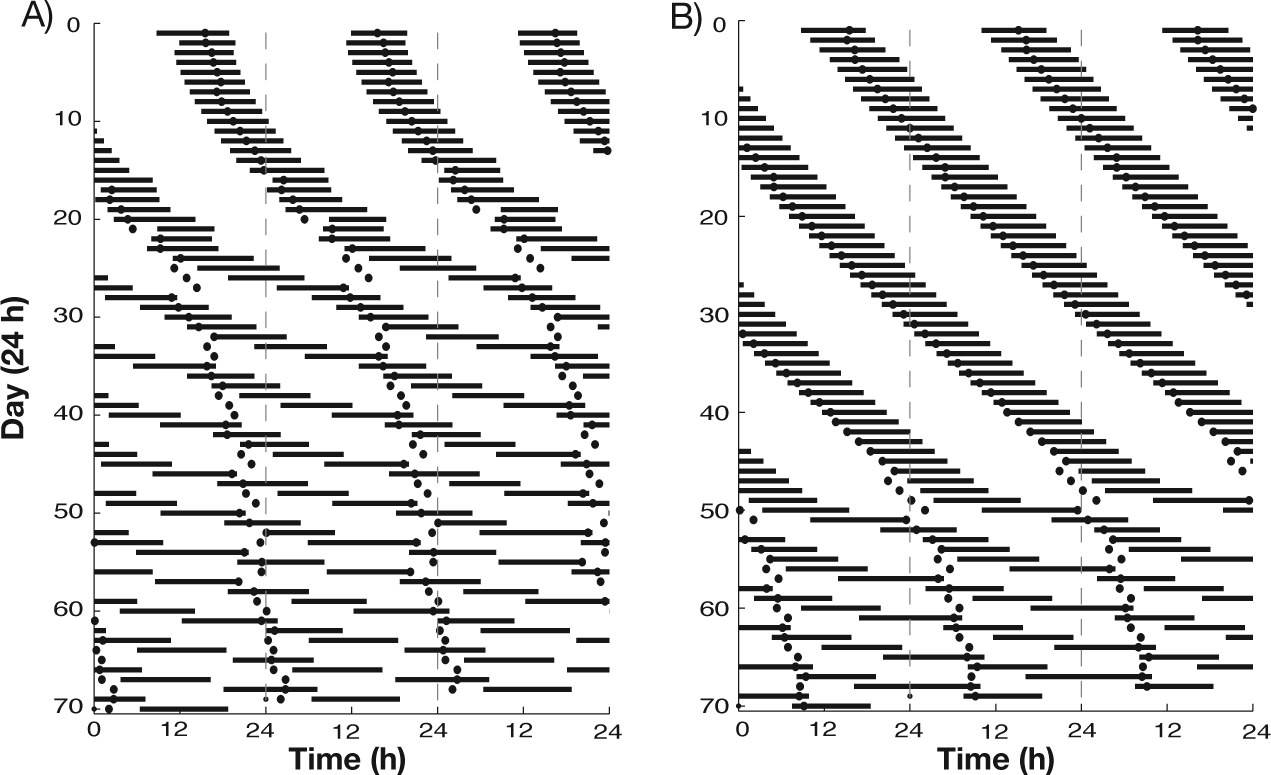
Actograms displaying variations in the evolution to internal desynchronized behavior induced by the same linear increase in the intrinsic sleep-wake cycle period for different values of the excitatory input from the SCN to the REM-promoting population (A: gSCN,R = 0.2; B: gSCN,R = 0.5; dark bars represent sleep episodes, dots represent SCN firing rate minima). For weaker SCN excitation (A), phase trapping occurred between days 13 and 24, and desynchrony began on day 25. For stronger SCN excitation (B), phase trapping did not occur, and sleep-wake and SCN activity remained synchronized longer as the difference between sleep-wake cycle and circadian cycle periods increased with desynchrony commencing around day 50.
Discussion
Integrating a physiologically based mathematical model of a putative sleep-wake regulatory network governing transitions between states of wake, NREM sleep, and REM sleep with a circadian oscillator model, we replicated typical human sleep patterns and spontaneous internal desynchrony behavior as observed under temporal isolation conditions. Under synchronized conditions, model simulations captured stereotypical normal human sleep-wake behavior, including typical NREM-REM cycling across the night. When effects of temporal isolation were simulated by increasing the intrinsic period of the sleep-wake cycle, the model replicated sleep-wake patterning of spontaneous internal desynchrony. In different parameter regimes, the model exhibited a range of desynchrony patterns similar to those observed across individuals in temporal isolation experiments. Specific patterns depended on the level of increase in the intrinsic period of the sleep-wake cycle and the strength of interactions between the SCN and the sleep-wake centers. Importantly, all the model parameter sets yielding these behaviors produced sleep-wake characteristics within normal ranges under synchronized conditions (see Suppl. Table S5). The different patterns of behavior became apparent only when the effects of temporal isolation on sleep-wake cycle period were simulated.
As discussed below, internal desynchrony has been simulated previously with different models for sleep-wake and circadian regulation. Our results build upon and expand these modeling efforts by describing transition dynamics under synchronized and desynchronized conditions among the 3 behavioral states of wake, NREM sleep, and REM sleep and by replicating the circadian dependence of multiple features of REM sleep under desynchronized conditions similar to experimental results. Furthermore, our results predict that the strength of SCN projections to sleep-promoting populations can account for interindividual differences in response to temporal isolation. Specifically, we have shown that variations in bicircadian behavior and desynchronized behavior exhibiting “phase jumps” as reported by Wever (1979) can be generated by the same underlying mechanisms and that the specific pattern observed depends on the extent of modulation of the sleep-wake cycle period as a result of temporal isolation and on the strength of SCN inhibition to the sleep-promoting VLPO. Moreover, our results indicate that SCN modulation of REM-promoting centers can affect synchronization of sleep-wake behavior with the circadian rhythm indirectly through network dynamics: Stronger SCN excitation to the REM-promoting population maintained synchronization for more disparate periods of the sleep-wake and circadian cycles and affected the occurrence of phase trapping.
In this deterministic model, we focused on qualitatively replicating the key features of human sleep-wake behavior when synchronized with and when desynchronized from the circadian rhythm. Our model successfully replicated these features when parameter values were only slightly adjusted from those used in previous work simulating rat and mouse sleep-wake behavior (except for the time units, which were increased to minutes from seconds) (Diniz Behn and Booth, 2010; Fleshner et al., 2011). Although the ability to describe sleep-wake behavior of multiple species is not a unique property of our model (Phillips et al., 2010b; Tamakawa et al., 2006; Tobler et al., 1992), it represents an important constraint that is relevant to model robustness. Some quantitative differences between simulated behavior and experimental observations remain: For example, our simulations do not replicate the shortest reported REM latencies that occur near the core body temperature minimum or the shortest reported REM bout durations that occur near the core body temperature maximum (Czeisler et al., 1980b). Such discrepancies, however, may reflect interindividual differences among human subjects. Extensive parameter optimization would be more appropriate when fitting the model to a specific set of experimental sleep recordings. For example, since the build-up of homeostatic sleep pressure, and presumably the effects of temporal isolation on sleep-wake cycle period, are age-dependent (Dijk et al., 1999), fitting the model to data from temporal isolation experiments with subjects of different ages may provide additional constraints on model structure and assumptions. Nevertheless, our simulation results predict physiologically plausible mechanisms for the interindividual variations in desynchronized sleep-wake behavior and suggest targets for future experimental studies of the physiological mechanisms affected by temporal isolation.
Modeling Spontaneous Internal Desynchrony
Internal desynchrony has been simulated previously with different models for sleep-wake and circadian regulation but with similar mechanisms as used here, namely modulation of sleep-wake cycle period and the amplitude of the circadian signal. Each of these previous modeling studies has captured specific features of internal desynchrony. Kronauer et al. (1982) investigated desynchrony in a coupled oscillator model with the circadian drive and sleep-wake dynamics both modeled with limit cycle oscillators. Internal desynchrony was induced by increasing the period of the sleep-wake oscillator, and the model displayed desynchrony with a long sleep-wake cycle and phase trapping. In the 2-process model, reducing the amplitude of the circadian Process C that determines the upper threshold for Process S and dictates transitions from wake to sleep resulted in an internal desynchrony pattern displaying occasional skipping of sleep episodes similar to the phase jump pattern shown in Figure 5C (Daan et al., 1984). Long and short sleep-wake cycle desynchrony patterns as well as bicircadian patterns have also been simulated in the 2-process model by changing the level of the upper threshold for Process S (Daan et al., 1984; Nakao et al., 1997), where the effect of raising or lowering the upper threshold is to increase or decrease, respectively, the sleep-wake cycle period. More recently, Phillips et al. (2011) simulated internal desynchrony in a sleep-wake switch network model consisting of mutually inhibitory interactions between sleep- and wake-promoting neuronal populations under the control of circadian and homeostatic sleep drives. They replicated long and short sleep-wake cycle desynchrony and bicircadian patterns by modulating the amplitude of the circadian signal input to the sleep-promoting population and the amplitude of wake-dependent orexinergic input to the wake-promoting population. In their model, the effect of increasing or decreasing the excitatory orexinergic input to the wake-promoting population was to increase or decrease, respectively, the sleep-wake cycle period.
Our internal desynchrony simulations relate to and build upon these previous results. In addition to demonstrating the long sleep-wake cycle desynchrony with phase trapping and bicircadian patterns shown here, our model was able to replicate short sleep-wake cycle desynchrony, including a 1:2 circadian:sleep-wake cycle pattern wherein 2 short sleep-wake cycles occurred every circadian cycle (simulations not shown). These patterns were generated by simulating a shortening of the sleep-wake cycle in response to temporal isolation, similar to the mechanisms proposed by Nakao et al. (1997) and Phillips et al. (2011). While the phase jump desynchrony patterns obtained in our model and previously in the 2-process model by Daan et al. (1984) were induced by seemingly different mechanisms, the underlying dynamics of the mechanisms are, in fact, very similar (cf. Fig. 5C here and Daan et al. Fig. 10, right panel). In particular, we obtain the phase jump desynchrony pattern by increasing the period of the sleep-wake cycle and increasing the SCN-mediated inhibition to the VLPO. In the 2-process model, Daan et al. (1984) obtained the pattern by decreasing the amplitude of the circadian fluctuations of the upper threshold for Process S. Analysis of our sleep-wake network model has previously shown that the homeostatically regulated, mutually inhibitory interactions between the VLPO and LC populations define transition dynamics between sleep and wake states that are determined by a hysteresis loop (Diniz Behn et al., 2013; Diniz Behn and Booth, 2012), which is similar to the dynamics of the 2-process model. In our model, the transition from wake to sleep depends on the level of the homeostatic drive and the inhibitory inputs to the VLPO from the LC and the SCN. As described in the Results section, increased SCN inhibition to the VLPO, governed by the parameter gSCN,VLPO, can prevent the VLPO from activating and causing the transition from wake to sleep at low values of SCN firing rate. The wake episode thus continues, and the transition to sleep occurs at a later circadian phase when the increased homeostatic drive can overcome the fluctuating SCN inhibition. Likewise, in the 2-process model, when the amplitude of the fluctuating upper threshold is decreased, Process S does not reach the upper threshold at the usual circadian phase; thus, the transition from wake to sleep is prevented. The wake episode continues and the transition to sleep occurs at a later circadian phase when Process S increases further to intersect the higher threshold level. Depending on the amount of attenuation of the Process C upper threshold, the transition may occur on the following circadian cycle. In summary, our physiologically based model replicates the dynamics of the classic 2-process model and suggests alternate underlying physiological mechanisms for the phase jump desynchrony pattern.
Of the previous models for internal desynchrony, only the coupled oscillator model of Kronauer et al. (1982) exhibited robust phase trapping, and it has been argued that phase trapping is characteristic of the interaction of limit cycle oscillators with different intrinsic periods (Kronauer, 1984). Nakao et al. (1997) suggest that phase trapping may be possible in the 2-process model, but it has not been demonstrated in the 2-process model or in the sleep-wake switch network model proposed by Phillips and colleagues (2011). Phase trapping in our model is sensitive to the coupling between the oscillatory dynamics of SCN firing rate and the REM-promoting population. The reciprocal interaction network structure for REM sleep generation in our model defines limit cycle dynamics for transitions into and out of REM sleep, as previous model analysis has shown (Diniz Behn and Booth, 2012). These results indicate that phase trapping does not require oscillatory dynamics for the control of sleep-wake transitions, as occurs in the Kronauer et al. (1982) model, but may be supported by oscillatory dynamics for REM sleep generation while sleep-wake transitions are governed by hysteresis loop dynamics, or equivalently a homeostatically regulated recovery process.
Modeling the Circadian Dependence of REM Sleep
Model simulations showed a clear dependence of the timing and characteristics of REM sleep on circadian phase. These results are consistent with multiple lines of experimental evidence (Carskadon and Dement, 1980; Czeisler et al., 1980b; Dijk and Czeisler, 1995; Endo et al., 1981; Lee et al., 2009; Weitzman et al., 1980) and previous mathematical modeling of ultradian cycling (Achermann et al., 1993; Massaquoi and McCarley, 1992; McCarley and Massaquoi, 1986; Rempe et al., 2010; Tamakawa et al., 2006). In our simulations, the largest percentage of REM sleep, longest REM episodes, and shortest REM latency all occurred near the minimum of SCN activity, our marker of the circadian rhythm. In experiments, subjects in spontaneous internal desynchrony showed the highest percentage of REM sleep, longest REM episodes, and shortest REM latency just after the minimum of the core body temperature, on the rising phase of temperature’s circadian rhythm (Czeisler et al., 1980b). This difference in phase association may reflect a phase difference between the SCN activity rhythm and the core body temperature rhythm.
The neuronal mechanisms underlying transitions into and out of REM sleep are the subject of current debate, and several hypothetical networks involving different neuronal populations with REM-promoting (REM-ON) and REM-inhibiting (REM-OFF) actions have been proposed (Brown et al., 2008; Datta and Maclean, 2007; Lu et al., 2006; Luppi et al., 2006; McCarley and Massaquoi, 1992; Sapin et al., 2009). Generally, these networks reflect either mutually inhibitory interactions among REM-ON and REM-OFF centers or reciprocal interaction among these populations (McCarley and Hobson, 1975; McCarley and Massaquoi, 1986). Mathematical models of REM sleep regulation have implemented both reciprocal interaction (Behn et al., 2007; Diniz Behn and Booth, 2010; Massaquoi and McCarley, 1992; McCarley and Massaquoi, 1986; Phillips et al., 2013; Tamakawa et al., 2006) and mutual inhibition network structures (Kumar et al., 2012; Rempe et al., 2010). Simulation results, as well as more formal analyses (Diniz Behn et al., 2013), have shown that network structure has important implications for resulting sleep-wake behavior.
In the current model, we have embedded the reciprocal interaction structure for REM sleep generation in a larger network that includes physiologically based mechanisms for sleep-wake transitions and circadian modulation. In their mathematical limit cycle model of the reciprocal interaction network between REM-ON and REM-OFF populations, McCarley and Massaquoi (Massaquoi and McCarley, 1992; McCarley and Massaquoi, 1986) replicated the increase in REM sleep bout durations throughout the night as a direct result of circadian input simulated through variation of a single model parameter. In our model, by contrast, network effects involving the SCN’s influence on the wake-promoting population were the primary mechanism causing an increase in REM bout duration across the night. Thus, our model predicts that direct SCN modulation of the REM-promoting population does not significantly influence REM bout durations. Sleep-wake network models with a mutual inhibition structure for REM sleep generation have a different physiological basis, but these models also suggest that circadian timing of REM sleep is a result of network modulation of the REM subnetwork rather than direct circadian input (Kumar et al., 2012; Rempe et al., 2010).
Modeling the Circadian Signal of the SCN
In our model, circadian fluctuations in SCN population activity are driven by a dynamic circadian oscillator model (Forger et al., 1999). This and other related circadian models have been used previously in work coupling physiological sleep-wake models and circadian models (Phillips et al., 2010a, 2011; Postnova et al., 2012). Although the specific choice of circadian model is not central to our results, it is necessary that the circadian model is dynamic: In contrast to a fixed sinusoidal circadian driver, a dynamic model allows the clock to receive inputs and adjust its rhythm appropriately. However, these circadian oscillator models lack much of the detail and complexity of the physiological system. In particular, the model we used exhibits limitations associated with the role of light on model behavior; the effect of feedback signaling from sleep-wake populations on the circadian clock; and the implications of multimodal signaling in projections from the SCN to sleep-wake neuronal populations. Although more detailed models of the molecular basis for the circadian clock have been developed (Forger and Peskin, 2003; Kim and Forger, 2012; Leloup and Goldbeter, 2003; Mirsky et al., 2009; Relogio et al., 2011), these models are similarly limited in their ability to incorporate physiology at the neuronal level (reviewed by Colwell, 2011). As experimental work advances our understanding of these phenomena, future work could incorporate these features into a more physiologically grounded circadian component for this model.
Physiologically, light is the primary stimulus driving the entrainment of the circadian clock. Our model formalism allows us to incorporate some effects of light; for example, externally timed light input could entrain the circadian model and induce entrained sleep-wake transition patterns in the sleep-wake network model (simulations not shown). To investigate spontaneous internal desynchrony, however, we focused on nonentrained behavior derived under conditions in which, although there was no externally timed light stimulus, subjects were able to self-select their light and dark cycles. Physiologically, such erratic light exposure may be necessary for features of spontaneous internal desynchrony since similar behaviors are not robustly observed in totally blind subjects under temporal isolation conditions (Klein et al., 1993; Klerman et al., 1998; Wever, 1979). In our model, behavioral state, in addition to gating light input, also has a direct effect on SCN firing rate through feedback projections from wake- and REM-promoting populations. The physiological relationship between SCN neuronal activity and the intrinsic molecular clock remains to be elucidated, but it probably has implications for the effects of these feedback inputs on the circadian clock. Similarly, plasticity in the human circadian pacemaker, such as the changes in intrinsic circadian period following entrainment to the Martian sol (Scheer et al., 2007), may play a role in desynchronized behaviors. Future work linking such effects on the circadian clock to increases in the period of the sleep-wake cycle, perhaps as a progressive phase delay in the circadian pacemaker (Czeisler et al., 1980a; Klerman et al., 1996; Zulley et al., 1981), would represent an important advance in the physiological grounding of coupled sleep-wake and circadian models.
The synaptic pathways mediating the propagation of the circadian rhythm generated in the SCN to the brainstem and hypothalamic neuronal populations involved in sleep-wake regulation are complex and involve multiple neurotransmitters and neuropeptides (Aston-Jones et al., 2001; Buijs et al., 1994, 1995; Gooley et al., 2006; Moore and Speh, 1993; Morin et al., 1994; Saper et al., 2005; Sun et al., 2001). For simplicity, we modeled SCN signaling as a direct pathway with a single neurotransmitter, and this was able to account for the circadian modulation of the human sleep patterns we investigated here. In previous work focusing on circadian modulation of sleep-wake regulation in the rat, we implemented multimodal signaling involving neurotransmitters and neuropeptides to account for sleep-wake behavior synchronized with the circadian rhythm as well as changes in sleep-wake behavior observed in the rat after SCN lesion (Fleshner et al., 2011). While multimodal SCN signaling most likely occurs physiologically, in the absence of definite experimental results to constrain possible signaling mechanisms, we kept our model’s signaling mechanisms as simple as possible in this study. Future work investigating effects of different SCN signals on the circadian modulation of sleep-wake behavior would be necessary to identify more physiologically appropriate models for SCN signaling in humans.
Footnotes
Acknowledgements
The authors thank Daniel Forger and Andrew Phillips for helpful discussions. This work was funded in part by NSF DMS-1121361.
Conflict of Interest Statement
The author(s) declared no potential conflicts of interest with respect to the research, authorship, and/or publication of this article.
References
Supplementary Material
Please find the following supplemental material available below.
For Open Access articles published under a Creative Commons License, all supplemental material carries the same license as the article it is associated with.
For non-Open Access articles published, all supplemental material carries a non-exclusive license, and permission requests for re-use of supplemental material or any part of supplemental material shall be sent directly to the copyright owner as specified in the copyright notice associated with the article.