
Abstract
Early attempts to characterize free-running human circadian rhythms generated three notable results: 1) observed circadian periods of 25 hours (considerably longer than the now established 24.1- to 24.2-hour average intrinsic circadian period) with sleep delayed to later circadian phases than during entrainment; 2) spontaneous internal desynchrony of circadian rhythms and sleep/wake cycles—the former with an approximately 24.9-hour period, and the latter with a longer (28-68 hour) or shorter (12-20 hour) period; and 3) bicircadian (48-50 hour) sleep/wake cycles. All three results are reproduced by Kronauer et al.’s (1982) coupled oscillator model, but the physiological basis for that phenomenological model is unclear. We use a physiologically based model of hypothalamic and brain stem nuclei to investigate alternative physiological mechanisms that could underlie internal desynchrony. We demonstrate that experimental observations can be reproduced by changes in two pathways: promotion of orexinergic (Orx) wake signals, and attenuation of the circadian signal reaching hypothalamic nuclei. We reason that delayed sleep is indicative of an additional wake-promoting drive, which may be of behavioral origin, associated with removal of daily schedules and instructions given to participants. We model this by increasing Orx tone during wake, which reproduces the observed period lengthening and delayed sleep. Weakening circadian input to the ventrolateral preoptic nucleus (possibly mediated by the dorsomedial hypothalamus) causes desynchrony, with observed sleep/wake cycle period determined by degree of Orx up-regulation. During desynchrony, sleep/wake cycles are driven by sleep homeostasis, yet sleep bout length maintains circadian phase dependence. The model predicts sleep episodes are shortest when started near the temperature minimum, consistent with experimental findings. The model also correctly predicts that it is possible to transition to bicircadian rhythms from either a synchronized or desynchronized state. Our findings suggest that feedback from behavioral choices to physiology could play an important role in spontaneous internal desynchrony.
Keywords
Attempts to measure free-running circadian period in humans shielded from temporal cues began in the 1960s (Aschoff and Wever, 1962; Mills, 1964; Aschoff, 1967; Colin et al., 1968). These experiments yielded sleep/wake cycle periods of approximately 25 hours (Wever, 1979), with sleep delayed to a later phase relative to endocrine and temperature rhythms than during entrainment to light/dark cycles (Kriebel, 1974; Wever, 1973). Curiously, after several weeks, most participants exhibited a phenomenon called spontaneous internal desynchrony (SID), in which sleep/wake cycles desynchronized from the circadian pacemaker driving endocrine and temperature rhythms (Aschoff et al., 1967). In most cases, observed circadian period (as determined by core body temperature) decreased from approximately 25.5 hours to approximately 24.9 hours, while sleep/wake cycle period increased to 28 to 68 hours (Wever, 1979). However, in about one third of cases, observed circadian period increased from approximately 24.5 hours to approximately 24.9 hours, while sleep/wake cycle period decreased to 12 to 20 hours (Wever, 1975; Wever, 1979), and in these participants, sleep was not usually delayed to a later circadian temperature phase prior to SID (Wever, 1979). In other cases, participants transitioned from a synchronized or desynchronized state to a bicircadian (48-50 hour) sleep/wake cycle (Jouvet et al., 1974).
Most of these experiments were performed in an environment free of time cues, where participants self-selected sleeping hours, light exposure, meal times, and environmental temperature (Aschoff, 1965). Today, self-selected schedules are considered unsuitable for assessing intrinsic circadian period due to the confounding effects of nonuniform exposure to phase-resetting agents (zeitgebers). For instance, participants typically chose to sleep during the advance portion of the light phase response curve (Kriebel, 1974; Wever, 1973), resulting in net circadian phase delay (Czeisler et al., 1980; Zulley et al., 1981; Klerman et al., 1996) and, thus, an apparent lengthening of observed circadian period.
Development of forced desynchrony protocols provided a more accurate means of measuring intrinsic period (Kleitman and Kleitman, 1953; Lewis and Lobban, 1957; Czeisler et al., 1990; Czeisler et al., 1999). Under recent implementations, a non–24-hour rest/activity schedule of a period to which the circadian system cannot entrain is enforced in low light conditions, resulting in decoupling of sleep/wake and circadian rhythms. Nonphotic stimuli, including meals, are also distributed across circadian phases, minimizing (but not altogether eliminating) their effects on observed period (Czeisler et al., 1990). These experiments have consistently revealed periods of approximately 24.1-24.2 hours in normal sighted individuals, with small statistical variation (Czeisler et al., 1999; Duffy et al., 2011).
However, the physiological mechanisms underlying SID and the tendency for most participants to sleep at later circadian temperature phases during self-selected schedules remain unexplained. Instructing participants to take consolidated “daily” sleep blocks could feasibly have contributed to their choosing to stay awake at higher homeostatic sleep pressure; such behavioral control has been suggested as the primary cause of desynchronized sleep (Zulley and Campbell, 1985). Time misperception may also contribute, as participants estimate their sleep/wake period to be closer to 24 hours than it actually is during SID (Aschoff, 1992).
In the 1970s and 1980s, coupled oscillator models were shown to reproduce the basic features of SID, with one oscillator representing sleep/wake and the other representing the circadian pacemaker driving the temperature cycle (Wever, 1975; Kronauer et al., 1982). Furthermore, it was shown by Daan et al. (1984) that decreasing circadian amplitude in a two-process model could cause SID. In Kronauer et al.’s (1982) two-oscillator model, SID was induced by a secular change in the spontaneous period of the sleep/wake oscillatory process until the two oscillators desynchronized, each oscillating very close to its own intrinsic period. Prior to desynchrony occurring, the synchronized period increased to 25 hours, with sleep delayed several hours relative to circadian temperature phase (Kronauer et al., 1982). Since these seminal findings, the circadian oscillator model has been extensively developed (Jewett et al., 1999; St. Hilaire et al., 2007), but the physiological interpretation of the second oscillator, which may not represent purely sleep processes, and its labile period remain unclear. Today, it is recognized that sleep is regulated by both circadian and homeostatic processes (Borbély and Achermann, 1999). While other central and peripheral oscillators are involved in sleep regulation, their periods are in many cases determined by the same transcription-translation mechanisms (Mieda et al., 2006; Lamia et al., 2008), so it is not clear how their periods could vary so widely (from 12-68 hours) while the SCN’s period does not. However, it should be noted that circadian oscillators that do not use canonical clock genes may exist (Storch and Weitz, 2009).
Breakthroughs in sleep physiology (Saper et al., 2001; Saper et al., 2005) have fueled the development of physiologically based sleep models (Tamakawa et al., 2006; Phillips and Robinson, 2007; Diniz Behn et al., 2007; Postnova et al., 2009; Rempe et al., 2010), providing a means of relating overt behavioral rhythms to underlying physiology. In this article, we develop a new model of human sleep/wake cycles by combining the Phillips and Robinson (2008) model of the sleep-wake switch with a revised Kronauer-Jewett circadian model (St. Hilaire et al., 2007), in a similar fashion to previous composite models (Achermann and Borbély, 1992; Ishiura et al., 2007). We then use this model to investigate the physiological basis for SID, testing two specific hypotheses: 1) that increased wake promotion by Orx neurons can account for both delayed sleep relative to temperature phase and lengthened observed circadian temperature period prior to SID onset; and 2) that reduction in amplitude of the circadian signal reaching the ventrolateral preoptic nucleus (VLPO) can induce SID.
Materials and Methods
In this section, we combine the Phillips and Robinson (2008) sleep/wake switch model with the St. Hilaire et al. (2007) circadian model. The circadian model drives the sleep-wake switch and receives behavioral feedback in the form of nonphotic stimuli and filtering of environmental light by sleep/wake state. Our model is constructed at the neuronal population scale, using mean field equations to describe population dynamics. In the case of the circadian pacemaker, output of the oscillator model is used as a proxy for SCN firing rate.
Sleep-Wake Switch Model
Phillips and Robinson (2007) developed a neuronal population model of the sleep-wake switch and homeostatic sleep drive, in which average properties are ascribed to each population (Nunez, 1995; Robinson et al., 1997). For additional details, we refer readers to previous publications (Phillips and Robinson, 2007; Phillips and Robinson, 2008; Phillips et al., 2010a). The model includes the mutually inhibitory monoaminergic groups (MA) and VLPO, with circadian (C) and homeostatic sleep (H) drives to VLPO, as shown in Figure 1. In previous work (Phillips et al., 2010a), the Forger et al. (1999) model provided the circadian drive; here, it is replaced by the St. Hilaire et al. (2007) model, which includes nonphotic input to the pacemaker (details below). The MA group receives an averaged input A from cholinergic and orexinergic sources. For each population j = v, m, where v is VLPO and m is MA, we define mean cell body potential Vj(t) relative to resting and mean firing rate Qj(t). Firing rate is approximated by a sigmoid function of Vj (Freeman, 1975),
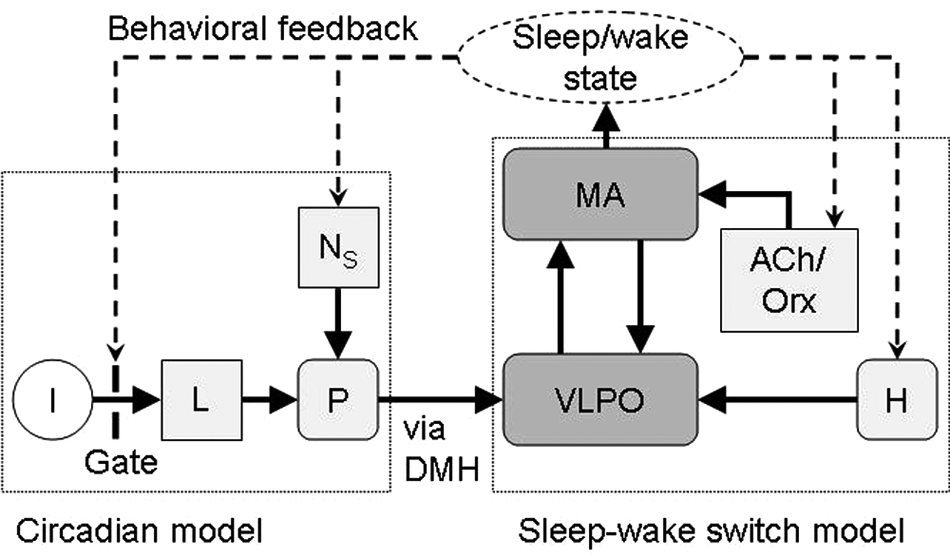
Schematic of the combined model. Environmental light (I) is gated by sleep/wake state and processed by the retinal system (L) before being projected to the circadian pacemaker (P). Nonphotic stimuli (NS) also influence the pacemaker. The mutually inhibitory monoaminergic (MA) and ventrolateral preoptic area (VLPO) populations form the basis of the sleep-wake switch. VLPO receives input from P (via the DMH) and homeostatic sleep drive (H), while MA receives excitatory cholinergic/orexinergic input (ACh/Orx). MA activity determines sleep/wake state, and sleep/wake behavior modulates Orx.
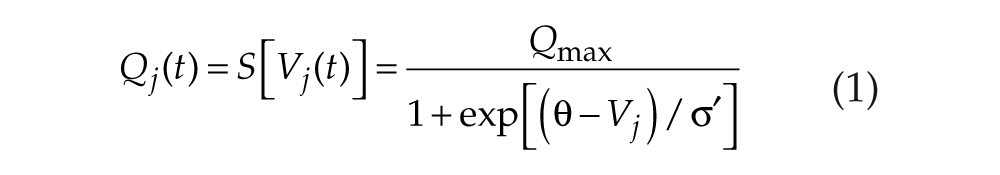
where Qmax is the maximum possible firing rate, θ is the mean firing threshold relative to resting, and
The populations obey


where vjk terms represent connection strength to population j from k, τj is the decay time for group j neuromodulators, and

includes circadian (C) and homeostatic (H) components, with D0 constant.
Homeostatic drive H is considered here to represent somnogen concentration, increasing in wake and decreasing in sleep. Production is approximated by a linear function of Qm (Phillips and Robinson, 2008) because MA activity correlates well with arousal (Aston-Jones and Bloom, 1981), and clearance is assumed proportional to concentration:

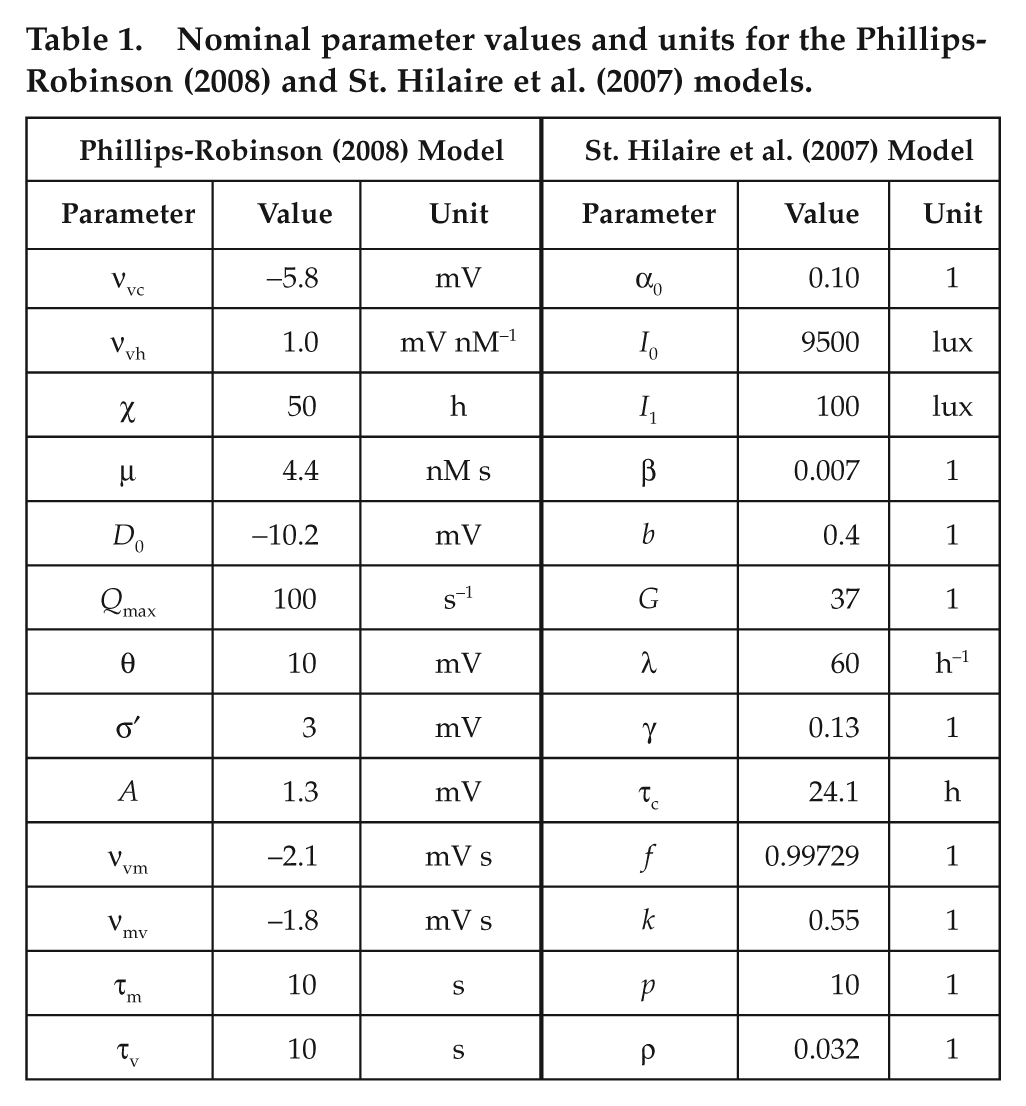
where χ is the homeostatic time constant, and µ is constant. Because our formalism does not rely on identifying the somnogen(s), H may be considered a weighted sum of various somnogen effects, for example, adenosine and cytokines (Imeri and Opp, 2009). However, we note that homeostatic dynamics are restricted to a single time scale, previously calibrated to total sleep deprivation (Phillips and Robinson, 2008), and thus do not capture the effects of chronic sleep restriction. All parameter values have previously been rigorously constrained (Phillips and Robinson, 2007; Phillips and Robinson, 2008), with nominal values in Table 1. Wake/sleep state is defined here by Qm, with Qm > 1 s−1 corresponding to wake, based on experimental values (Aston-Jones and Bloom, 1981). The regular sleep/wake patterns generated here represent deterministic (without noise) output of our model. Previously, we have shown that noisy input can generate less regular sleep/wake patterns, without changing overall phenotype (Phillips et al., 2010b).
Nominal parameter values and units for the Phillips-Robinson (2008) and St. Hilaire et al. (2007) models.
Circadian Model
To model output of the circadian pacemaker, we use St. Hilaire et al.’s (2007) model. As shown in Figure 1, it includes photic and nonphotic drives to the circadian pacemaker. As in previous work (Phillips et al., 2010a), environmental light I is gated by arousal state to simulate eye closure during sleep to yield retinal light intensity:

where Θ is a step function, and
Light input is then processed by the retina. Photoreceptors are activated at a rate

where λ is constant. The resultant photic drive B to the pacemaker is assumed to be proportional to the rate α(1 − n) at which photoreceptors are activated,


where b and G are constants. The (1 − bx)(1 − by) term is included to account for the experimentally observed circadian phase dependence of light sensitivity (Kronauer et al., 1999).
The oscillator is modeled by two first-order differential equations (St. Hilaire et al., 2007),
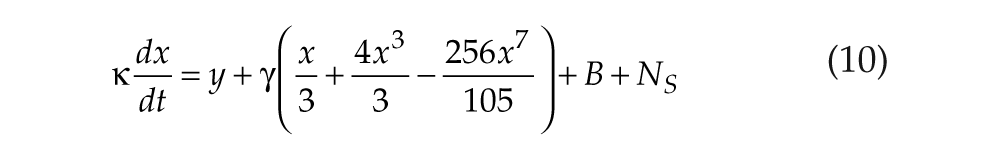
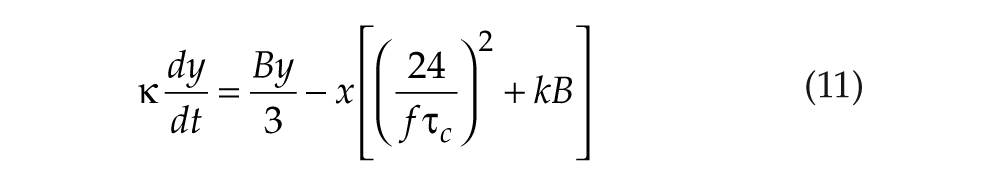
with x representing circadian pacemaker activity and y being a complementary variable. Here, we use x as a proxy for core body temperature (CBT), but we note that SID has also been reported for neuroendocrine concentrations (Czeisler, 1978). Parameters k and q determine photic drive strength, τc is intrinsic period, f is a correction term included to fix period at τc (Forger et al., 1999), γ determines oscillator stiffness (Kronauer, 1990), and κ = (12/π) hours. The nonphotic drive NS models nonphotic stimuli such as meals and locomotor activity on the circadian pacemaker. Because it is not yet known precisely which aspects of waking behavior are primarily responsible for this drive, we have modeled a drive dependent on sleep/wake state (with wake signified by periods of high MA activity in our model),

where ρ and p are constants, and Θ is a step function as in equation 6. Model parameters have previously been calibrated to reproduce human phase and dose response curves to light and nonphotic entrainment in the blind (St. Hilaire et al., 2007); nominal values are in Table 1. Because x is approximately sinusoidal, and SCN firing rate is close to zero during the night in rats (Welsh et al., 1995), we use C = (1 + x)/2 to model circadian input to the VLPO. The presence of bidirectional interactions between the circadian and sleep/wake models can potentially yield complex nonlinear dynamics. While we have not formally proved that the system is stable, numerical simulations confirm that it attracts to a stable limit cycle over a wide range of parameter values and light stimuli.
Hypothetical Mechanisms
As noted above, Kronauer et al. (1982) reproduced SID using a model that included two coupled Van der Pol oscillators in which the period of one was varied. However, the physiological basis for that model is unclear. By contrast, the present model, which is physiologically motivated, provides an alternative means of revisiting the problem. Our model includes two oscillatory processes: a Van der Pol circadian oscillator, and a homeostatic drive defined by a first-order differential equation. Because the homeostat lacks an unambiguous definition of amplitude and phase and is usually slaved by the circadian oscillator, our model is dynamically distinct from a dual Van der Pol model. In dual oscillator systems, desynchrony can be induced either by changing one oscillator’s period or by weakening coupling. In our model, increasing the homeostatic time constant χ would be the closest analog to increasing the sleep/wake oscillator’s period in the Kronauer et al. (1982) model. Using nominal parameter values, this has been found to delay sleep (Phillips et al., 2010a) but does not induce desynchrony within physiological bounds. Within this modeling framework, we must therefore look to reducing coupling strength to induce desynchrony.
Based on prior analysis of parameter sensitivities (Phillips and Robinson, 2007), we examine two primary mechanisms for reproducing experimental observations: 1) up-regulation of Orx input to MA, accounting for participants staying awake at higher homeostatic pressure than during entrainment; and 2) down-regulation of circadian input to VLPO, resulting in desynchrony. In both cases, the effect is proposed to be a result of behavioral choices interacting with the physiological mechanisms that regulate sleep.
Anatomical investigations have revealed that the SCN is only weakly efferent to the VLPO; the bulk of the circadian signal is relayed via the ventral subparaventricular zone (vSPZ) to the DMH, from which it is projected to the VLPO. Circadian regulation of CBT diverges from this pathway at the vSPZ (Saper et al., 2005). Thus, modulation of the circadian signal by the DMH (or its projection to the VLPO) could explain an attenuated circadian signal reaching the VLPO, while other circadian markers (e.g., CBT, cortisol) continue to show robust rhythms (Czeisler, 1978). The DMH plays an important role in integrating behavioral signals with circadian regulation (Saper et al., 2005), and potential causes of this modulation are included in the Discussion. Other experiments that have demonstrated behavioral modulation of sleep timing include interactions between participants housed together (Pöppel, 1968) and blind individuals who maintain a 24-hour schedule despite their circadian pacemaker not being entrained (Klein et al., 1993; Lockley et al., 1997).
Self-selection of sleep/wake schedules is most likely mediated by the wake-promoting orexin group, which receives cortical input and has been implicated in guiding self-directed behaviors (Scammell and Saper, 2005). Orexin activity has been shown to increase during sleep deprivation (Estabrooke et al., 2001), and orexin activation has previously been shown to be a plausible mechanism for remaining awake at high homeostatic pressure (Fulcher et al., 2010). As a simple model, we use

where A0 = 1.3 mV is baseline input to MA. This represents increased Orx activity during wake, with ψ representing the amount of wake-related up-regulation. We note that acute wake-promoting effects of light would have a very similar state-dependent effect, and we do not attempt to model it separately here.
We use the combined model to investigate the effects of these two physiological mechanisms on human sleep/wake cycles by comparing to experimental data. In each case, we simulate the experimental protocol exactly for graphical comparison, but sleep/wake and circadian periods are calculated using 100-day simulations. Internal desynchrony is defined if these periods differ by more than 0.5 hours.
Results
Potential Physiological Mechanisms Underlying SID
We first examine the effects of attenuating the amplitude of the circadian drive to the VLPO without changing any other parameters: we set Orx up-regulation to 0%. As shown in Figure 2, this change alone is sufficient to cause a transition from a synchronized to a desynchronized state. This is consistent with Daan et al. (1984), who used an equivalent mechanism to induce desynchrony in a two-process model.
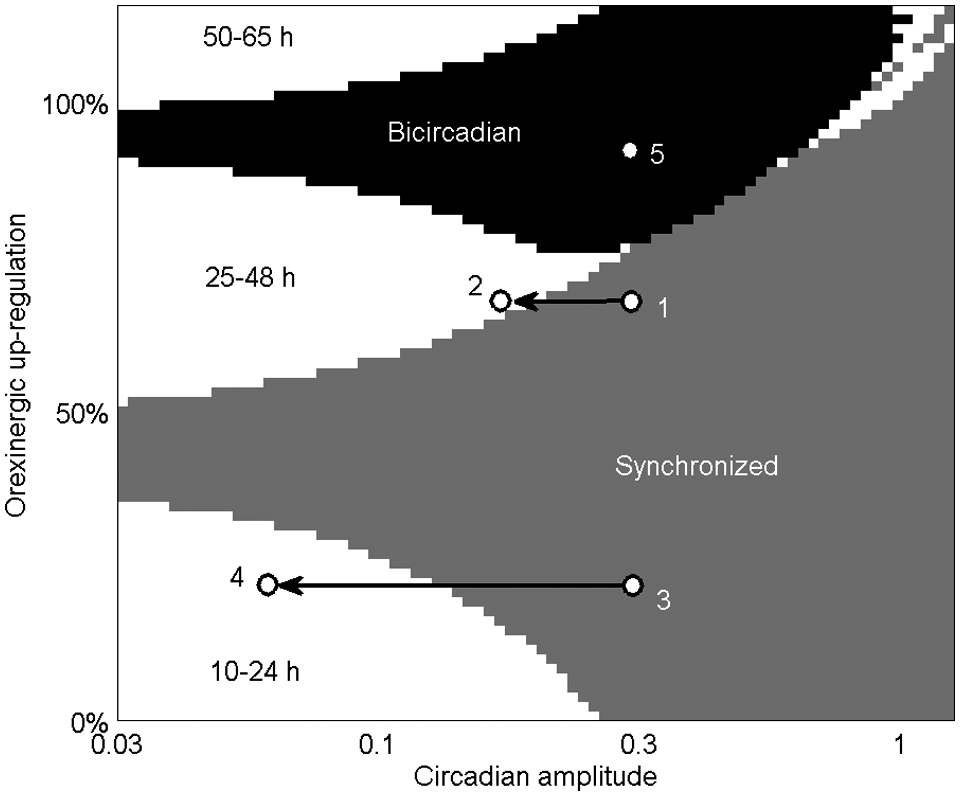
Plot of system dynamics as a function of circadian amplitude (νvc/2.9 mV) and Orx up-regulation (ψ/A0 × 100%). Colored regions indicate synchronized (gray), bicircadian (black), and desynchronized (white) behavior, with labels indicating the sleep/wake cycle period during desynchrony. The white region in the top right contains both 25- to 48-hour desynchronized rhythms and higher order cycles. Points numbered 1 to 5 are used in later figures. Note logarithmic x-axis scale.
We next examine the effect of Orx up-regulation, described by equation 13, finding that this change alone is sufficient to reproduce both period lengthening and delayed sleep during self-selected schedules, as shown in Figure 3. When both mechanisms are applied, desynchrony is induced by attenuating circadian amplitude (x-axis in Figure 2), and sleep/wake cycle period is determined by Orx up-regulation (y-axis in Figure 2). Relatively weak up-regulation (<40%) results in periods <24 hours, while relatively strong up-regulation (>50%) results in periods >24 hours. Bicircadian rhythms and other nonlinear dynamics are possible with up-regulation >75%. The white region in the top right of Figure 2 contains both desynchronized sleep/wake cycles of periods of 25 to 48 hours and higher order limit cycles similar to those found in a simplified model (Phillips and Robinson, 2009). These include a synchronized repeating three-cycle at circadian amplitude of 1 and Orx up-regulation of 100%, in which sleep durations on consecutive cycles are 9.2 hours, 8.0 hours, and 0 hours. It is not clear whether such phenomena have been observed in real participants, but the region’s small extent suggests such states would be unlikely to persist.
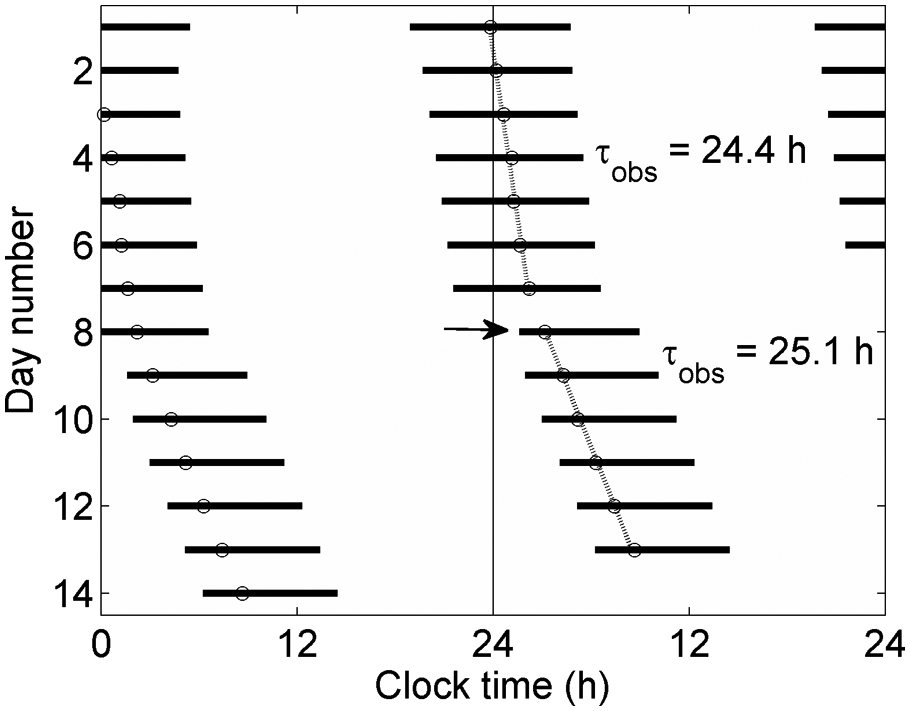
Double-plotted raster diagram, showing effects of Orx up-regulation on timing of sleep. Sleep periods (defined by Qm < 1 s−1) are shown as black bars, with circadian minima plotted as open circles. During days 1 to 7, a schedule is generated using nominal parameters with no Orx up-regulation. During days 8 to 14, 70% Orx up-regulation is applied, resulting in immediate delay of sleep to a later circadian phase (arrow) and an increase in observed period from 24.4 hours to 25.1 hours. Circadian amplitude is 1 across all days.
Period Divergence at SID Onset
Experiments have consistently shown that at SID onset, one rhythm’s period increases relative to its synchronized value, while the other rhythm’s period decreases (Wever, 1979). This period divergence has previously been reproduced by coupled oscillator models and can be intuitively understood in terms of sleep/wake and circadian rhythms exhibiting a balanced or compromised period while synchronized (Kronauer et al., 1982). Once desynchronized, each rhythm runs close to its own intrinsic period. Our model reproduces this phenomenon for both long and short sleep/wake cycles (Figure 4). Desynchronized circadian period is similar in both cases as circadian amplitude goes to zero (24.7 hours and 24.4 hours for long and short sleep/wake cycles, respectively), although slightly shorter than the 24.9 hours obtained experimentally for both cases (Wever, 1979). The precise value will depend on factors such as the strength of nonphotic stimuli and the degree of amplitude reduction, which we do not try to reproduce exactly.
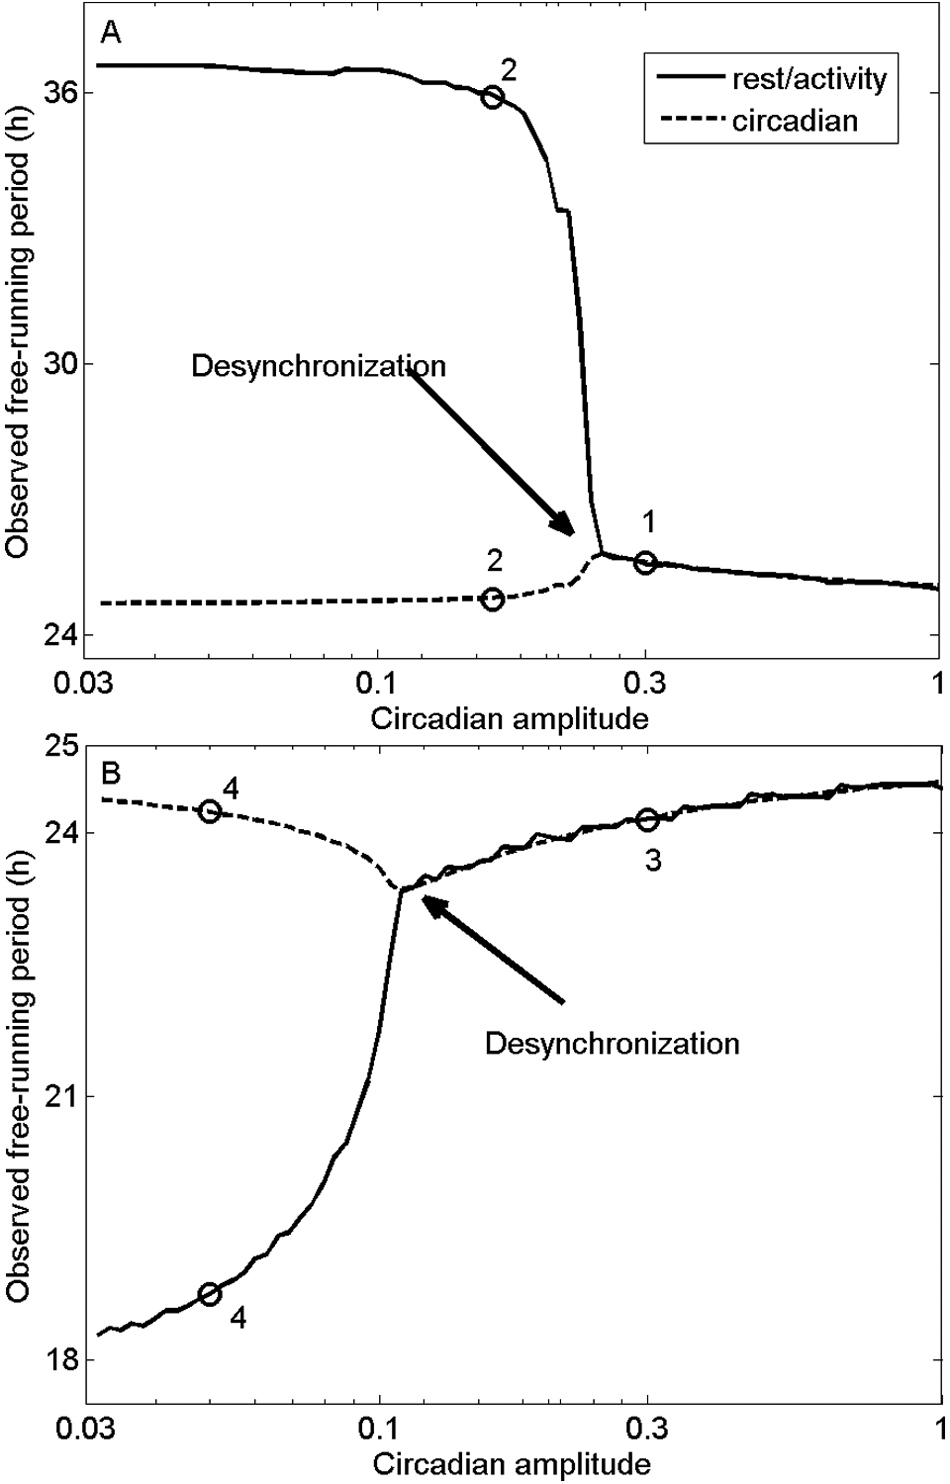
Divergence of sleep/wake (solid) and circadian (dashed) periods in model simulations. (A) Observed periods as functions of circadian amplitude, with 70% Orx up-regulation. States corresponding to points 1 and 2 in Figure 2 are labeled. (B) Observed periods as functions of circadian amplitude, with 30% Orx up-regulation. States corresponding to points 3 and 4 in Figure 2 are labeled. Onset of desynchrony is indicated in each case.
Long Sleep/Wake Cycles
Transition to a desynchronized state is effected by decreasing circadian amplitude. As shown above, long sleep/wake cycles are generated when Orx up-regulation is high. We simulate a 32-day experimental protocol (Wever, 1979) where a participant displayed SID after 14 days, shown in Figure 5A. For the first 14 days, we use parameter values corresponding to point 1 in Figure 2. Circadian amplitude is then immediately reduced, corresponding to point 2, resulting in SID. As shown in Figure 5B, the model reproduces many salient features of the data. During days 1 to 14, sleep is initiated near the circadian minimum. After day 14, the circadian period is reduced (from 25.7 hours to 25.1 hours in data, and from 25.6 hours to 24.9 hours in simulation), while the sleep/wake cycle is lengthened (33.4 hours in data, and 35.6 hours in simulation). Because the transition from synchronized to desynchronized states occurs over a narrow amplitude range (Figure 4), similar results would be generated by a continuous decrease in amplitude. The only notable difference would be a decrease in relative coordination between sleep/wake and circadian cycles over time.
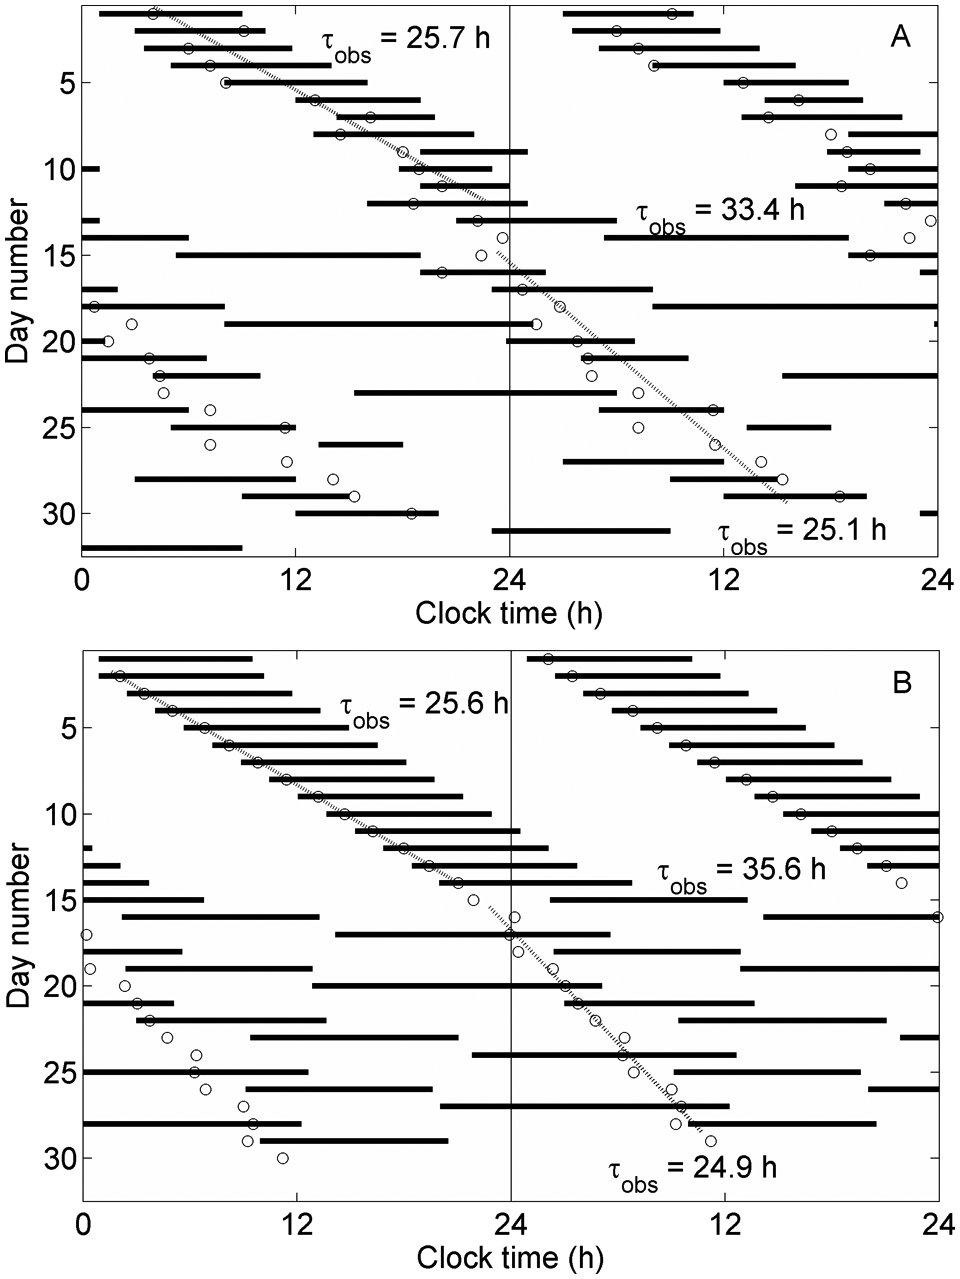
Double raster plots showing transition to a long sleep/wake cycle. Sleep periods (bars) and circadian minima (circles) are shown, along with linear fits to circadian periods (dotted lines). Circadian and sleep/wake cycle periods are labeled. (A) Experimental data, adapted from Wever (1979), using CBT minimum as a circadian marker. (B) Model output, using parameter values shown in Figure 2: point 1 for days 1 to 14, and point 2 thereafter.
During desynchrony, sleep episode duration depends on circadian phase in both experiment and simulation, with longer sleep bouts initiated near the circadian minimum (CBT minimum in data). Model predictions are compared to data from a similar but longer study in which sleep/wake cycles ran for 49 days with a 29.3-hour period (Czeisler et al., 1980). The model simulation is extended to 100 days to cover a broad range of circadian phases, with results in Figure 6A. Sleep bout lengths are slightly overestimated at all circadian phases; a closer match could likely be achieved by fitting other parameter values, which we have not pursued here. The model correctly predicts the effects of circadian phase on sleep bout lengths, and this phase dependence is also shown by computing the power spectrum of the total sleep drive, D, which reflects the sleep/wake cycle. Figure 6B shows the power spectra for points 1, 2, 4, and 5 in Figure 2 (point 3 is very similar to point 1). In each case, the primary frequency component corresponds to the observed sleep/wake cycle period. However, bicircadian and 35.6-hour sleep/wake cycles also show significant frequency components at the circadian period.
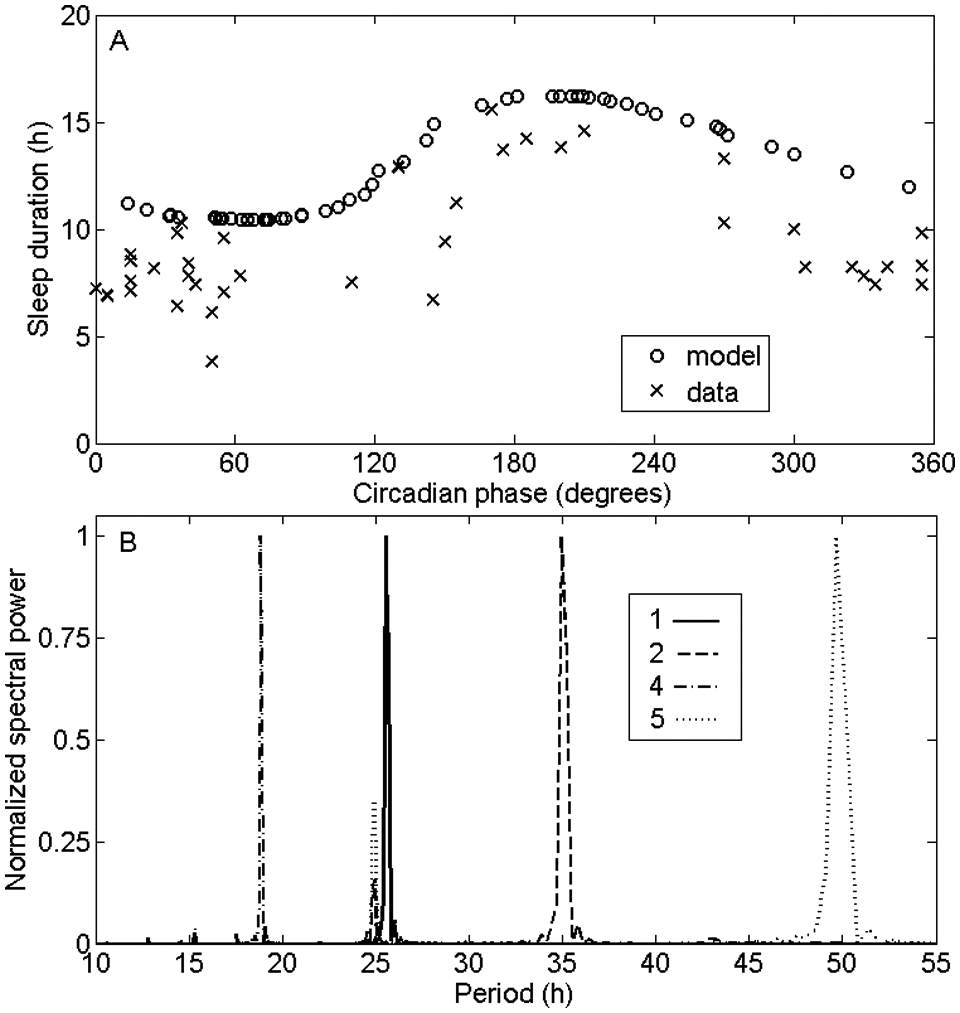
(A) Sleep duration as a function of circadian phase for the model (using point 2 in Figure 2) and data. Phase angle of zero corresponds to circadian/CBT maximum. (B) Power spectra for total sleep drive D, using parameter values corresponding to points 1 (solid), 2 (dashed), 4 (dash-dotted), and 5 (dotted) in Figure 2. Power spectra are normalized to a peak value of 1.
Short Sleep/Wake Cycles
When Orx up-regulation is relatively weak, reducing circadian amplitude results in SID with a short sleep/wake cycle. We simulate a 25-day experimental protocol in which SID was observed after 18 days (Wever, 1979). At day 19, we immediately reduce circadian amplitude, corresponding to moving the system from point 3 to point 4 in Figure 2. While in general we have not fitted other model parameters, in this instance, an intrinsic circadian period of τc = 24.4 hours was used because it clearly yielded a much closer fit than the value of 24.1 hours used for all other simulations. The model reproduces the dynamics of period divergence, with observed circadian period increasing from 24.6 hours to 25.0 hours for data and from 24.5 hours to 24.7 hours for the model, while sleep/wake cycle period decreases to 16.6 hours in data and 18.8 hours in the model (Figure 7). The model also predicts that prior to desynchrony, sleep is not delayed to as late a circadian phase as in Figure 5 due to weaker Orx up-regulation. While this is not clearly reflected in the data in Figure 7A, this trend has been reported in participants who display short sleep/wake cycles (Wever, 1979). Quasirhythmic alternations in phase during days 1 to 18, dubbed “phase trapping” (Kronauer et al., 1982), are not reproduced by the model; potential reasons are given in the Discussion.
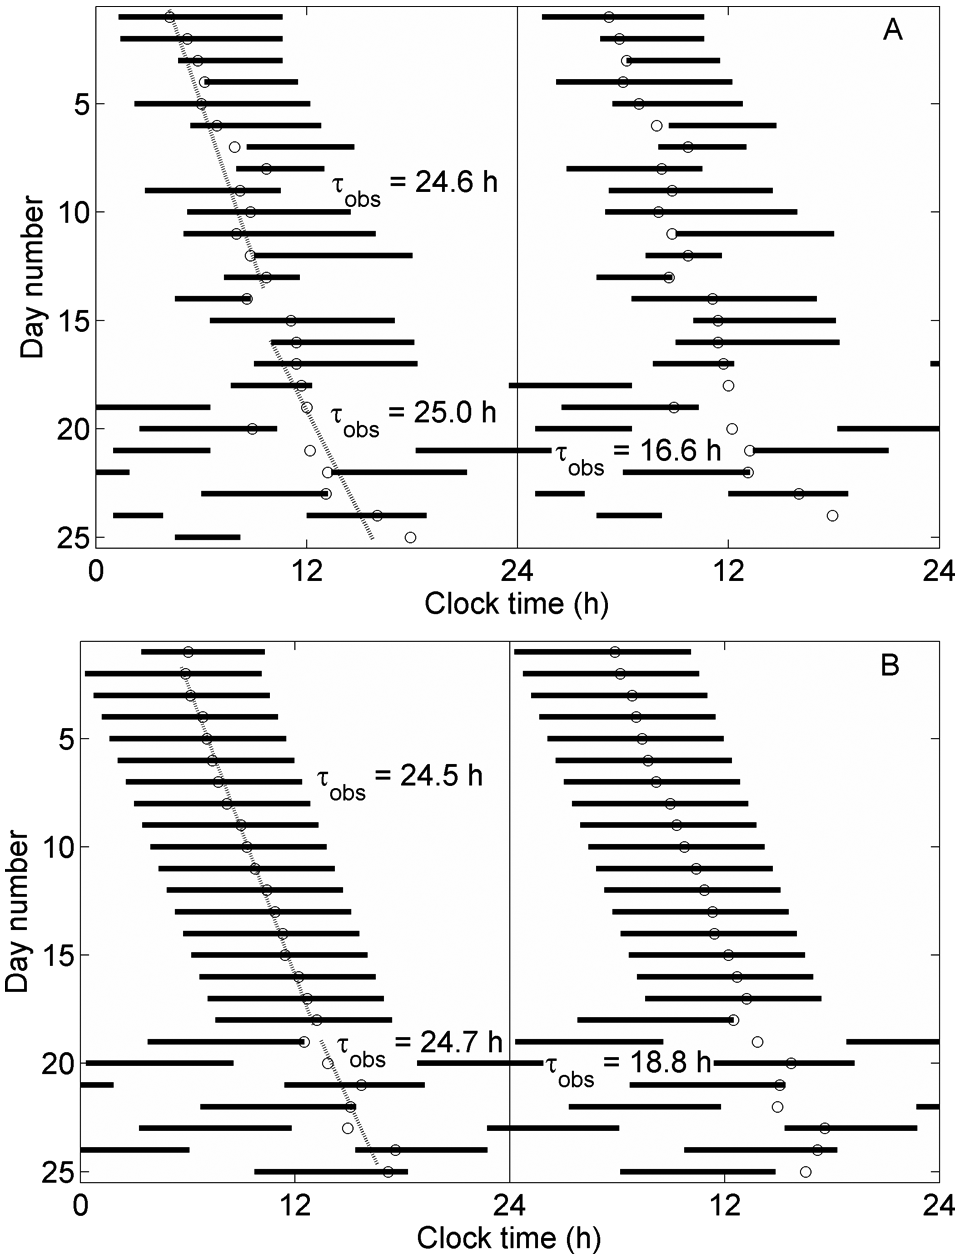
Double raster plots showing transition to a short sleep/wake cycle. (A) Experimental data, adapted from Wever (1979), using CBT minimum as a circadian marker. (B) Model output, using parameter values shown in Figure 2: point 3 for days 1 to 18, and point 4 thereafter. This simulation uses τc = 24.4 hours.
Bicircadian Rhythms
As shown in Figure 2, bicircadian rhythms are possible when Orx up-regulation is sufficiently strong. Using parameter values corresponding to point 5 in Figure 2, a bicircadian rhythm is demonstrated in Figure 8, with 24.8-hour circadian period and 49.6-hour sleep/wake cycle period. Sleep bouts are 14.1 hours long, corresponding to 28% of sleep/wake cycle length, consistent with experimental values of 27% ± 2% and 23% ± 1% for two participants (Jouvet et al., 1974).
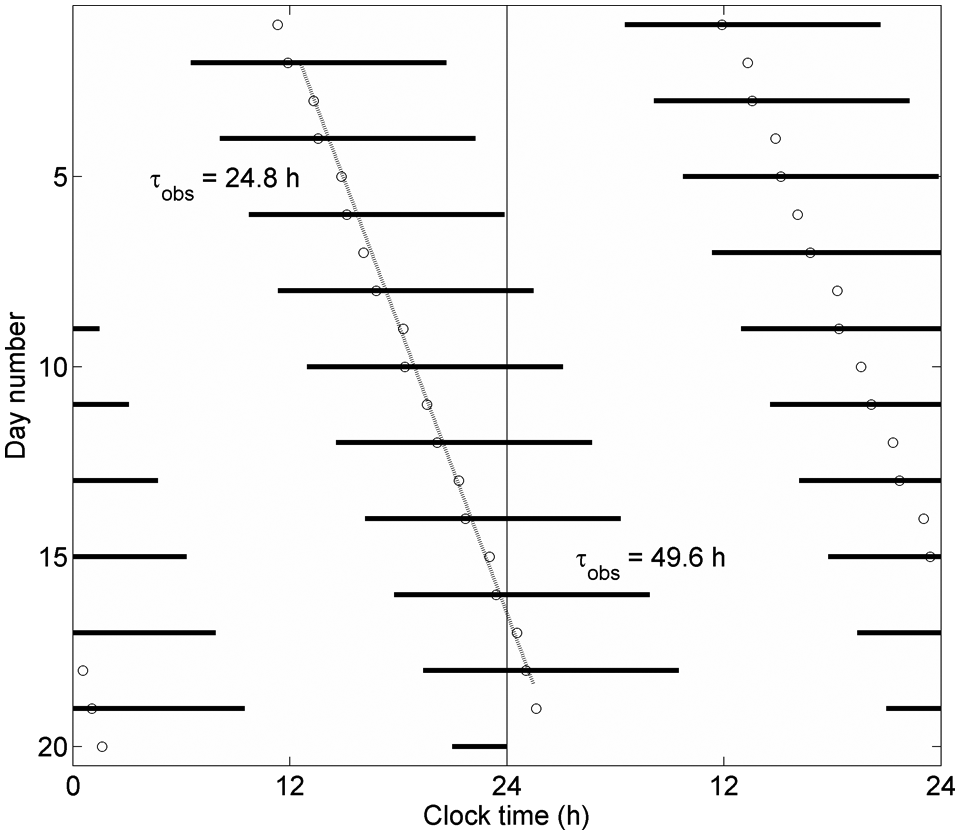
Double raster plot of a bicircadian rhythm, using model parameters at point 5 in Figure 2, with all other parameters nominal. Circadian and sleep/wake periods of 24.8 hours and 49.6 hours, respectively, are labeled.
Discussion
The unusual structure of human sleep patterns on self-selected schedules provoked some of the first serious modeling efforts in the field of sleep research. That work revealed that oscillator models could reproduce many of the experimental observations (Wever, 1975; Kronauer et al., 1982). In the following decades, the subject has seldom been revisited in the modeling literature, while knowledge of basic sleep physiology has steadily improved. While elegant, the physiological interpretation of a coupled oscillator model with labile period remained unclear. Experimental evidence for a sleep/wake oscillator secondary to the circadian rhythm (Hashimoto et al., 2004) may reflect the homeostatic regulation of sleep, which is also an oscillatory process. Here, we have used a physiologically based model to re-examine the topic and provide new insight into physiological mechanisms that could underlie SID. This model has also previously been shown to reproduce the relationship between the timing and duration of recovery sleep following sleep deprivation (Phillips and Robinson, 2008). The results here implicate the potential role of behavioral feedback in modifying sleep/wake patterns, with these effects likely being mediated by orexin, masking effects of light, and the DMH.
Consistent with our hypotheses, we demonstrated that several observed features of human sleep on self-selected schedules can be reproduced by two physiological mechanisms: 1) desynchrony can be induced by attenuating the circadian signal reaching the VLPO; and 2) sleep is shifted to a later circadian temperature phase, and observed circadian period is lengthened by increasing Orx activity during wake. In our simulations, we used the most current version of the circadian oscillator model developed by Kronauer, Jewett, and others (St. Hilaire et al., 2007). However, our key findings are not contingent on the more sophisticated features of this model (such as nonphotic entrainment), and similar qualitative results could be achieved using a simpler circadian model.
If circadian amplitude is sufficiently attenuated, sleep/wake cycles desynchronize from the circadian rhythm and are driven by the homeostatic process. An equivalent mechanism induced desynchrony in a two-process model (Daan et al., 1984), but in that instance the full parameter space was not explored. Participants who continue to show naps synchronized to the circadian temperature rhythm (Zulley and Campbell, 1985) may be temporarily crossing the boundary between synchronized and desynchronized states.
Previously, we have shown that our model exhibits hysteresis (Fulcher et al., 2008), and when circadian amplitude is reduced, homeostatic dynamics drive the model around this hysteresis loop. Sleep/wake cycle length is thus determined by both the homeostatic time constant and the hysteresis loop width, potentially providing an indirect means of assessing homeostatic kinetics. Increasing orexinergic tone broadens the hysteresis loop (Fulcher et al., 2008), thereby lengthening sleep/wake cycle period during SID, similar to increasing the distance between thresholds in the two-process model (Daan et al., 1984). Our model thus predicts that interindividual differences in behavioral feedback to Orx and capacity for Orx up-regulation may determine whether participants transition to longer or shorter sleep/wake cycles. This would explain why participants with short sleep/wake cycles generally show shorter synchronized periods than participants with long sleep/wake cycles (Wever, 1979). An alternative interpretation is that Orx is released from inhibition by the ability to sleep freely. In most studies of spontaneous internal desynchrony, there has been little control of sleep patterns prior to participants entering the laboratory and thus little control of prior sleep debt. Furthermore, orexin neurons are inhibited by adenosine (Thakkar et al., 2008). Self-selection of sleep/wake schedules may thus dissipate pre-existing homeostatic pressure, resulting in increased orexinergic activity.
During SID, participants estimate their sleep/wake period to be considerably closer to 24 hours than it actually is (Aschoff, 1992), which may result in unusual spacing of meals and other social behaviors. For instance, participants who persist with a stereotypical schedule of three meals per wake episode could potentially be generating a desynchronizing biological signal if the intermeal interval deviates substantially from the norm. We speculate that the DMH may respond to self-imposed schedules, resulting in attenuation of the circadian signal to the VLPO. Consistent with this hypothesis, the DMH has been shown to integrate circadian signals with environmental and social factors (Saper et al., 2005; Gooley et al., 2006). Explicit modeling of this pathway should be considered in the future and may help to illuminate these and other dynamics. Sleep/wake state-dependent homeostatic feedback to the circadian pacemaker may also play an important role in attenuating the circadian signal (Deboer et al., 2003), although more data are required to determine the dynamics of this interaction in humans.
The model reproduced the salient features of SID for both long and short sleep/wake cycles. Allowing other parameters to vary, such as the homeostatic time constant, would produce a closer quantitative fit to individual data sets, but our primary objective was to demonstrate that the principal dynamics of human sleep on self-selected schedules can be captured by invoking just two physiologically plausible mechanisms. While the model was widely successful in reproducing experimental observations, one important exception was phase trapping. This phenomenon is characterized by quasiperiodic shifts in phase angle between sleep/wake and circadian cycles prior to desynchrony. Such dynamics are more obvious in some participants than others and are a characteristic feature of coupled oscillator systems (Wever, 1979; Kronauer et al., 1982). This suggests that secondary oscillator systems that are not yet included in the model, such as other central or peripheral oscillators (Mieda et al., 2006; Lamia et al., 2008), or interactions between different SCN components (Schwartz et al., 2009), may play an important role in generating these quasiperiodic rhythms.
Finally, we showed that the model generates bicircadian rhythms. As illustrated in Figure 2, the model correctly predicts that this regime is bordered by both synchronized and desynchronized regimes because bicircadian rhythms have been observed to emerge from both states (Jouvet et al., 1974). Attempts to artificially impose bicircadian activity patterns have been relatively unsuccessful (Meddis, 1968), whereas endogenously generated bicircadian rhythms may be prolonged by supplying a bicircadian zeitgeber (Jouvet et al., 1974). These findings are consistent with the model prediction that bicircadian rhythms require significant Orx up-regulation. Orexinergic activity plays an important role in mediating self-directed behaviors (Scammell and Saper, 2005), which is likely absent or reduced when schedules are externally imposed. Future work could include studying spontaneous desynchrony in humans or animals with impaired Orx function, such as individuals with narcolepsy. The model predicts that such participants would be more likely to display short sleep/wake cycles and may also desynchronize more easily.
The model developed here could be applied to simulating forced desynchrony protocols, providing an important test of the model’s ability to replicate sleep patterns at different circadian phases. Furthermore, while the model used here includes the fundamental elements of the sleep/wake switch, adding additional elements of the physiology, such as DMH input to Orx, could reveal other potential mechanisms.
In summary, we have shown that a physiologically based model is able to account for many features of human sleep on self-selected schedules. Furthermore, the model implicates two key physiological pathways in the generation of SID, both likely driven by behavioral feedback.
Footnotes
Acknowledgements
This work was supported by the National Space Biomedical Research Institute through NASA NCC 9-58 to A.J.K.P. (PF02101) and E.B.K. (HFP01603) and by the National Institutes of Health to E.B.K. (P01-AG009975, RC2-HL101340, and K24-HL105664) and C.A.C. (P01-AG009975). The authors thank M.A. St. Hilaire, D.J. Dijk, and K. Scheuermaier for their helpful comments.
E.B.K. has received investigator-initiated grants from Philips Respironics and Takeda Pharmaceutical Co. Ltd. A.J.K.P. has no conflicts of interest to declare. C.A.C. reports that he has received consulting fees from or served as a paid member of scientific advisory boards for Actelion, Ltd.; Bombardier, Inc.; the Boston Celtics; Cephalon, Inc.; Delta Airlines; Eli Lilly and Co.; Garda Síochána Inspectorate; Global Ground Support; Johnson & Johnson; Koninklijke Philips Electronics, NV; the Minnesota Timberwolves; the Portland Trail Blazers; Philips Respironics, Inc.; Sanofi-Aventis, Inc.; Sepracor, Inc.; Sleep Multimedia, Inc.; Somnus Therapeutics, Inc.; Vanda Pharmaceuticals, Inc.; and Zeo, Inc. He also owns an equity interest in Lifetrac, Inc.; Somnus Therapeutics, Inc.; Vanda Pharmaceuticals, Inc.; and Zeo, Inc., and he has received royalties from McGraw-Hill, the Massachusetts Medical Society/New England Journal of Medicine, the New York Times, Penguin Press, and Philips Respironics. He has received lecture fees from the Alliance for Epilepsy Research; American Academy of Sleep Medicine; Duke University School of Medicine; Mount Sinai School of Medicine; National Academy of Sciences; North East Sleep Society; Sanofi-Aventis, Inc.; Society for Obstetric Anesthesia and Perinatology; St. Luke's Roosevelt Hospital; University of Virginia Medical Center; University of Washington Medical Center; and University of Wisconsin Medical School. He has also received research prizes with monetary awards from the American Academy of Sleep Medicine and the New England College of Occupational and Environmental Medicine; clinical trial research contracts from Cephalon, Inc.; and an investigator-initiated research grant from Cephalon, Inc. C.A.C.'s research laboratory at the Brigham and Women's Hospital has received unrestricted research and education funds and/or support for research expenses from Cephalon, Inc.; Committee of Interns and Residents; the CIR Policy and Education Initiative; Koninklijke Philips Electronics, NV; ResMed; and the Brigham and Women's Hospital. The Harvard Medical School Division of Sleep Medicine, which C.A.C. directs, has received unrestricted research and educational gifts and endowment funds from Boehringer Ingelheim Pharmaceuticals, Inc.; Cephalon, Inc.; George H. Kidder, Esq.; Gerald McGinnis; GlaxoSmithKline; Jazz Pharmaceuticals; Lilly USA; Merck & Co., Inc.; Peter C. Farrell, PhD; Pfizer; Praxair US Homecare; ResMed; Respironics, Inc.; Sanofi-Aventis, Inc.; Select Comfort Corporation; Sepracor, Inc.; Sleep Health Centers, LLC; Somaxon Pharmaceuticals; Takeda Pharmaceuticals; Tempur-Pedic; Watermark Medical; and Zeo, Inc. The Harvard Medical School Division of Sleep Medicine Sleep and Health Education Program has received educational grant funding from Cephalon, Inc.; Takeda Pharmaceuticals; Sanofi-Aventis, Inc.; and Sepracor, Inc. C.A.C. is the incumbent of an endowed professorship provided to Harvard University by Cephalon, Inc., and holds a number of process patents in the field of sleep and/or circadian rhythms (e.g., photic resetting of the human circadian pacemaker). Since 1985, he has also served as an expert witness on various legal cases related to sleep and/or circadian rhythms.