
Abstract
Light plays a key role in the development of biological rhythms in fish. Recent research in Senegal sole has revealed that spawning and hatching rhythms, larval development, and growth performance are strongly influenced by lighting conditions. However, the effect of light on the daily patterns of behavior remains unexplored. Therefore, the aim of this study was to investigate the impact of different photoperiod regimes and white, blue, and red light on the activity rhythms and foraging behavior of Solea senegalensis larvae up to 40 days posthatching (DPH). To this end, eggs were collected immediately after spawning during the night and exposed to continuous white light (LL), continuous darkness (DD), or light-dark (LD) 12L:12D cycles of white (LDW), blue (LDB, λpeak = 463 nm), or red light (LDR, λpeak = 685 nm). A filming scenario was designed to video record activity rhythms during day and night times using infrared lights. The results revealed that activity rhythms in LDB and LDW changed from diurnal to nocturnal on days 9 to 10 DPH, coinciding with the onset of metamorphosis. In LDR, sole larvae remained nocturnal throughout the experimental period, while under LL and DD, larvae failed to show any rhythm. In addition, larvae exposed to LDB and LDW had the highest prey capture success rate (LDB = 82.6% ± 2.0%; LDW = 75.1% ± 1.3%) and attack rate (LDB = 54.3% ± 1.9%; LDW = 46.9% ± 3.0%) during the light phase (ML) until 9 DPH. During metamorphosis, the attack and capture success rates in these light conditions were higher during the dark phase (MD), when they showed the same nocturnal behavioral pattern as under LDR conditions. These results revealed that the development of sole larvae is tightly controlled by light characteristics, underlining the importance of the natural underwater photoenvironment (LD cycles of blue wavelengths) for the normal onset of the rhythmic behavior of fish larvae during early ontogenesis.
In nature, the spectral characteristics of underwater light are determined by a combination of the ambient skylight and the optical properties of the water. Light becomes increasingly monochromatic with depth because the spectral profile is selectively attenuated as light passes into deep water (Jerlov, 1968). Thus, clear ocean waters transmit maximally at blue wavelengths (~470 nm), while coastal waters transmit better at blue-green wavelengths (~500 nm) and estuarine waters at green wavelengths (~580 nm) (Cohen and Forward, 2002). Furthermore, fish have adapted their photopigment sensitivity according to their surrounding environment (Kusmic and Gualtieri, 2000). The effects of artificial lighting conditions on the performance, development, and welfare of some fish larvae of commercial interest have recently been reviewed by Villamizar et al. (2011a), who pointed out the importance of light during early development to optimize rearing protocols at hatcheries and to sustain juvenile supply (one of the main production bottlenecks in aquaculture).
Under an LD cycle, fish show daily patterns of locomotor activity that can be classified into several types: diurnal, nocturnal, crepuscular, and a combination of them (Herrero et al., 2003; Schulz and Leuchtenberger, 2006; Vera et al., 2009). In adult sole, the activity is maximal in the first part of the dark period, progressively decreasing during the night (Bayarri et al., 2004; Rubio et al., 2009). The daily locomotor rhythms of the Senegal sole larvae are still unknown, despite the fact that such knowledge is of prime importance for optimizing larval rearing and production.
A successful feeding response is not solely dependent on prey contact but rather on a continuum of events, proceeding from the encounter through the attack and capture of prey (O’Brien, 1979; Wanzenböck and Schiemer, 1989; MacKenzie et al., 1994). For the majority of teleost larvae, vision is the primary sense involved in the execution of these feeding events (Blaxter, 1969). Thus, a lack of correlation between prey density and larval growth and survival may result from the influence of light. In fish, the photosensory systems and extraretinal photoreceptors are complex and far from fully understood, as the response to light is often species specific, depending on phylogenetic and ecological factors (Marchesan et al., 2005).
The Senegal sole (Solea senegalensis) is a flatfish of great commercial and scientific interest (Dinis et al., 1999). Recent work performed in this species reported that light spectra, intensities, and photoperiods have a great influence in terms of larval growth, development, malformation, survival (Blanco-Vives et al., 2010), and hatching rhythms (Blanco-Vives et al., 2011). Nevertheless, the behavioral responses of fish larvae and their prey capture success rate under different lighting conditions remain unexplored.
The purpose of this article was to investigate the foraging behavior and daily activity rhythms in sole larvae exposed to different light spectra and photoperiods. To this end, we built a video recording/analysis system that enabled us to quantify accurately, from 1 to 40 DPH, the distribution and behavioral patterns (modal action patterns [MAPs]: swimming duration, orientation, capture, miss, and pass frequency).
Materials and Methods
Animals and Housing
The experiment was carried out at the facilities of IFAPA Centro El Toruño (Puerto de Santa María, Spain). Fertilized eggs were collected before dawn in complete darkness from naturally spawning tanks to ensure that eggs did not receive any light before the experimental treatments. The brood stock was kept in tanks exposed to natural lighting conditions in a 12L:12D cycle.
At 3 days posthatching (DPH), coinciding with the onset of exogenous feeding, larvae from each experimental condition were transferred to three 1-L aquaria per treatment to continue the analysis of morphometric parameters. To feed the larvae, Brachionus plicatilis rotifers were cultured and enriched with commercially available freeze-dried green algae Nannochloropsis sp. (Easy Algae, Fitoplancton Marino, Cádiz, Spain) in a proportion of 300,000 cells/mL/d from 3 to 7 DPH. Enriched rotifers were added to tanks twice a day, both during the light (ZT1, with ZT0 representing the beginning of light) and dark (ZT13) phases, as an early live food at a density of 20 individuals/mL from 3 to 7 DPH. Artemia sp. nauplii were added to tanks twice a day both during the light (ZT1) and dark (ZT13) at a density of 2 to 3 nauplii mL−1/d−1 that were provided from 8 to 30 DPH. Before being fed to the larvae, the nauplii were enriched with a mixture with optimal DHA/EPA ratio (INVE DC DHA Selco Dendermonde, Belgium). Three to 5 metanauplii mL−1/d−1 were provided from 27 to 40 DPH. Before being fed to the larvae, the metanauplii were also enriched for 24 hours with a mixture (ORI-GO, ORI-PRO, Skretting AS, Burgos, Spain) of phytoproteins and highly unsaturated fatty acids (HUFAs).
Experimental Design
To study the effects of different light spectra and photoperiods, the eggs were distributed into 5 experimental groups: 12L:12D cycle with red (LDR, λpeak = 685 nm, half-peak bandwidth = 592-668 nm), blue (LDB, λpeak = 463 nm, half-peak bandwidth = 435-500 nm), or white (LDW) lights; constant white light (24L:0D or LL); and constant dark (0L:24D or DD) conditions. The white light had a broad spectrum, with 95% irradiance within the range of 367 to 757 nm. The spectral analysis of the lights was performed using a spectroradiometer (FieldSpec HH, ASD Inc., Boulder, CO) (Table 1). To avoid the effects of any background light on the experiments, the experimental aquaria were covered with a black light-tight screen. For the different spectral trials, lamps were constructed using light-emitting diodes (LEDs) mounted on fiberglass plaques (160 × 232 mm). Each red and blue lamp was made of a clustered panel with 17 LEDs homogeneously distributed. White lamps had 18 white and 4 red LEDs to produce a broader range wavelength. Each lamp was encased in a waterproof container placed approximately 50 cm above the water surface. The lamps were powered by a 3-V DC supply connected to a variable resistor (0-2 kΩ) that allowed the light intensity to be adjusted to 0.42 W/m−2, which is low but well above the light threshold (0.053 W/m−2) required to modify melatonin contents in both the eye and plasma in Senegal sole (Oliveira et al., 2007). Fish were reared and manipulated following Spanish legislation on Animal Welfare and Laboratory Practices (EC Directive 86/609/EEC).
Experimental conditions and total length (mm) of Senegal sole larvae under different light spectra and photoperiods.
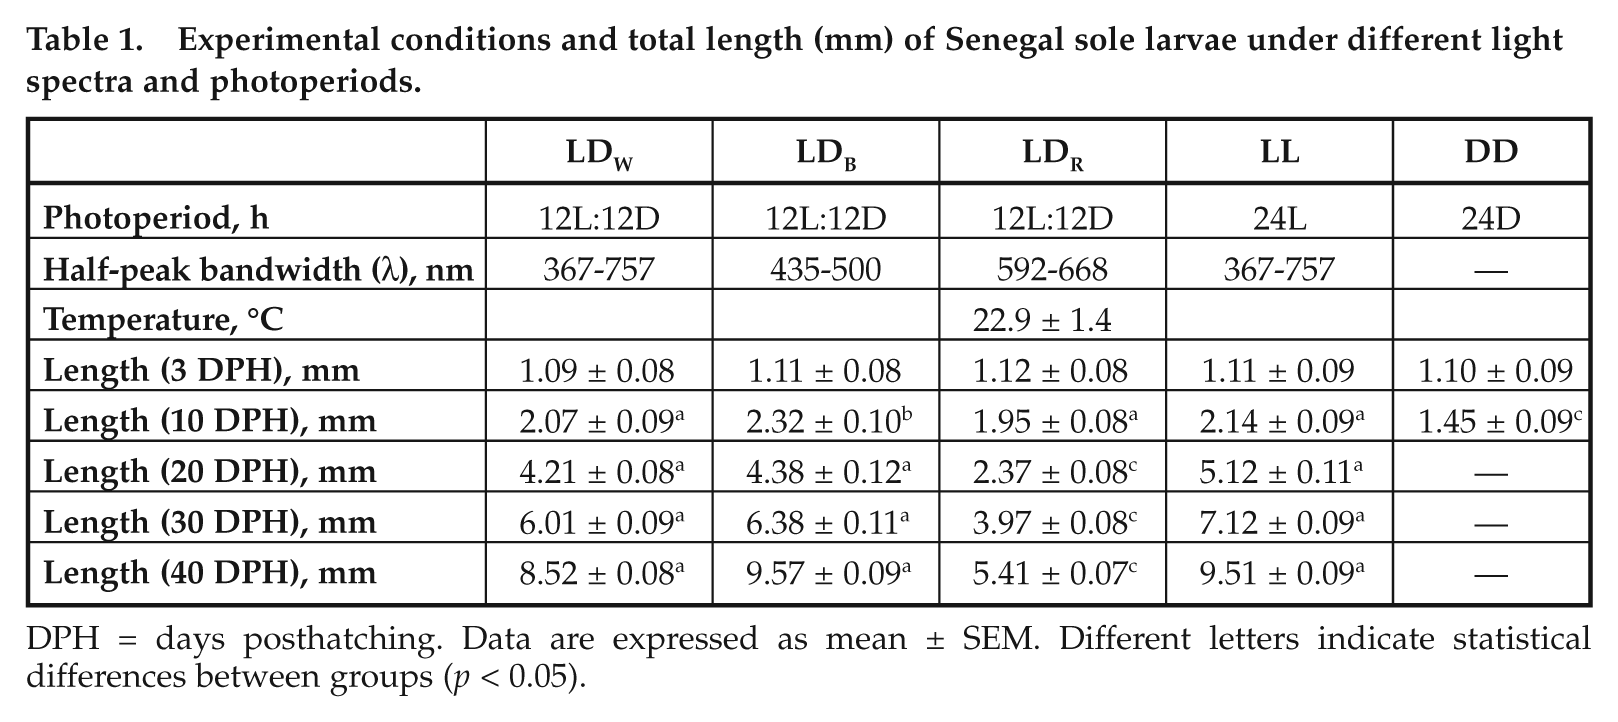
DPH = days posthatching. Data are expressed as mean ± SEM. Different letters indicate statistical differences between groups (p < 0.05).
Experiment 1: Daily Activity Rhythm
To record the behavior of larvae during day and night times, 5 video recording systems equipped with infrared lights were designed and built (Fig. 1). A webcam (Logitech QuickCam E3500 USB Webcam Fremont, USA) was modified by replacing the UV optical filter with a negative film that acted as a filter letting infrared light pass through. Two infrared lights (they consist of a cluster of 30 high efficiency LEDs, Cebek C-2290, Barcelona, Spain) were placed 0.4 m from the aquarium, opposite the camera, which was placed 0.5 m from the aquarium. For a better diffusion of light, white acrylic plates were fixed to the back wall of the aquarium, which greatly improved the contrast of larvae. The webcam was connected to a computer, and the movement of larvae was recorded until 40 DPH. Previous observations have shown that sole are capable of feeding in the dark from the very early hatching stage (Blaxter, 1969). The larvae were kept at a constant temperature (20.9 °C ± 1.4 °C), and water was changed every day using seawater hyperfiltered by means of a biological filter (mod. 2227, EHEIM, Deizisau, Germany) and a bio-balls filter system, with the filtering surface ratio being approximately 1 L of bio-balls per 10 L of water.
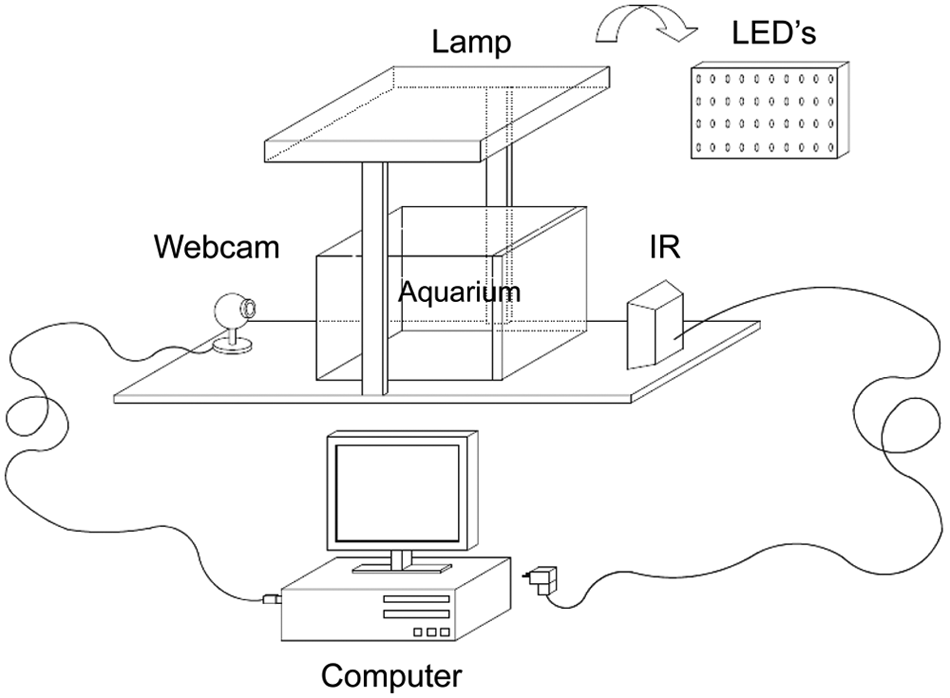
Detailed scheme of the system used to analyze locomotor and feeding behaviors in developing sole: aquarium with infrared illumination, webcam connected to a computer, and lamps provided with light-emitting diodes of different light spectra.
Due to the small size of larvae, most existing methods for visual object tracking cannot be applied to the images. Thus, in collaboration with the Computer Vision Research Group of the University of Murcia, in-house specialized software for video analysis of fish larvae was developed to measure and quantify the behavior of larvae in long-lasting video sequences. The program provided an estimate of overall locomotor activity value by using image differences. The recorded video sequences consisted of a set of images, I0, I1, I2 . . . In–1, where n is the total length of the sequence; the videos were recorded at 1 frame per second. For each time instant, t, from 1 to n–1, the difference image, Dt, was obtained with Dt(x, y) = abs(It(x, y) – It–1(x, y)) for all pixels (x, y) in the images. Then, the average of each difference image was computed as motion(t) = 1/HW • ∑ for all pixels ( x , y ) (Dt(x, y)), where H is the height of the images, and W is the width (in pixels).
A low value of motion(t) indicates that the overall locomotor activity of larvae is very reduced at time t. In the extreme case, a value of 0 means that images It and It–1 are exactly the same, so there is no movement at instant t. On the other hand, the higher the motion(t) values, the greater the movement of larvae at second t. The values given by this parameter motion(t) were analyzed in relative terms (i.e., considering the rest of the sequence) because the range of the measure depends on many factors: the number of larvae, the contrast in the images, and the lighting conditions.
Experiment 2: MAPs and Gut Content
To check the proportion of feeding and prey capture rate per larva, 15 larvae per treatment were collected from 0 to 10 DPH every 2 days, and total length was measured from 3 to 40 DPH. Each sampled larva was immediately observed under a microscope. Larval gut contents were determined in the day time (ZT6) and night time (ZT19) under pressure of a cover slip, and the number of rotifers consumed was counted. Although teleost larvae digestion rates can be rapid (Fossum, 1983; Tilseth and Ellertsen, 1984), in the present study, whole rotifers were clearly visible within the larval gut, and partially digested rotifers were easily recognized and counted using the rotifer’s undigested mastax apparatus (often enclosed within the remnants of the lorica).
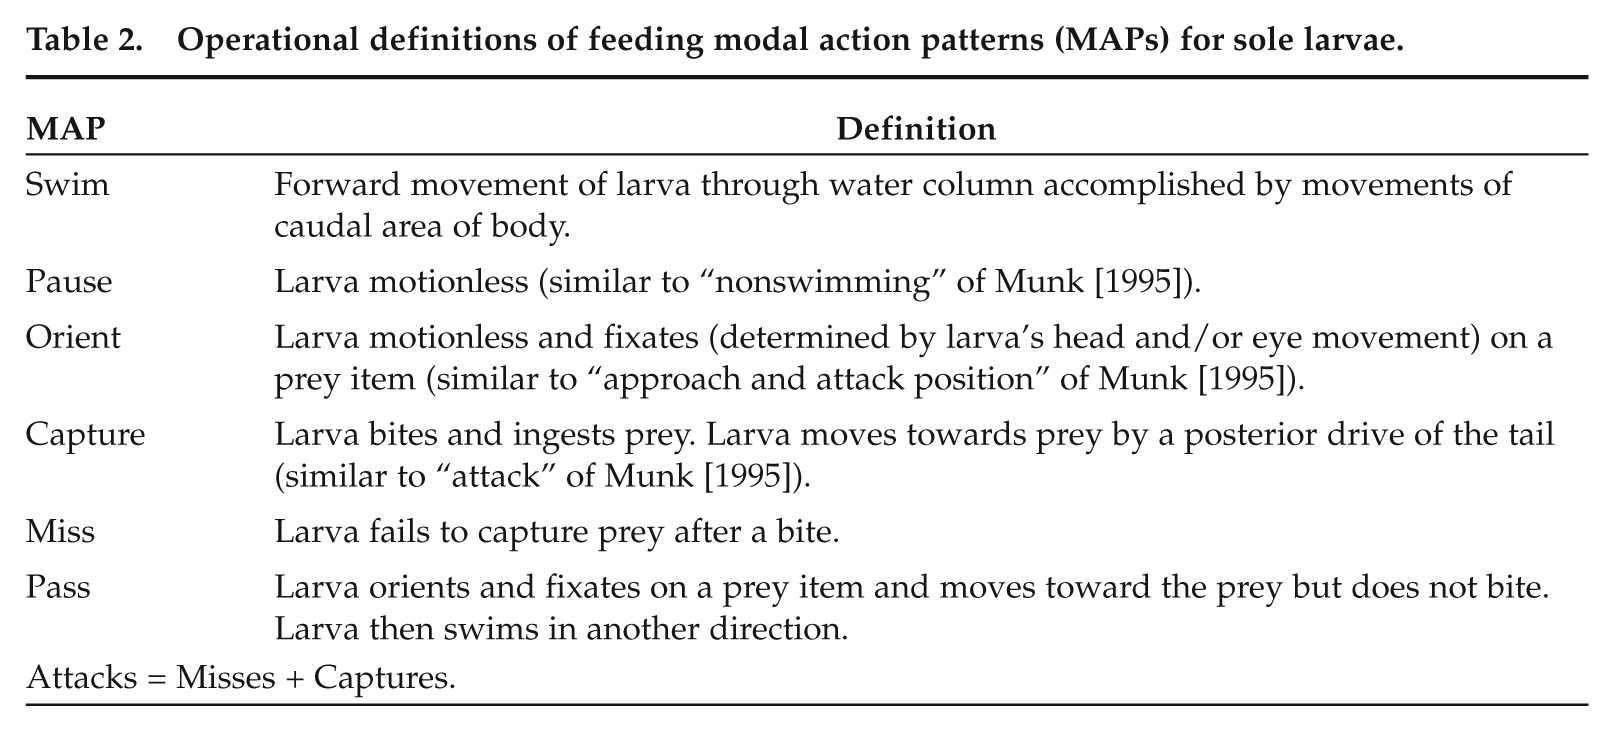
The focal animal technique (Altman, 1974) was applied to collect information from randomly chosen larvae during 2 minutes (5 larvae per sampling point and treatment). Larval behavioral observations were performed every 2 days in the middle of the light (ZT6, ML) and dark (ZT18, MD) cycles in 1-L glass aquaria illuminated using the LED lamps (red, blue, or white). The occurrence of 5 MAPs including swimming duration, orientation, capture, miss, and pass frequency (Puvanendran and Brown, 1998) (Table 2) was registered. The resulting data for each MAP, larva, and replicate were averaged to obtain a mean value of a given MAP from each treatment. The frequencies of miss and capture were pooled to generate the variable “attack”, which was then used to calculate the capture success and attack rates (Drost, 1987) using the following relationship: Capture success = (frequency of capture / frequency of attack) × 100, Attack rate = (frequency of attack / frequency of orientation) × 100.
Operational definitions of feeding modal action patterns (MAPs) for sole larvae.
Data Analysis
The analysis was carried out using Excel 2003 (Microsoft, Redmond, WA), SPSS (Chicago, IL), and chronobiology software designed by Professor Díez Noguera (El Temps, University of Barcelona, Barcelona, Spain). The locomotor activity was recorded for each treatment box separately. To establish statistical differences in larval development (total length) between treatments, a 1-way ANOVA was performed. Regarding the gut contents (feeding proportion and prey per larva) and MAPs (swimming duration, capture success rate, and attack rate), 2-way ANOVA tests were carried out with group and time as factors, and a Tukey post hoc test was performed. All percentage data were normalized and arcsin transformed before statistical analysis. All statistical analyses were carried out with SPSS 15.0 for Windows. Data are expressed as mean ± SEM values. p < 0.05 was taken as the statistically significant threshold.
Results
Larval Development and Gut Content
Larvae exposed to different light regimes differed in size as the experiment progressed. At 10 DPH, larvae reared under LDB were longer than those maintained under LDW, LDR, and LL conditions, while the larvae under DD were the smallest (Table 1). The longest larvae at 40 DPH were those maintained under LDB (9.6 ± 0.09 mm), LDW (8.5 ± 0.08 mm), and LL (7.1 ± 0.09 mm), which were longer than those reared under LDR (5.4 ± 0.07 mm) (ANOVA, Duncan test, F = 4.55, p = 0.035).
We also observed differences in foraging behavior: during the light phase (ZT6), larvae under LDR showed a lower proportion of feeding than those under the other treatments (ANOVA, Tukey test, F = 5.11, p = 0.034). At night (ZT19), larvae under LDR and LL showed a higher proportion of feeding than LDW and LDB treatments (ANOVA, Tukey test, F = 4.68, p = 0.037). Larvae under LL and DD showed no difference in the proportion of feeding and prey per larva at different sampling times, but at ZT6, larvae under LL, LDB, and LDW exhibited more prey per larva than those reared under the LDR and DD condition (ANOVA, Tukey test, F = 5.32, p = 0.033). The LL and LDR groups showed higher proportions of prey per larva than LDB, LDW, and DD at ZT19 (ANOVA, Tukey test, F = 4.36, p = 0.028) (Fig. 2).
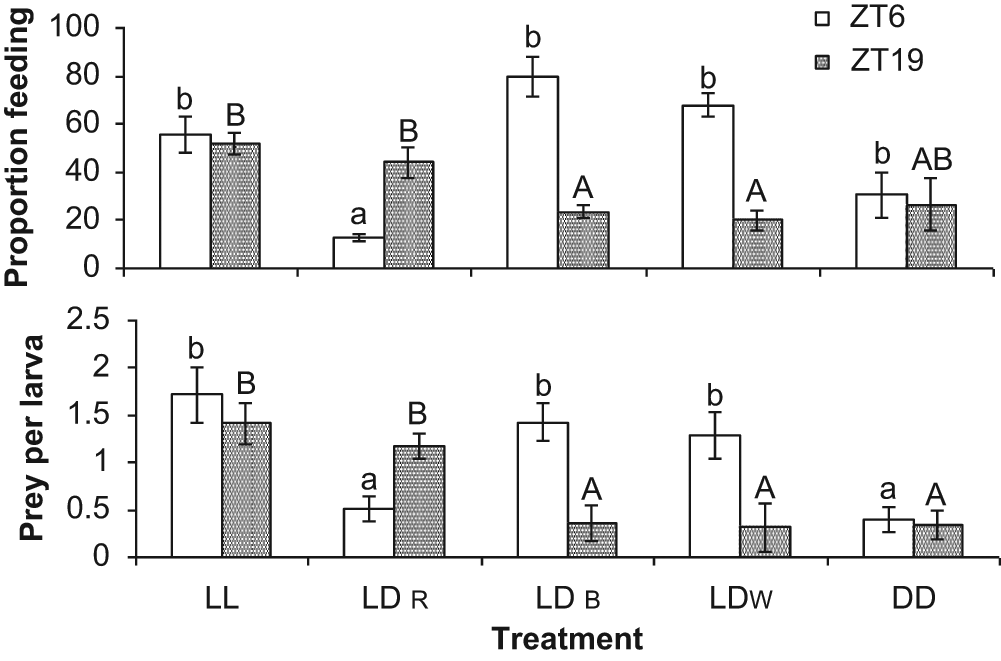
The proportion of sampled sole larvae with rotifers in their guts (A) and the mean number of rotifers found in larval guts (B) for larvae from 3 to 7 days posthatching exposed to different light regimes and spectra. Different letters indicate means within treatments significantly different from each other (lowercase letters refer to ZT6, and capital letters refer to ZT19) (ANOVA, Tukey test, p < 0.05).
Locomotor Activity Rhythm
Sole larvae quickly develop activity rhythms, so that they showed a clearly marked daily pattern of activity from 3 DPH onwards under LD cycles. The larvae reared under LDB and LDW showed a strictly diurnal activity pattern before the onset of metamorphosis at 10 DPH (the criterion for defining the beginning of metamorphosis was the eye migration), when they inverted their activity pattern and became nocturnal (Fig. 3A and 3B). Moreover, the LDB group underwent the diurnal-nocturnal activity switch 1 day earlier (9 DPH) with regard to larvae maintained under LDW, which became nocturnal from day 10 DPH (Fig. 3A and 3B). However, larvae under LDR showed a clear pattern of nocturnal activity throughout the experimental period, independently from the beginning of the metamorphosis at 13 DPH, and there was no change in their locomotor activity, as occurred under the LDB and LDW conditions (Fig. 3C).
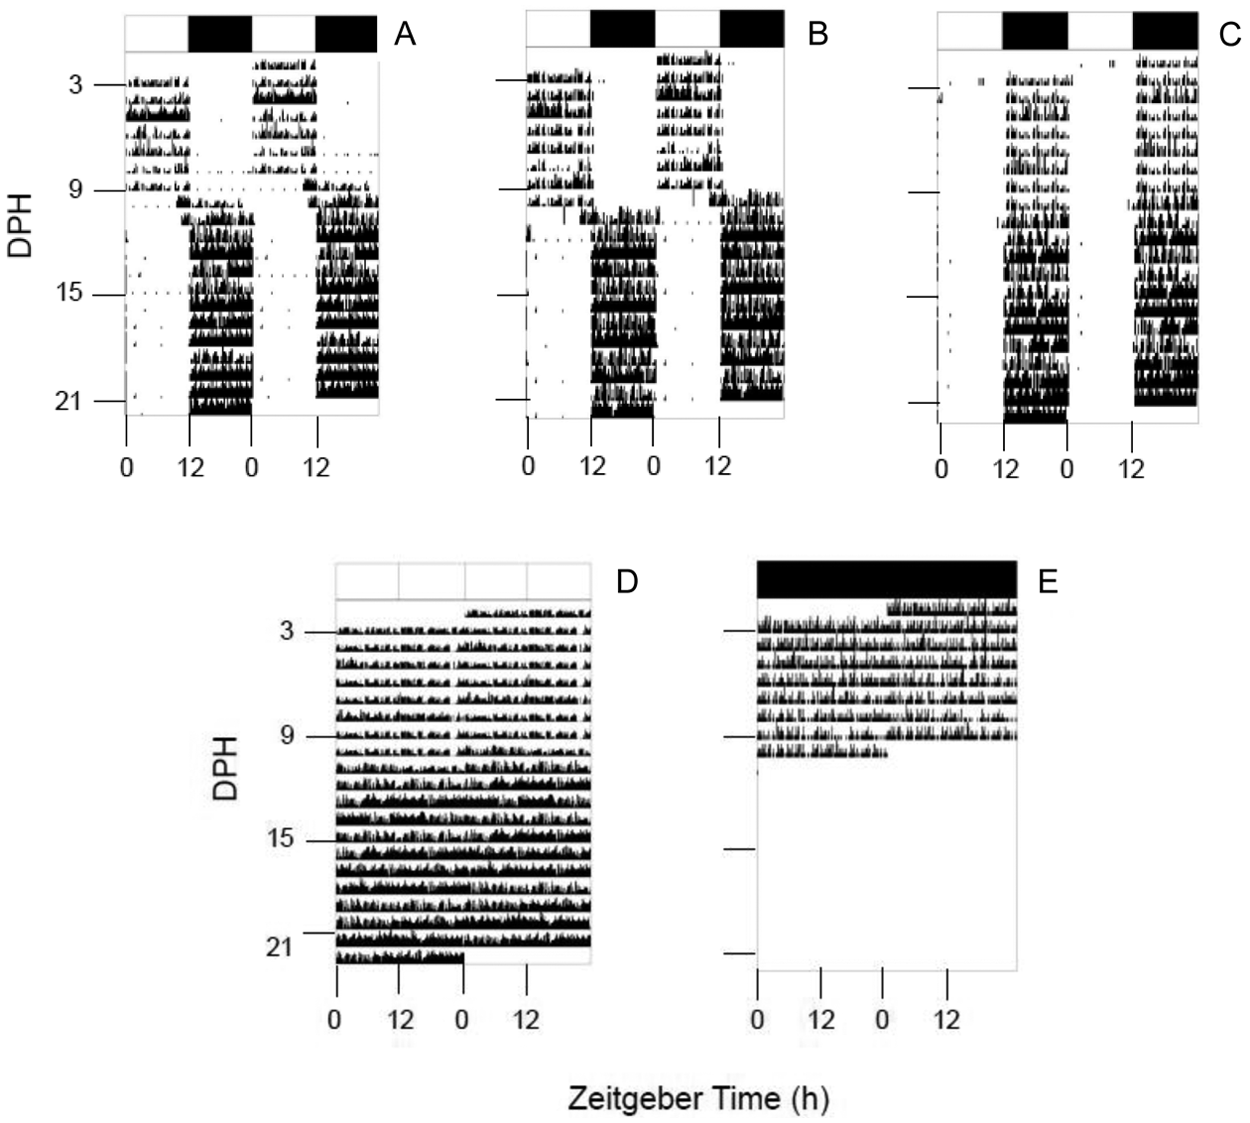
Representative actograms of activity of sole larvae (Solea senegalensis) reared with a 12L:12D (LD) photoperiod of (A) blue light (LDB), (B) white light (LDW), (C) red light (LDR), (D) constant light (LL), and (E) constant dark (DD) conditions. The actograms are double plotted (time scale, 48 hours) for better visualization. The white and black bars at the top indicate the light and dark phases of the LD cycle, respectively.
The fish reared under LL and DD did not show any marked rhythmic activity pattern. The larvae under LL began metamorphosis at 10 DPH, like LDB and LDW. The activity recorded under DD was low, and it was impossible to continue the study in the DD condition from 10 DPH onwards due to the high mortality rate of larvae (Fig. 3D and 3E).
MAPs
From the swimming duration of the larvae under different conditions (Fig. 4), we see that the larvae maintained under LDW changed their behavior from 7 DPH onwards, swimming more in MD than in ML (ANOVA, Tukey test, F = 5.31, p = 0.027), while those under LDB and LL showed a gradual increase in the duration of swimming from 7 DPH in both ML and MD (ANOVA, Tukey test, F = 4.96, p = 0.034). Also, from 9 DPH, the LDR and DD treatments showed shorter swimming times than the other treatments in both ML and MD (ANOVA, Tukey test, F = 4.75, p = 0.031).
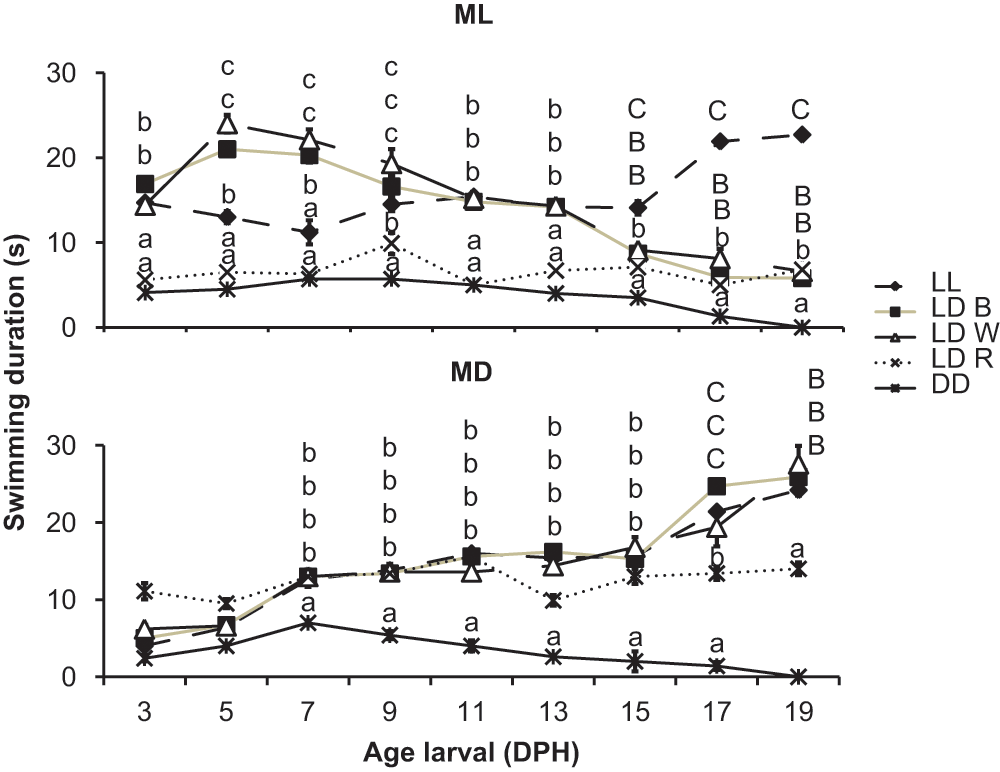
Swimming duration of sole larvae exposed to different light regimes and spectra. Data are expressed as mean ± standard deviation. Different letters indicate statistical differences between groups and developmental time (ANOVA, Tukey test, p < 0.05).
There were also significant differences between capture success and attack rates (Fig. 5). The larvae under LDW showed a higher rate of capture and attack during ML than during MD until 9 DPH (ANOVA, Tukey test, F = 5.57, p = 0.038), whereas the inverse pattern was observed from 11 to 15 DPH (Fig. 5A and 5B). Larvae under LDB showed a similar pattern to those in LDW (ANOVA, Tukey test, F = 3.38, p = 0.066) (Fig. 5C and 5D), while those reared under LDR, unlike other larvae, showed in all cases higher percentages of capture and attack in MD (Fig. 5E and 5F). In larvae maintained under LL, captures and attacks increased over time (Fig. 5G and 5H), unlike in the DD condition, in which larvae capture and attack rates were lower and almost invariable during development (Fig. 5I and 5J). In LL and DD, there was no clear daily pattern of behavior (Fig. 5G and 5J), as in the LDB, LDW, and LDR treatments.
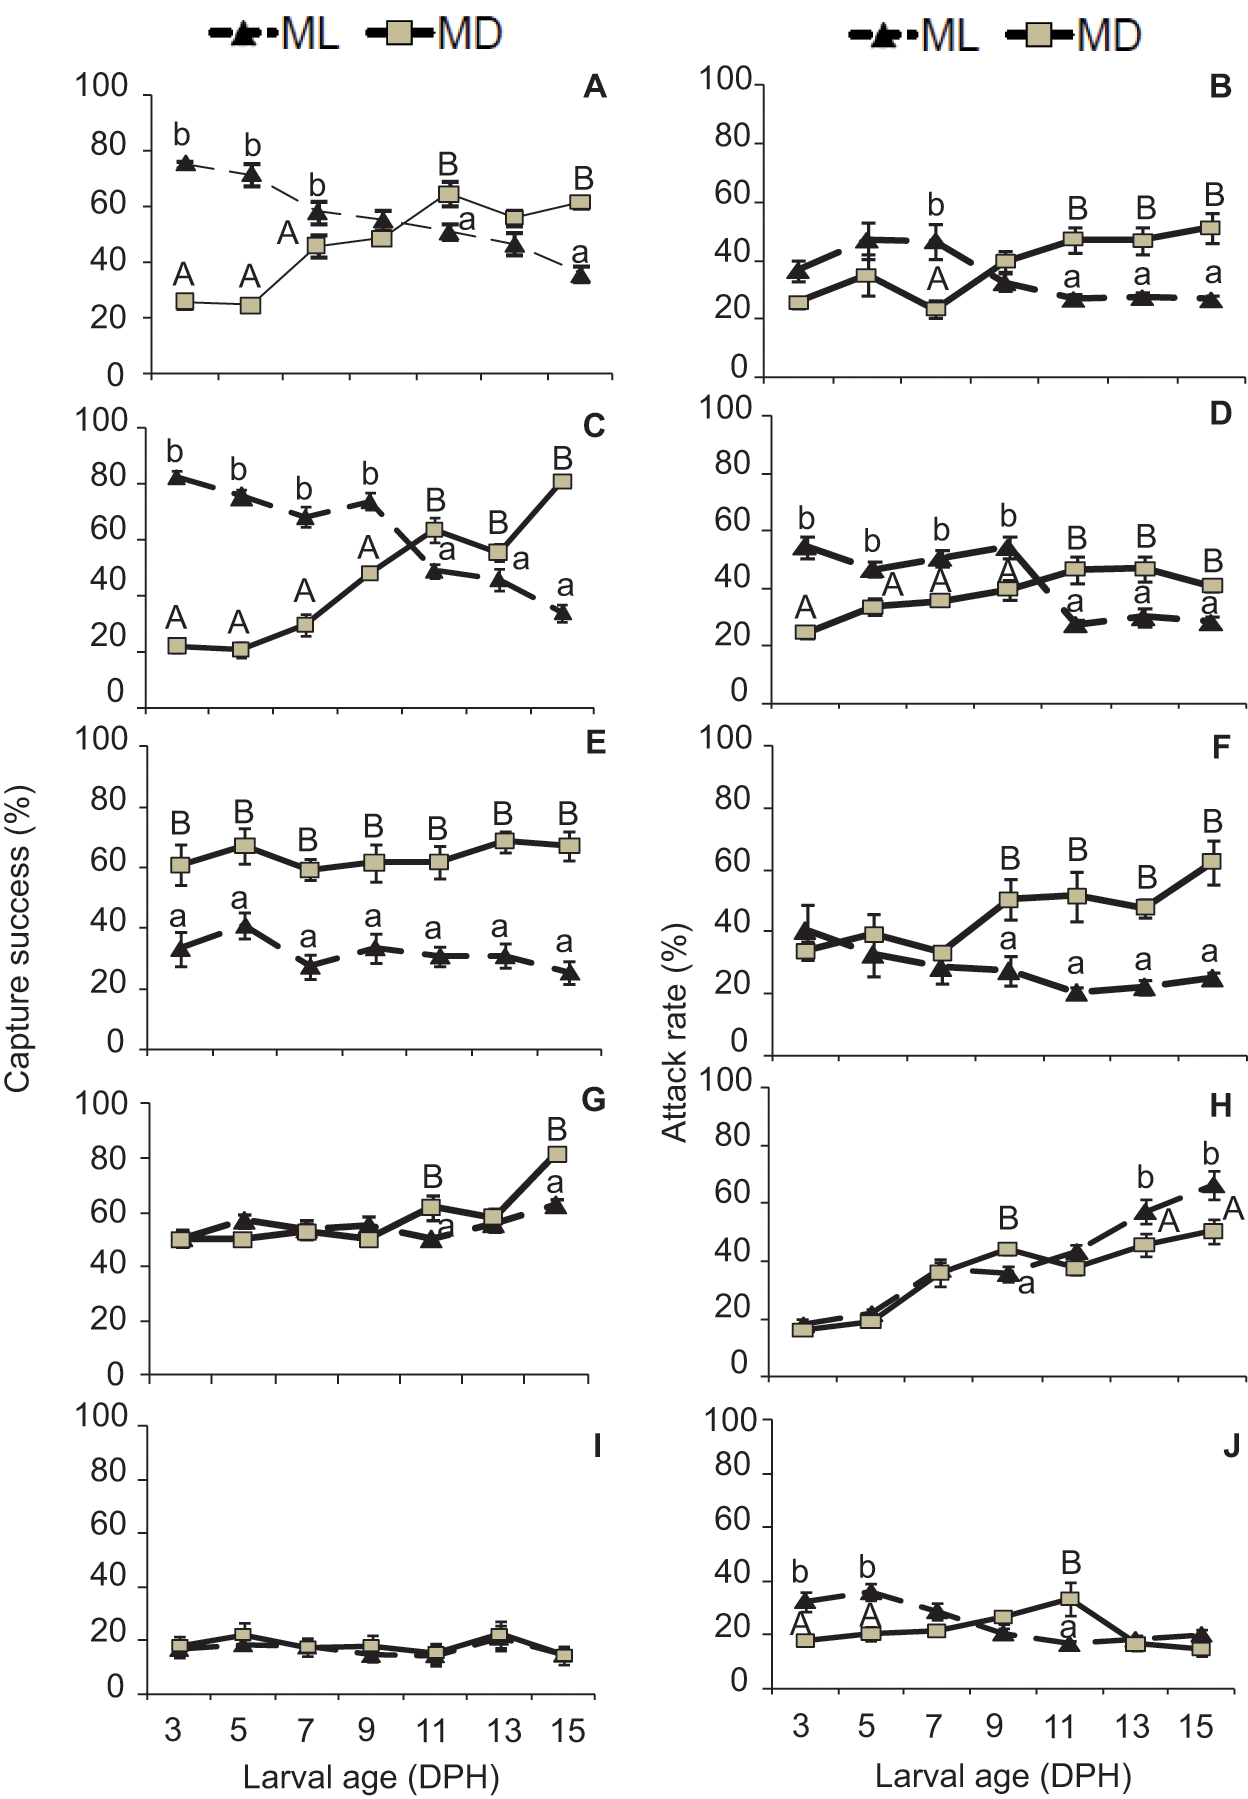
Capture success rate (# min -1) of sole larvae exposed to different light spectra: (A) white light (LDW), (C) blue light (LDB), (E) red light (LDR), (G) constant light (LL), and (I) constant dark (DD) conditions. Attack rate (# min -1) of sole larvae exposed to different light spectra: (B) white light (LDW), (D) blue light (LDB), (F) red light (LDR), (H) constant light (LL), and (J) constant dark (DD) conditions. Data are expressed as mean ± standard deviation. Different letters indicate statistical differences between groups (lowercase letters refer to ML, and capital letters refer to MD) (ANOVA, Tukey test, p < 0.05).
Discussion
Our observations revealed that lighting conditions modified the onset of daily activity rhythms and brought out different behavioral responses in sole larvae. LDB and LDW cycles provided the best results in terms of swimming duration, capture success rate, and attack rate during the light phase, and most interestingly, these treatments triggered behavioral changes. Indeed, both LDW and LDB cycles produced well-defined daily locomotor activity rhythms, which shifted from diurnal to nocturnal following meta morphosis. Contrasting constant light conditions (LL and DD) prevented the development of daily rhythms, leading to arrythmicity, while LDR induced nocturnal activity from 3 DPH.
Previous research indicates that depending on the fish species studied, contrasting outcomes can be found, suggesting that the responses to light depend on phylogenetic and ecological factors (Downing, 2002; Marchesan et al., 2005). If a given lighting regime enhances the growth and development of fish larvae (Vallone et al., 2007), it will in turn improve their capacity to swim and to detect and capture food. In our study, larvae reared under LDB and LDW conditions showed higher percentages of prey attacks and captures than the other treatments. This may be related to the fact that the larvae showed advanced development under LDB and LDW lighting regimes, the biometric parameters responsible for carrying out the MAPs (opening of the mouth, appearance of fins, and pigmentation of the eyes) being developed earlier under these conditions than under LDR and DD (Blanco-Vives et al., 2010, 2011). In addition to development, our present results revealed that the behavior of larvae was also affected by light. Indeed, larvae under LDB and LDW were the most active (longest swimming duration) compared with larvae reared in DD or LDR conditions. These experimental conditions (LD cycles and blue wavelengths) closely mirror the underwater environmental conditions that this benthonic fish finds in the wild because the water column acts as a chromatic filter, quickly absorbing long wavelengths, so that blue becomes predominant as depth increases (Jerlov, 1968).
It seems that light is a key factor not only for fish larvae but also for the hatching rate and timing of embryos (Blanco-Vives et al., 2011). Light and/or melatonin effects on hatching have also been reported in fish eggs (Helvik and Bernt, 1993; Danilova et al., 2004). In sole, light information is transduced through the pineal into melatonin rhythms (Oliveira et al., 2007). The ontogenetic expressions of the pineal (Aanat2) and retinal (Aanat1a and Aanat1b) melatonin-synthesizing enzymes have been characterized in sole, and cone opsin and rodopsin photoreceptor cells have been identified in the developing and adult pineal organ of this species (Confente et al., 2008; Isorna et al., 2009a, 2011). Most curiously, the expression of Aanat2 was detected as early as 12 hours postfertilization (0 DPF), and this expression increases between 0 and 2 DPF, when hatching occurs (Isorna et al., 2009a). At 2 DPF, pineal photoreceptors (but not retinal photoreceptors) already contain opsin photopigments, suggesting that the pineal organ is mediating the effects that light has on sole hatching and early development.
Basic questions concerning the biological clock are when the system starts to cycle and how light affects its development. In rainbow trout, Davie et al. (2011) found recently that clock systems are present and functional during embryonic development. In this context, our results point to differences in the development of the circadian system of sole according to the environmental conditions in which they develop. The Period gene family has been proposed as key clock genes for the control of activity rhythms in fish (Pando et al., 2001; Kaneko et al., 2006). As recently reported in adult Senegal sole, Per3 exhibits a significant daily oscillation in visually related neural tissues such as the retina and optic tectum (Martín-Robles et al., 2011). Ongoing research aims to characterize the ontogeny of clock gene expression in sole larvae, which appears to be functional very early (A. Martín-Robles and J.A. Muñoz-Cueto, personal communication), and it is most likely influenced by light and temperature cycles during larvae development. This information, together with the present behavioral findings, will contribute to a better understanding of the molecular clockwork sustaining circadian rhythms and the switch from diurnal to nocturnal behavior during metamorphosis, which might provide useful information of practical interest for sole aquaculture.
Our results are consistent with those obtained by Bayarri et al. (2004), who observed that adult sole are strictly nocturnal. In our experiment, sole larvae during metamorphosis in the LDW, LDB, and LDR treatments also showed strict nocturnal activity. However, no studies have previously taken into account the activity rhythm of flatfish larvae before metamorphosis, and so our data revealed for the first time that the larvae of this species show a diurnal pattern before 9 DPH, shifting to nocturnalism during metamorphosis. A similar phase inversion phenomenon occurs in juvenile Atlantic salmon (Salmo salar), in which a temperature-dependent switch from diurnal to nocturnal activity has been described (Fraser et al., 1993), in sea bass that undergo seasonal inversions (Sánchez-Vázquez et al., 1995, 1998), and even in mole rats (Spalax ehrenbergi) (Oster et al., 2002). In contrast, this developmental pattern was disrupted in sole larvae under LDR, which were nocturnal throughout the experiment, and under LL or DD, which became arrhythmic. Taken together, these findings indicate that light and photoperiod are key factors in setting the pace of rhythmic activity in this species. Recent studies in sole showed that under LD conditions, the expressions of different melatonin-generating enzymes (Aanat1a, 1b, and 2) were much higher in early ontogenetic stages and declined dramatically before the onset of metamorphosis, while thyroid hormone levels and Aanat1b expression showed the inverse temporal profile, increasing during metamorphosis (Isorna et al., 2009a, 2009b, 2011). The possible relation between these changes in the melato ninergic system and the shift from diurnal to nocturnal activity rhythms requires further investigation.
In nature, the most common foraging mode used by carnivorous larvae is visual detection, and so the encounter rate between fish and prey seems to depend on factors such as the contrast of the prey against the background, the visual capabilities of the predator, and the ambient light (Aksnes and Utne, 1997; Utne-Palm, 1999; Huse and Fiksen, 2010). In general, zooplankton become more visible to predators when the background illumination contains this particular spectrum profile (blue wavelengths, 470 nm), as occurs in nature (Novales Flamarique and Browman, 2001). In the present study, the poor foraging behavior displayed by larvae under red light suggested that the larvae needed better illumination (color) in order to find and successfully capture prey. Many studies (Utne-Palm and Bowmaker, 2006; Downing and Litvak, 2001; Max and Menaker, 1992; Bayarri et al., 2002) on larvae foraging behavior considered only 1 or 2 critical factors that influence prey detection and ingestion (Huse and Fiksen, 2010). Despite the clear evidence of the impact of light, no model to date has incorporated the impact of light quality on larval rhythmic foraging behavior and their switch from diurnal to nocturnal. In our findings in sole, feeding was consistently better under blue and white light, in accordance with Villamizar et al. (2011b), who observed that sea bass larvae under blue light could detect and capture more prey than larvae under red and white light regimes. A visual system refined for the rapid identification and capture of prey in the natural environment allows larvae to exploit a patchy prey distribution both temporally and spatially (Villamizar et al., 2011a). Poor feeding performance under red light was probably due to a lack of photons of the appropriate wavelength to stimulate the visual pigments. In the dark, sole larvae were also found to consume prey, albeit infrequently and in lower numbers. This may have unlikely been a consequence of accidental ingestion during osmoregulatory drinking (Huse, 1994), but a consequence of high food abundance, which may have increased the probability of chance encounters between larvae and prey (Connaughton et al., 1994). The ability of sole larvae to feed with varying degrees of success under all light conditions tested is not surprising given that climactic conditions may expose larvae to a wide range of spectral environments in nature. The results of the present study suggest that spectral light is a critical factor for feeding success and, by inference, the visual range of sole larvae.
In summary, our findings reveal for the first time the existence of daily rhythmic behavioral patterns in developing sole larvae reared under different lighting conditions and confirm that the early development of Senegal sole eggs and larvae is strongly affected by light characteristics (both photoperiod and spectrum). Because “unnatural” or inappropriate environmental conditions seriously compromise the welfare of fish larvae and negatively affect their survival and performance (Villamizar et al., 2009), light/dark cycles of blue wavelengths appear to be the optimal conditions and a prerequisite for the proper development of the biological clock and behavior of sole larvae.
Footnotes
Acknowledgements
This research was funded by the Spanish Ministry of Science and Innovation (MICINN) by projects “CRONOSOLEA” AGL2010-22139-C03 to F.J. Sánchez-Vázquez and J.A. Muñoz-Cueto, AQUAGENOMICS (Consolider-Ingenio Program) and SENECA (Ref. 08743/PI/08) to F.J. Sánchez-Vázquez, and the Regional Government of Andalusia (P06-AGR-019399) to J.A. Muñoz-Cueto. Thanks are also due to COST ACTION 867 (Fish Welfare) and FA0801 (Larvanet), in which part of these results were presented and discussed. B. Blanco-Vives was supported by an FPI scholarship from the MICINN. The authors thank Abdeslam El M’Rabet for his help in sampling animals.
The author(s) have no potential conflicts of interest with respect to the research, authorship, and/or publication of this article.