
Abstract
Honey bee workers care for (“nurse”) the brood around the clock without circadian rhythmicity, but then they forage outside with strong circadian rhythms and a consolidated nightly rest. This chronobiological plasticity is associated with variation in the expression of the canonical “clock genes” that regulate the circadian clock: nurse bees show no brain rhythms of expression, while foragers do. These results suggest that the circadian system is organized differently in nurses and foragers. Nurses switch to activity with circadian rhythms shortly after being removed from the hive, suggesting that at least some clock cells in their brain continue to measure time while in the hive. We performed a microarray genome-wide survey to determine general patterns of brain gene expression in nurses and foragers sampled around the clock. We found 160 and 541 transcripts that exhibited significant sinusoidal oscillations in nurses and foragers, respectively, with peaks of expression distributed throughout the day in both task groups. Consistent with earlier studies, transcripts of genes involved in circadian rhythms, including Clockwork Orange that has not been studied before in bees, oscillated in foragers but not in nurses. The oscillating transcripts also were enriched for genes involved in the visual system, “development” and “response to stimuli” (foragers), “muscle contraction” and “microfilament motor gene expression” (nurses), and “generation of precursor metabolites” and “energy” (both). Transcripts of genes encoding P450 enzymes oscillated in both nurses and foragers but with a different phase. This study identified new putative clock-controlled genes in the honey bee and suggests that some brain functions show circadian rhythmicity even in nurse bees that are active around the clock.
Circadian rhythms are thought to synchronize internal processes with ambient conditions and to allow the organism to anticipate changes in the environment (Dunlap et al., 2004; Yerushalmy and Green, 2009). The core clock machinery regulates a large set of clock control genes (CCGs), and the transcripts of many of these genes show circadian rhythms (Lin et al., 2002b; McDonald and Rosbash, 2001; Akhtar et al., 2002; Blasing et al., 2005; Wijnen et al., 2006), and their coexpression networks have been inferred (Rodriguez-Zas and Ko, 2011; Ko et al., 2009; Ko et al., 2010). Identification of CCGs and elucidation of their function are an important line of research in chronobiology (Taghert, 2001; Sato et al., 2003; Bell-Pedersen et al., 2005; Tauber and Kyriacou, 2005; Doherty and Kay, 2010).
The honey bee (Apis mellifera) provides an excellent model in chronobiology because its circadian clock is involved in complex behaviors such as time-linked memory, sun-compass orientation, and dance communication (Bloch, 2009; Bloch, 2010). In addition, honey bees show striking natural plasticity in circadian rhythms that is associated with the division of labor that organizes their complex societies. Worker foragers exhibit strong circadian rhythms and are active during the day and asleep during the night, as fits their dependence on the diurnal rhythms of floral nectar and pollen availability. Worker nurse bees care for the brood around the clock and exhibit no clear circadian rhythms (Bloch, 2010; Bloch, 2009). Shemesh et al. (2010) recently showed that the arrhythmicity of nurse bees is socially regulated and requires direct contact with the brood. Circadian rhythmicity is context dependent, and nurse bees that are removed from the hive to individual cages in a constant laboratory environment show circadian rhythms with higher activity during the subjective day (Shemesh et al., 2007; Shemesh et al., 2010). These observations suggest that some pacemakers keep on measuring time in the brain of around-the-clock active nurse bees.
Microarray gene expression experiments in fruit flies and mice have estimated that 2% to 10% of all genes studied exhibit circadian oscillations (Lin et al., 2002b; Akhtar et al., 2002; Doherty and Kay, 2010; Duffield, 2003; Keegan et al., 2007). The first objective of this study was to identify genes showing circadian rhythms of expression in the brain, as a first step toward identifying clock-controlled genes in the honey bee brain (putative CCGs). The second objective was to characterize the circadian profiles of gene expression and identify common and distinct profiles for nurses and foragers. The third objective was to gain functional insights by identifying biological processes and molecular functions enriched among the genes showing circadian patterns in nurses and foragers.
Materials and Methods
Honey Bees
Two honey bee “source” colonies kept according to standard beekeeping techniques at the bee research facility on the Edmond J. Safra Campus of the Hebrew University of Jerusalem, Givat-Ram, Jerusalem, Israel, were used. The bees were derived from a mixture of European races of Apis mellifera typical to Israel. In colony S11, the queen was instrumentally inseminated with semen from a single drone (at the Bee Breeding Station, Israeli Ministry of Agriculture, Tzrifin, Israel). The coefficient of relatedness among offspring of single drone–inseminated queens is 0.75 because drones are haploid. The queen in colony H1 was mated naturally (queens typically mate with 10-20 drones), and thus, this colony is expected to exhibit more variation.
“Triple-cohort” colonies were established with 3 cohorts (1000-1200 bees per cohort) of bees: 1-day-old bees, nurses, and foragers, and their mother queen (all from the same source colony). Each colony was housed in a 2-frame observation hive with transparent glass walls. One frame contained pollen and honey, and the second was empty for the queen to lay eggs. Nurses and foragers were identified according to standard criteria (Bloch et al., 2001). One-day-old bees were obtained by removing honeycomb frames containing pupae (sealed in cells) from source colonies in the field and immediately transferring them to a light-proof container that was then placed inside a dark incubator (32 °C ± 0.5 °C; ~60% relative humidity), from which the emerging bees were collected 0 to 24 hours after emergence.
The observation hive was housed in an environmental chamber (29 °C ± 1 °C; 50 ± 5% relative humidity) and connected to the outside by a clear plastic tube (length = 0.6 m, diameter = 3 cm). Approximately 200 to 300 foragers were paint marked in the daytime so they could be collected during times when foragers are inactive (e.g., at night). The experimental colonies were entrained for 3 to 6 days in a 12-hour light:12-hour dark (LD) illumination regime (colony S11: lights-on at 0800 h, lights-off at 2000 h; colony H1: lights-on at 0700 h, lights-off at 1900 h). Fluorescent lights (100 ± 30 lum/sqf) were positioned to ensure even lighting of the colonies, minimizing the possibility that bees could avoid light by hiding in dark corners of the hive. On the night of day 7, the tube leading to the outside was detached and placed inside a transparent box in the environmental chamber. During day 8 in which the colony was in DD, nurses and foragers were collected every 4 hours (at circadian times 2, 6, 10, 14, 18, and 22 hours) by flash freezing them in liquid nitrogen (Rubin et al., 2006). All collections, manipulations, and observations were performed under darkness (dim red light that bees cannot see) (von Frisch, 1967; Peitsch et al., 1992).
Microarray Analysis
mRNA extraction, amplification, and microarray protocols were as described by Alaux et al. (2009). Briefly, individual brains were homogenized, incubated, and centrifuged. RNA extraction followed the Qiagen RNeasy kit for total RNA with on-column DNase I treatment protocols (Qiagen, Valencia, CA), and amplification was performed using the Amino Allyl MessageAmp II aRNA Amplification kit (Ambion, Austin, TX). The microarray platform includes 26,800 oligos mostly stemming from the honey bee genome sequencing project (Honey Bee Genome Sequencing Consortium, 2006) that represent approximately 13,440 different oligos (with duplicate spots) and 2000 control sequences (Alaux et al., 2009). In vitro transcription provided the amplified RNA (aRNA) that was hybridized to the microarray slide. The Amino Allyl MessageAmp II aRNA Amplification kit (Ambion) was used for dye coupling and labeled aRNA cleanup (Alaux et al., 2009). An Axon 4000B scanner (Molecular Devices) was used to scan the slides, and the slide images were transformed into fluorescence intensity values using the GENEPIX software (Agilent Technologies, Santa Clara, CA).
Two bee samples were assigned to each microarray in a loop design (Suppl. Fig. S1). Each microarray included samples collected at 2 subsequent time points or at the 2 extreme time points (e.g., 2 and 22 hours) within a behavior group (nurse or forager) and colony (H1 or S11). Five bees were available per time point, behavior group, and colony, permitting the reverse labeling of the samples at each time point, behavior group, and colony. This design was completed with microarrays connecting both behavior groups and colonies. Each sample was present on at least 2 microarrays. We analyzed 140 samples: 5 bees × 2 behavior groups × 2 colonies × 6 time points + 20 samples to provide additional loop connections distributed across 216 microarrays. Microarray data generated in this study meet Minimum Information About Microarray Experiment (MIAME) standards and are available at ArrayExpress (http://www.ebi.ac.uk/microarray-as/ae/) under accession number E-MTAB-586.
Expression measurements were filtered and normalized following the steps described in Rodriguez-Zas et al. (2006) and Adams et al. (2011). Microarray spots that were flagged by the scanning software or that did not exceed the median of the control spots within the dye and microarray were removed from the analysis. Genes abundantly expressed in hypopharyngeal glands (located adjacent to the brain) were filtered because they could be a source of contamination (Alaux et al., 2009). The logarithmic base 2 transformation of the background-subtracted foreground intensities was normalized using a global LOWESS transformation to remove dye bias within the microarray, and duplicate spots within oligonucleotides were averaged following the routines available in Beehive (http://stagbeetle.animal.uiuc.edu/Beehive). Lastly, global dye and microarray effects were removed across all oligonucleotides. The normalized gene expression measurements were subsequently modeled to uncover circadian sinusoidal patterns within and across behavior groups.
Model
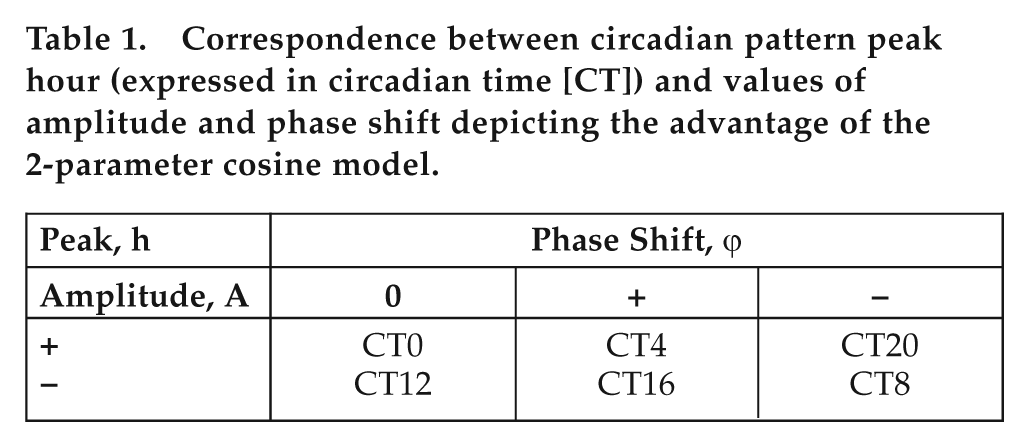
Gene expression was described using a cosine function or cosinor model of sinusoidal circadian pattern (Ware and Bowden, 1977; Marler et al., 2006). In the cosine function, parameter µ denotes the average level and the cyclic profile, parameter A (termed amplitude) is half of the difference between the peak and trough of the cycle, and thus, this is the definition of amplitude used in this study. When A > 0, A is computed as the difference between the peak and µ, and meanwhile, when A < 0, A is computed as the difference between the trough and µ. The location of the peak or trough of the cycle relative to the start of the cycle is defined simultaneously by A and parameter ϕ (termed phase shift). Sinusoidal circadian patterns are evidenced by a statistically (p value) and biologically (fold change) significant A. See Table 1.
Correspondence between circadian pattern peak hour (expressed in circadian time [CT]) and values of amplitude and phase shift depicting the advantage of the 2-parameter cosine model.
A single-step approach that uses a nonlinear mixed-effects model and a restricted maximum likelihood method was applied (Rodriguez-Zas et al., 1997; Rodriguez-Zas et al., 1998; Rodriguez-Zas et al., 2002a; Rodriguez-Zas et al., 2002b; Mikulich et al., 2003). The general nonlinear mixed-effects model used to describe gene expression was as follows:

where yijk denotes gene expression corresponding to the ith dye (Di, i = red or green), jth microarray slide (Sj, j = 1 to 216), and kth circadian time point (tk, k = CT2, CT6, CT10, CT14, CT18, CT22 h), and eijk denotes the error. The start point is 0 hours, and the quotient 24 models a profile that repeats itself within a 24-hour period. p values of A and ϕ within and across behavior groups were adjusted for multiple testing using the false discovery rate (FDR) approach (Benjamini and Hochberg, 1995). Genes were considered to exhibit a sinusoidal circadian rhythm if the amplitude was statistically (FDR-adjusted p < 0.05, equivalent to an unadjusted p < 0.005) and biologically (difference between the peak and trough was >1.25-fold change) significant.
Normalized gene expression profiles were also analyzed using ANOVA similar to that used in other temporal transcriptome analyses (Loor et al., 2005; Loor et al., 2006). The linear mixed-effects model included the effects of time, dye, array, behavior group, and interaction between time and behavior group. For this model, a test for a circadian trajectory comparable to the 1-step cosine model was obtained from the contrast between 2 time points 12 hours apart within and across behavior groups.
Gene Set Enrichment Analysis (GSEA) was used to identify Gene Ontology (GO) molecular functions and biological processes and KEGG pathways enriched among the genes exhibiting a sinusoidal circadian pattern (Kanehisa et al., 2004; Subramanian et al., 2005; Al-Shahrour et al., 2008). The gene identifiers used were the fruit fly genes corresponding to the honey bee homologs, and the differential expression indicator was the standardized amplitude estimate. The functional analyses p values were FDR adjusted.
Validation of Focal Transcripts with Quantitative Real-Time RT-PCR
Eight transcripts for which our microarray analyses predicted significant oscillations were further analyzed using qPCR. Nurses and foragers from 2 triple-cohort colonies (colony H7 with a naturally mated queen, colony S77 with a single drone–inseminated queen) that were set up as described for colony H1 were used in these experiments. The cohorts of bees in these experiments were somewhat larger (~1700 bees per cohort), and 5 samples from each behavioral group were collected over 7 time points (collection at time of day 2, 6, 10, 14, 18, and 22 hours during the first 24 hours and at 10 hours during the following day for colony H7; 1, 5, 9, 13, 17, and 21 hours for colony S77) instead of 6 as in the microarray experiment (Shemesh et al., 2010). The illumination regime was 12-hour light:12-hour dark (LD; lights-on at 0800 h) for 7 days followed by constant darkness during days 8 and 9, during which the bees were sampled for RNA analyses. The foragers were allowed to leave the hive and therefore experienced the natural day-night variation in light intensity.
mRNA levels were measured as in previous studies with real-time RT-PCR (Shemesh et al., 2007; Shemesh et al., 2010; Rubin et al., 2006). Briefly, bee heads were removed and freeze dried, and brains were dissected on a frozen dissecting dish in dry ice; the tissue remained frozen during the entire procedure. Compound eyes, ocelli, hypopharyngeal glands, and any other glandular tissues were removed during dissection; all brains that had lost pieces of tissue were discarded, and only intact brains were analyzed. Each brain was stored individually at −80 °C until mRNA quantification.
mRNA levels were measured with an ABI Prism 7000 machine (Applied Biosystems, Foster City, CA). Total brain RNA was isolated (Invisorb Spin Tissue RNA Mini Kit, Invitek, Berlin, Germany) and reverse transcribed in 20 to 25 µL 1x RT buffer + 2.5 U/µL Reverse Transcriptase (BioScript, Bioline, Taunton, MA), 4 mM deoxy NTPs mixture (Fermentas, Vilnius, Lithuania), 25 ng/µL random hexamers (Invitrogen, Carlsbad, CA), and 1 U/µL RNase inhibitor (RiboLock Ribonuclease Inhibitor, Fermentas). RNA and random hexamers were incubated at 70 °C for 4 minutes and immediately transferred to dry ice. Reverse transcription was carried out at 25 °C for 10 minutes, 42 °C for 60 minutes, and 70 °C for 10 minutes and then incubated at 4 °C. Amplification reaction (20 µL) contained SYBR green master mix (Applied Biosystems) and forward and reverse oligonucleotide primers (Suppl. Table S1). Each cDNA sample was analyzed in triplicate. PCR reactions for all focal genes and EF-1α were measured from the same cDNA sample and were loaded on the same 96-well analysis plate. Primers were designed to span over an exon-exon boundary. Gene levels were quantified with the 2−ΔΔCt method and EF-1α as a control gene for normalization. Measurements with dot blots, Northern blots, and RT-PCR indicated that levels of EF-1α did not vary with age, task, or time of day (Bloch et al., 2001; Rubin et al., 2006; Toma et al., 2000; Bloch et al., 2004). The ΔΔCt values, which were normally distributed, were analyzed with the single-step approach (cosine function) and ANOVA models described above.
Results And Discussion
General Results
Using the criteria described above for circadian rhythmicity, we detected 160 and 541 probes (“putative clock-controlled genes or CCGs”) in nurse and forager bees, respectively (Suppl. Tables S2-S4 and Figs. 1 and 2). This amounts to about 1.2% and 4% of the genes, for nurses and foragers, respectively, measured with this microarray, and 30 genes overlapped between groups at an amplitude A p value < 5 × 10⁻³. These estimates of clock-related genes compare with 0.2% to 3.5% in the fruit fly (Lin et al., 2002b; McDonald and Rosbash, 2001; Wijnen et al., 2006; Keegan et al., 2007; Ceriani et al., 2002; Claridge-Chang et al., 2001; Ueda et al., 2002). On a study of time-place memory in the honey bee, Naeger et al. (2011) found that approximately 10% of the transcripts showed significant differences in expression as a function of time of day, using the same microarray as we used, but they only sampled 2 time points during exposure to naturally fluctuating light. For our initial screen, we measured variation in brain transcripts under constant conditions over only one 24-hour cycle. We assume that most of the patterns and differences seen in the first cycle will be similar in subsequent cycles. Longer assessments are, however, necessary to establish what fraction, and which, of these variations is actually circadian.
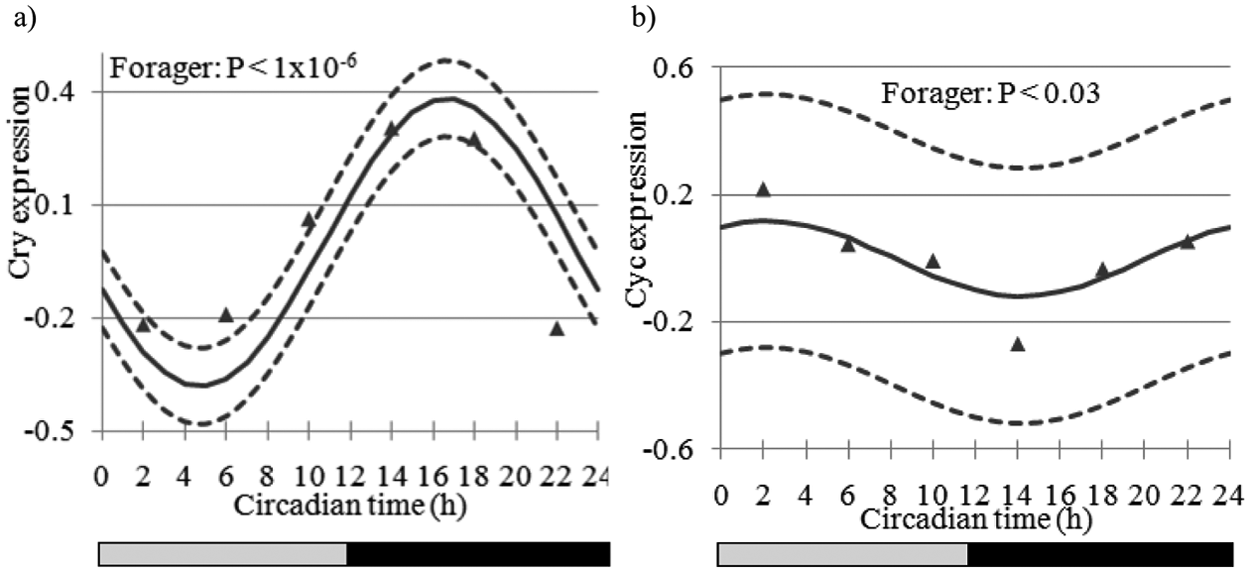
Estimated expression trajectory (vertical axis, solid line) across circadian time (CT in h, horizontal axis) for genes associated with the circadian rhythm pathway and the 95% confidence interval (dashed lines) of (A) Cryptochrome (Cry) (nonsignificant in nurse bees) and (B) Cycle (Cyc) in forager bees (nonsignificant in nurse bees). Triangle markers denote observed expression levels. The bars at the bottom depict the illumination regime across CT: black bar = subjective night (CT12 to CT24), and gray bar = subjective day (CT0 to CT12).
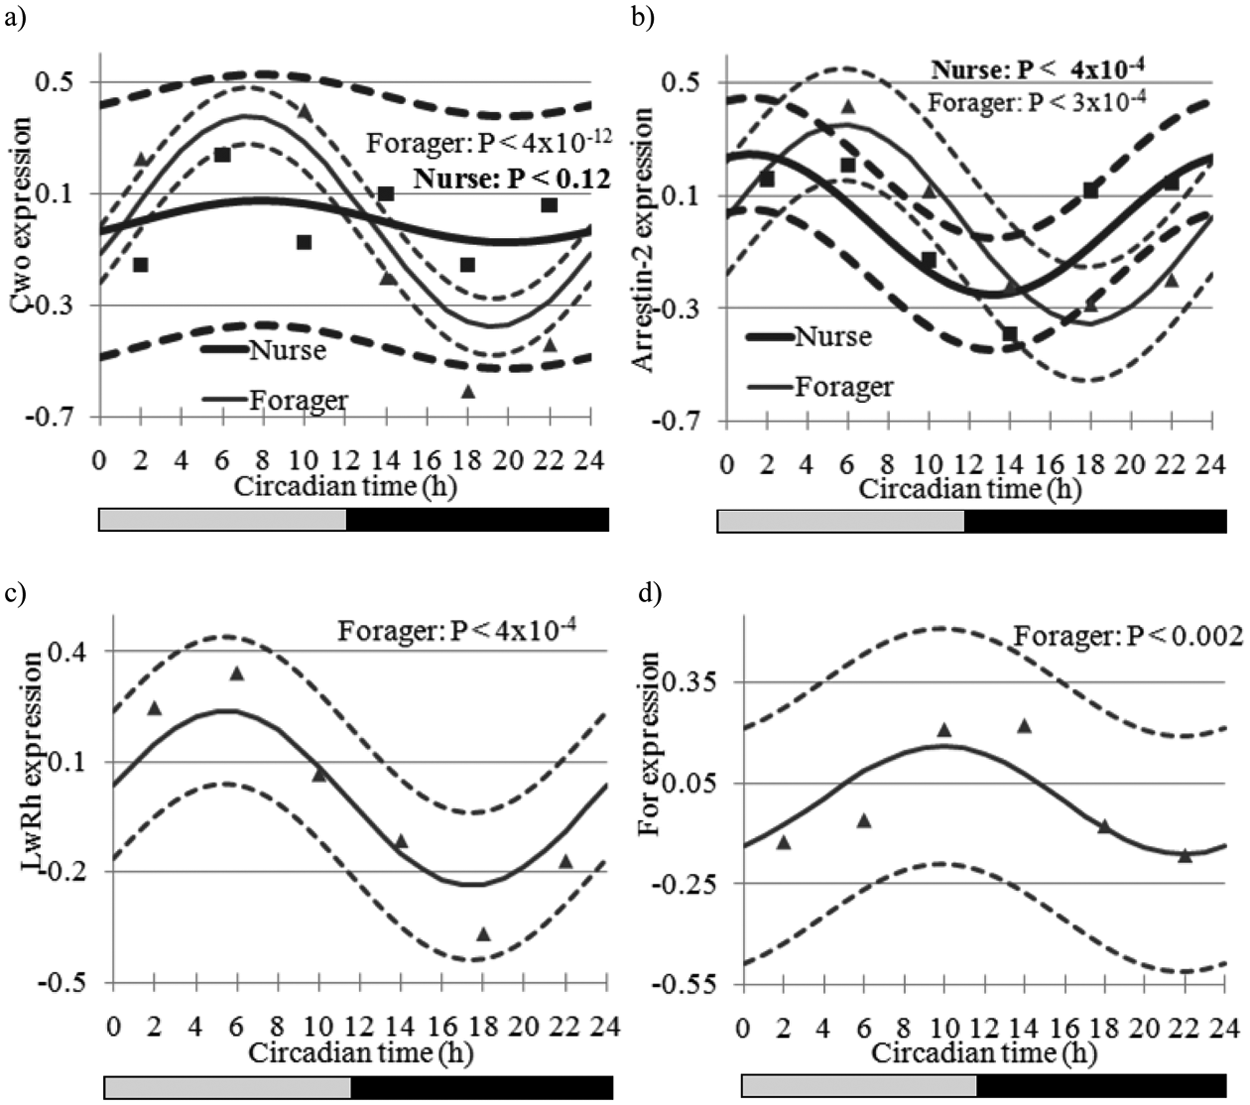
Estimated expression trajectory (vertical axis, solid line) across circadian time (CT in h, horizontal axis) and the 95% confidence interval (dashed line) of (A) Clockwork Orange (Cwo) in forager and nurse bees, (B) Arrestin-2 in nurse and forager bees, (C) Long-wavelength rhodopsin (LW Rh) in forager bees (nonsignificant in nurse bees), and (D) Foraging (For) in forager bees (nonsignificant in nurse bees). Nurse trajectories are denoted in bold relative to forager trajectories. Markers denote observed expression levels (square and triangle for nurse and forager bees, respectively). The bars at the bottom depict the illumination regime across CT: black bar = subjective night (CT12 to CT24), and gray bar = subjective day (CT0 to CT12). Other details as in Figure 1.
Comparing our list of oscillating genes in the honey bee brain to similar microarray analyses for Drosophila heads revealed that only a few genes cycled in both insects (Suppl. Table S5). However, the biological significance of this finding is not clear because Lin et al. (2002) found that only 19 genes cycled in 4 different microarray studies with Drosophila. Of the 340 unique genes scored rhythmic in at least 1 of these 4 circadian microarray studies, 84% were listed in only one study, suggesting either that many of the genes represent false positives or their oscillations depend on conditions that varied between the studies. Similarly, Keegan et al. (2007) compared these 4 studies and an additional one and found that the maximum overlap between any 2 gene lists was 27.8%, and the overlap dropped for any combination of 3, 4, or all 5 studies to 17.4%, 10.4%, and 9.7% (which equals 7 genes), respectively. The overlap did not improve even when the data sets of the 5 studies were analyzed with the same algorithm (Keegan et al., 2007). Comparison of results from the 1-step nonlinear and multistep ANOVA approach further confirmed the superiority of the former approach measured in terms of better model fit (predicted values closer to observed values) on the majority of the transcripts analyzed.
There is increasing evidence that global gene expression rhythms are affected by the time of feeding. Although there is substantial literature on the foraging behavior of honey bees, much less is known about the timing and pattern of when foragers and nurses actually eat. Consequently, we cannot presently assess the possibly significant impact of different feeding times of foragers and nurses on our results.
Division of Labor and Transcript Oscillation
The 30 genes that exhibited a sinusoidal circadian pattern (A p value < 5 × 10⁻³) both in nurse and forager bees are listed in Supplementary Table S4 and include the putative ortholog of Arrestin-2 (GB12766, a gene associated with the visual system) (Fig. 2B, see below), Tubulin at 56D (GB10275), Armadillo (GB12463), and Rhomboid-7 (Rho-7, GB14771). A Tubulin promoter has been associated with light arousal and circadian photoreception circuits in the Drosophila brain (Shang et al., 2008). Also, the level of Armadillo protein is elevated by members of the casein kinase 1 family such as the Doubletime protein that is part of the Drosophila circadian clock regulation (Yanagawa et al., 2002). Rho-7 affects Drosophila life span and neuronal function, and Rho-7 mutant flies have lower signaling in the first visual synapse and light-induced neurodegeneration of photoreceptors (McQuibbanet al., 2006). Half of these 30 genes had a similar phase in nurses and foragers. Four genes peaked at different parts of the day (subjective day or night) between behavior groups: Cytochrome P450 305d1 (GB11943), LOC552007 (GB10695), pyruvate kinase (CG33988), and Lysozyme-3 (GB19988). Supporting these findings, CG33988 mRNA was found to be enriched in circadian neuronal circuits of Drosophila (Nagoshi et al., 2010). Foraging (For, GB18394) was overex-pressed in forager relative to nurse bees in agreement with Ben-Shahar et al. (2002) and exhibited a marginal circadian pattern (A p value < 0.002; fold change = 1.25) (Fig. 2D) in foragers with a peak at 16 hours, but not in nurse bees. These results are interesting because there is evidence implicating For in the regulation of sleep (Sehgal and Mignot, 2011), but their significance is not clear because For transcript levels did not show significant variation over time in forager bees from colony S77 measured with a qPCR (p > 0.1; data not shown). In Drosophila, For mRNA levels have not been reported to oscillate (Lin et al., 2002b; McDonald and Rosbash, 2001; Wijnen et al., 2006; Keegan et al., 2007; Ceriani et al., 2002; Claridge-Chang et al., 2001; Ueda et al., 2002).
Clock Genes
Expression profiles for the clock genes Cryptochrome (Cry, GB10211), Cycle (Cyc, GB11309), and Clockwork Orange (Cwo similar to mouse DEC1, DEC2 proteins, GB13005) in bees are depicted in Figures 1 and 2. The profiles of the genes with significant circadian profiles are summarized in Supplementary Tables S2 and S3.
Our results for the clock genes Cry, Cyc, and Clock (Clk, GB17107) overall agreed with previous honey bee studies, both in terms of presence/absence of oscillation and phase (Shemesh et al., 2007; Shemesh et al., 2010; Rubin et al., 2006). For example, Cry showed a strong circadian rhythm (A p value < 1.0 × 10⁻⁶; peak-trough fold change = 1.70) with peak expression at CT17 in foragers but not in nurses (Fig. 1A and data not shown). Cyc showed weak oscillation with an almost antiphase to Cry, and Clk that did not oscillate in previous studies did not show significant oscillations in either nurses or foragers. Timeout (Tim2, GB30213) showed a trend consistent with that reported in Rubin et al. (2006). By contrast, we failed to detect significant cycling for Period (Per), which is enigmatic given consistent oscillations for its transcript in previous studies (Bloch et al., 2001; Bloch et al., 2004; Shemesh et al., 2007; Shemesh et al., 2010; Rubin et al., 2006; Toma et al., 2000). The lack of significant oscillations for Per in forager bees is enigmatic but consistent with microarray studies in fruit flies and mice in which well-characterized clock genes have not always shown significant oscillations (Lin et al., 2002b; McDonald and Rosbash, 2001; Claridge-Chang et al., 2001; Ueda et al., 2002; Panda et al., 2002). The attenuated oscillations in nurses for all the clock genes, including Per, however, are consistent with previous results (Shemesh et al., 2007; Shemesh et al., 2010; Bloch et al., 2001; Bloch et al., 2004). The honey bee ortholog of Cwo, which has not been studied before in honey bees, showed robust oscillations in foragers (fold change = 1.69; p < 10−12) (Fig. 2A) and had peak mRNA levels at CT7 but no significant oscillation in nurse bees. The microarray results for Cwo were corroborated by qPCR analyses with bees sampled from a different source colony (S77) (Fig. 3). The temporal pattern of Cwo expression is consistent with the premise that it is involved in, or affected by, the circadian system in honey bees. In Drosophila, Cwo mRNA levels oscillate with a peak at around CT/ZT12 (Kadener et al., 2007; Lim et al., 2007; Matsumoto et al., 2007).
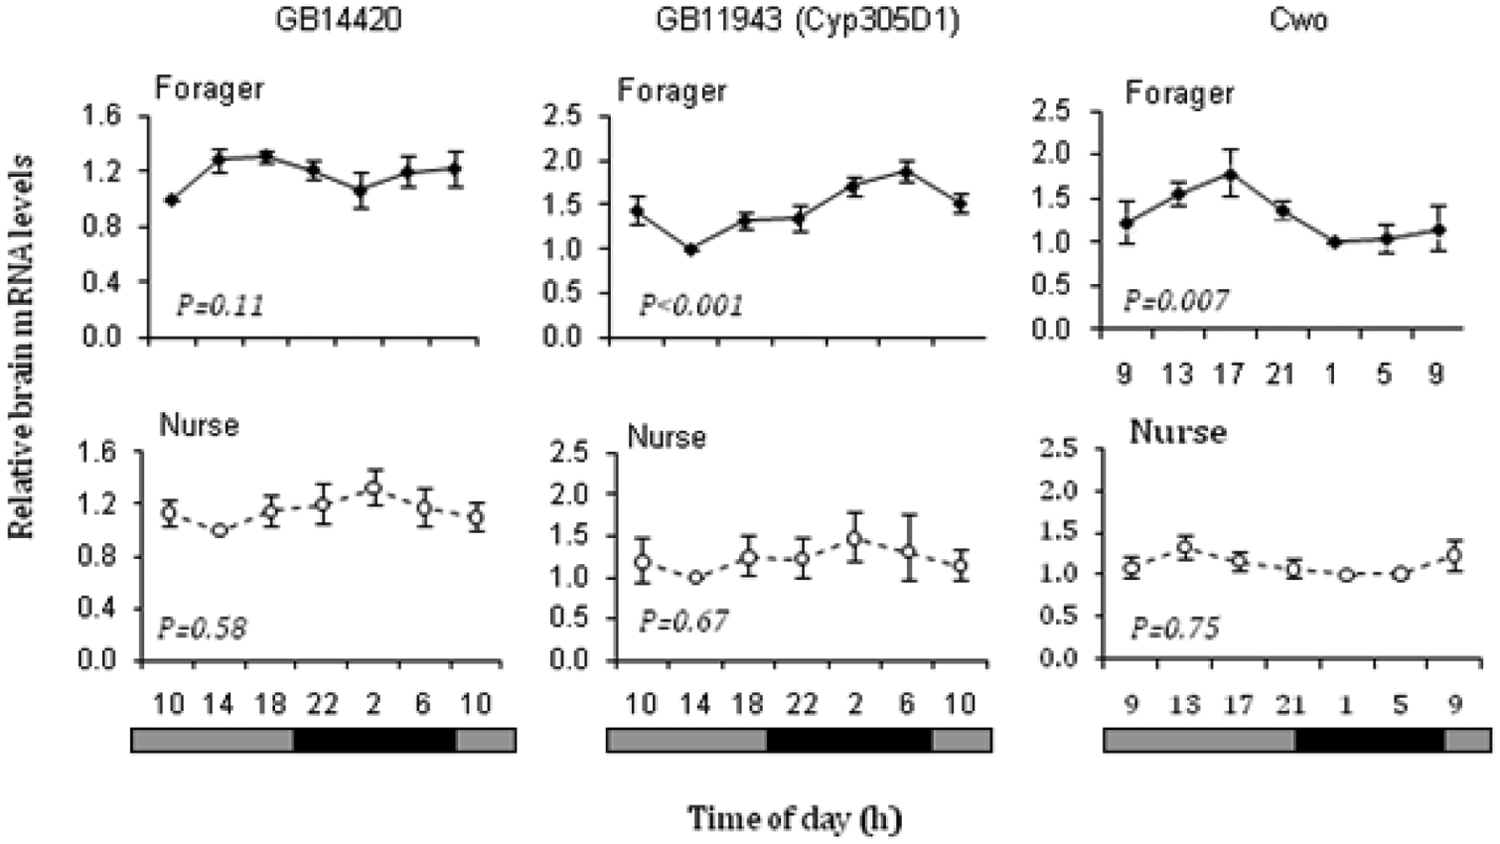
qPCR analyses for selected genes. The plots show relative whole-brain mRNA levels for GB14420 (similar to cropped, left column), BG11943 (Cyp305d1), a cytochrome P450–like protein (middle column), and Clockwork Orange (Cwo, right column) for both foragers (upper row) and nurses (lower row). Sample size was 5 for all the analyses. Relative brain mRNA levels in each plot are normalized relative to the time point with the lowest levels. The p value corresponds to 1-way ANOVA comparing the ΔCt values that are normally distributed. GB14420 and Cyp305d1 are shown for bees from colony H7 (similar results for Cyp305d1 were obtained for bees from colony S77); Cwo is shown for bees from colony S77. The bars at the bottom depict the illumination regime: black bar = subjective night, and gray bar = subjective day.
Genes Associated with the Visual System
Honey bee foragers are diurnal and rely heavily on their visual system, whereas nurses are active around the clock and spend most of their time inside the dark hive. We therefore examined the temporal expression pattern for 8 genes that are known from other organisms to be associated with the visual system. These genes are the putative honey bee orthologs of Arrestin-2 (GB12766), Arrestin-1 (Phosrestin-2, GB16006), Retinal rod rhodopsin-sensitive cGMP (GMP-PDE delta, GB11312), Rhodopsin-specific isozyme precursor (PPIase or Rotamase, GB11371), Pteropsin (GB12200; Velarde et al., 2005), Blue-sensitive opsin (Blop, GB13483), Ultraviolet-sensitive opsin (Uvop, GB18171), and Long-wavelength rhodopsin (LW Rh, GB19657). The expression profiles are summarized in Supplementary Tables S2 and S3, and the patterns for Arrestin-2 and LW Rh are depicted in Figures 2B and 2C. Most of these genes showed significant oscillations in foragers, in most cases with peak levels during the subjective day with the exception of Arrestin-1 and Pteropsin. The strong cycling in LW Rh and Arrestin-2 is consistent in both phase and pattern with Northern blot analyses from Sasagawa et al. (2003). These differences between nurses and foragers cannot be explained by direct effect of light on gene expression in foragers because both the nurses and foragers were collected in darkness. The oscillations of genes involved in the visual system in foragers are consistent with studies in Drosophila (McDonald and Rosbash, 2001; Keegan et al., 2007; Claridge-Chang et al., 2001), Limulus (Katti et al., 2010), and zebrafish (Li et al., 2008).
Genes Encoding Cytochrome P450 Proteins
Cytochrome P450 enzymes in insects are involved in a wide range of metabolic activities, including xenobiotic degradation, juvenile hormone and ecdysteroid biosynthesis, and pheromone metabolism (Feyereisen, 1999). The consistent appearance of cytochrome P450 (Cyp) transcripts in lists of genes oscillating in circadian and sleep microarray studies (McDonald and Rosbash, 2001; Keegan et al., 2007; Ceriani et al., 2002; Claridge-Chang et al., 2001; Ueda et al., 2002; Nagoshi et al., 2010; Cirelli et al., 2005; Pan et al., 2009) motivated us to ask whether P450 transcripts also oscillate in forager and nurse honey bees. Of the 43 predicted P450 genes for which there are probes in our microarray, 4 transcripts in nurses and 8 in foragers showed significant oscillations. Five additional P450s in nurses and one in foragers showed a trend of oscillations (A > 1.25 and p < 0.05, or 1.2 > A and p < 0.001). Three of these transcripts (GB19797, Cyp336a1, nomenclature following Claudianos et al. [2006]; GB11943, Cytochrome P450 305d1; and GB16803, Cyp9R1) oscillate in both behavioral groups (Suppl. Table S6). The oscillations in GB11943 (Cyp 305d1) were validated by qPCR for bees collected from 2 different source colonies (H7 and S77) (Fig. 3, and data not shown). In insects, the cytochrome P450 enzymes of the Cyp300 gene family have been suggested as being part of the ecdysteroid synthesis mechanism (Sieglaff et al., 2005; Rewitz et al., 2007), although the actual function of Cyp305d1 is yet to be determined (Claudianos et al., 2006). Interestingly, the phase of oscillation differed between tasks. Whereas in nurses, most of the oscillating P450 transcripts had a peak value during CT8 or CT12, in foragers, the peak occurred on CT20 or CT0, which may be associated with the anticipation of the subjective day (Suppl. Table S6). Genes coding for cytochrome P450s and glutathione S-transferases, which are involved in detoxification, also composed one of the largest category of wakefulness-related genes identified in Drosophila by Cirelli et al. (2005).
GO and Pathway Analysis
The top (most significantly enriched) functional terms or categories among the genes with significant A in nurse and forager bees are presented in Table 2, and the extended list of all significant categories is available in Supplementary Table S7. The enrichment of the generation of precursor metabolites and energy (GO:0006091), coenzyme metabolic processes (GO:0006732), and hydrogen transport (GO:0006818) processes was consistent in nurse and forager bees. This important result indicates that although foragers but not nurses show robust circadian rhythms in brain clock gene expression and in locomotor activity, and most oscillating transcripts did not overlap between task groups, they share many oscillating functions, processes, and pathways. Naeger et al. (2011) also found similar GO enrichment for brain gene expression associated with time of day in honey bees, including numerous mitochondria-associated terms and multiple terms associated with ribosomes and translation as well as proteasomes and catabolic processes. These results are consistent with other microarray studies and other lines of evidence that the circadian clock influences many metabolic processes (Green et al., 2008; Ueda et al., 2002; Panda et al., 2002; Harbison and Sehgal, 2009; Bass and Takahashi, 2010). Genes involved in protein synthesis composed the largest group of coordinately cycling transcripts in the mouse SCN (Panda et al., 2002).
Top enriched Gene Ontology (GO) functional terms and KEGG pathways enriched in nurse and forager bees at false discovery rate–adjusted p ≤ 5 × 10⁻⁴ (GO) and p ≤ 5 × 10⁻² (pathways) among genes that have sinusoidal circadian rhythm (significant amplitude A).
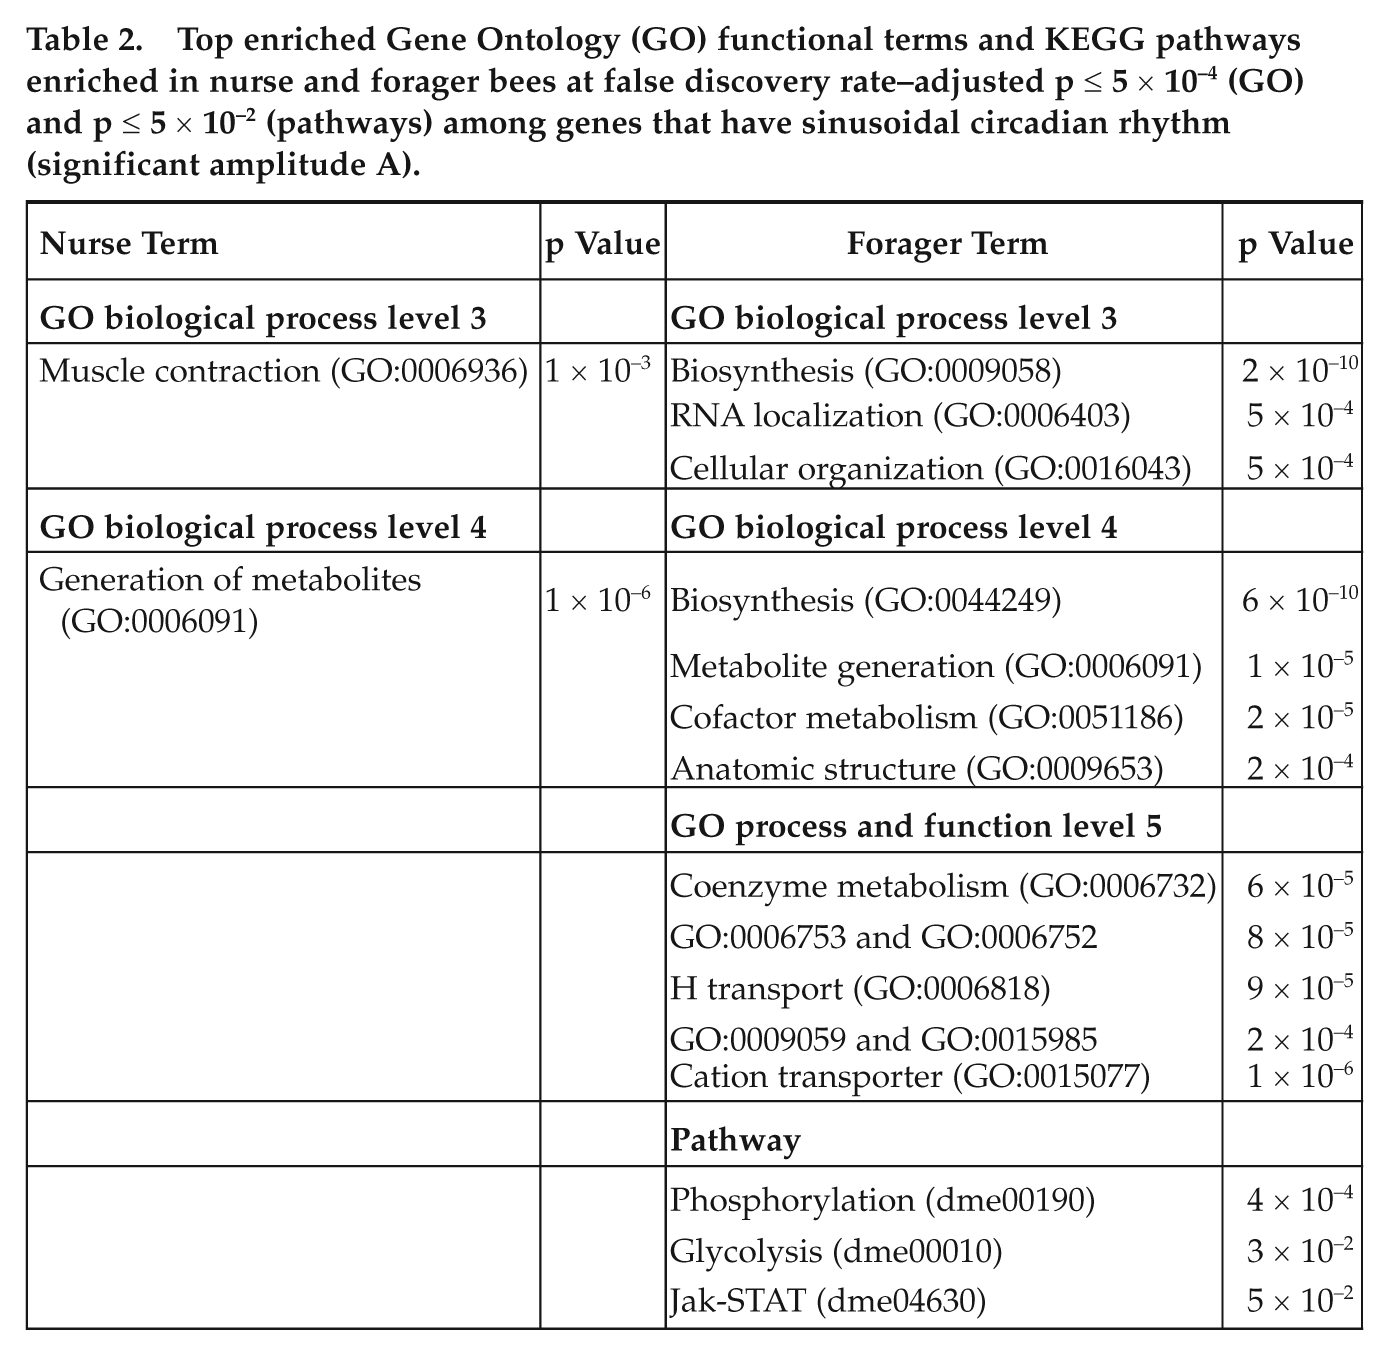
Muscle contraction (GO:0006936) and microfilament motor activity (GO:0000146) were enriched among genes with significant and negative A in general (Table 2); particularly interesting were those with negative ϕ (with a peak at approximately CT8) in nurse bees. Development-related processes (e.g., GO:0050793, GO:0048731) and detection of stimuli (GO:0009581, GO:0009582) were enriched in forager bees (Table 2 and Suppl. Table S8) and in particular among genes with negative amplitude and phase shift (subjective day, peak at around CT8). These results are consistent with the strong circadian variation in forager alertness (Eban-Rothschild and Bloch, 2008; Kaiser and Steiner-Kaiser, 1983) and consistent with previous reports that circadian rhythms may influence the response to a new iterative stimulus (Eisenstein and Eisenstein, 2006). The Janus kinase/signal transducer and activator of transcription (Jak-STAT) signaling pathway is enriched in forager bees (Table 2). This result is consistent with a report that plasma leptin follows a circadian rhythm and the Jak-STAT signaling pathway is coupled to leptin receptors in rats (Merino et al., 2008).
qPCR Validation
Eight probes that exhibited circadian oscillations in nurses and foragers were further investigated with qPCR, for bees sampled from 2 colonies different than those used for the microarray analysis (Suppl. Table S8). Three transcripts (GB18850, GB14420, and GB11943) showed a clear trend of oscillation in foragers, reaching statistical significance variation over time (1-way ANOVA for ΔCT values) only for the latter, for which significant variation over time was detected in 2 experiments, each with bees from a different source colony (Fig. 3 and data not shown, see above). The qPCR analysis of Cwo is consistent with the microarray results, with strong variation over time in foragers but not in nurses (Fig. 3). Our qPCR analyses did not detect significant variation over time in For for either foragers or nurses (data not shown).
It is striking that qPCR fails to validate the ability and reliability of our microarray results to demonstrate either the absence or the presence of a rhythm of transcription for any specific gene. This limitation, however, is similar to other studies using microarrays in circadian biology. Even in a study that was based on a data set composed from 5 microarray studies, qPCR validation was achieved in only 2 of 3 of the tested probes (Keegan et al., 2007). The fact that we performed the qPCR and microarray analyses with bees obtained from different source colonies (genotypes) could also contribute to the lack of qPCR support for a relatively large portion of the validated transcripts. As discussed above, genetic variation was proposed as one of the explanations for the low agreement between microarray studies with Drosophila heads (Lin et al., 2002; Keegan et al., 2007).
There was a trend (p = 0.11) toward variation over time for GB14420, which is similar to the transcription factor cropped, and the apparent phase was different from that for nurses. Cropped (CG7664) is a putative transcription factor, and there is some evidence that it cycles in Drosophila heads (McDonald and Rosbash, 2001). GB18850 is similar to Drosophila CG11138, and its function is unknown. There was a very weak trend in the analyses of cropped (GB14420) and Cyp305d1 (GB11943) for nurses. Similar trends for cropped and Cyp305d1 were obtained in a separate analyses for nurses and foragers, with RNA extracted from only the central brain (data not shown). The qPCR results for these 3 genes, GB11943, GB14420, and GB18850, and Cwo, although not always reaching statistical significance, suggest that our microarray study identified many bona fide putative clock-controlled genes, the first to be identified in the honey bee. Additional studies are necessary for rigorously confirming oscillations in these and other putative CCGs.
Conclusions
Our study provides a first genome-wide view of natural plasticity in circadian rhythms. Nurse bees that are active around the clock with attenuated circadian rhythms in behavior and clock gene expression show circadian oscillations in relatively few transcripts (n = 160) relative to foragers (n = 541). The findings, subject to qPCR confirmation, suggest that some transcripts oscillate in nurses and may imply that some processes are influenced by the circadian system even in the absence of circadian rhythms in behavior or brain clock gene expression. This hypothesis is consistent with 2 additional lines of observation. First, some of the previous studies with honey bees reported weak oscillations in the expression of clock genes in the brain of around-the-clock active nurses (Shemesh et al., 2007; Shemesh et al., 2010; Bloch et al., 2004). Second, nurse bees that were removed from the hives to a constant laboratory environment showed strong circadian rhythms with higher activity during the subjective day, suggesting that at least some of the clock cells in their brain continued to measure time while nevertheless maintaining activity around the clock in the hive. However, we cannot rule out the possibility that some of the oscillating transcripts in nurses are driven by external factors. These can be, for example, interactions with other individuals with strong circadian rhythms (e.g., foragers). Our microarray findings are overall consistent with the few studies in which honey bee transcript levels were measured around the clock (Cry, Cyc, Clk, Arrestin2, LW Rh, and GB19811). Our qPCR analyses further confirmed the variation over time in Cwo and Cyp305d1 and suggest trends of oscillations in several additional transcripts that appeared to vary over time in the microarray analyses. Further characterization of these oscillating transcripts by qPCR and in situ hybridization may be enlightening. Our functional analyses suggest that some processes that are influenced by the circadian system of nurses are shared with foragers (e.g., generation of precursor metabolites and energy, oxidative phosphorylation), while others are unique to nurses (e.g., muscle contraction, microfilament motor activity). This study is an important step in identifying CCGs and clock-regulated processes in the honey bee brain and sets the stage for characterizing the molecular processes that are regulated in a circadian fashion, even in nurses that are active around the clock with no circadian rhythms.
Footnotes
Acknowledgements
The authors thank Raphael Nir and Niv Bachanof for assistance with the bees, T. Nguyen for performing microarray analysis, A. Eisenstein for preprocessing the microarray data (“spot finding”), and Zeeshan Fazal for formatting and making the microarray data available in ArrayExpress. This research was supported by the National Institutes of Health (NIH) National Institutes of General Medical Sciences (grant number 1R01GM068946) to S.R.Z. and G.E.R., NIH National Institutes of Drug Abuse (grant numbers R21DA027548 and P30DA018310) to S.R.Z. and B.R.S., respectively, NIH National Cancer Institute (grant number 5R03CA143975) to S.R.Z., National Science Foundation Frontiers in Biological Research grant “BeeSpace” (grant number EF 0425852), the US-Israel Binational Science Foundation (grant numbers 2001-022-2 [to G.B. and G.E.R.] and 2003-151-04 [to G.B.]), and the Israel Science Foundation (grant number 452/_07) to G.B.
The author(s) have no potential conflicts of interest with respect to the research, authorship, and/or publication of this article.
Notes
References
Supplementary Material
Please find the following supplemental material available below.
For Open Access articles published under a Creative Commons License, all supplemental material carries the same license as the article it is associated with.
For non-Open Access articles published, all supplemental material carries a non-exclusive license, and permission requests for re-use of supplemental material or any part of supplemental material shall be sent directly to the copyright owner as specified in the copyright notice associated with the article.