
Abstract
Daily locomotor patterns of a variety of organisms have been interpreted as driven by dual circadian oscillators. Yet, in mammals, cellular data have revealed many circadian oscillators in the bilateral suprachiasmatic nucleus (SCN). To test how large numbers of oscillators could respond to environmental cues as a pair of oscillators, the authors developed a computational model composed of 2 groups of oscillators with strong local interactions and with weaker coupling between the 2 groups. Unlike previous models that assumed that light affects the timing or polarity of coupling between a pair of oscillators, this simulation assumed that light increased the transcription rate of a clock gene and consequently altered circadian properties of individual cells. In constant dark, weak local (within each of the 2 groups) and distant (between group) coupling established in-phase oscillations and a typical single bout of daily activity. In constant light, local synchrony developed only if coupling was strong and resulted in antiphase synchrony between the 2 groups and bimodal daily activity reminiscent of split behavior. These numerical simulations thus showed that splitting behavior can develop with increased light intensity without structural changes in the coupling topology or sign. Instead, the authors propose that light changes intrinsic oscillator properties through the increase of maximal transcription rate of a clock gene, so that as light intensity increases, the output of the coupled network transitions from a single bout of activity through irregular beating to 2 bouts and, in bright constant light, arrhythmicity.
The circadian clock regulates a variety of behavioral and physiological functions with a period close to 24 hours (Winfree, 1980; Reppert and Weaver, 2002; Antle and Silver, 2005; Herzog, 2007). Two fundamental clock properties, the presence of a free-running period and entrainment to environmental cues (Johnson et al., 2003), indicated that the clock could be described with an attracting limit-cycle mathematical model (Pavlidis, 1973; Winfree, 1980; Kronauer, 1990; Leloup et al., 1999; Forger and Peskin, 2003; Leloup and Goldbeter, 2003). Careful experiments further suggested that 2 oscillators could be required to describe accurately circadian behaviors including the phase angle of entrainment on long versus short days and “splitting” (Pittendrigh and Daan, 1976; Earnest and Turek, 1982; Pickard et al., 1993; Evans et al., 2010). Splitting in constant bright light, for example, involves the dissociation of the usual single bout of daily activity into 2 components that initially free run with different periods and then establish a stable, nearly antiphase relationship (Evans et al., 2010). In a widely accepted mathematical interpretation of splitting behavior in dynamical system theory, 2 limit-cycle oscillators establish antiphase synchronization in the split state (Pittendrigh and Daan, 1976; Daan and Berde, 1978; Kawato and Suzuki, 1980; Oda and Friesen, 2002; Yan et al., 2005; Indic et al., 2008).
In mammals, the dominant pacemaker has been located in the suprachiasmatic nucleus (SCN) (Klein et al., 1991). Multielectrode array recordings of neuronal firing patterns and bioluminescence imaging of clock gene expression in individual cells indicate that a cell-autonomous mechanism generates circadian rhythms in SCN cells (Welsh et al., 1995; Liu et al., 1997; Herzog et al., 1998; Honma et al., 1998). In the SCN slice, the cells exhibit highly synchronized daily oscillations (Yamaguchi et al., 2003; Ciarleglio et al., 2009; Yan et al., 2010). Under a variety of environmental perturbations, 2 circadian oscillators have been described based on the phase relationships between the left and right sides of the bilaterally paired SCN (de la Iglesia et al., 2000; de la Iglesia et al., 2003) or dorsoventral regions or other clusters of SCN cells (Ohta et al., 2005; Tavakoli-Nezhad and Schwartz, 2005; Yan et al., 2005; Yan et al., 2010). These experiments imply that temporal and spatial coordination of the gene expression of clock cells could play an important role in the construction of the circadian system. In terms of mathematical modeling, synchronization and dynamical clustering phenomena of limit-cycle oscillators should be considered.
With the accumulation of experimental data, it was possible to develop mathematical models for the circadian system that capture different levels of complexity (Yamada and Forger, 2010) as simple as one variable/oscillator (Indic et al., 2008) to many variables/oscillators (To et al., 2007). Multicellular, biomolecular models are now capable of describing features including self-synchronization, entrainment to ambient light-dark cycles, and light-induced desynchronization (Achermann and Kunz, 1999; Antle et al., 2003; Kunz and Achermann, 2003; Gonze et al., 2005; Bernard et al., 2007; To et al., 2007; Bagheri et al., 2008; Komin et al., 2011). Splitting behavior raises some important challenges to computational modeling. How does a synchronized population of oscillators dynamically differentiate into 2 synchronized groups of oscillators that establish a stable antiphase configuration in response to a change in light intensity? Previous phenomenological mathematical models have employed differential equations (e.g., Fitzhugh-Nagumo equation [Kawato and Suzuki, 1980], the Pittendrigh-Pavlidis equation [Oda and Friesen, 2002], or phase models [Indic et al., 2008]) to show that splitting could occur when constant light switches coupling between oscillators from positive to negative or by activating additional delayed and/or inhibitory interactions. (Moreover, a change in the intrinsic coupling [sign or delays] between the oscillators alone [without light] could also induce splitting [Indic et al., 2008]; in the present study, we focus on light-induced splitting.)
In this article, we test the hypothesis that changes of coupling sign or delay are not required to produce light-induced splitting circadian behavior. A mechanism is tested in which the light acts on individual oscillator properties by increasing the transcription rate of a clock gene and thus shifting the oscillator further away from the onset of oscillations through Hopf bifurcation. We consider a model that uses 2 groups of cells with relatively strong local coupling within each group and weak distant coupling between the groups. In contrast to previous phenomenological models (Daan and Berde, 1978; Kawato and Suzuki, 1980; Oda and Friesen, 2002; Indic et al., 2008), we use a simple transcription-based model to simulate gene expression of individual cells and the interaction between the cells. Numerical simulations of the model are carried out to show that splitting behavior can develop with increased light intensity without changes in the coupling topology or sign. We characterize the effects of local and distant coupling strength and light intensity on the extent of local (intragroup) and distant (intergroup) synchrony in constant darkness (DD) and in constant light (LL). Several key findings (such as light effects on local and distant synchronization, phase difference between 2 groups, and period of individual cells) are compared to previous models and to experimental accounts of splitting behavior.
Materials and Methods
Model Equations: Single Oscillator
A simple core model for circadian gene expression is used to simulate the behavior of each cell (Leloup et al., 1999; Gonze and Goldbeter, 2006). The model is based on the effect exerted by a clock protein (Pc), which can enter the nucleus (PN) to repress transcription of its clock (e.g., Period) gene into mRNA (M). Three ordinary differential equations (equation 1) have been derived (Leloup et al., 1999; Gonze and Goldbeter, 2006) for the time evolution of the concentration of the variables:
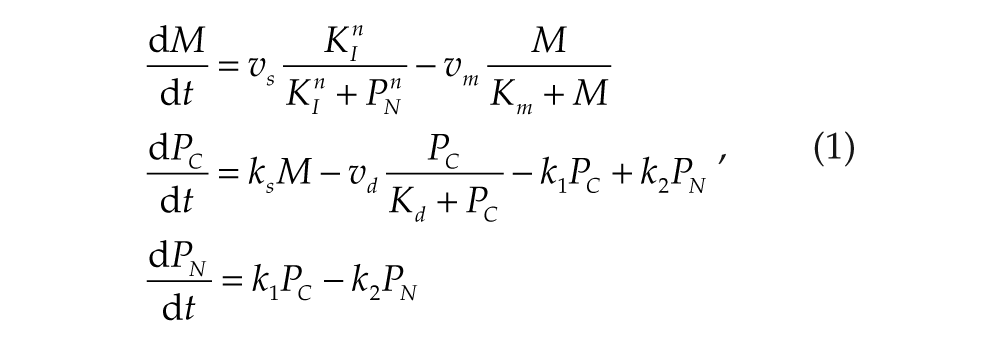
where parameters n = 4, vm = 0.421 nM/h, KI = 1 nM, Km = 0.5 nM, ks = 0.417 1/h, vd = 1.167 nM/h, Kd = 0.13 nM, k1 = 0.417 nM/h, and k2 = 0.5 nM/h were selected to produce circadian oscillations. (The definitions of parameters are given in supplementary online material (SOM) Table S1; in this study, 2 parameters play a key role: the transcription rate (vs) and the maximum degradation rate (vm) of the Period mRNA.)
Following previous studies (Leloup et al., 1999; Albrecht, 2002; Gonze et al., 2005; To et al., 2007), light was assumed to increase acutely the Per transcription rate in each cell (vs in equation 1). In DD (L = 0, where L is the light intensity), we set vs = 0.83 so that oscillations were created near a supercritical Hopf bifurcation (SOM Fig. S1). The mRNA concentrations of single cells in DD had an average free-running period of τ = 22.7 hours (Fig. 1). In LL (L = 1),the vs value was set to 1.83, which is far away from the onset of oscillations through Hopf bifurcation. Under this LL condition, the oscillations had a longer free-running period (τ = 29.1 hours), modestly larger amplitude, and less sinusoidal waveform than those in DD (Fig. 1). For light intensities between DD and LL, a simple linear interpolation was applied (i.e., for a single uncoupled cell, vs = 0.83 + L) so that light intensity strongly and linearly affected the vs value of the individual oscillations.
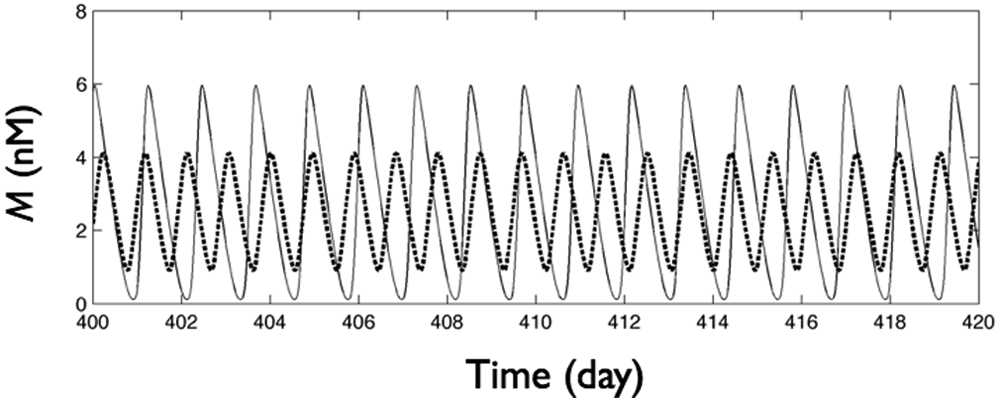
Simulation of mRNA concentration (M) of an isolated cell in DD (thick dashed line) and LL (thin solid line) conditions.
Model Equations: Groups of Oscillators
Two-group coupling structure
We considered a population of N = 200 cells that were placed into 2 groups: cells 1 to 100 and cells 101 to 200 were placed in groups 1 and 2, respectively. The circadian behavior of each cell was modeled by 3 ordinary differential equations (equation 1).
Interactions between cells that belonged to the same group (“local” coupling) or different groups (“distant” coupling) were considered all-to-all (i.e., all cells in the same group were coupled to each other with the same coupling strengths), with the mean field coupling between groups being weaker than the local coupling. Following the findings of a detailed model of the mechanisms underlying coupling of SCN cells (To et al., 2007), we greatly simplified the oscillator-to-oscillator communication to an increase in the maximum transcription rate of a cell (vs) based on the difference between the mRNA level (Mk) of the k-th cell and the mean group levels
Thus, vs for cells in group 1 (k = 1, 2, . . ., 100) were set to

where αl and αd were the local and distant coupling strengths, respectively. Note that the L term in equation 3 incorporates the effect of light intensity. Similarly, for cells in group 2 (k = 101, 102, . . ., 200),

Typically, we assume large values for the local coupling strength, αl, and small values for the distant coupling strength, αd.
Inherent heterogeneities
To model the inherent heterogeneity in period and amplitude of isolated SCN cells (Webb et al., 2009; Ko et al., 2010), we set vm in equation 1 for each individual cell to a random value with Gaussian distribution with a standard deviation of 4 × 10⁻³ and a mean value of 0.416 and 0.431, respectively, for cells in groups 1 and 2. Therefore, we consider the 2 cell groups to have slightly different mean vm values but the same distribution.
Data Analysis
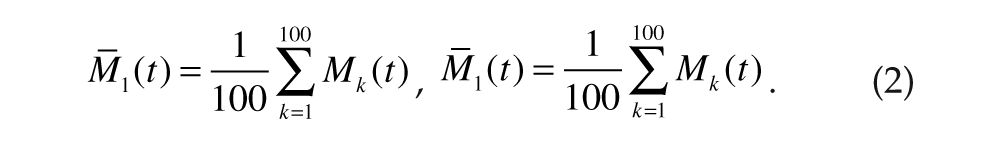
Each simulation produced the mRNA concentration for each cell [Mk(t)]. The Hilbert transform (Marple, 1999) of Mk(t),
was used to define the phase ϕ k (t) (Pikovsky et al., 2001) of each cell as
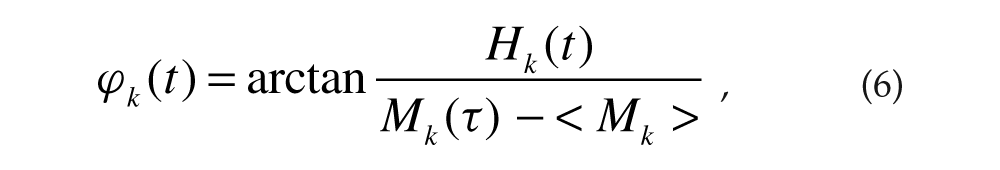
where < > denotes temporal average. The extent of “local” synchrony among cells was characterized by the Kuramoto order parameter (Kuramoto, 1984):
where
The group (or collective) phases (Ψ1(t) and Ψ2(t)) and periods (τ1 and τ2) were obtained the same way as for the individual oscillations but using
The extent of distant synchrony between the 2 groups was characterized by a phase synchrony index σ (Tass et al., 1998),

where S is the Shannon entropy of the cyclic group phase difference distribution, and Smax is the maximal entropy. The cyclic group phase difference distribution (ΔΨ(t) mod 2π) was divided into n bins; pl is the probability that the cyclic phase difference is in bin l. Smax = ln n. The value of σ approaches unity for phase-locked groups and zero for phase-drifting groups.
Additional details about numerical techniques are given in the SOM.
Results
A Model to Test the Effects of Local and Distant Coupling on Circadian Rhythms
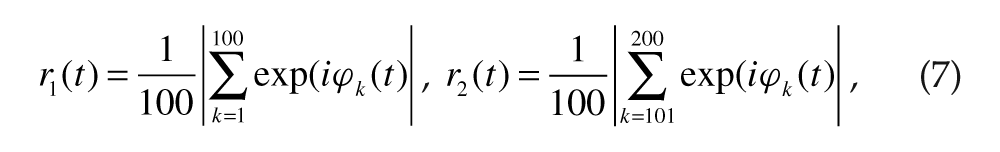
We tested the hypothesis that light-induced splitting of circadian behavior can be explained by the computational model implemented by equations 1 to 4. In this model, light changed the transcription rate of each oscillator (Fig. 1) and did not change communication between the 200 oscillators spatially organized into 2 groups (Fig. 2).
Schematic of the coupling topology among oscillators in the model. Local (intragroup) coupling was strong and all-to-all within each group. Distant (intergroup) coupling between the 2 groups was weak.
In-Phase Synchronization in DD
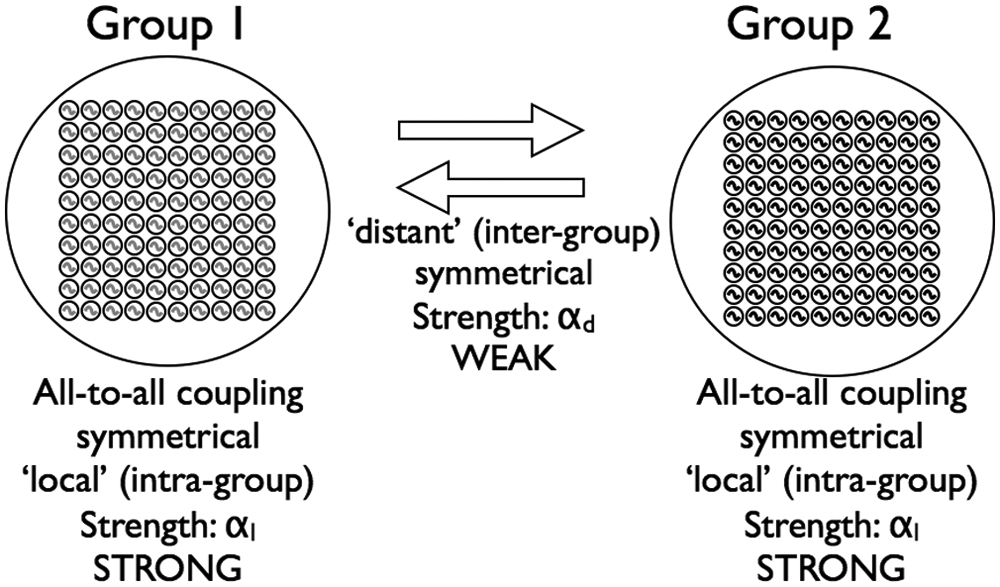
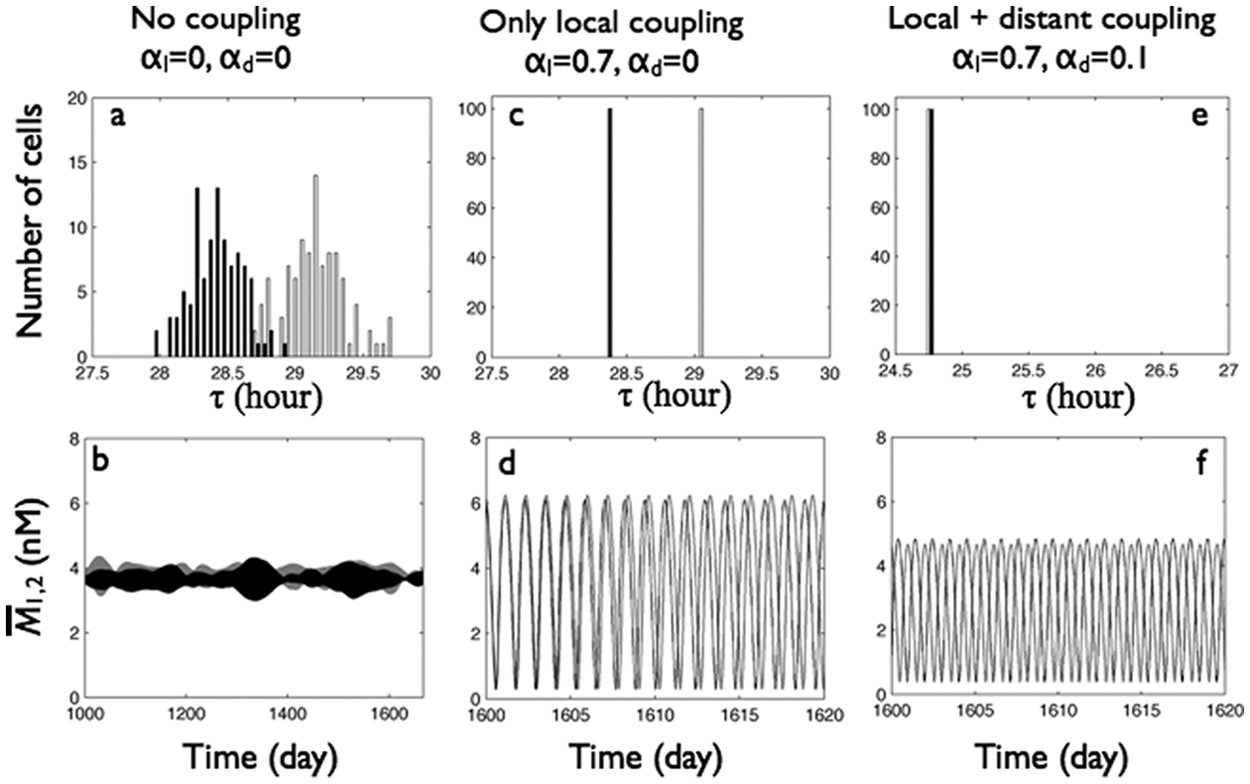
The effects of local and distant coupling in DD (i.e., L = 0) were compared on cells with distributed intrinsic periods that were uncoupled (αl = 0, αd = 0) (Fig. 3A and 3B), locally coupled (αl = 0.7, αd = 0) (Fig. 3C and 3D), and both locally and distantly coupled (Fig. 3E-3F and SOM Fig. S2). When uncoupled, the cells in group 1 oscillated with slightly longer periods (mean ± standard deviation, 22.69 ± 0.13 hours) than those in group 2 (22.29 ± 0.11 hours), governed by the vm of each cell. Because of the lack of interactions, the mRNA levels of the cells oscillated independently from each other with nearly constant mean mRNA levels within each group and a drifting collective group phase difference, which changed abruptly due to difficulties in defining collective phase for the desynchronized oscillators (Fig. 3B and SOM Fig. S2).
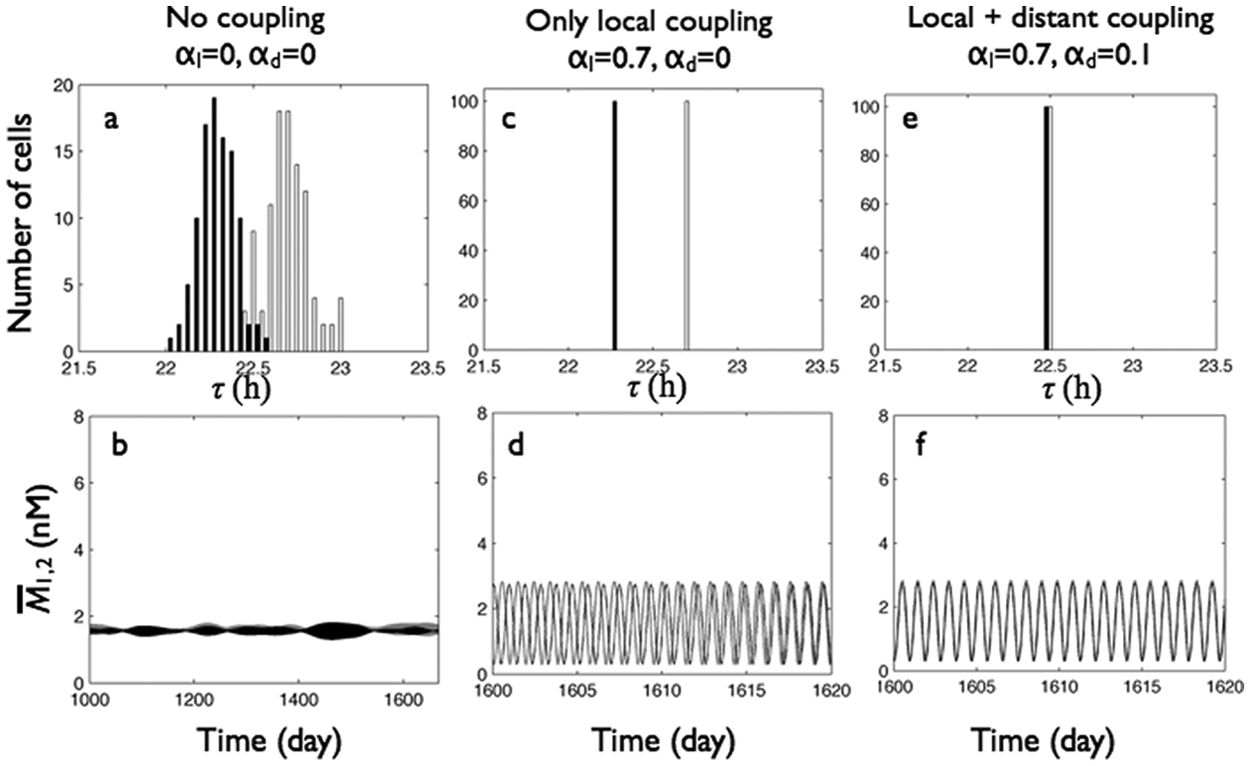
Local and distant coupling play distinct roles to synchronize oscillations among and between cells in group 1 (gray) and group 2 (black) in DD (L = 0). Top row: period distributions of the 200 oscillators within each of the 2 groups. Bottom row: mean mRNA concentrations of the 2 groups. (A, B) Cells without local or distant coupling (
When locally coupled (αl = 0.7, αd = 0), each of the 2 weakly heterogeneous populations synchronized to their respective mean period (τ1 = 22.69 hours, τ2 = 22.29 hours) so that the group phase difference increased linearly with time, with a slope that corresponded to the angular frequency difference between the 2 groups. Adding relatively weak (αd = 0.1) distant coupling between the 2 locally synchronized groups (αl = 0.7) resulted in nearly in-phase synchrony, with group 2 cells oscillating slightly ahead (0.13 rad) of cells in group 1.
Figure 4 illustrates the effects of local coupling on synchrony within each group, their mean period, and the distant (between-group) synchrony. The 2 groups without coupling (αl = 0) had low Kuramoto order parameters (r1,2 ≈ 0.1), indicating synchrony corresponding to random fluctuations in the phases of the finite number of oscillators (
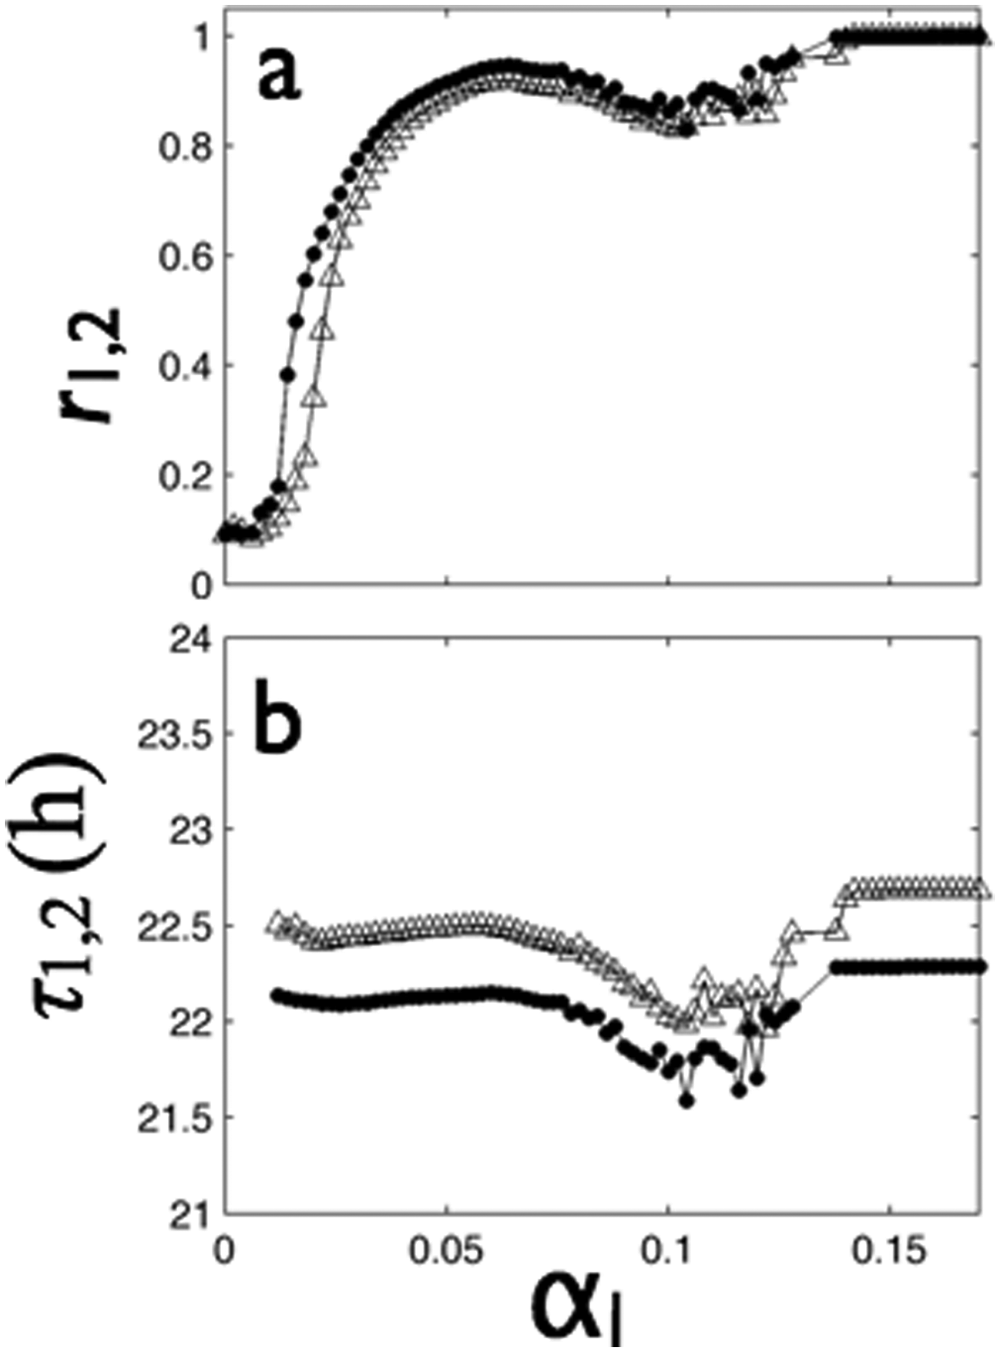
Local coupling above a critical value (
After synchronization set in (0.02 ≤ αl ≤ 0.05), the group periods were about 0.2 hours shorter than the periods without coupling (Fig. 4B). Finally, in the fully synchronized state, the periods were the same as the mean of the uncoupled group populations. Without distant coupling, the distant synchrony index was close to zero for all local coupling strengths. Thus, local coupling induced synchrony within each group through the Kuramoto transition.
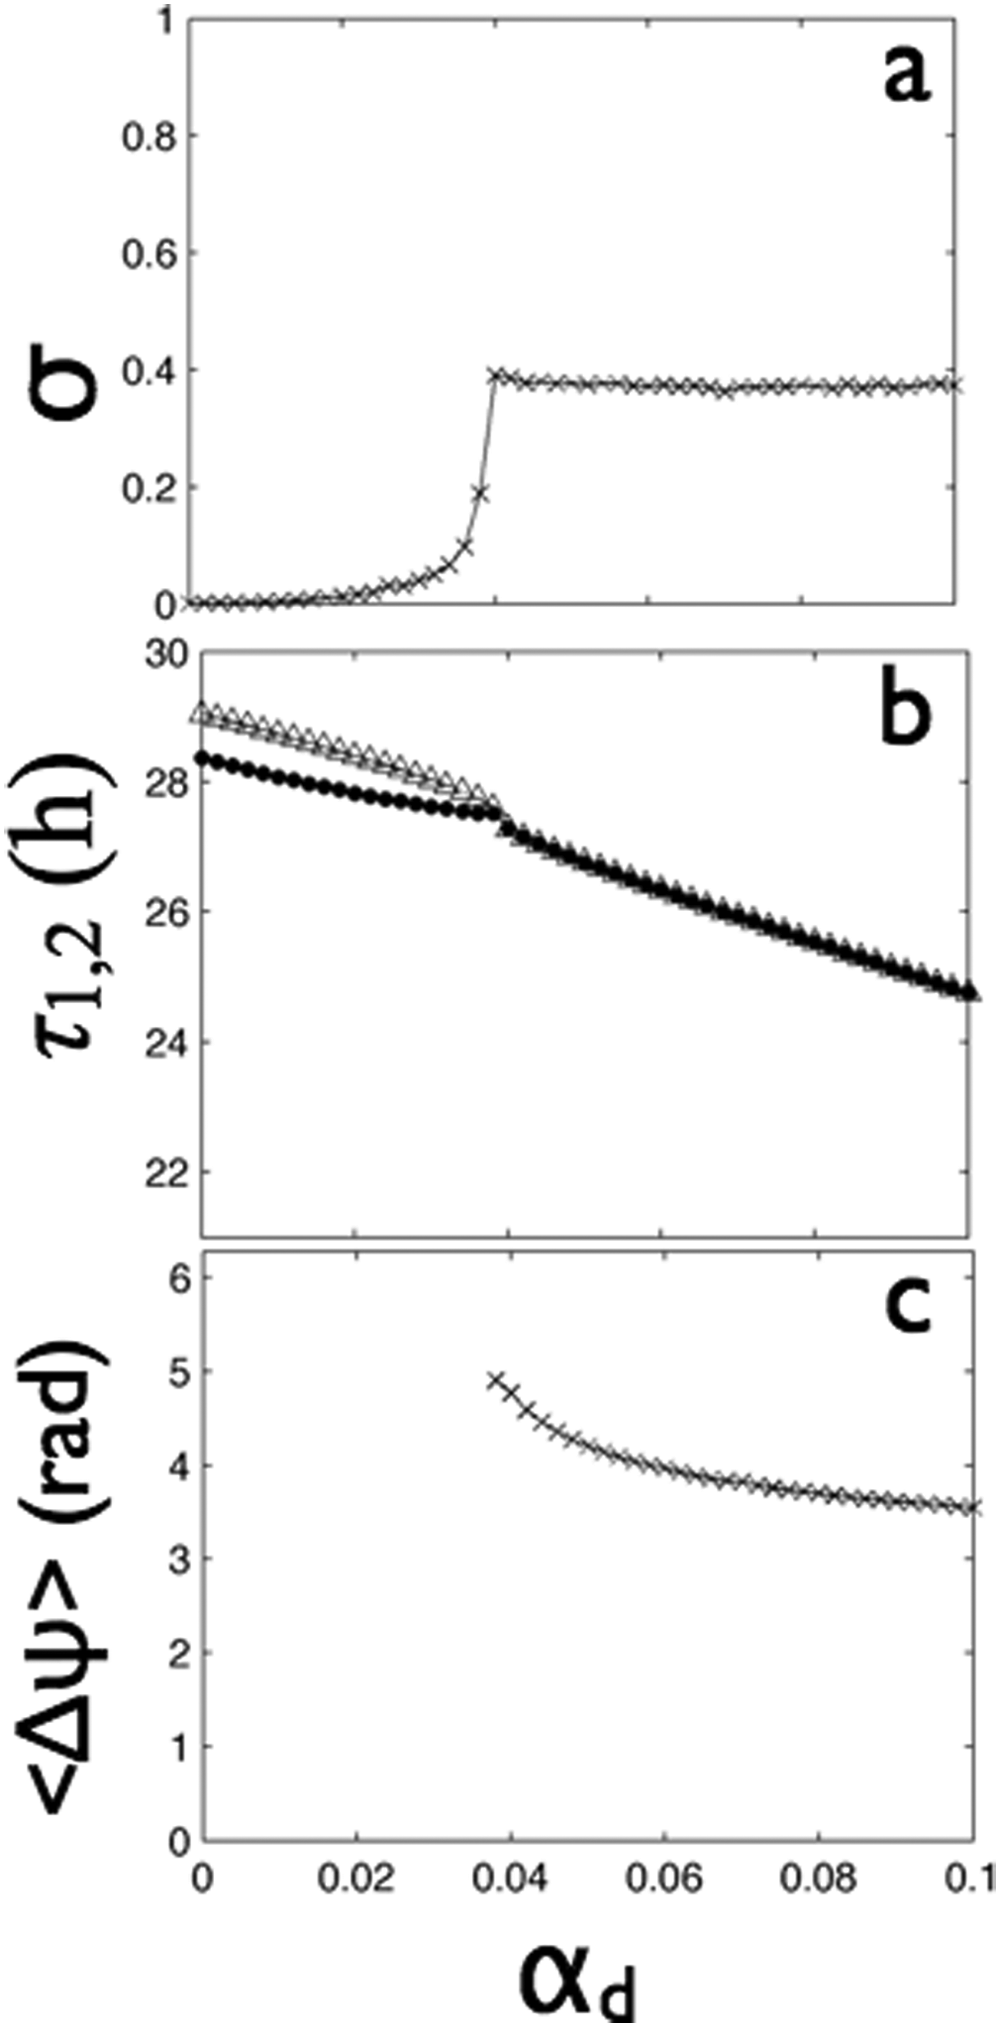
Increasing the strength of distant coupling (αd) from 0 to 0.1, the 2 groups of strongly synchronized cells (Kuramoto order parameters were equal to 1 constantly) exhibited in-phase synchrony (Fig. 3E and 3F and SOM Fig. S2G-I). The distant synchrony index σ yielded a rapid transition from 0 to about 0.75 at αd = 0.038 (Fig. 5A) as the 2 groups assumed the same period (Fig. 5B). The mean phase difference between the groups at this synchronization transition point was 0.61 radians (Fig. 5C); with further increase of distant coupling, the phase difference monotonically decreased to a value of zero.
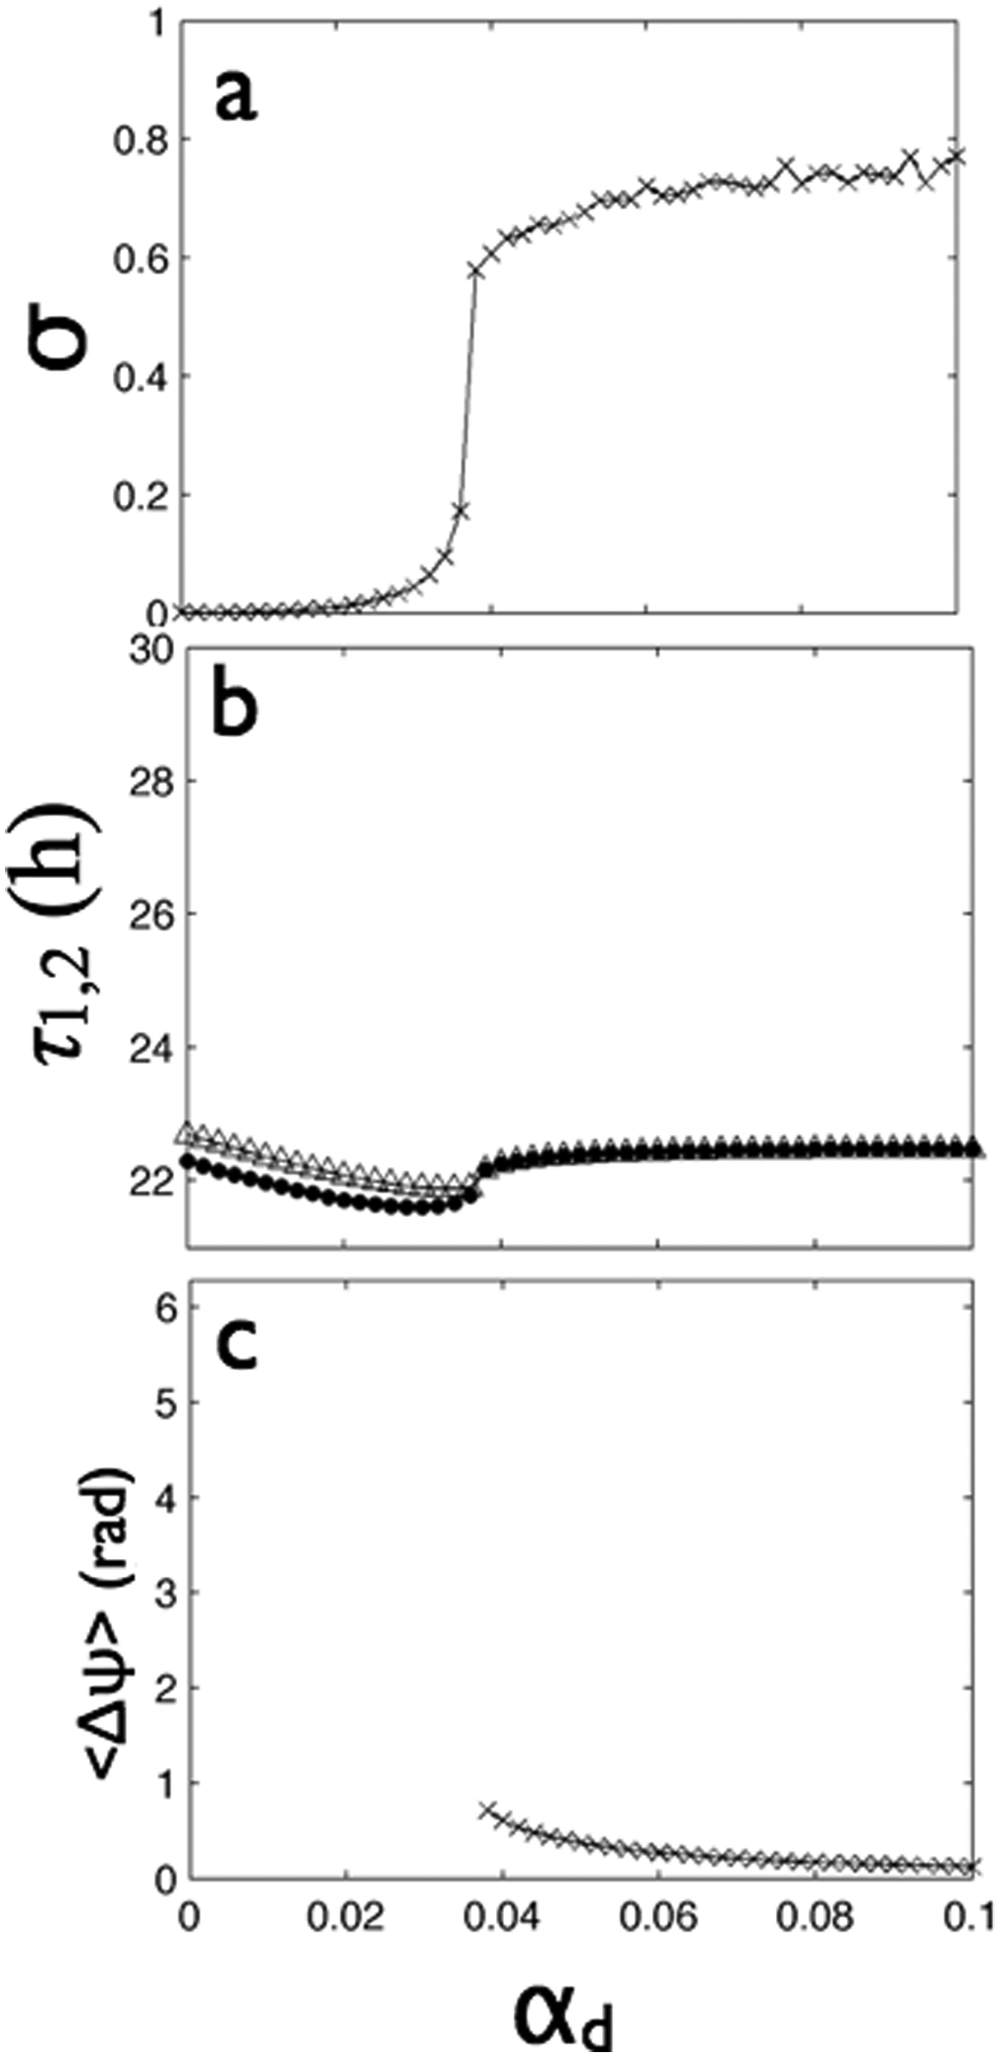
In DD, distant coupling above a critical value (
As the distant coupling increased, the group periods monotonically decreased until the synchronization point (αd = 0.038) (Fig. 5B) when the oscillators were about 0.6 hours slower than in the uncoupled case. This period shortening is consistent with the theoretical properties of coupled nonisochronous oscillators (Kuramoto, 1984; Blasius, 2005). Above the critical distant coupling strengths (αd > 0.038), the periods quickly increased to a period equal to the mean of the 2 groups without distant coupling.
These numerical simulations thus reveal that in DD with an increase of local coupling strength, the 2 groups of cells synchronized with features similar to those of a Kuramoto transition. The 2 synchronized groups then behaved as 2 giant oscillators, and distant coupling produced in-phase oscillations.
Antiphase Synchronization in LL
We next investigated the effect of LL on oscillator behavior as a function of local and distant coupling. Without any intercellular coupling, the free-running periods of cells in LL were about 6 hours longer and more broadly distributed (mean ± standard deviation, 29.15 ± 0.23 hours for group 1 and 28.42 ± 0.19 hours for group 2) than in DD (compare Fig. 6A to Fig. 3A) without apparent synchrony (SOM Fig. S3A) so that the mean group mRNA expression showed no oscillations (Fig. 6B), and the group phase differences drifted with abrupt changes (SOM Fig. S3B and S3C).
LL (L = 1) can produce antiphase oscillations between groups under some local and distant coupling conditions. Top row: period distributions of the 2 groups. Bottom row: mean mRNA concentrations of the 2 groups. (A, B) Cells without local and distant coupling (
With strong local coupling (αl = 0.7, αd = 0), the mRNA oscillations synchronized within each group but not between groups so that group 1 mRNA oscillated with a longer period than group 2, and their phase difference increased linearly over time (Fig. 6C and 6D and SOM Fig. S3D-F).
By including both strong local (αl = 0.7) and weak distant (αd = 0.1) coupling, we found that all cells in LL exhibited oscillations with the same period (24.75 hours) (Fig. 6E), shorter than their uncoupled periods or their periods when locally coupled. In contrast with their in-phase synchronization in DD (Fig. 3), these cells showed antiphase intergroup synchronization evidenced by the measures of mRNA oscillations of each group (SOM Fig. S3G), across the 2 groups (Fig. 6F), and the 3.55-rad phase difference between groups (SOM Fig. S3H and S3I).
The onset of synchrony induced by local coupling (without distant coupling) exhibited some distinctly different features than those seen in DD (Fig. 7A). First, to establish synchrony, very strong coupling was required (αl > 0.2; about 13 times stronger coupling than that required to synchronize the groups in DD). Next, although there exists a critical coupling strength (αl = 0.2) below which the groups were desynchronized (r1 ≈ r2 ≈ 0.1), the order parameter increased abruptly above this critical coupling strength instead of following the approximately square-root shape expected for the Kuramoto transition (Kuramoto, 1984). Finally, after the abrupt transition to (partial) group synchrony (0.20 ≤ αl ≤ 0.33), the order parameters slightly decreased and then increased until full synchrony was attained at αl = 0.60 (about 5 times higher than was required in DD).
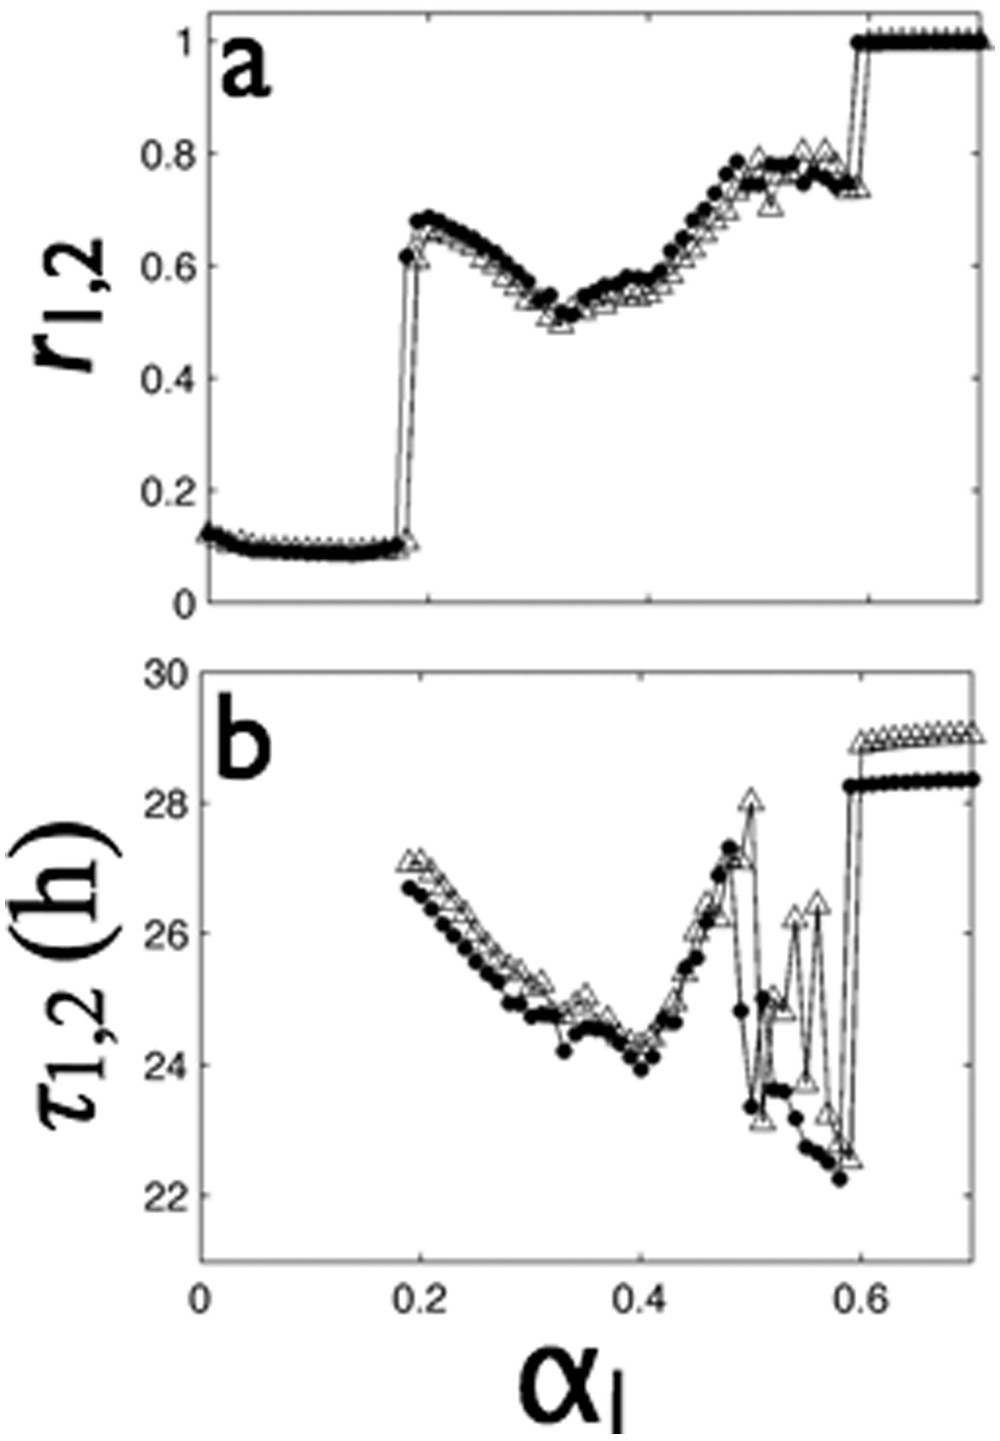
Only very strong local coupling above a critical value (
The periods of the 2 groups of oscillators in LL were very sensitive to the strength of local coupling. Above the critical coupling strength (αl = 0.2), the group periods (τ1 = 27.08 hours, τ2 = 26.71 hours) were distinctly lower than the free-running mean periods (by 2.07 hours and 1.65 hours, respectively) and finally, after some irregular dynamics, attained τ1 = 29.05 hours and τ2 = 28.36 hours (Fig. 7B). Because there is no distant coupling, the distant synchrony index was close to zero for all local coupling strengths.
We next measured the effects of increasing the strength of distant coupling (0 ≤ αd ≤ 0.1) between 2 populations of strongly coupled oscillators in LL. The Kuramoto order parameter of the groups was equal to 1 for all coupling strengths, showing that the cells in each group remained strongly synchronized. The phase synchrony index rapidly transitioned to the phase-synchronized state at about αd = 0.038 (Fig. 8A), identical to that seen in DD (Fig. 5A). Similarly, increasing distant coupling nearly linearly shortened the periods of the 2 oscillators in LL as in DD (compare Figs. 5A and 8B). In contrast to DD, however, the period continued to shorten after the onset of distant synchrony (αd = 0.038) and reached 24.8 hours at the strongest distant coupling tested (αd = 0.1). Finally, the most notable difference between LL and DD was the mean phase difference between the 2 groups (Fig. 8C). At the synchronization transition point, the phase difference was 4.9 radians, which quickly decreased with increasing distant coupling to antiphase synchrony.
In LL, distant coupling above a critical value (
We thus see that, compared to DD, the transition to group synchrony in LL was dramatically more abrupt, required stronger local coupling, and coincided with speeding up the oscillations by as much as 5 hours. The addition of distant coupling produced in-phase oscillations in DD but antiphase oscillations in LL. As distant coupling strength increased, the period shortened and then lengthened in DD but consistently shortened in LL.
Increase of Light Intensity Induces Transition from In-Phase Synchrony through Beating Oscillations to Splitting and Desynchronization
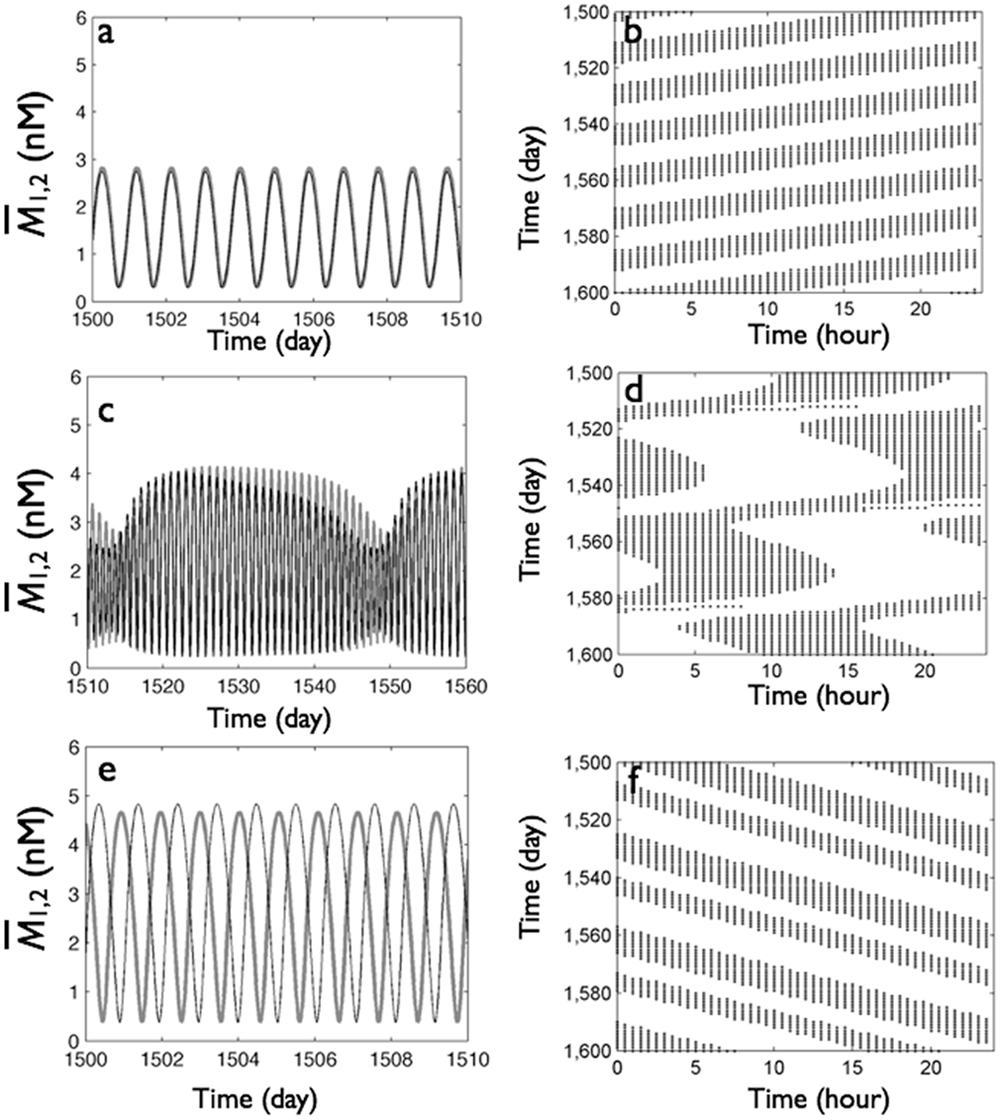
We next tested the effect of increasing light intensity on a network with fixed (strong local and weak distant) coupling topology. To illustrate the effects on system-level circadian behavior, we assumed that overall mRNA level increase resulted in activity (e.g., locomotion), which we plotted as an actogram (see SOM for further details on actogram generation). In DD (L = 0), the in-phase synchronized oscillations of the group mRNA levels (Fig. 9A) produced a single daily bout of activity with a period less than 24 hours (Fig. 9B). In dim LL (e.g., from L = 0 to L = 0.3), the group mRNA levels oscillated in a beating fashion (Fig. 9C). That is, the amplitudes were strongly modulated as phase slips occurred, resulting in a loss of well-defined phase relationships between the 2 groups (Fig. 9D). Similar beating behavior has been observed at intermediate light intensities in Tupaia belangeri (Meijer et al., 1990) as well as in rats maintained on a 20-hour light-dark cycle (de la Iglesia et al., 2004; Granada et al., 2011). In bright LL (e.g., L = 1), the group mRNA levels were synchronized in antiphase relationships (Fig. 9E). The corresponding actogram showed classic splitting features with double-bout activity and a period slightly longer than 24 hours (Fig. 9). We found that splitting occurred within 2 to 7 weeks upon transfer from DD to LL, faster at higher light intensities, and did not require large changes in amplitude (SOM Fig. S4).
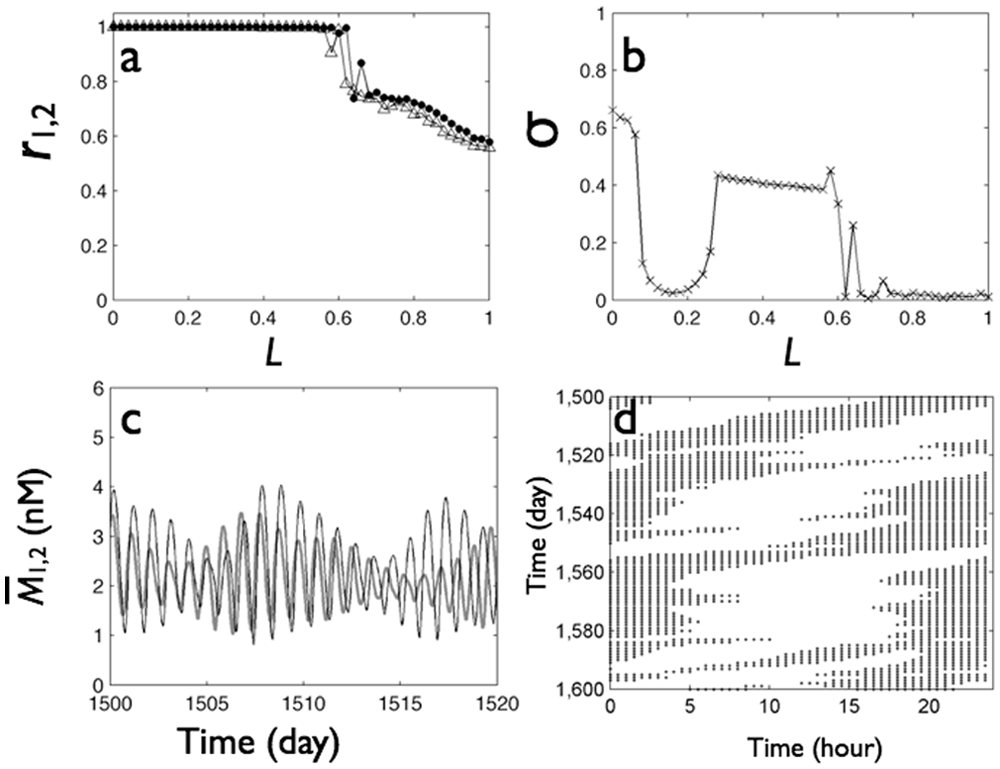
Next, we consider an SCN in which both local and distant coupling were weakened to αl = 0.35 and αd = 0.05, that is, half of the values discussed in Figure 9. Under these conditions, as the light intensity increased from 0 to 0.6, we found a transition from in-phase synchrony and high levels of distant synchrony (σ ≈ 0.6) (Fig. 10B) through beating behavior without distant synchrony (σ < 0.2) to antiphase synchrony with again high levels of distant synchrony (σ ≈ 0.4). For strong light intensities, L > 0.6, the local synchrony within each group degraded (Fig. 10A), the local mRNA levels exhibited complex irregular oscillations without well-defined phase relationships between the groups (Fig 10C), and the actogram (Fig. 10D) showed irregular bouts of activity. In this model SCN with weaker coupling than in those studied in Figures 2 to 9, the in-phase “unsplit” state occurred only for weak light intensities, the beating oscillations separating the split and unsplit states occurred over a larger light intensity range, the split behavior developed at the same light intensity, and desynchrony developed at high light intensities.
Increase of light intensity transforms single-bout, in-phase synchrony in DD (top row) through irregular “beating” oscillations (middle row, weak light, L = 0.3) to split behavior with antiphase synchrony in LL (bottom row) with strong local (
Light induces transition from in-phase synchrony through antiphase synchrony to desynchrony, as measured by Kuramoto orders (A) and the distant synchrony index (B) for cell population with weakened local (
Discussion
Based on the assumption that light increases Per transcription, the model presented here accurately predicts that LL lengthens circadian period (Aschoff, 1979) and, at sufficient intensities, can lead to splitting within the SCN (Ohta et al., 2005). Previous models for splitting behavior (Daan and Berde, 1978; Kawato and Suzuki, 1980; Oda and Friesen, 2002; Indic et al., 2008) interpreted the antiphase behavior as a result of effective repulsive coupling (or attractive coupling with a large delay) between the oscillators. Therefore, there was a tacit assumption that when light is turned on, there is a major change in the physical form of the coupling, resulting in phase repulsion between the oscillators. In our transcription-based model, we show that light can change the properties of individual circadian pacemaker oscillators in such way that the very same form of physical coupling can exert attractive phase coupling in DD and repulsive phase coupling in LL between the synchronized groups of oscillators. We assumed that light acts on individual oscillator properties (e.g., period, amplitude, and waveform of gene expression), the mechanism of which is already encoded in the mathematical structure of transcription-based models of circadian gene expression (Leloup et al., 1999; Gonze and Goldbeter, 2006). The results thus reveal that a transcription-based model based on properties of individual oscillators (Gonze et al., 2005), their coupling (To et al., 2007), and topology (Bernard et al., 2007) posits that light induction of gene expression recapitulates splitting behavior without changing the sign/timing of the coupling. Light and other factors that increase clock gene transcription rates are thus capable of indirectly affecting the structure of the SCN: network reorganization is possible without rewiring.
Interestingly, the model predicts that LL will increase modestly the amplitude of Per transcription in individual cells. When these cells are coupled, the amplitude of the population could be modestly increased or decreased compared to DD, depending on coupling strength and light intensity. Previous studies also have indicated that, compared to DD, LL slightly increased Per1 and Per2 mRNA levels in the SCN of 2 mouse strains (Sudo et al., 2003; Munoz et al., 2005). Strikingly, one mouse strain showed lower amplitude rhythms (Sudo et al., 2003), whereas another showed larger amplitude rhythms (Munoz et al., 2005) consistent with a difference in their sensitivity to light or intra-SCN coupling strength. An additional experimental test of the proposed alternative mechanism of splitting could include, for example, transgenic overexpression of the Period1 gene (Numano et al., 2006), which should yield behavior similar to that of LL: lengthened period, multiple periodicities, and broader period distribution.
The model simulations showed that by introducing coupling within the groups of cells, synchrony can be achieved in both DD and LL conditions. However, there is a large difference between the features of the collective synchrony in DD and LL. In DD, the cells have a great propensity to synchrony at relative weak coupling strength, and the transition is similar to that seen in weakly coupled phase oscillators (Kuramoto, 1984). In contrast, cells in LL synchronize only at strong coupling strengths, and the transition to synchrony is very abrupt as the coupling strength is increased. Note that it is the unique effect of increased transcription rate (induced by light) that causes these synchronization effects and not the direct change of coupling strength among the cells.
In contrast to collective (“local”) synchrony, the distant synchrony that develops between the 2 synchronized groups occurs at about the same weak coupling strengths in DD and LL conditions. In DD, the synchrony develops as in-phase resulting in a single daily bout of activity. In LL, the synchrony occurs as antiphase resulting in splitting and double-bout actograms. A test of this prediction is that gradual strengthening of coupling within the SCN in LL (e.g., experimentally increasing the efficacy of VIP signaling) should transition the behavior from antiphase to in-phase synchrony. Reducing VIP efficacy should increase the proportion of animals that show splitting behavior.
We note that we considered splitting as stable antiphase relationships between clock components. In a more relaxed definition, splitting could be interpreted as the occurrence of subgroups of oscillators in the population with different periods. The model conditions for such an interpretation could be quite different; for example, it was shown that in a 4-quadrant model of Kronauer oscillators, one quadrant can exhibit a sudden deviation of period while the periods of the other quadrants were largely unaffected (Kunz and Achermann, 2003).
Because the model can be considered as a core model for many circadian pacemaker cells (Gonze and Goldbeter, 2006), many organisms are potentially capable of developing antiphase synchrony between strongly coupled groups (“nuclei”) of cell populations. The organization of local and distant coupling and organism-specific terms in more detailed models could, however, strongly affect the observability of splitting behaviors. Most importantly, light can induce desynchronization of the circadian oscillators (Ohta et al., 2005). If the “effective” coupling among the cell is too weak, light could desynchronize the oscillator groups before splitting could be observed. Probably the greatest challenge to our modeling effort is to interpret splitting behavior that had been observed with decreasing light intensity with certain organisms (Meijer et al., 1990).
Footnotes
Acknowledgements
This material is based upon work supported by the National Science Foundation under grant number CHE-0955555.
The author(s) have no potential conflicts of interest with respect to the research, authorship, and/or publication of this article.
Notes
References
Supplementary Material
Please find the following supplemental material available below.
For Open Access articles published under a Creative Commons License, all supplemental material carries the same license as the article it is associated with.
For non-Open Access articles published, all supplemental material carries a non-exclusive license, and permission requests for re-use of supplemental material or any part of supplemental material shall be sent directly to the copyright owner as specified in the copyright notice associated with the article.