
Abstract
This paper provides an overview of airborne methylene diphenyl diisocyanate (MDI) concentrations in workplaces across North America and Europe. A total of 7649 samples were collected between 1998 and 2020 by producers of MDI during product stewardship activities at customer sites, primarily using validated OSHA or ISO sampling and analysis techniques. As would be expected from the low vapor pressure of MDI, 80% of the concentrations were less than 0.01 mg/m3 (1 ppb) and 93% were less than 0.05 mg/m3 (5 ppb). Respiratory protection is an integral part of Industrial Hygiene practices; therefore, its use was studied and summarized. While covering a variety of MDI applications, a large number of samples was obtained from composite wood manufacturing facilities, offering specific insight into potential exposures associated with different process sections and job types in this industry sector. Given the potential presence in industrial processes of MDI-containing dust or aerosols, future work should place increased emphasis on also investigating dermal exposure. The data reported in this paper provide valuable information for product stewardship and industrial hygiene purposes throughout the MDI-processing industry.
Keywords
Introduction
Methylene diphenyl diisocyanate (MDI) is a widely used monomer that is typically reacted with polyols to manufacture a wide range of polyurethane (PU) products. MDI is produced in various commercial grades. MDI is available in the market as monomeric MDI (mMDI, as a pure isomer or as mixtures of the isomers) or as a mixture of mMDI and higher homologues (MDI oligomers). Commercially, these mixtures are often called polymeric or oligomeric MDI, depending on the amount of mMDI in the mixture (see Spence and Plehiers, 2022). For simplicity, these mixtures will be grouped under the term “pMDI” in this work. Of the more than three billion pounds of MDI used in North America (CPI, 2022), less than 15% is mMDI, the remainder consists of various grades of pMDI. A detailed review of uses and applications is provided by CPI (2022). The majority (>80%) of mMDI is used in CASE (coatings, adhesives, sealants, and elastomers) applications. The majority of pMDI is used to produce rigid foams (sprayed and board insulation, ca. 60%) and composite wood products (binders, ca. 25%).
This paper summarizes mMDI concentrations compiled by the International Isocyanate Institute in industry workplaces in the Unites States, Canada, and Europe between 1998 and 2020. This data set updates a prior similar effort by Booth et al. (2009) (MDI) and complements a recent review for toluene diisocyanate (TDI) applications published by Sayles et al. (2022). The data set included 10 application types (Figure 1). For the subsequent analysis, the categories of CASE, reaction injection molding (RIM), and thermoplastic polyurethanes (TPU) were grouped together based on the similarity of the measured concentration profiles and the small number of samples in those categories. The category labeled as “Others” consisted mainly of data collected in isocyanate or prepolymer production plants (i.e., these do not manufacture PU). The category “Rigid Foam” covered both poured and sprayed foam applications, while “Binders” included a variety of composite wood products. Number of airborne MDI concentration measurements by application. RIM: reactive injection molding; TPU: thermoplastic polyurethanes.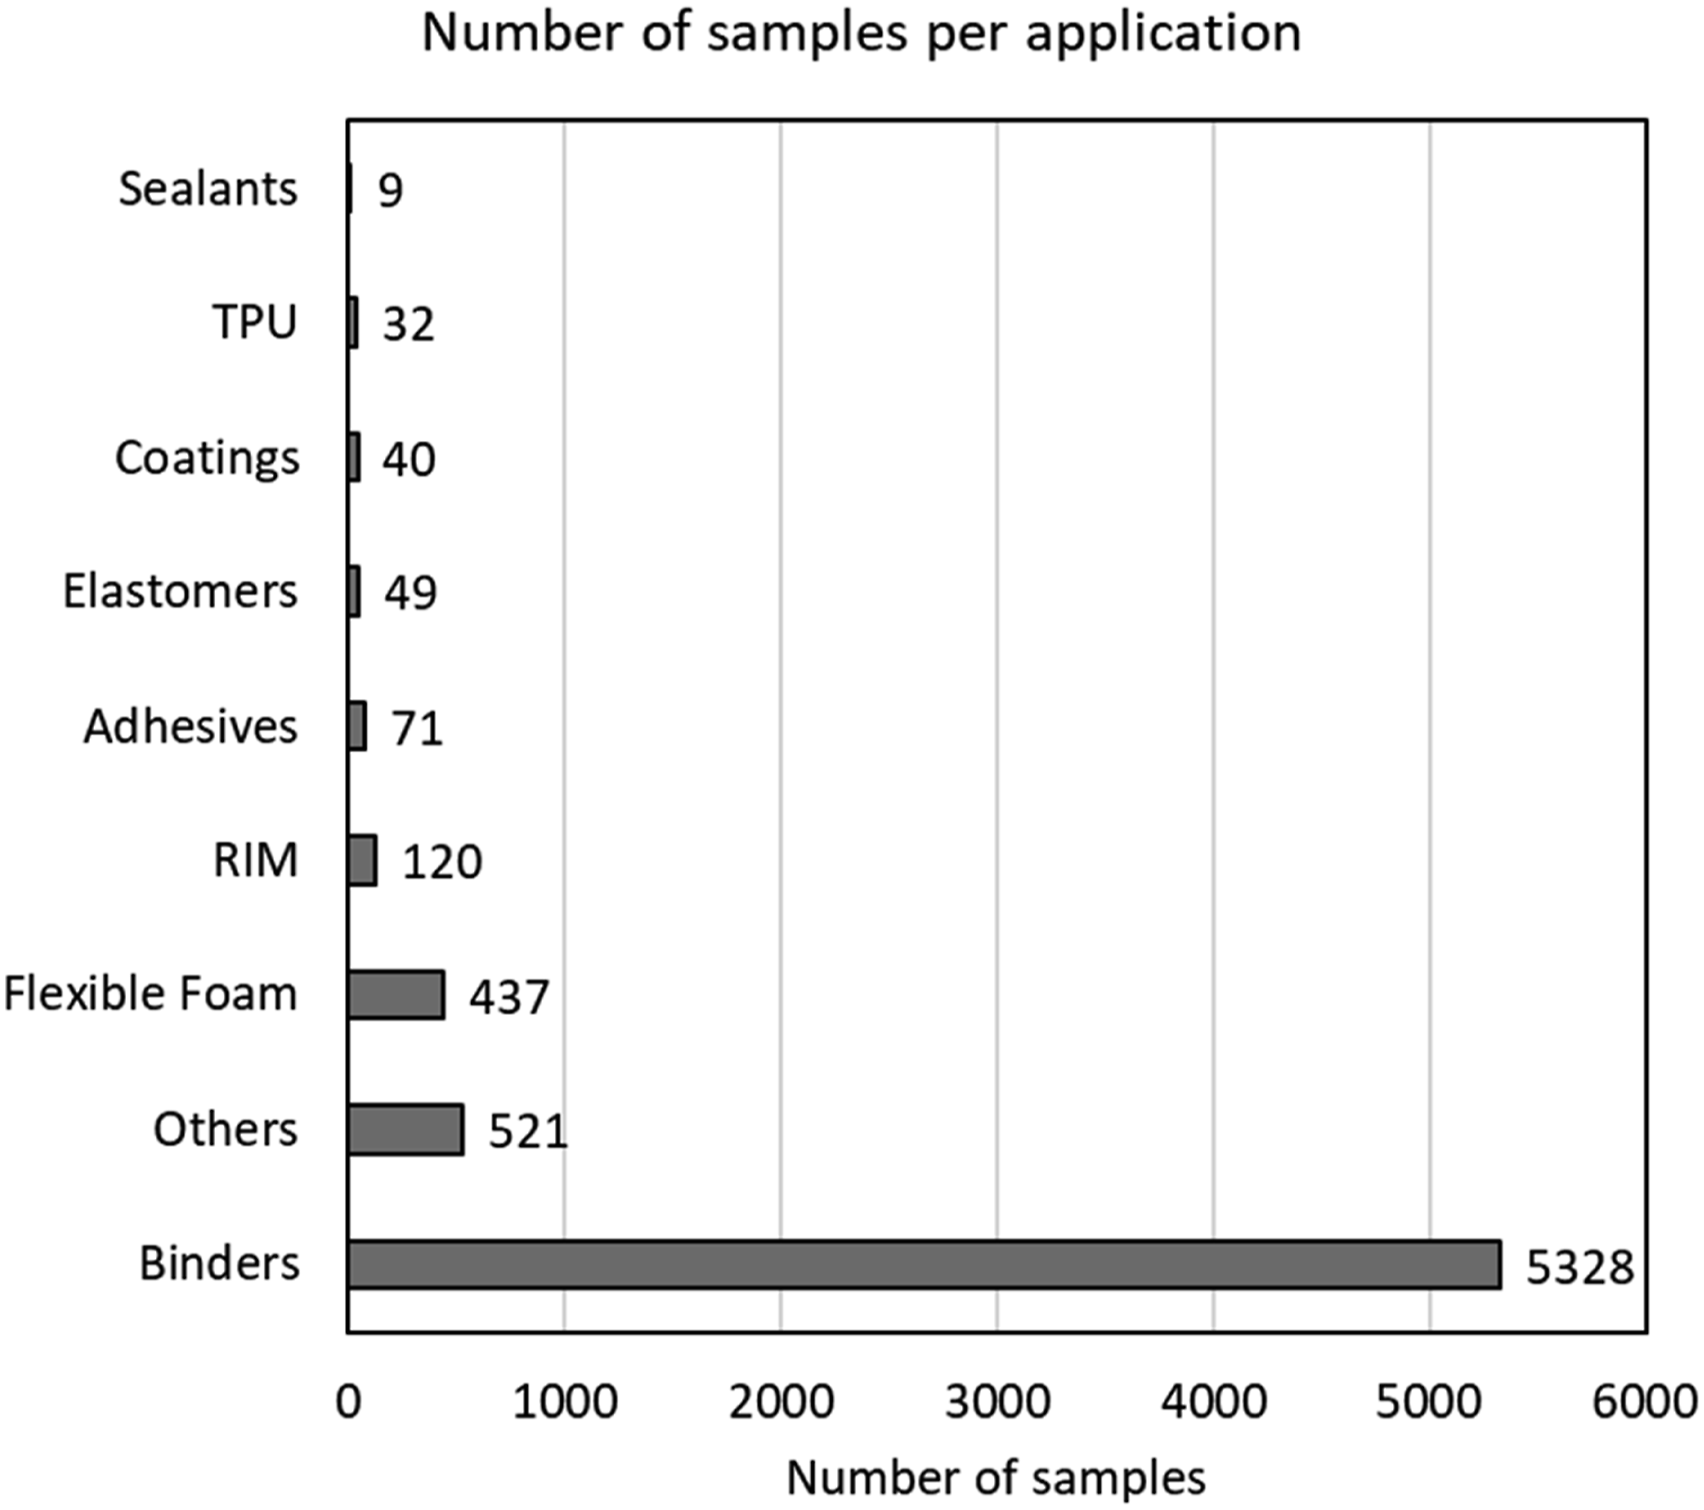
Occupational exposure limits (OELs) for mMDI depend on the jurisdiction. In the US, OSHA (2022) has set a “ceiling” (i.e., not to be exceeded for any time period) permissible exposure limit of 0.20 mg/m3. ACGIH (1986) recommends an 8-h time-weighted average threshold limit value (TLV®-TWA8) of 0.051 mg/m3. Most European countries have set a TWA8 value of 0.051 mg/m3 as well (range 2–10 ppb, 1 ppb = 0.0104 mg/m3 at 20°C). No OEL exists for the MDI oligomers; however, some countries (among others, the UK) use a limit based on total reactive isocyanate groups. IARC (1999) judged that there is inadequate evidence for a carcinogenicity classification of MDI. The main adverse health effect is the potential development of occupational asthma, as described for TDI by Sayles et al. (2022). Epidemiological information specifically related to MDI is limited: only two studies were noted in a recent review by Antoniou and Zeegers (2022). In this work, the focus is on airborne concentrations.
Because of the low vapor pressure of mMDI (<10−3 Pa, Spence and Plehiers, 2022), the presence of MDI aerosols (as suspended liquid droplets or coating the surface of dust particles) in addition to vapor in the workplace atmosphere cannot be excluded when the total concentration of mMDI exceeds 0.06 mg/m3 at 25°C. For pMDI, that threshold would even be lower. From that perspective, both inhalation and dermal exposure are possible and should be considered when selecting proper work gear and protective equipment.
The analysis reported in this paper was performed to (1) assess airborne mMDI concentrations in various work environments; (2) identify applications and/or areas with increased risk of exposure so that potential reductions can be investigated; (3) evaluate the use of respirators in workplaces using MDI; and (4) inform about Product Stewardship (PS) activities geared toward improving engineering control measures and/or use of personal protective equipment such as respirators.
Methods
Description of the data set
The data set was collected between 1998 and 2020 by Industrial Hygiene (IH) professionals of companies producing MDI during various PS activities at customer facilities. Samples were generally taken using validated methods that involve the derivatization of MDI during sampling by reaction with a secondary amine-containing reagent, either in impinger solution (HSE, 2015; NIOSH, 1994) or coated on a glass fiber substrate (ISO 17734-1:2013; OSHA, 1989, 2021) and were analyzed in accredited IH laboratories. Handheld direct-reading instruments or incompletely specified methods were used for <5% of the samples (see Supplemental Information, Table S-1). As previously mentioned, at concentrations exceeding 0.06 mg/m3, the potential presence of mMDI aerosols has to be considered (see Spence and Plehiers, 2022). The aforementioned validated analytical methods have been demonstrated to maintain their validity under such conditions (Hext et al., 2003).
It should be noted that the data set was collected for a variety of purposes related to practical implementation of PS programs. No randomized industry-wide sampling was conducted. As such, the results may tend toward higher exposures since such sampling is often performed to assess key areas or tasks of concern.
With few exceptions, the limit of quantification (LOQ) for the 3307 samples marked as not-detected (“ND”) was <0.01 mg/m3. Higher LOQs were limited to samples with short sampling times (<15 min) or some that were taken using handheld direct-reading (e.g., paper tape) devices. Of all samples taken, only 18 (0.2%, see Figure S-1, Supplemental Information) had an LOQ >0.02 mg/m3. Since ½ LOQ was used for classification (see Data processing), the potential impact of these samples on the main conclusions of this study was negligible (Supplemental Information).
For each sample in the database, the use of respiratory protective equipment (RPE) was confirmed (“Yes”), negated (“No”), or not reported. The percentage RPE use (%RPE) reported in the tables solely reflects those samples where the use of RPE was unequivocally confirmed (“Yes”). The type of RPE used was not recorded in the database. Figure S-2 (Supplemental Information) provides an overall summary of the reported use of RPE for the personal samples collected in this database.
Definition of sample types
Samples were grouped into personal and area samples. Area samples were collected in a fixed workplace location, typically to assess areas within a facility where increased exposure potential exists, and the effectiveness of engineering control measures such as ventilation.
Personal samples are typically collected in the breathing zone of workers and allow making individual or job-related exposure assessments. The sampling duration can range between minutes and several hours. Three types of personal samples were differentiated: • Task-based samples were collected while performing a specific work operation. Sample duration was typically between 15 and 30 min. • Short-term personal samples refer to samples for which a specific task was not identified and for which the sampling duration was less than or equal to 4 h (240 min). • Long-term personal samples involved sampling durations greater than 4 h (240 min).
Data processing
All analyses were performed using the built-in functionality of MS Excel (Microsoft Corporation, Redmond, WA, USA) to calculate the range, arithmetic mean (average), and standard deviation, as well as the geometric mean (GM) and geometric standard deviation (GSD). Values less than the LOQ were included in the analysis as ½ LOQ. The Student t-test was used with a p < 0.05 criterion to evaluate whether distributions were statistically different or not.
For generating distributions, samples were classified into the following six concentration ranges based on the sum of the concentrations of MDI monomers 1 (x in mg/m3): x ≤ 0.01, 0.01 < x ≤ 0.02, 0.02 < x ≤ 0.05, 0.05 < x ≤ 0.10, 0.10 < x ≤ 0.20, and x>0.20. These values approximately correspond to boundaries chosen at 1, 2, 5, 10, and 20 ppb and agree well with common OEL values. When available, the concentration of MDI oligomers was compared with MDI monomer concentrations to obtain a better overview of overall exposure.
The database was analyzed by geographical region, period of sampling, sample type, and type of application. Further detail was investigated for the Binders (composite wood) applications by analyzing concentrations in relation to specific job positions or facility sections.
Results
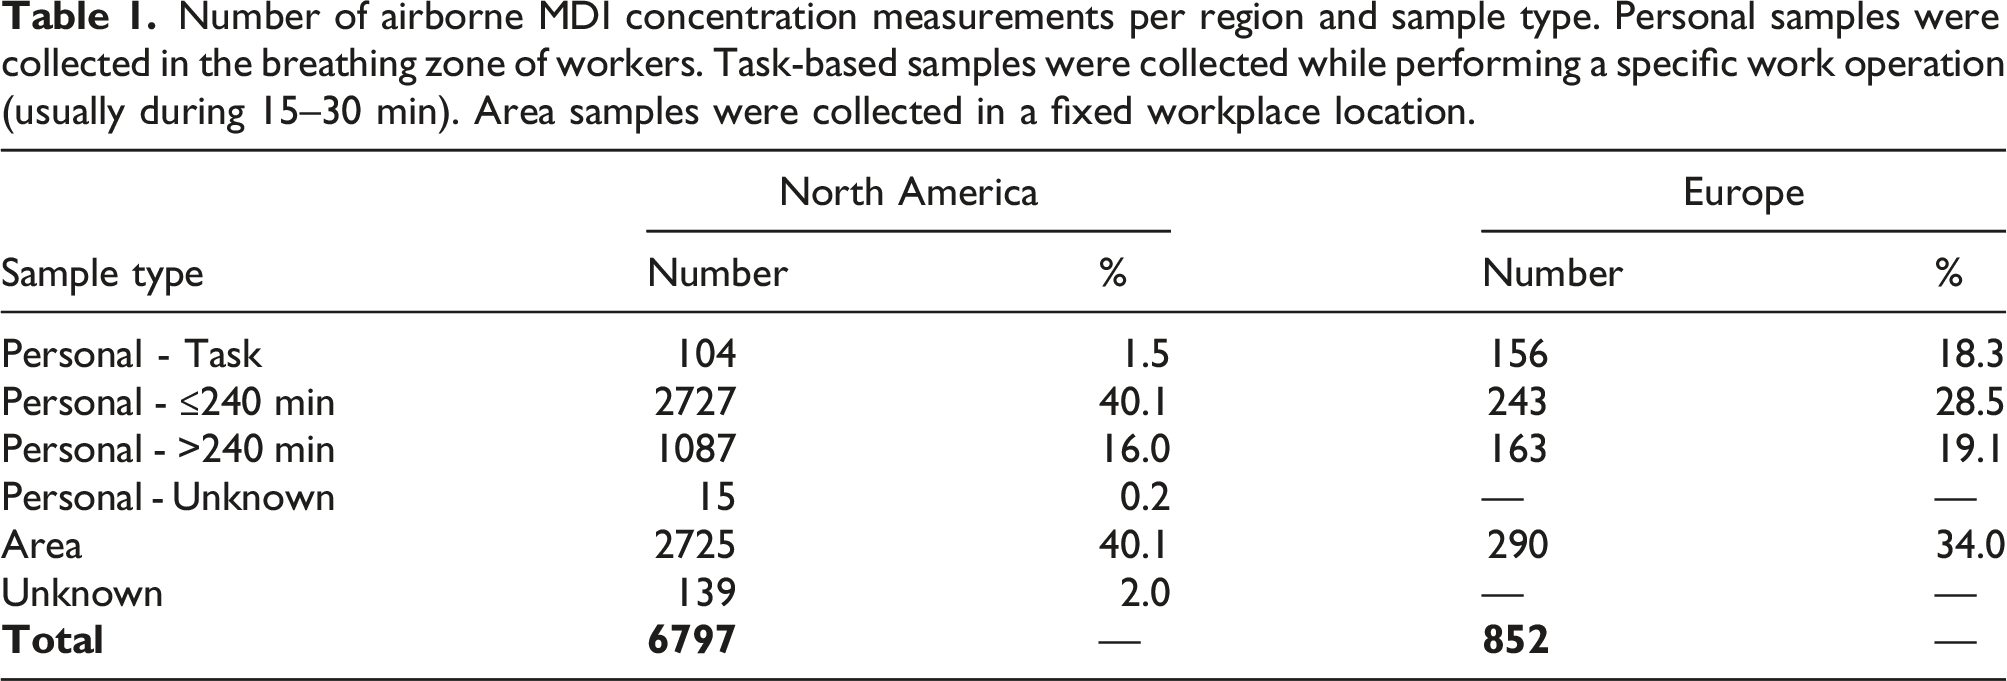
Number of airborne MDI concentration measurements per region and sample type. Personal samples were collected in the breathing zone of workers. Task-based samples were collected while performing a specific work operation (usually during 15–30 min). Area samples were collected in a fixed workplace location.
Summary by geographical region
Distribution (as % of total number of samples) and summary statistics of airborne MDI concentration and percentage confirmed use of RPE (%RPE) for all sample types and applications per region and sample collection period.
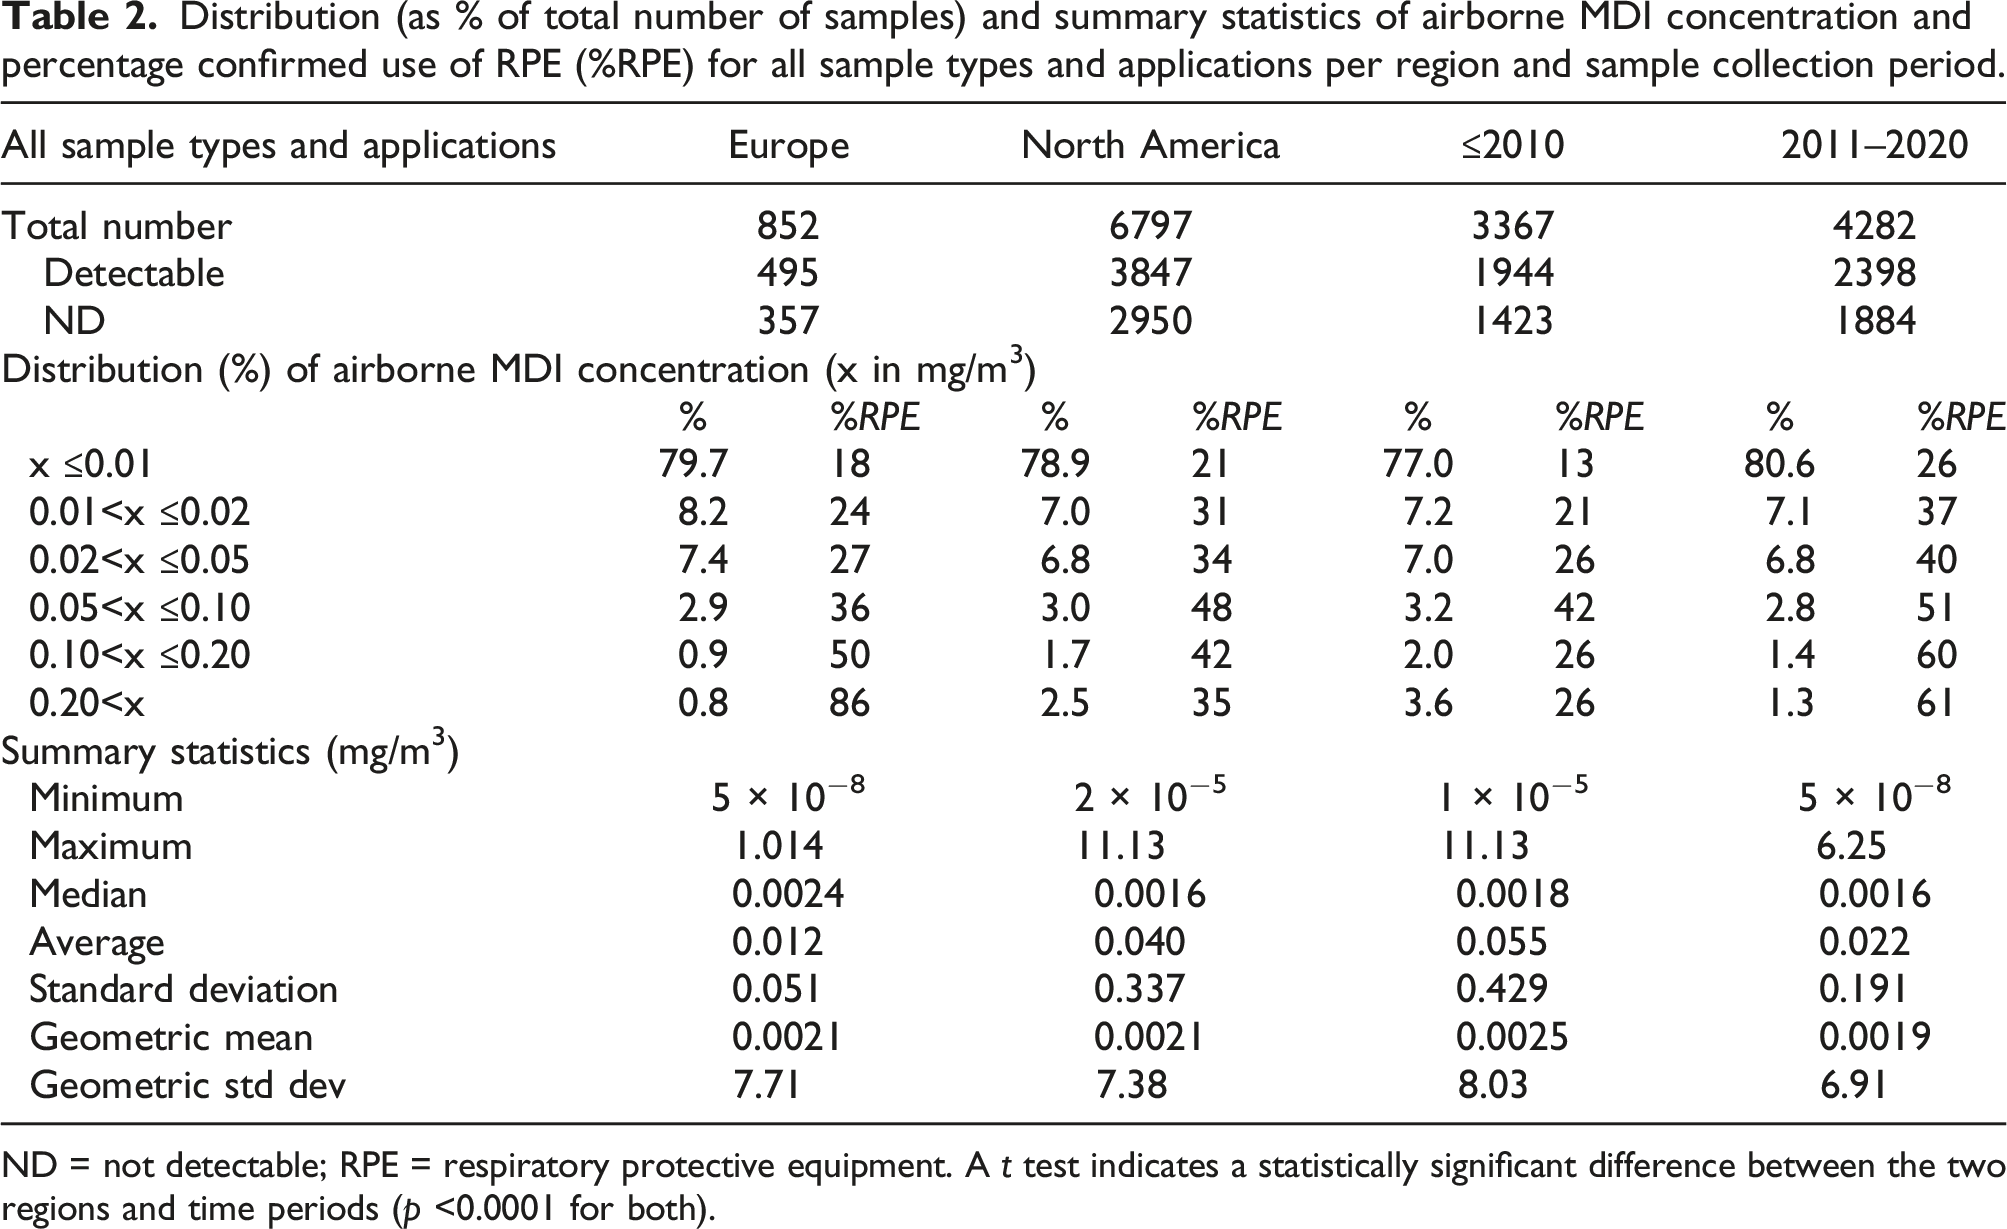
ND = not detectable; RPE = respiratory protective equipment. A t test indicates a statistically significant difference between the two regions and time periods (p <0.0001 for both).
Summary by time period
Table 2, together with Figures S-5 and S-6 in the Supplemental Information, provides an overview of the distributions and summary statistics of airborne MDI concentrations for samples taken prior to 2010 and during the period 2011–2020. The average and standard deviation were 0.055 ± 0.429 mg/m3 prior to 2010 and 0.022 ± 0.191 mg/m3 during the decade thereafter, respectively. The difference between the averages of the two periods was statistically significant (p < 10−4), which was mainly attributable to area samples >0.1 mg/m3 (see Supplemental Information). There is an important increase in confirmed use of RPE between the former and the latter period. This will be expanded upon in the Detailed overview of composite wood applications section. Median values and GM (approx. 0.002 mg/m3) were similar for both time periods (42–44% of samples were ND) and do not reflect the differences in the distributions.
Summary by sample type and concentration
Distribution (as % of total number of samples) and summary statistics of airborne MDI concentration and percentage confirmed use of RPE (%RPE) by sample type across all applications.
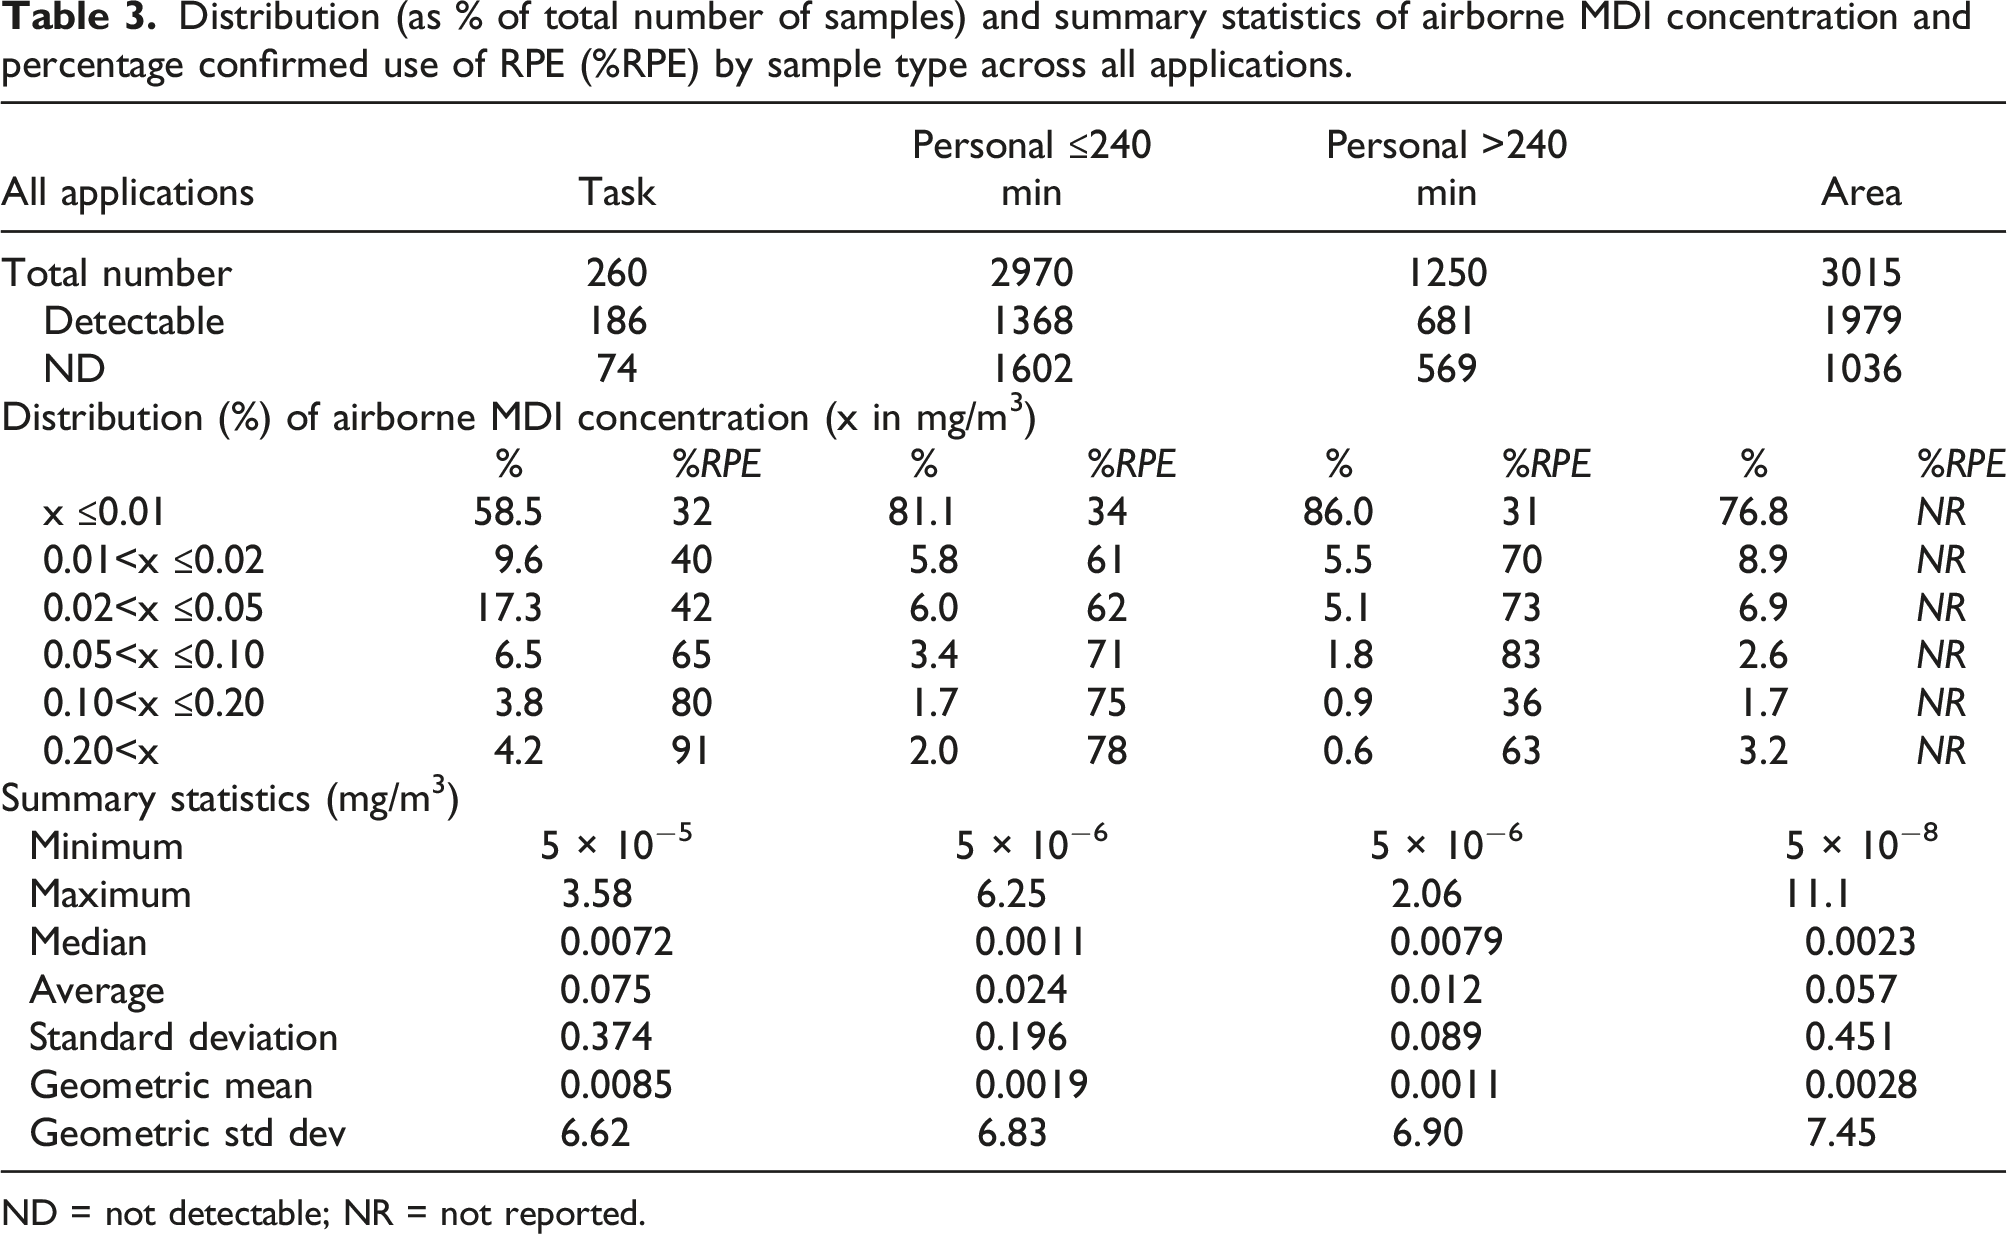
ND = not detectable; NR = not reported.
The area samples were mainly (88.4%) associated with the Binders application and will be discussed in the Detailed overview of composite wood applications section. Most of the area samples were static measurements (i.e., not on a person), which explains why the use of RPE was not reported in most cases.
Analysis of airborne concentrations exceeding 0.2 mg/m3
For 174 samples (2.3%), the measured MDI concentration exceeded 0.2 mg/m3. Thereof, 148 were in the Binders application, 19 in Rigid Foam, and 7 in Others: • 97 were area samples (92 in Binders, nearly all of which were taken in the blending and forming sections of composite wood production facilities). • 3 samples had no indication of sample type, but they were likely area samples according to comments reported (RPE usage was not reported). • 11 were task-based samples (6 in spray foam applications and 5 in isocyanate and prepolymer production), all with confirmed use of RPE. • 63 were other personal samples (53 in Binders, the majority of which were either taken in the blending and forming sections or during cleaning, and 9 in spray foam applications): 50 with confirmed use of RPE, 4 without RPE being used, and 9 for which use of RPE was not documented.
Analysis of concentration of MDI oligomers
The data set contained 1353 samples (17.7%) for which the concentrations of both MDI monomers (mMDI) and higher homologues (MDI oligomers, see Spence and Plehiers, 2022) were reported (i.e., neither “blank” [no value] nor “ND”). Figure 2 shows the histogram of the ratio of the MDI oligomers and mMDI concentrations. The average ratio was 0.589 with a standard deviation of 0.322. In 94.5% of cases, the ratio was ≤1. Figure S-7 (Supplemental Information) shows in an alternative way that—even though various grades
2
of MDI are used in the industry—the airborne concentrations of higher homologues and monomers were strongly correlated (R2 = 0.97). Histogram of the ratio of concentrations of MDI oligomers to MDI monomers (mMDI); X-axis values indicate the high and low end of each ratio range.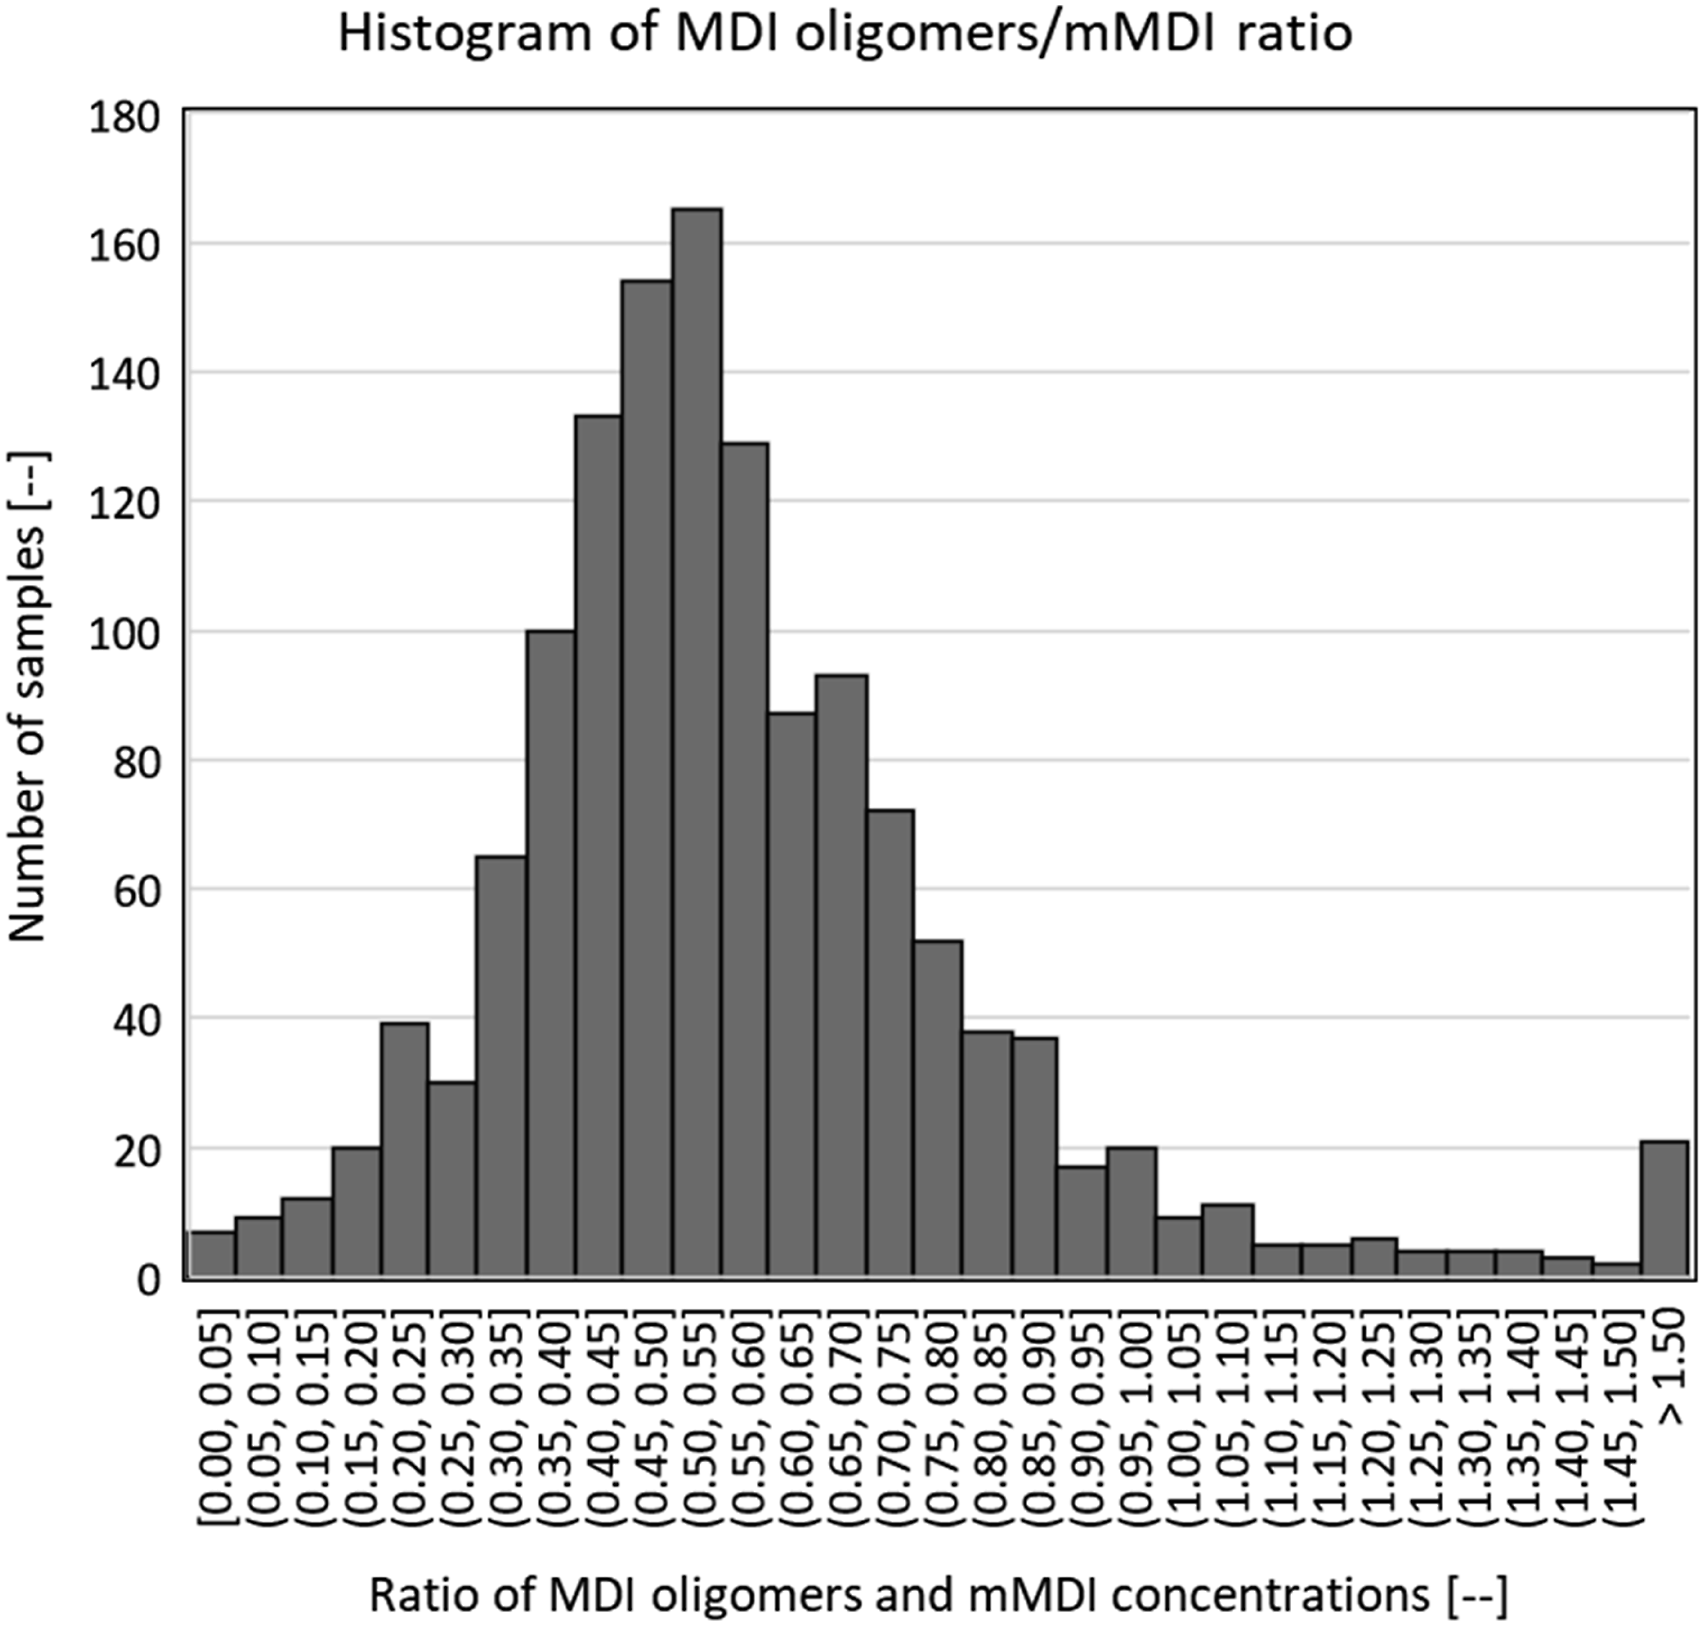
Overview by type of application
Distribution (as % of total number of samples) and summary statistics of airborne MDI concentration and percentage confirmed use of RPE for all sample types for applications other than “Binders.”
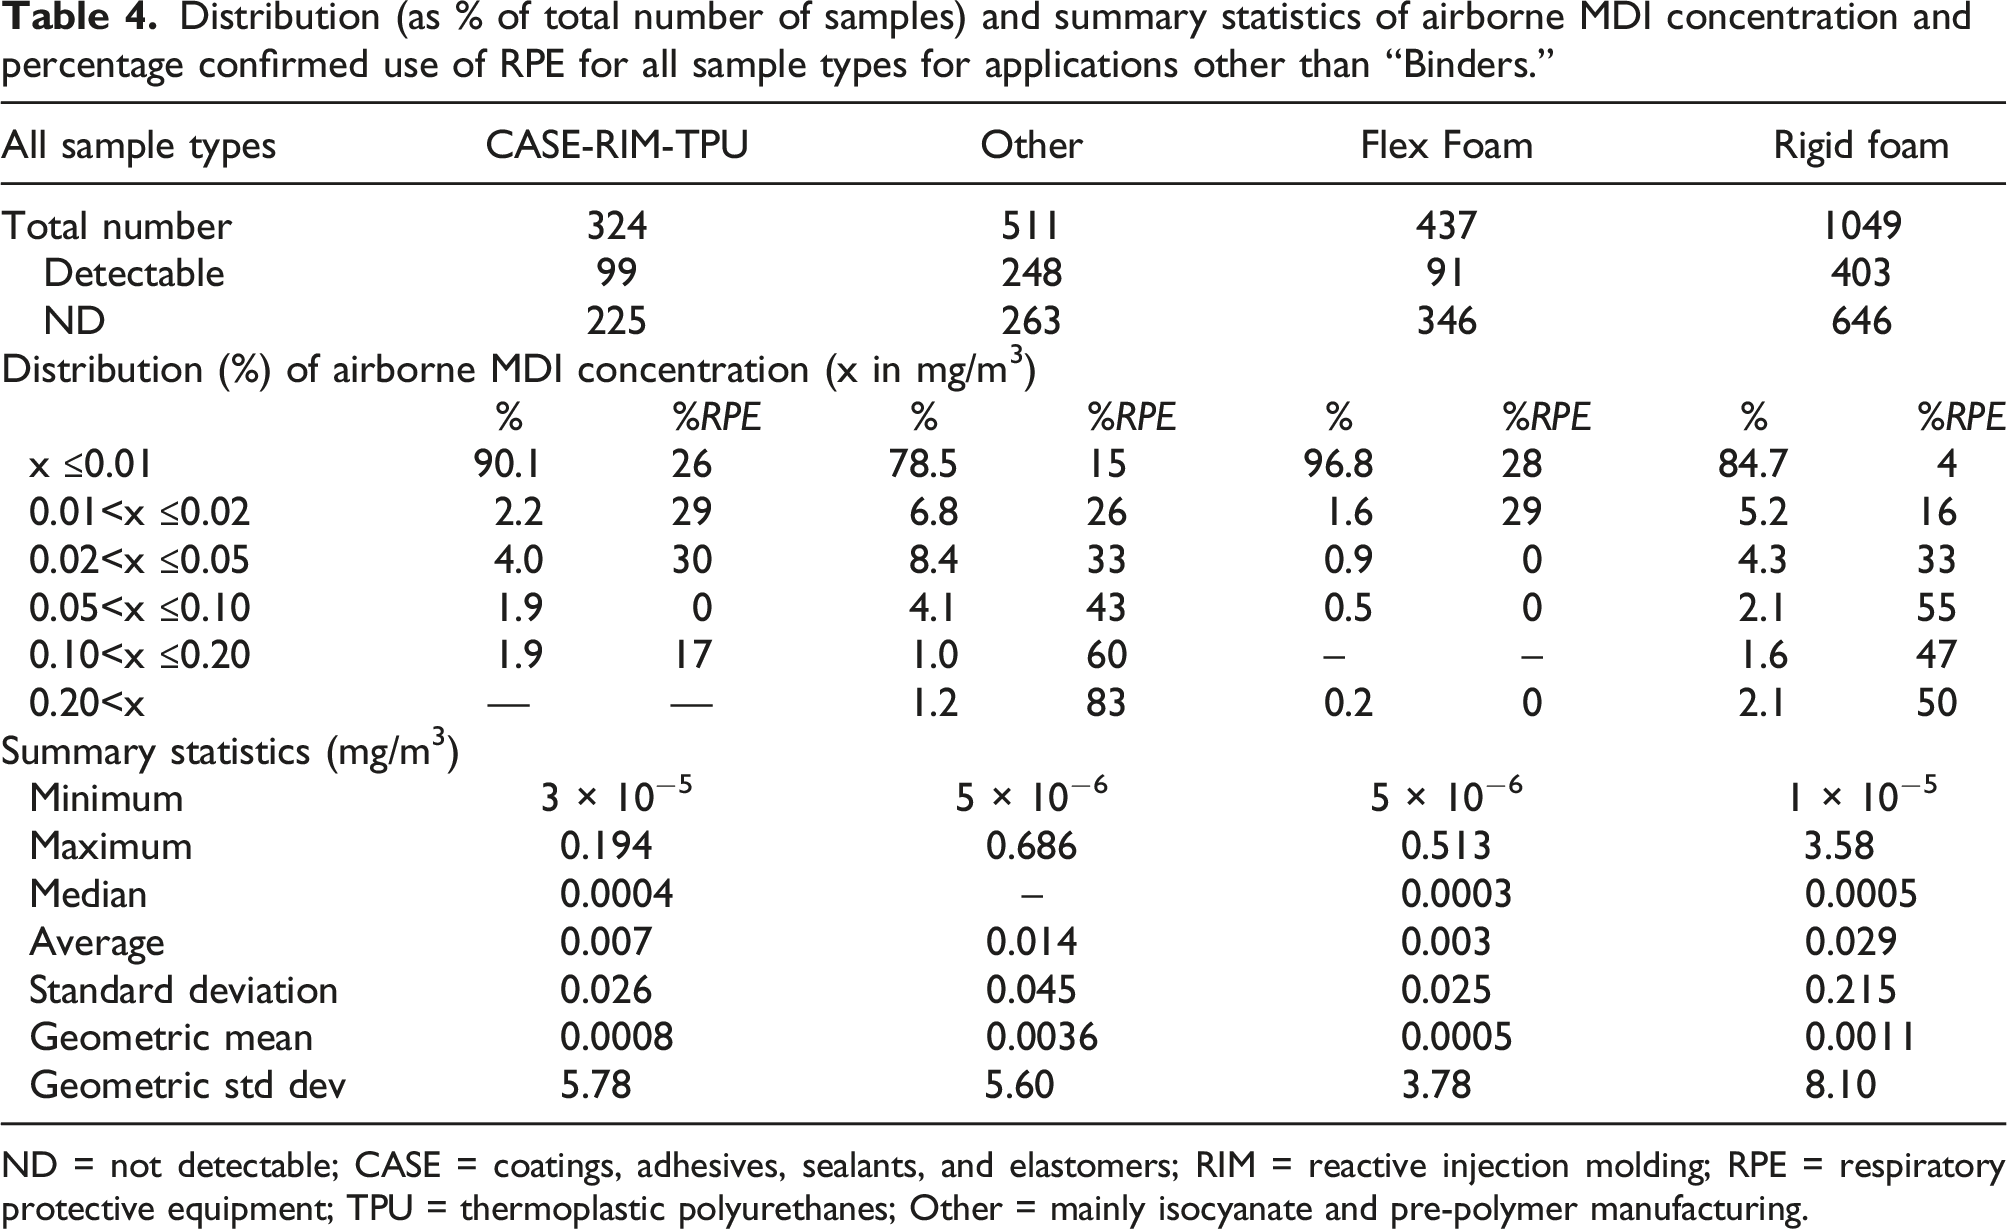
ND = not detectable; CASE = coatings, adhesives, sealants, and elastomers; RIM = reactive injection molding; RPE = respiratory protective equipment; TPU = thermoplastic polyurethanes; Other = mainly isocyanate and pre-polymer manufacturing.
Tables S-2 and S-3 (Supplemental Information) distinguish along sample types for the aforementioned applications. In some cases, the number of task-based samples was too small to perform a meaningful analysis. Across applications, task-based samples showed greater averages and standard deviations than other personal samples. In general, short-term personal samples showed greater averages and standard deviations than long-term samples. This is consistent with the observations made from Table 3. In the “Other” category, high concentrations during task-based sampling were no longer visible in the personal samples. For Rigid Foam, higher exposures were reflected in the personal samples, indicating that the specific task (spraying) occupied a larger portion of the work time.
While sprayed and non-sprayed rigid foam applications were not handled as separate categories, additional data entries (process and job descriptions as well as comments) allowed the authors to reasonably distinguish between the two. A brief summary is presented in Table S-4 (Supplemental Information). Non-sprayed applications (mostly insulation board) showed a low average and standard deviation of 0.007 ± 0.032 mg/m3; >90% of the readings were <0.01 mg/m3. Sprayed applications had an average and standard deviation of 0.115 ± 0.470 mg/m3; the percentage of readings <0.01 mg/m3 was approximately 65%.
Detailed overview of composite wood applications
Distribution (as % of total number of samples) and summary statistics of airborne MDI concentration and percentage confirmed use of RPE for personal samples for the “Binders” application.
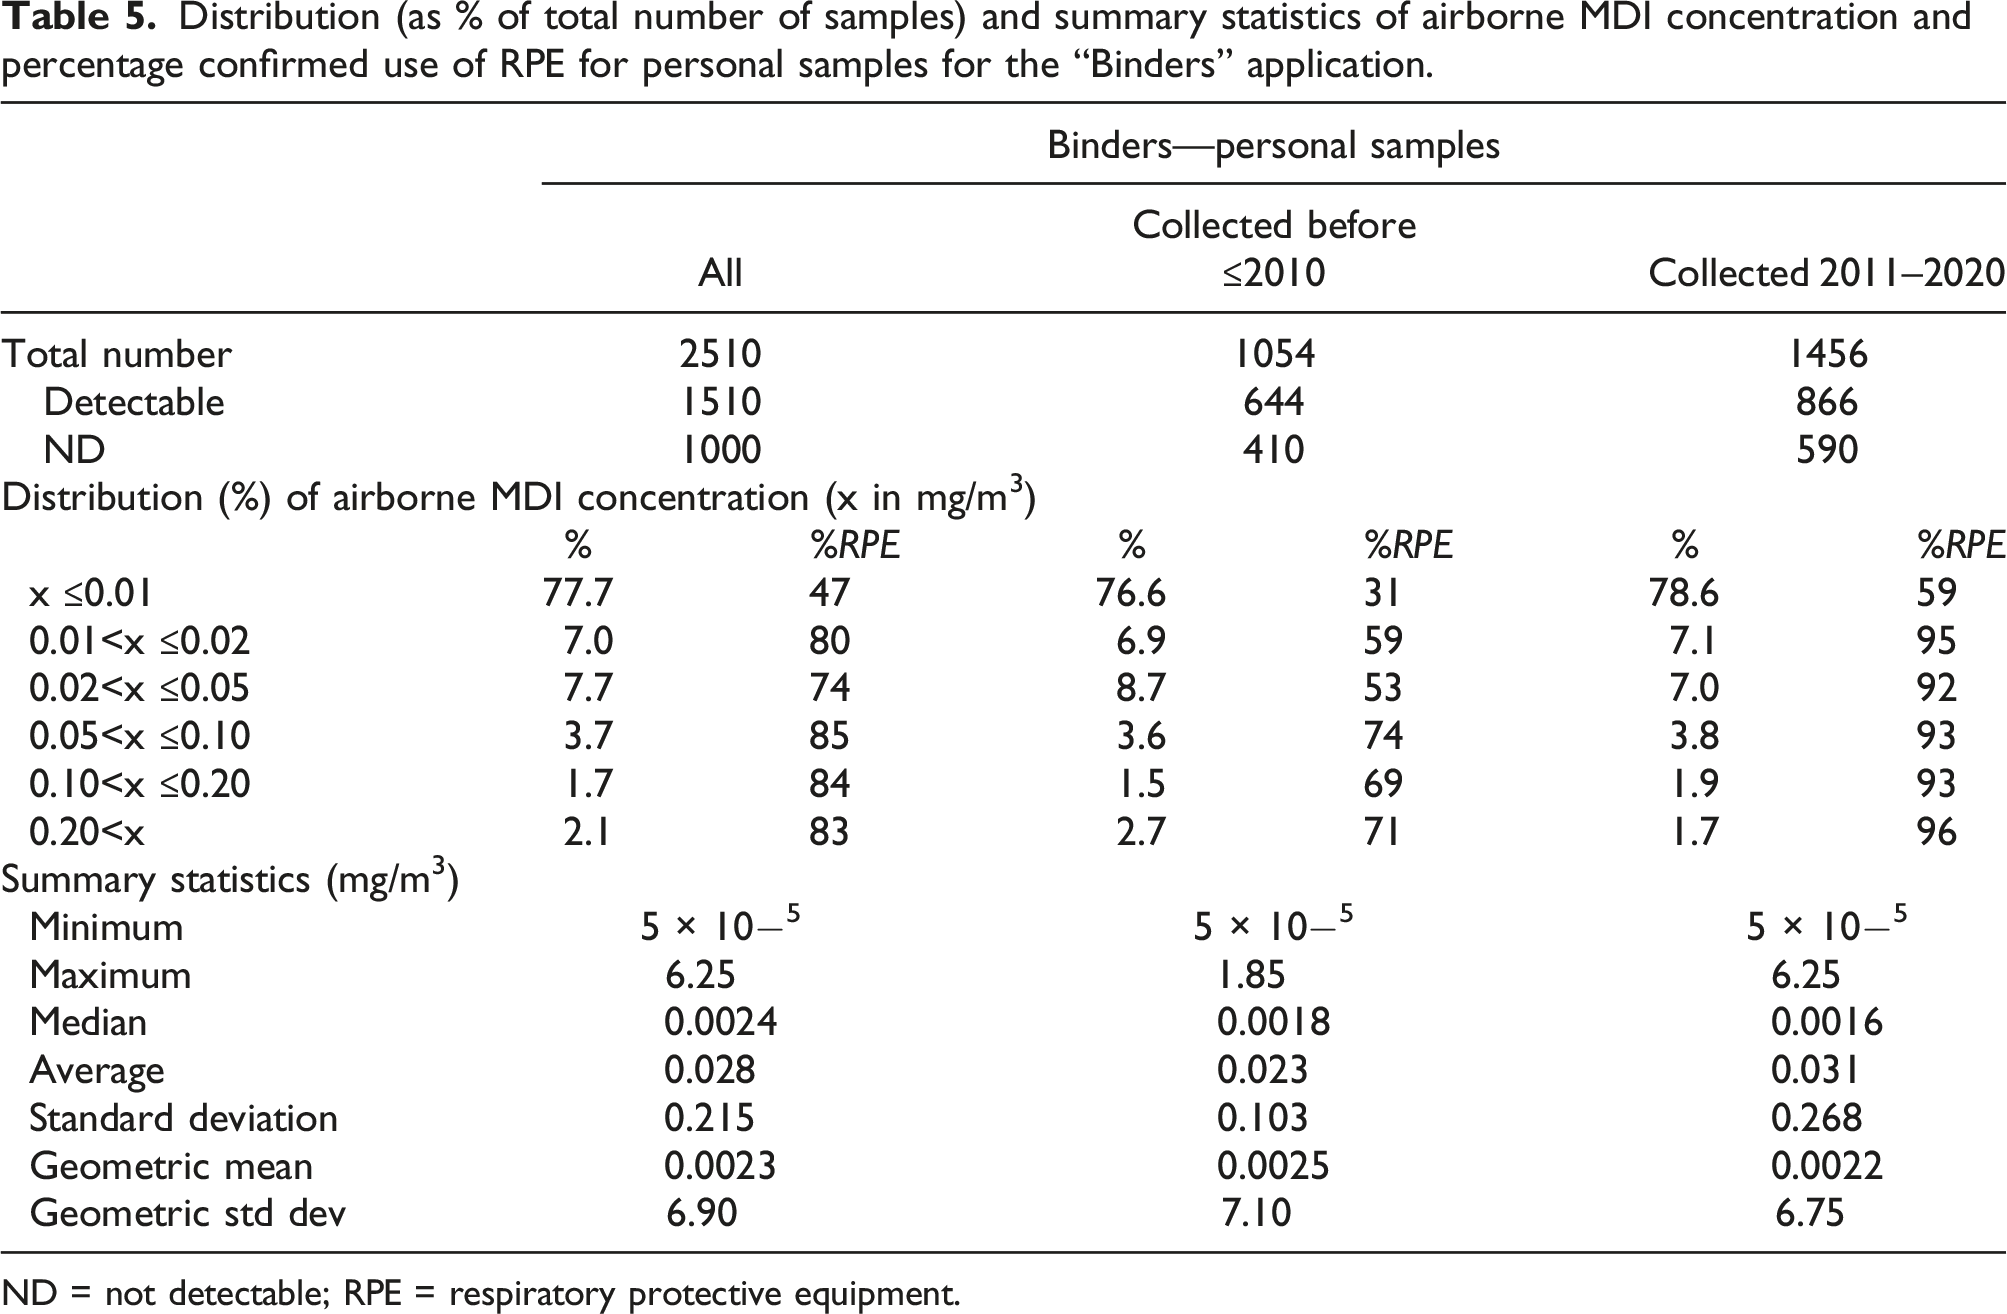
ND = not detectable; RPE = respiratory protective equipment.
Table S-5 (Supplemental Information) provides a similar analysis by sample type for the Binders application. There were only 14 task-based samples, which were therefore not included in the analysis. There were many area samples: in most cases these were static samples for which RPE usage was not reported. The general trend toward lesser and more narrowly distributed exposure levels with increasing sampling time could be observed here as well. With approximately 40% of the personal samples reported as ND, median and GM again offer little insight into the exposure profiles.
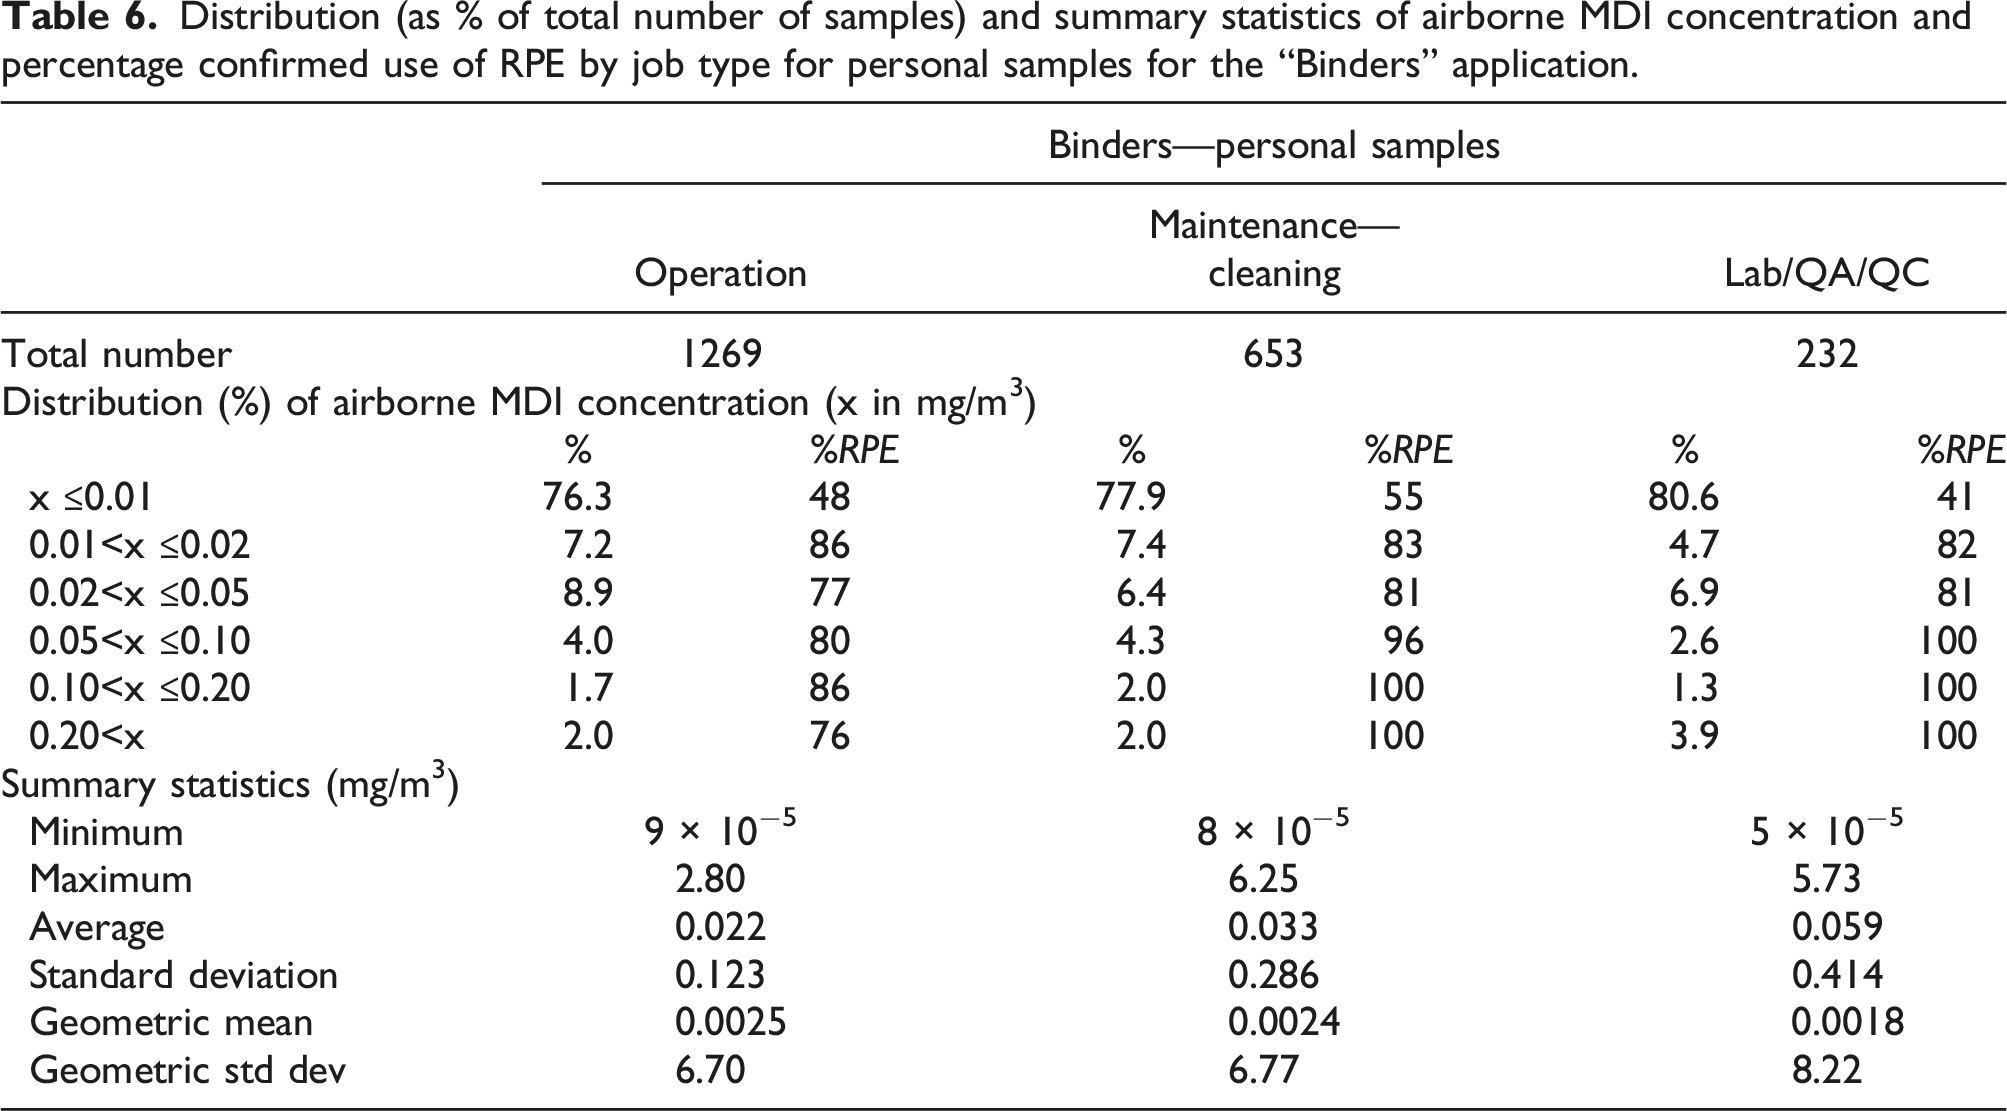
Distribution (as % of total number of samples) and summary statistics of airborne MDI concentration and percentage confirmed use of RPE by job type for personal samples for the “Binders” application.
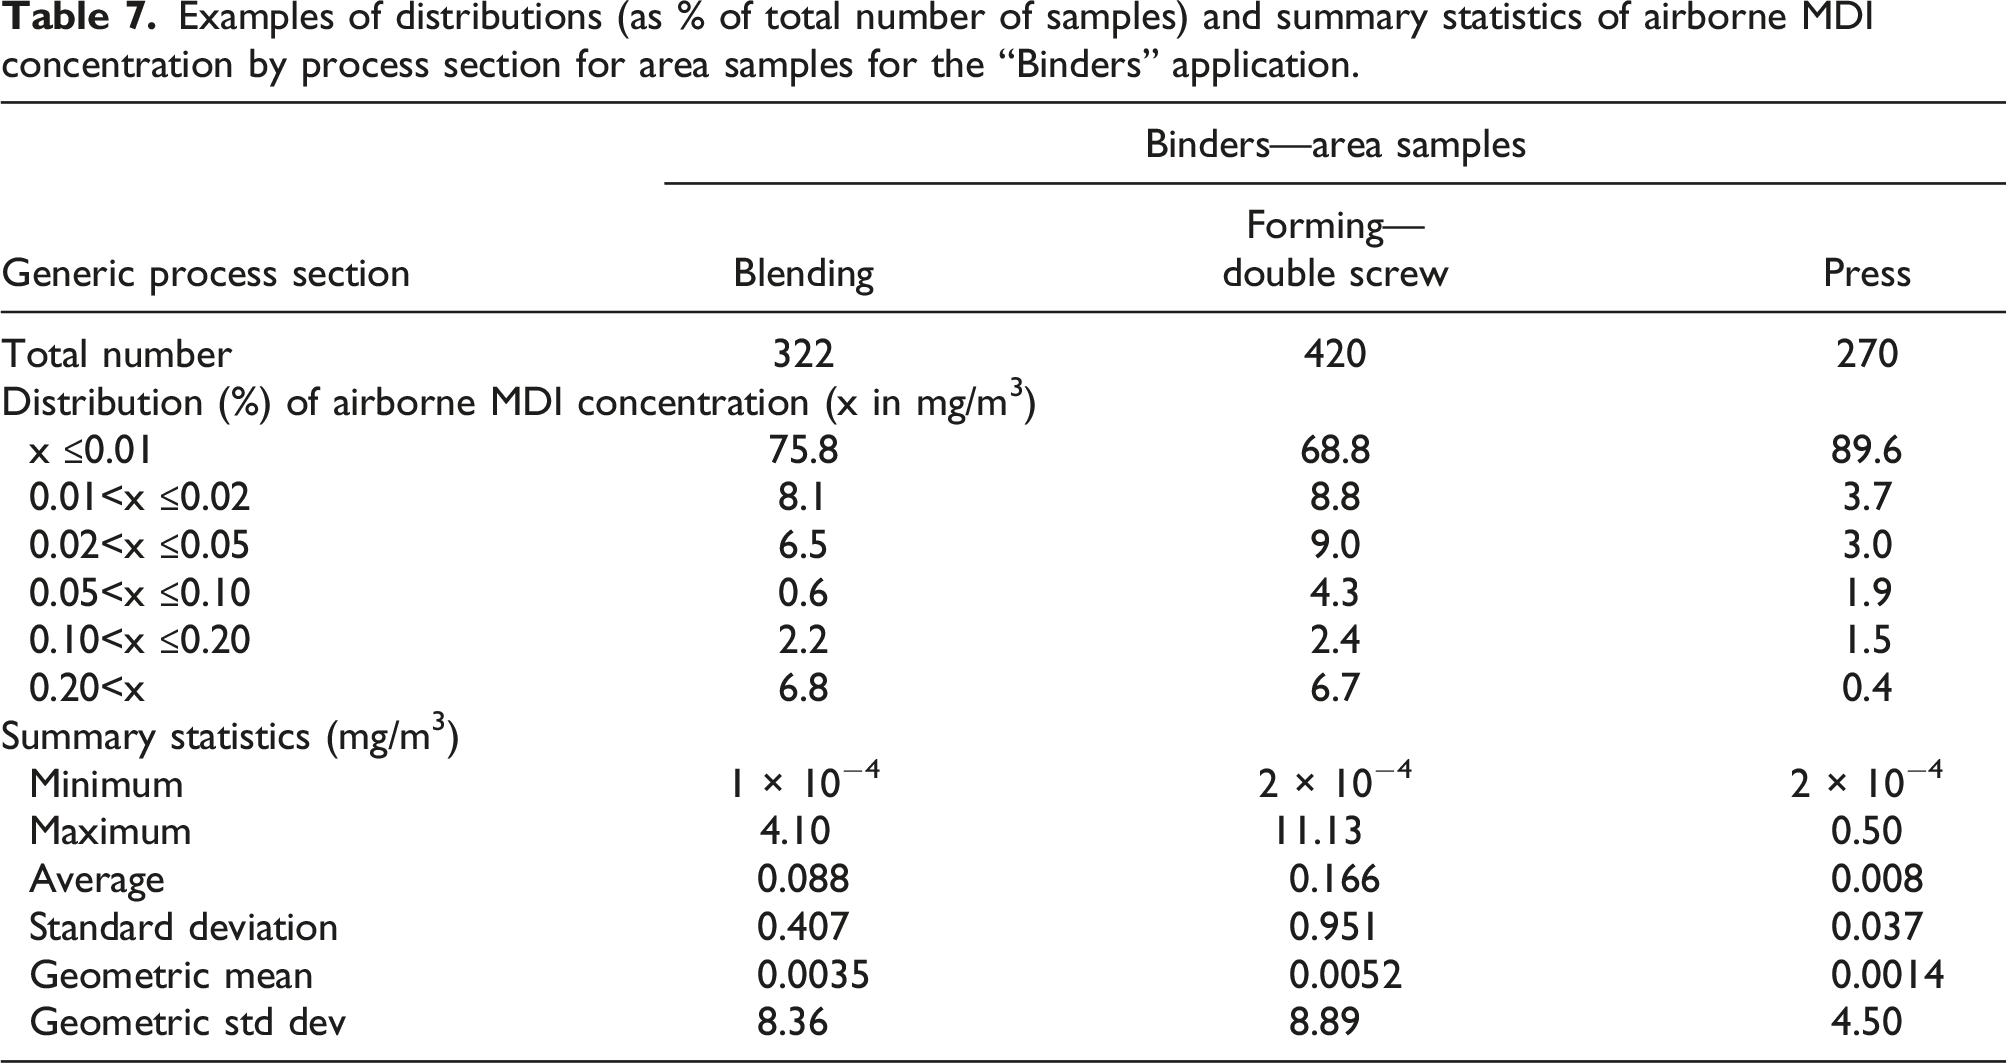
Examples of distributions (as % of total number of samples) and summary statistics of airborne MDI concentration by process section for area samples for the “Binders” application.
Discussion
The analysis per geographical region indicated that airborne MDI concentrations were on average lower in the EU than NA while considerably more samples were taken in NA (Table 2). This difference likely reflects the different approaches to PS exposure monitoring programs in the two regions: the NA tends to be more “annual sampling plan” oriented while those in the EU more often are of a “periodic spot check” nature. Other potential explanations (e.g., process differences and level of engineering controls) could not be verified based on the available information.
Comparing samples taken during the past decade (2011–2020) with those taken during the preceding one (≤2010), a reduction of the average concentration was observed (Table 2). This was the result of a reduction in frequency of high concentrations in area samples. More importantly, RPE use has increased and in the Binders application has reached near-100% levels for concentrations exceeding 0.05 mg/m3. Regardless of this success, improvement potential still exists with regard to the use of RPE in other applications as well as to engineering control measures in the blending and forming sections of wood processing facilities.
Awareness for the potential of higher exposure during specific tasks is generally high, as expressed by the %RPE use for task-based samples in general (Table 3) as well as for specific job roles (Table 6). When analyzed by sample type, both the average concentration as well as the standard deviation decreased in the order task-based > short-term personal > long-term personal samples. This observation is consistent with the results of Sayles et al. (2022) who analyzed a similar database with TDI measurements. This is not a surprise, since task-based concentrations, which are often taken around anticipated higher exposure activities, are included in personal samples but not necessarily well-discernable because of time-weighting in personal samples of longer duration. Our database included many area samples, which could fulfill a similar role as task-based samples (e.g., for access control). For the detection of peak exposures, a combination of sample types is therefore required. Peak exposures demand attention since they may be related to the development of occupational asthma (Ott et al., 2000, 2003; Plehiers et al., 2020a, 2020b; Weil et al., 1981).
From a practical perspective, it could be noted that MDI oligomers can generally be assumed to be present at a level that is less than that of the monomers (Figure 2). In facilities that are processing pMDI, this may be helpful information to reduce the need for using more elaborate analysis protocols: it implies that MDI oligomer concentrations will be controlled to acceptable levels if MDI monomer concentrations are.
Given the frequent occurrence of high airborne MDI concentrations and of MDI oligomers in general (both of which are indicative of the presence of aerosols), as well as the presence of MDI-containing dust in composite wood manufacturing specifically (Vangronsveld et al., 2010), dermal exposure could be a source of concern (Bello et al., 2007; Karoly et al., 2004) and adequate skin coverage and/or biomonitoring may be advisable.
This work was intended as a follow-up to a previous analysis by Booth et al. (2009), who analyzed data collected between 1984 and 1999. A direct comparison per application is not possible since Booth et al. (2009) only reported distributions but no averages on a per-application basis. However, overall averages can be compared. The average of all personal and area samples (Booth et al., 2009: 0.014 ± 0.12 and 0.057 ± 0.32 mg/m3, respectively) seemingly has changed little (our analysis: 0.020 ± 0.172 and 0.057 ± 0.451 mg/m3). On the other hand, Booth et al. (2009) reported 113/734 (15.4%) and 345/2840 (11.2%) of the area samples to be > 0.05 mg/m3 for the Rigid Foam and Binders (equivalent to the combination of binders plus OSB in their summary) applications, respectively. Tables S-3 and S-5 (Supplemental Information) show that in our analysis, 2.5% and 8.1% of the area samples for the Rigid Foam and Binders applications exceeded 0.05 mg/m3, respectively.
Specifically for the Binders application, the results of this survey can also be compared with the data obtained by Karoly et al. (2004) in OSB manufacturing facilities. Several qualitative observations corresponded well between the two studies. The blending and forming areas showed high area sample readings, while tighter atmosphere control in the press area was achieved (Table 7), and cleaning and maintenance were identified as jobs with high exposure potential (Table 6). The fractions of area samples exceeding 0.05 mg/m3 were 8.2% (Karoly et al., 2004) and 9.2% (Table S-8, Supplemental Information) in this work. Both average values and standard deviations were greater in this work, for long-term personal samples (0.007 ± 0.035 vs 0.014 ± 0.086 mg/m3; Table S-5) as well as for area samples (0.024 ± 0.110 vs 0.082 ± 0.561 mg/m3; Table S-8). Overall, the two studies provide a consistent picture.
Summary of literature data on occupational exposure to MDI. Unless otherwise indicated, minimum and maximum values are given. “X” indicates that values were reported for that range in the reference. “This database” gives the values from the database used in the current work.
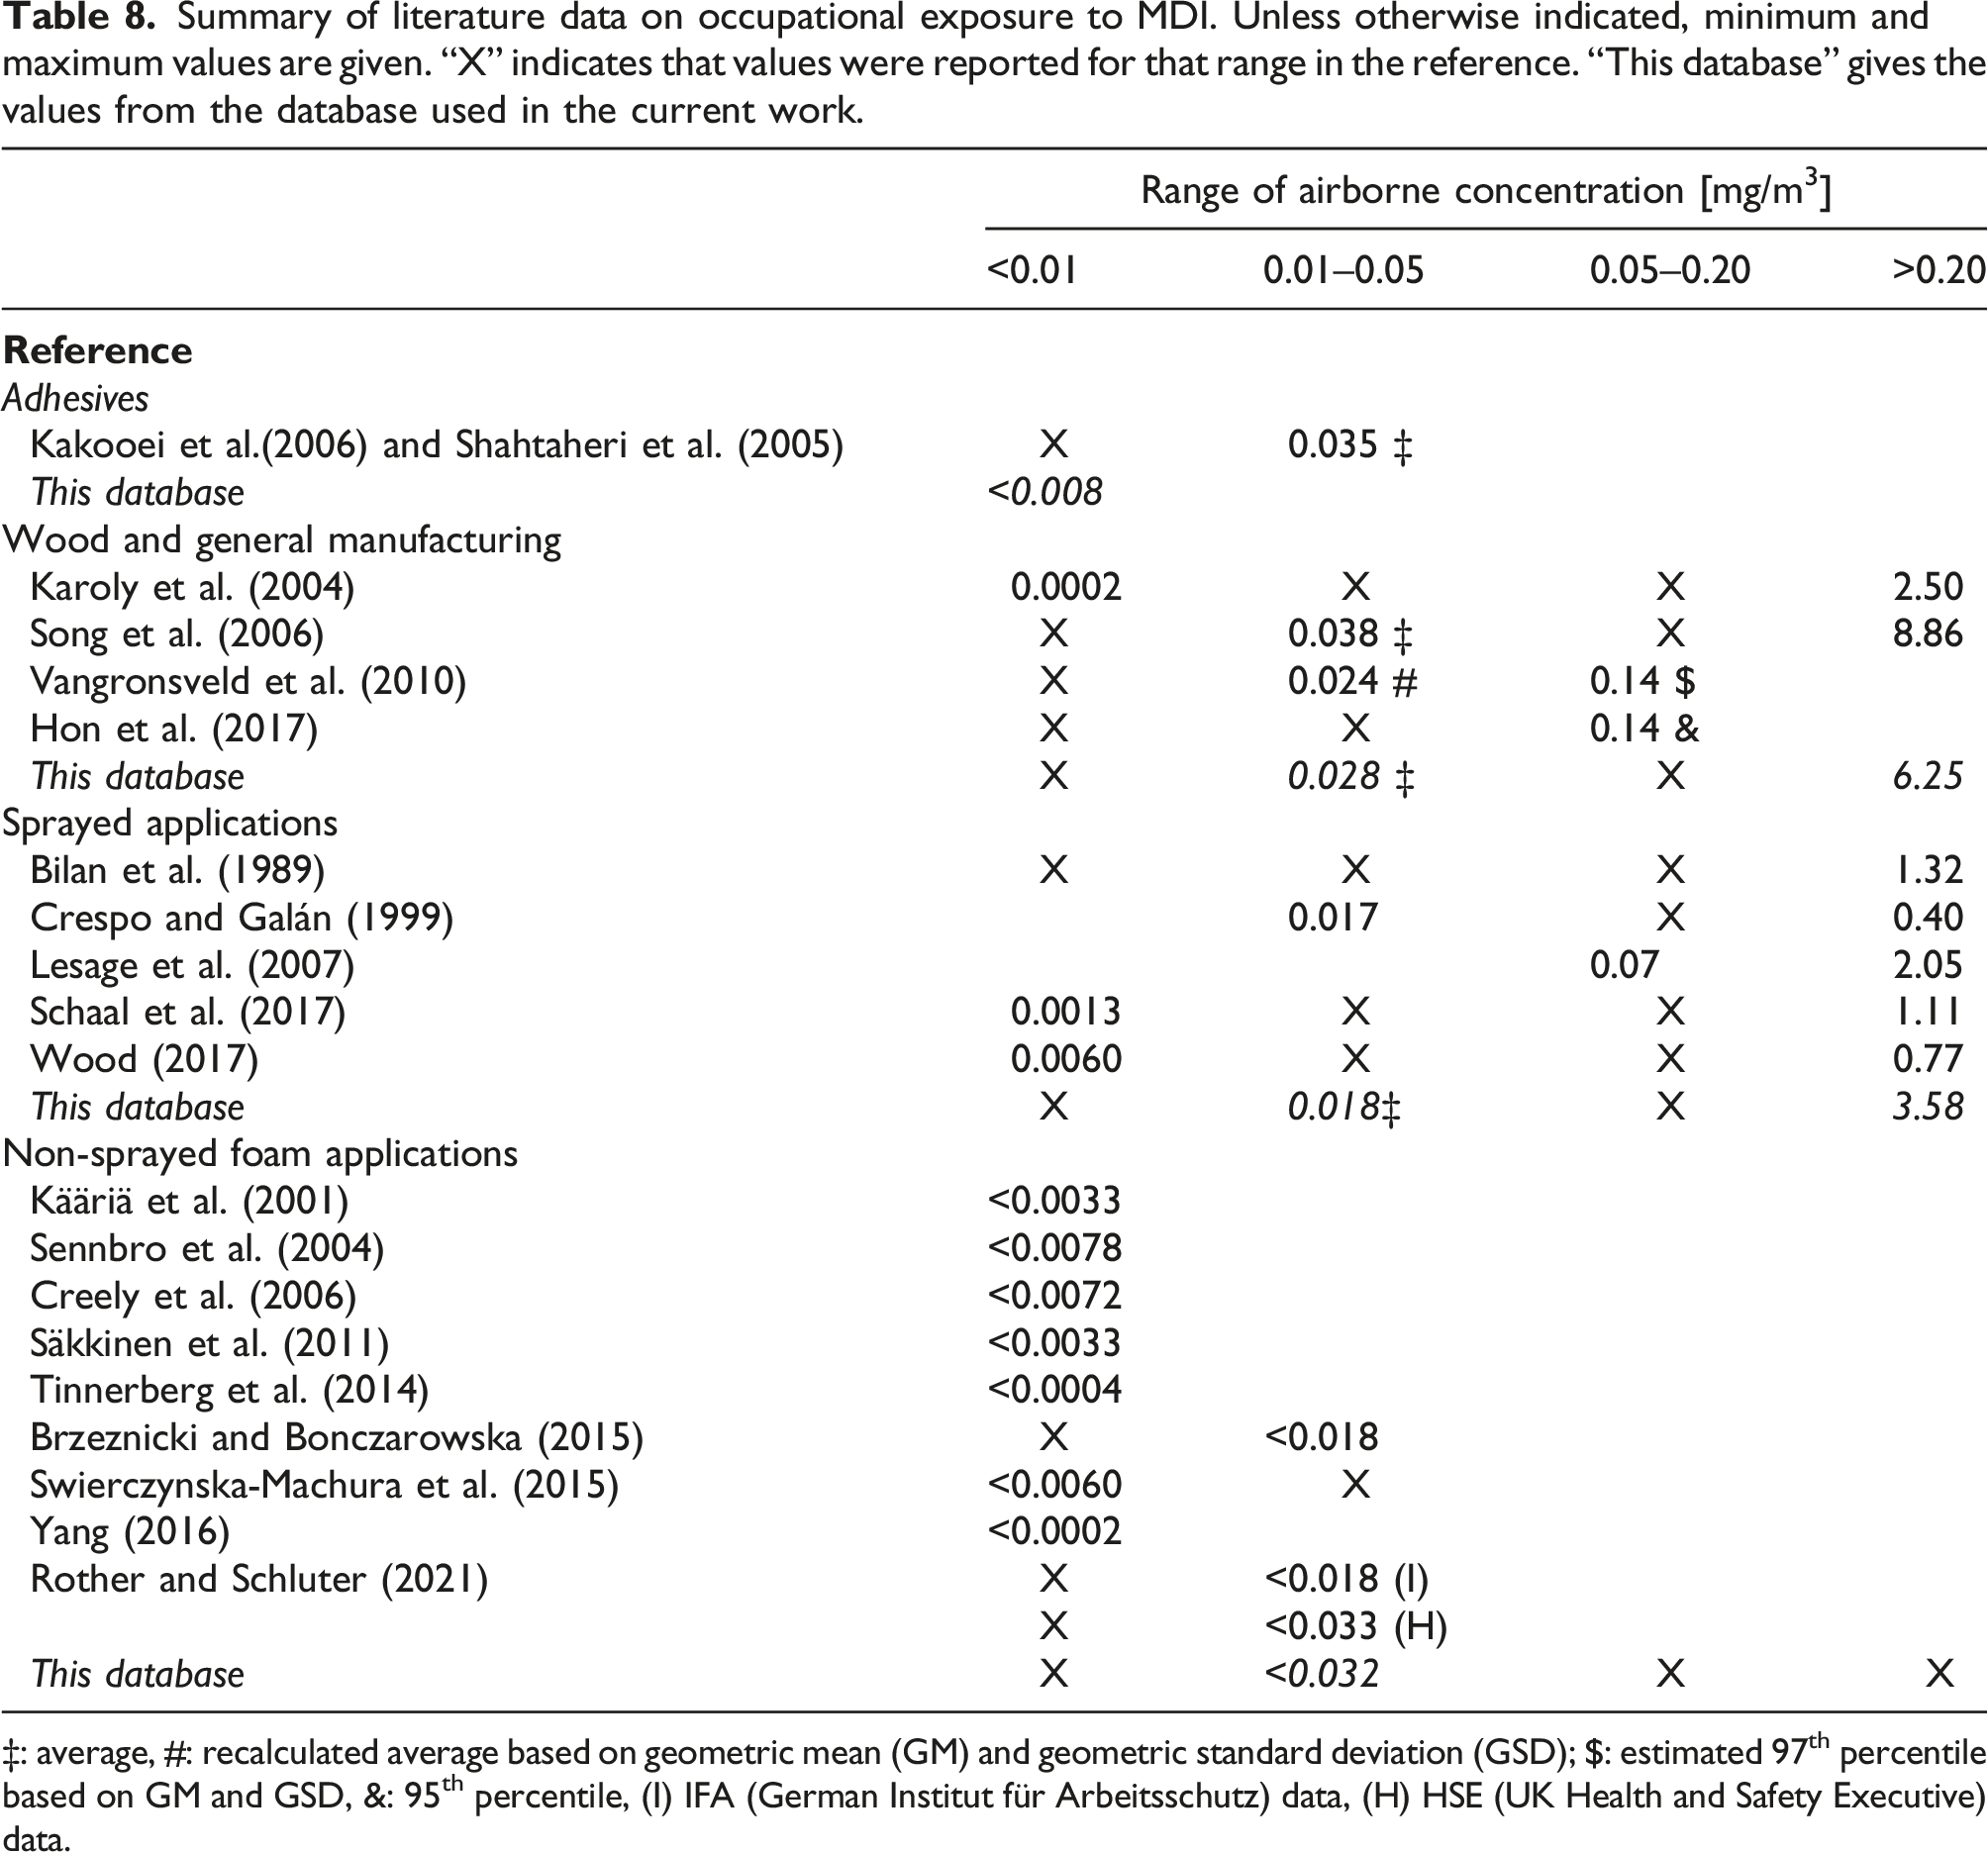
‡: average, #: recalculated average based on geometric mean (GM) and geometric standard deviation (GSD); $: estimated 97th percentile based on GM and GSD, &: 95th percentile, (I) IFA (German Institut für Arbeitsschutz) data, (H) HSE (UK Health and Safety Executive) data.
The design of this study was very similar to the recently published overview of TDI workplace concentrations by Sayles et al. (2022). Strengths and limitations were quite similar and can be summarized as follows. Strong elements were: • the large number of samples taken in combination with the use of validated sampling, and analysis techniques provided an excellent overview of airborne concentrations in the MDI-processing industry; • the evaluation of RPE usage constituted valuable information toward improving IH practices; • the analysis offered insight into exposure potential associated with plant sections and job types in the composite wood manufacturing industry.
Limitations were as follows: • The study was not a systematic exposure assessment based on randomized sampling across the industry; • analyzing potential MDI aerosols can be challenging when using filter sampling techniques; while effects could largely be attenuated, an impact on reported values cannot be totally excluded; • dermal exposure could not be investigated in this study and—given the potential presence of aerosols—should get more attention in future studies (see, e.g., Harari et al., 2022).
Conclusion
There were several key learnings of this study from an IH perspective. Because MDI has a low vapor pressure, a majority of the measured concentrations for most workplaces were below the LOQ, rendering median and GM concentrations insensitive indicators of exposure and demanding a high number of samples for a good exposure assessment. From a practical IH perspective, it was shown that the concentration of MDI oligomers correlated well with and was lower than that of the MDI monomers in 95% of the cases.
While the distributions and averages showed little evolution over time other than a reduction of large excursions, the confirmed use of RPE at concentrations >0.05 mg/m3 increased between 2011 and 2020 compared to the period prior to 2010. In particular in the composite wood industry, the awareness for, and expectation of, potentially high exposures led to a near-100% use of RPE at concentrations >0.05 mg/m3. It is worth noting that the use of RPE for personal samples was generally high in this industry sector, while improvement potential still exists for other sectors. In addition, a potential for improved engineering control of airborne MDI concentrations in the blending and forming sections of composite wood production facilities was identified. In the hierarchy of controls for workplace exposure reduction (CDC, 2015), such measures should take precedence over the use of RPE.
Finally, future IH exposure monitoring work could benefit from better documentation of RPE usage and of the type of respirator used. Together with the documentation of dermal exposure, this would enable a better assessment of overall net exposure and an improved correlation of exposure with health effects.
Supplemental Material
Supplemental Material - Methylene diphenyl diisocyanate occupational exposure data in industry (1998–2020): A descriptive summary from an industrial hygiene perspective
Supplemental Material for Methylene diphenyl diisocyanate occupational exposure data in industry (1998–2020): A descriptive summary from an industrial hygiene perspective by Mark W Spence, Patrick M Plehiers, Angel George, and Jeanne Hankett in Toxicology and Industrial Health.
Footnotes
Acknowledgments
The authors would like to acknowledge the contributions of Mark McKinney and Liz Hugel of BASF Corporation to the development of this manuscript.
Declaration of conflicting interests
Mark W Spence and Patrick M Plehiers are employed by the International Isocyanate Institute, Inc. The Institute is funded by producers of TDI and MDI. Angel George and Jeanne Hankett are employed by BASF Corporation, a producer of MDI.
Funding
The author(s) disclosed receipt of the following financial support for the research, authorship, and/or publication of this article: The work reported herein was funded by the International Isocyanate Institute, Inc. Any opinions expressed are those of the authors, not necessarily of the International Isocyanate Institute Inc. or its member companies.
Ethical approval
The work did not involve interaction with human study subjects and ethical approval was not required.
Supplemental Material
Supplemental material for this article is available online.
Notes
References
Supplementary Material
Please find the following supplemental material available below.
For Open Access articles published under a Creative Commons License, all supplemental material carries the same license as the article it is associated with.
For non-Open Access articles published, all supplemental material carries a non-exclusive license, and permission requests for re-use of supplemental material or any part of supplemental material shall be sent directly to the copyright owner as specified in the copyright notice associated with the article.