
Abstract
This article provides an overview of toluene diisocyanate (TDI) workplace air concentration data. Data were collected between 2005-2020 in workplaces across the United States, Canada, and the European Union by a number of different organizations, primarily using the sampling procedures published in OSHA Methods 42 and 5002. The data were then collated and organized by the International Isocyanate Institute. Air samples were collected from several market segments, with a large portion of the data (87%) from the flexible foam industry. The air samples (2534 in total) were categorized into “area” or “personal,” and the personal samples were subcategorized into “task,” “short term,” and “long term.” Most of the air sample concentrations (87%) were less than 5 ppb. However, the presence of airborne TDI greater than 5 ppb indicated the importance of respiratory protection in some situations; therefore, respirator use patterns were studied and summarized. Additionally, this article provides a summary of air sample concentrations at different flexible foam manufacturing job roles. The information on air sampling concentrations and respiratory protection during TDI applications collected in this paper could be useful for product stewardship and industrial hygiene purposes in the industries studied.
Keywords
Introduction
Toluene diisocyanate (TDI) is typically produced as a mixture of two isomers: 80% 2,4-TDI and 20% 2,6-TDI. There are other formulations on the market, such as 65% 2,4-TDI/35% 2,6-TDI. TDI is used as a monomer; its isocyanate groups react with various alcohols containing multiple hydroxyl groups (“polyols”) to make polyurethane polymers. The major end-use applications for polyurethane polymers are flexible foams, coatings, adhesives, sealants, elastomers, and binders (CPI, 2019). In adhesive and sealant applications, the diisocyanate monomer used is often what is called a “TDI prepolymer.” A prepolymer is made by reacting a sub-stoichiometric amount of TDI with a polyol to produce a higher molecular weight, lower vapor pressure diisocyanate. TDI prepolymers typically contain less than 1% residual TDI.
This paper summarizes TDI concentration data from industry air sampling obtained in workplaces across the United States, Canada, and the European Union from the years 2005 to 2020. The dataset was compiled by the International Isocyanate Institute. As shown in Figure 1, the TDI dataset was grouped into eight different polyurethane (PU) application types. Since most data (87%) were collected in “flexible foam” manufacturing, this category was explored in greater detail in this paper. Flexible foam data were collected in facilities that produce “slab stock” foam and “molded” foam. Slab stock foam is primarily used to make furniture cushions and bed mattresses. In 2018, 428.7 million pounds of TDI were used in the North American slab stock foam market. Molded polyurethane foam applications, primarily bed pillows and transportation seating, consumed 142.3 million pounds of TDI in the 2018 North American market. Approximately 40 million pounds of molded polyurethane foam was used in passenger vehicles in North America (CPI, 2019). Summary of TDI data by TDI application.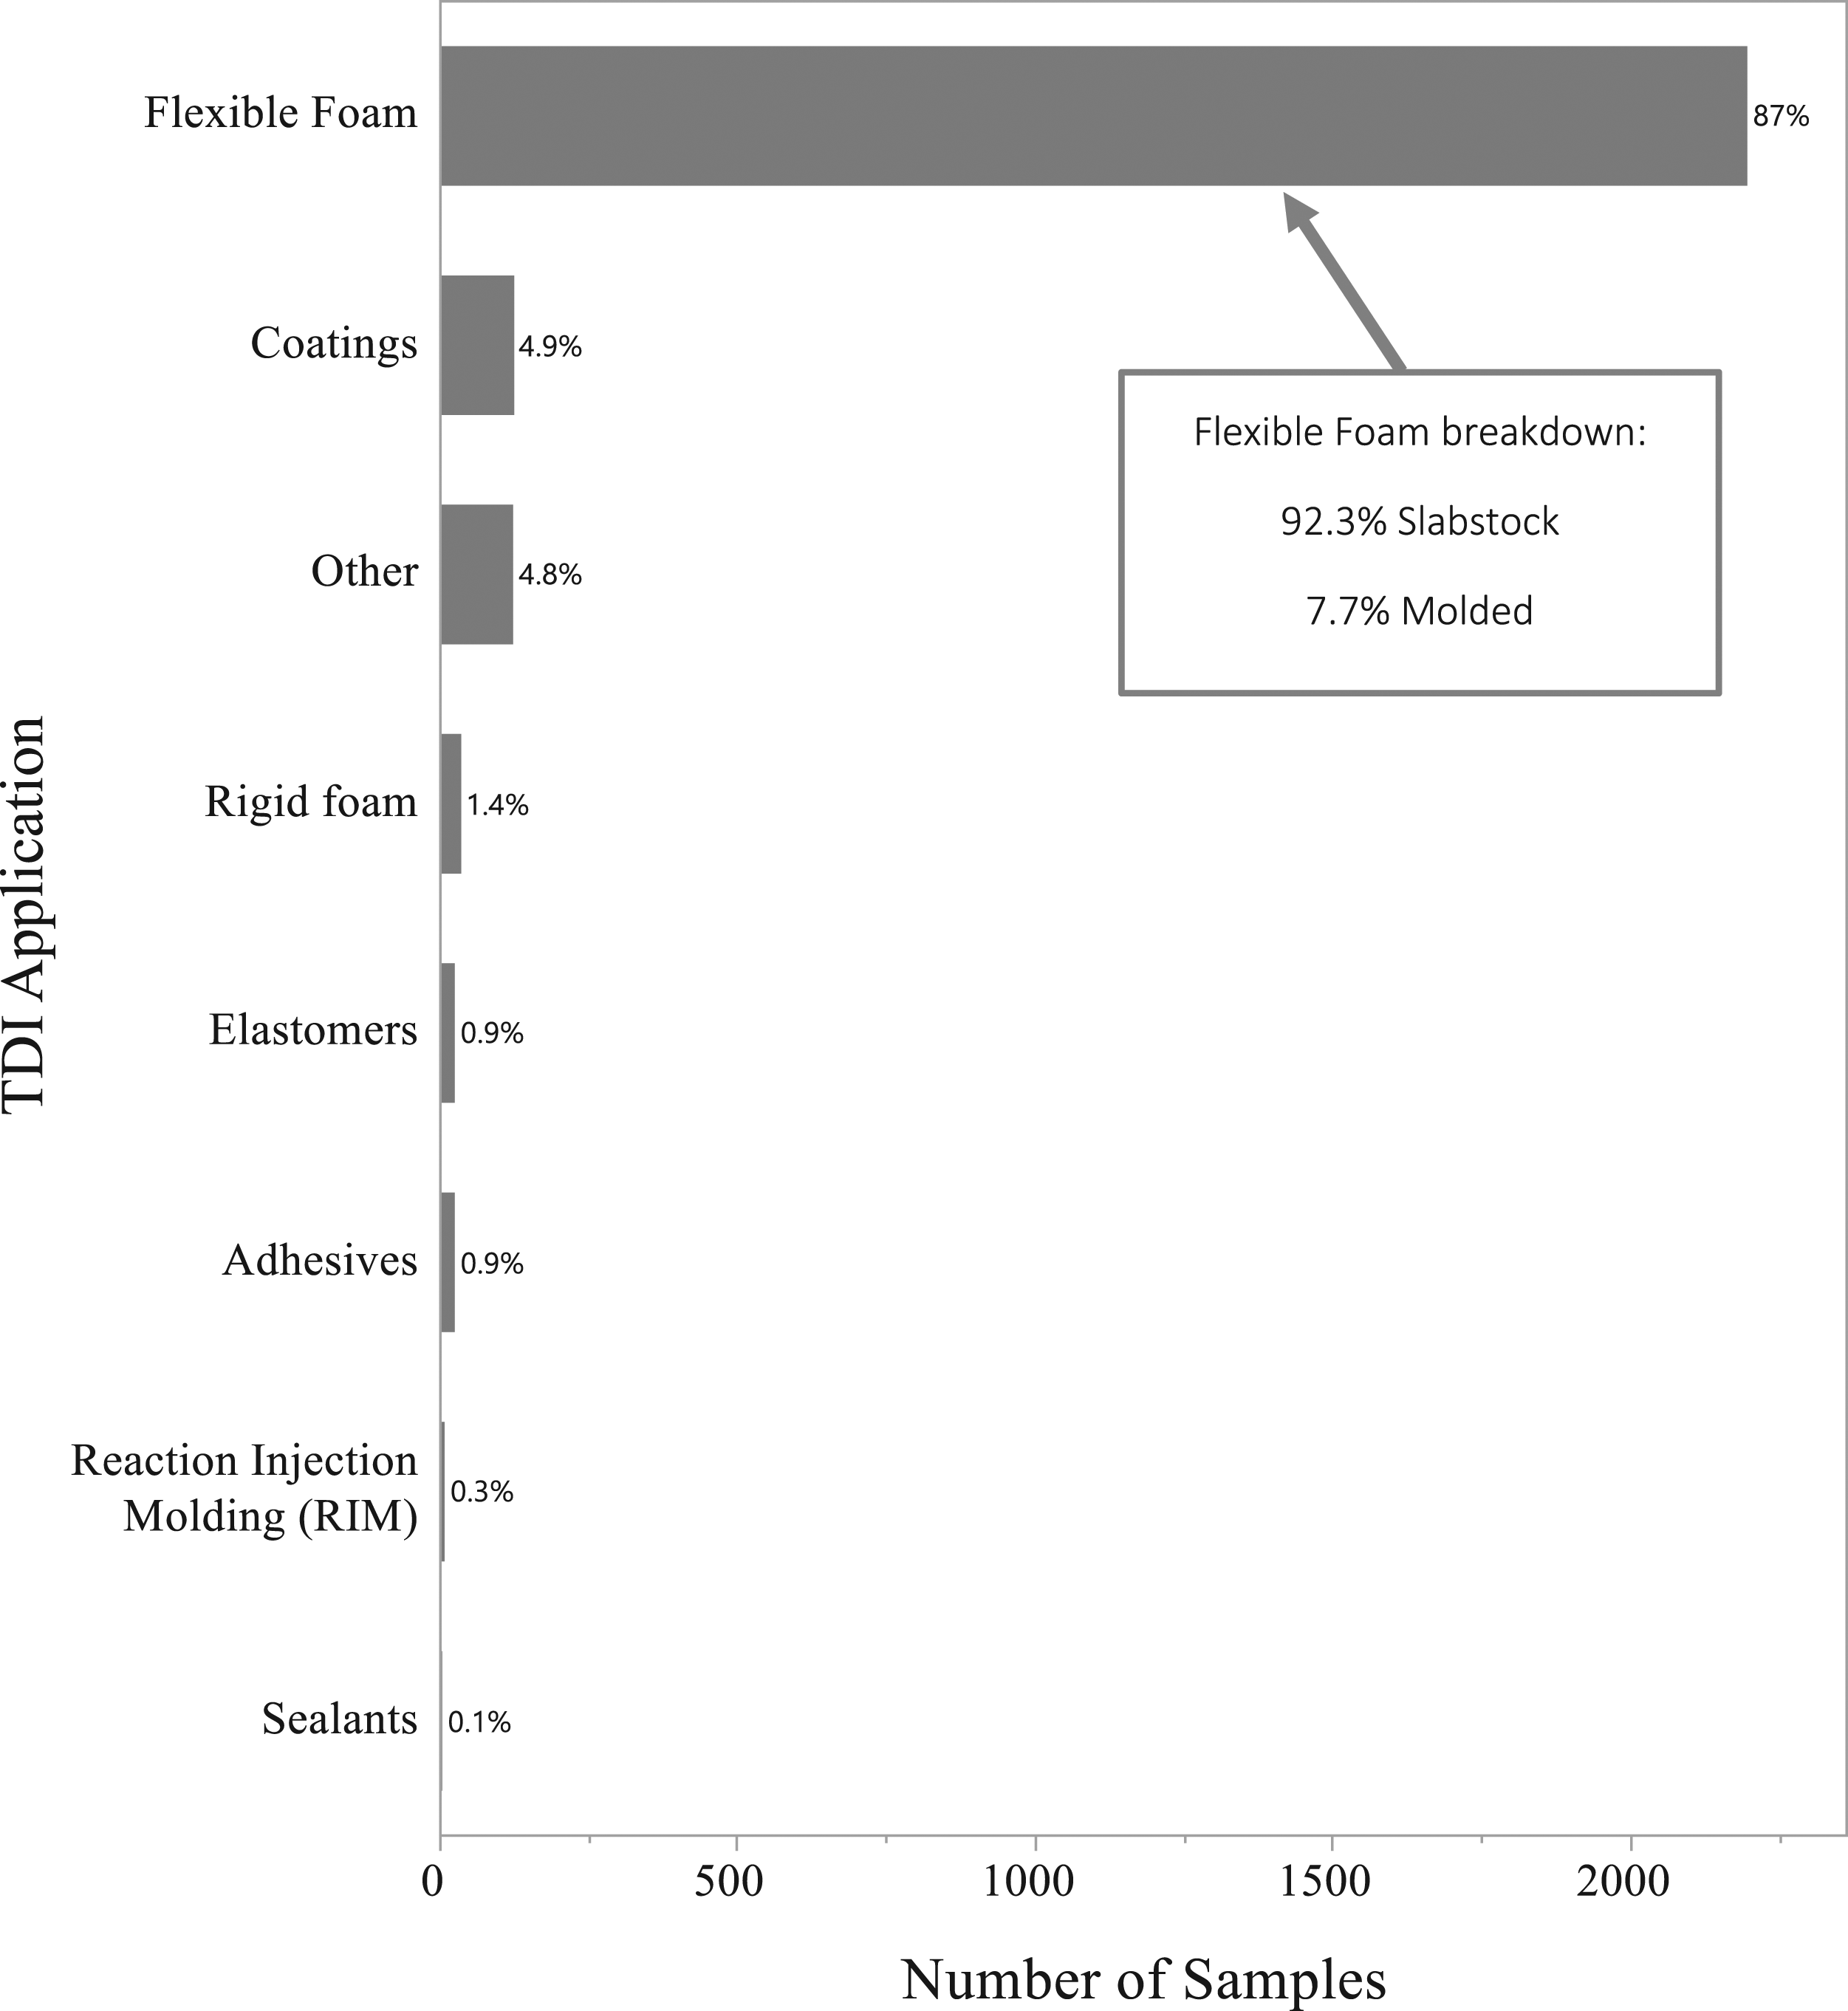
Occupational exposure limits (OELs) for TDI vary by jurisdiction. The U.S. Occupational Safety and Health Administration (OSHA) has established a permissible exposure limit for TDI of 20 ppb (v/v) as a ceiling concentration. Since 2016, the American Conference of Governmental Industrial Hygienists (ACGIH®) recommends an 8-hour threshold limit value - time weighted average (TLV®-TWA8) exposure limit of 1 ppb, and a Short Term Exposure Limit (STEL) of 5 ppb (ACGIH, 2016). Prior to that time, the ACGIH® recommended a TLV®-TWA8 of 5 ppb and a STEL of 20 ppb. In Europe, the occupational exposure limits/guidelines are currently determined country-by-country; most TWA8 values for MDI and TDI are between 2 and 10 ppb and the median level for a national OEL is 5 ppb. Given that exposure limits vary for TDI, it is important to investigate the airborne concentrations in groupings around these limits, and also to evaluate the use of respiratory protection.
Adverse health-effects associated with over-exposure to TDI have been well studied, the predominant being irritation of the skin, mucous membranes and respiratory tract. The National Institute for Occupational Safety and Health (NIOSH) considers the 2,4-TDI isomer to be a potential occupational carcinogen as defined by the OSHA carcinogen policy (CDC, 1994). However, this categorization has been challenged since it is based on a single study by the oral route of exposure (Prueitt et al., 2013). Some workers may become sensitized to TDI, resulting in symptoms of asthma, such as wheezing and shortness of breath upon re-exposure, even to concentrations at or below current OELs. It should be noted that, although cases of diisocyanate work-related asthma have been decreasing in recent years (CDC, 2021; Reilly et al., 2020), exposure considerations are still important. Factors that likely contributed to the reduction in asthma cases could include improved engineering controls (ventilation), good work practices, training, medical surveillance, and product stewardship. Brief excessive exposures (i.e., peak exposures) may be better correlated with manifestation of isocyanate-induced occupational asthma rather than repeated low exposures over time (Plehiers et al., 2020a; 2020b). Prevention of dermal contact is also an important aspect of exposure control since dermal contact has also been implicated in the induction of sensitization in animal models (Bello et al., 2007).
This manuscript was developed to: (1) assess airborne TDI sample concentrations measured in a variety of operations; (2) identify work areas, tasks, and operations where further assessments could be useful to reduce the potential for exposure to airborne TDI; (3) evaluate the use of respirators where air sampling has been performed; and (4) provide information on future product stewardship needs for TDI users with regard to workplace exposures, engineering controls, and respirator use.
Methods
Data description
Samples were collected by skilled professionals. Most samples (98%, or 2488 out of 2534) were collected using glass fiber filters coated with 1-(2-pyridyl) piperazine; these samples were analyzed by accredited laboratories that reference OSHA methods. The remaining 46 samples (2%) in this study were collected using direct reading instruments.
When airborne TDI is drawn through the coated glass fiber filter, it is converted to a stable urea derivative, which is quantitatively analyzed by High Performance Liquid Chromatography using OSHA Methods 42 and 5002, or similar. The OSHA methods for TDI are fully validated. Validation parameters and additional details are provided in Appendix C of OSHA Method 5002 (OSHA, 2021). It should be noted that in the applications sampled, airborne TDI would be expected to be present in vapor form. Even if aerosols were present, the filter methods have been shown to work well for trapping isocyanate aerosol particles as well (Hext et al., 2003). No spray applications were evaluated in this dataset.
For the purposes of this study, the limit of quantification (LOQ) refers to the lowest concentration of monomeric TDI quantifiable, as reported by the laboratory analyzing the samples. The quantifiable concentration in an air sample depends not only on the instrumental limit of quantification in the analyzing laboratory (which is generally in the range of 0.1–1 µg/sample), but also on the volume of air collected. In this dataset, LOQs ranged from 0.026 to 2.34 ppb. For samples reported as “non-detect” (ND), the actual concentration of TDI could range from zero to the limit of quantification. When “non-detect” samples were included in the statistical analyses, a concentration equal to half of the reported limit of quantification (ppb) was used. If reported separately, results for both isomers of TDI were summed and the total TDI concentration was used. A summary of the distribution of LOQ values for ND samples is presented in Supplemental File – 1, which shows that misclassification of samples related to high LOQ would have been a rare occurrence, not affecting the main conclusions of this study.
The sample concentration data were grouped into two sample types: area and personal samples. Detailed descriptions of each sample type are given below.
Area Samples: air samples placed in a specific, fixed workplace location. Such samples are used to help characterize employee exposure by identifying locations where potential exposure to a chemical can occur. Area samples can also reveal the effectiveness of engineering controls.
Personal samples: air samples collected in the breathing zone of a worker (near the collar or chest area). Personal samples are used in conducting an exposure assessment for an individual or job role category. In making the assessment, knowledge of work patterns and tasks conducted by the individual during the sampling is useful. Personal samples can be obtained over minutes or hours timeframes. Sometimes several sequential samples are taken on the same individual and an exposure value is calculated as a time-weighted average of the samples. In this study, there were three types of personal samples: • Task: personal air samples collected in the breathing zone of a worker while performing a specific work task. Typically, sample time is relatively short (15–35 minutes). The resulting concentrations are often compared to a Ceiling (C) or STEL OEL value. • Short-term: personal air samples with sampling times less than or equal to 4 hours (240 minutes) for which a specific work task was not identified. • Long-term: personal air samples with sampling times greater than 4 hours (240 minutes). As noted above, these samples may stand alone, or may be combined with multiple sequential long and/or short-term samples to calculate a time weighted average concentration for the overall sampling period.
The authors evaluated TDI concentration data and summarized the use of respiratory protection for personal samples. The type of respirator used during data collection was not analyzed since that information was not systematically collected within the purpose of this work.
Data processing
Data analysis and calculations were conducted using the JMP® statistics software package (SAS, Cary, NC, USA). Tables in the report were generated using the subset, summary, and tabulate tools in the software package. The graph builder tool was used to generate the figures. The data were analyzed in several groupings: (1) overall analysis of data by geographical region and sample type, (2) analysis by PU product type, (3) analysis of flexible foam PU product type, and (4) analysis by job role for samples in the flexible foam application. The sample concentration data were broken down into 5 concentration categories: 0–1 ppb, 1–5 ppb, 5–10 ppb, 10–20 ppb, and >20 ppb, which were chosen in reference to occupational exposure limits and the potential need for respiratory protection. In addition, the median, arithmetic mean (average), geometric mean (GM), standard deviation (SD), and the geometric standard deviation (GSD) of the concentration data were calculated. While the median and/or the GM provide an indication of the most common exposure level, the arithmetic mean (average) provides better insight into cumulative and peak exposures.
Results
The data analyzed in this paper were collected from the years 2005 through 2020, with a total of 2534 air samples collected from several PU applications. While the authors reviewed the data for trends over time, a limitation of the data in this study is that they were collected for product stewardship purposes by industrial hygienists from several TDI-producing companies. As such, no industry-wide random sampling was conducted, nor was there a description of the scope or purpose for each sampling campaign. The samples were likely taken for a variety of purposes ranging from periodic routine spot checks to assessment of specific problems or improvements, and therefore cannot be assumed to represent a homogenous industry-wide view over time. It is likely that the data were collected under scenarios that tend toward higher exposure, for instance, as a result of the manufacturer producing products with the highest expected TDI concentrations, specifically for the monitoring event, or to ensure compliance in any other scenarios.
Summary of dataset by geographical region and sample type
TDI exposure data by region and sample type.
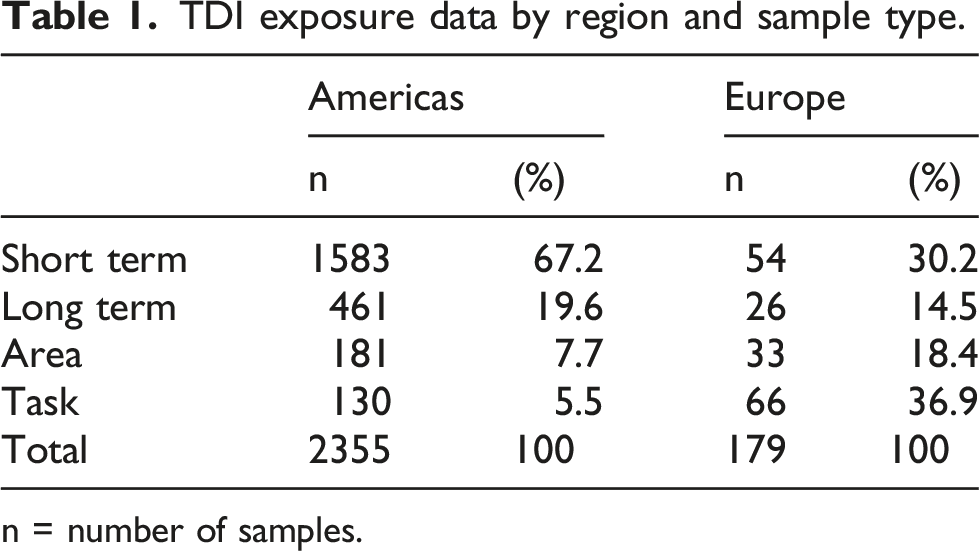
n = number of samples.
Overview by sample type and concentration
Distribution (as % of total number of samples) and summary statistics of airborne TDI concentration by sample type across all applications.
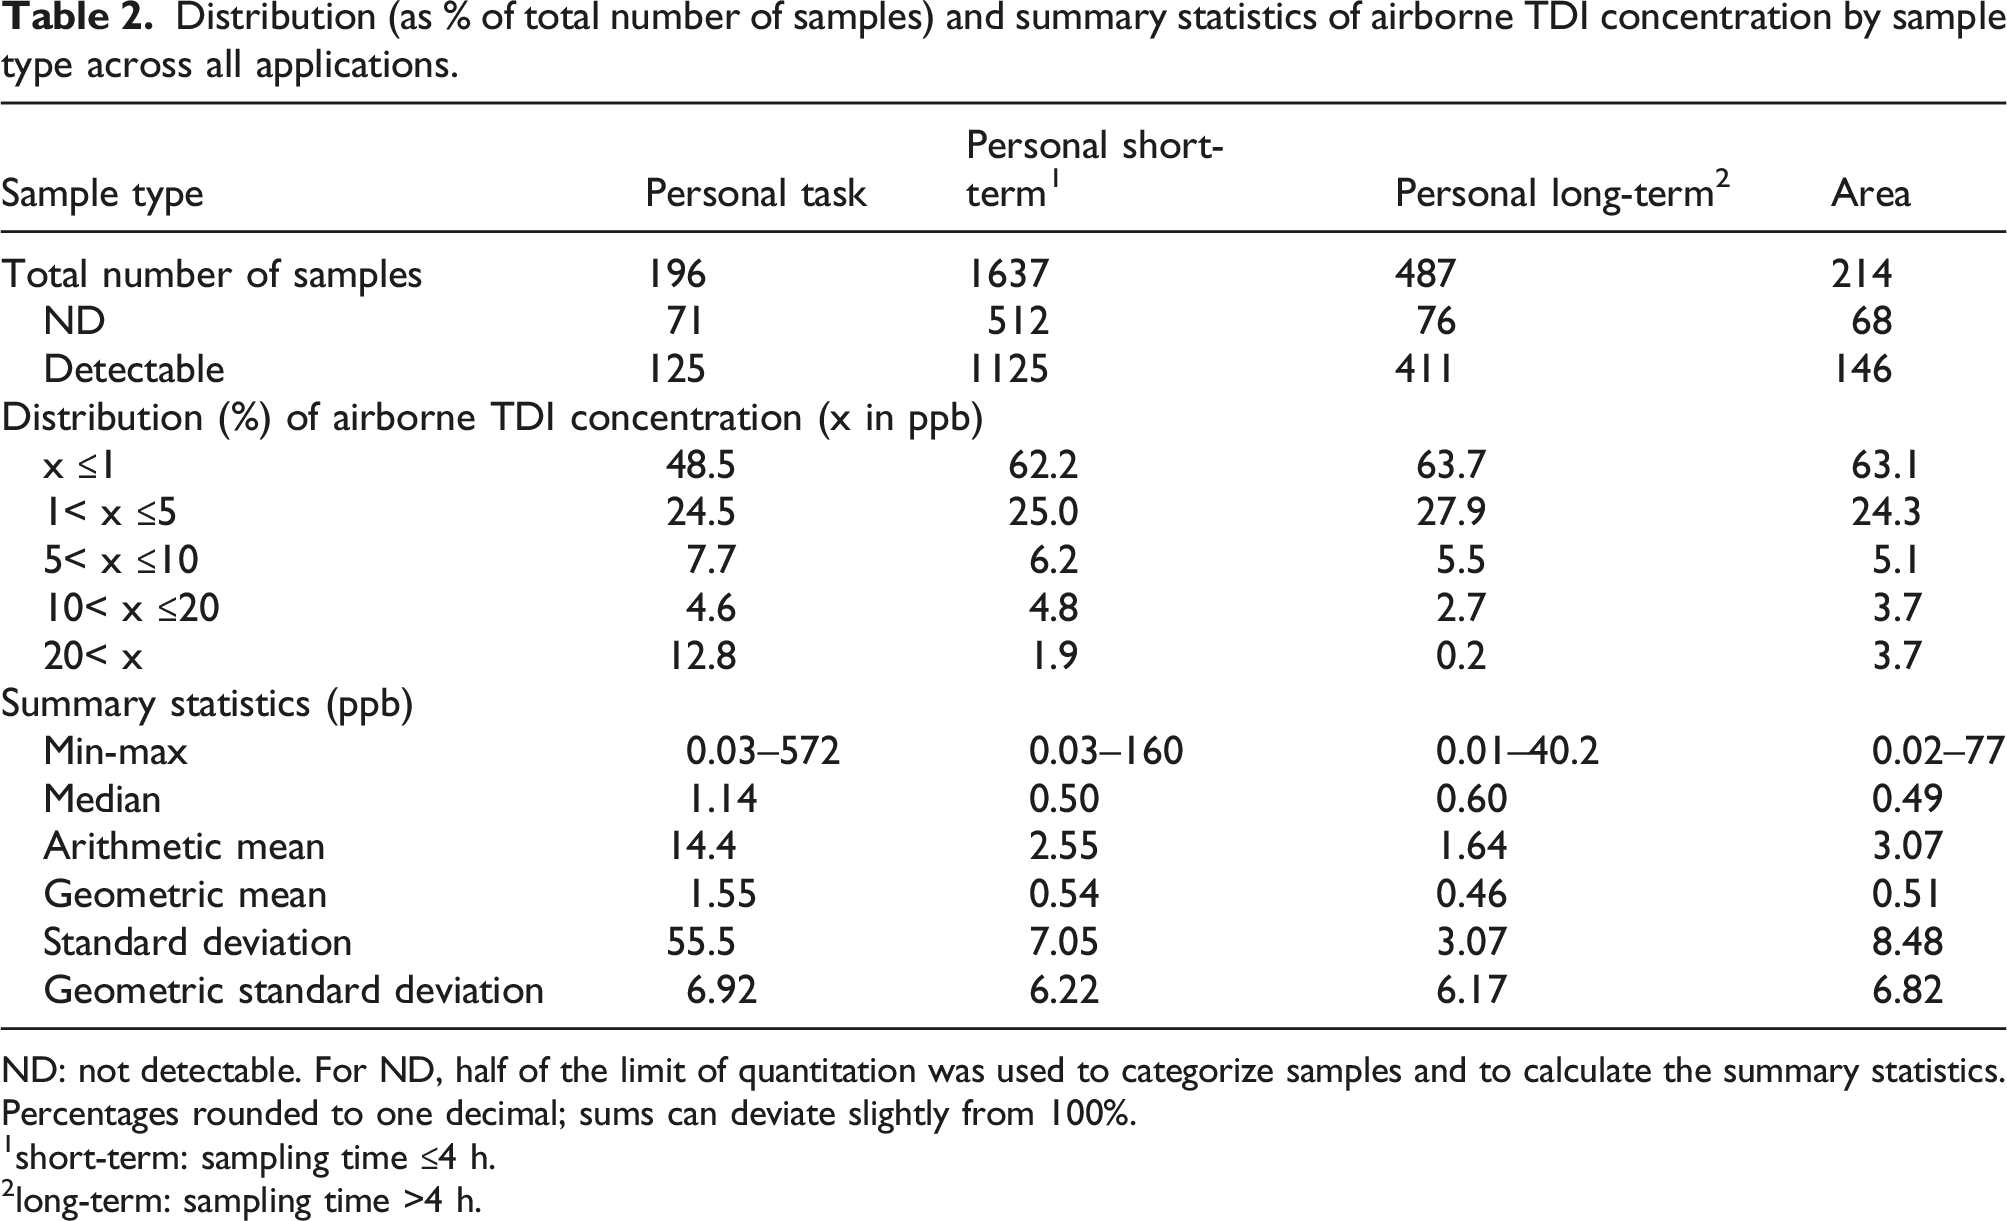
ND: not detectable. For ND, half of the limit of quantitation was used to categorize samples and to calculate the summary statistics.
Percentages rounded to one decimal; sums can deviate slightly from 100%.
1short-term: sampling time ≤4 h.
2long-term: sampling time >4 h.
However, the task-based samples had an average of 14 ppb, which noticeably deviated from the other sample types. The difference in the average compared to the median for task samples shows the importance of looking at both measures to ensure that peak exposures are accounted for when evaluating these types of data. Table 2 shows that concentrations were higher for the shorter samples (task), and generally trended lower as sample time increases. This trend indicates that analysis of peak exposures should be performed using personal task samples. The presence of high (i.e., “peak”), exposures in samples measured for longer sample periods (e.g. short term and long term) is not readily apparent because of the use of time weighted averages.
A limited number of data points were key in increasing the average in the task sample category. The higher average for the task sample category may be indicative of activities with potential “high” exposures of which workers were aware and therefore, protective equipment was often used. Eleven data points were greater than 50 ppb; 9 of those samples were collected for less than 30 minutes, and 10 were collected in flexible foam operations. Details on each of the 11 samples with potential “high” exposures are presented as follows: • Two of the eleven samples were collected in a storage tank area when a worker was making/breaking connections and performing unloading tasks. It was noted in the sampling details that a leak was discovered during the unloading activities, which led to the high TDI concentrations. Full protective gear, including respiratory protection, was worn during this upset condition. • Three of the eleven samples were collected during TDI filter change out tasks. This task requires the opening of a TDI supply line and is one where full protective gear is typically used. In these three cases, the workers were wearing respiratory protection. • One sample was collected during a simulated application of a sports track. A sports track is a surface that is installed on top of asphalt or other foundation, often used for track and field activities. This simulation was done in a laboratory and involved work close to the track surface while the material was hot. • The five remaining samples in this group were collected during activities related to slab stock foam production, including disconnecting chemical supply lines at the pour platform, cleaning the foam trough, and performing tasks inside the foam line tunnel while foam was being produced.
The tasks that resulted in these high concentrations present work scenarios where risk for peak exposures is high. They could be a focal point for future sampling and exposure control considerations.
Overview by PU product type
Distribution (as % of total number of samples) of airborne TDI concentration by sample type for applications other than flexible foam.
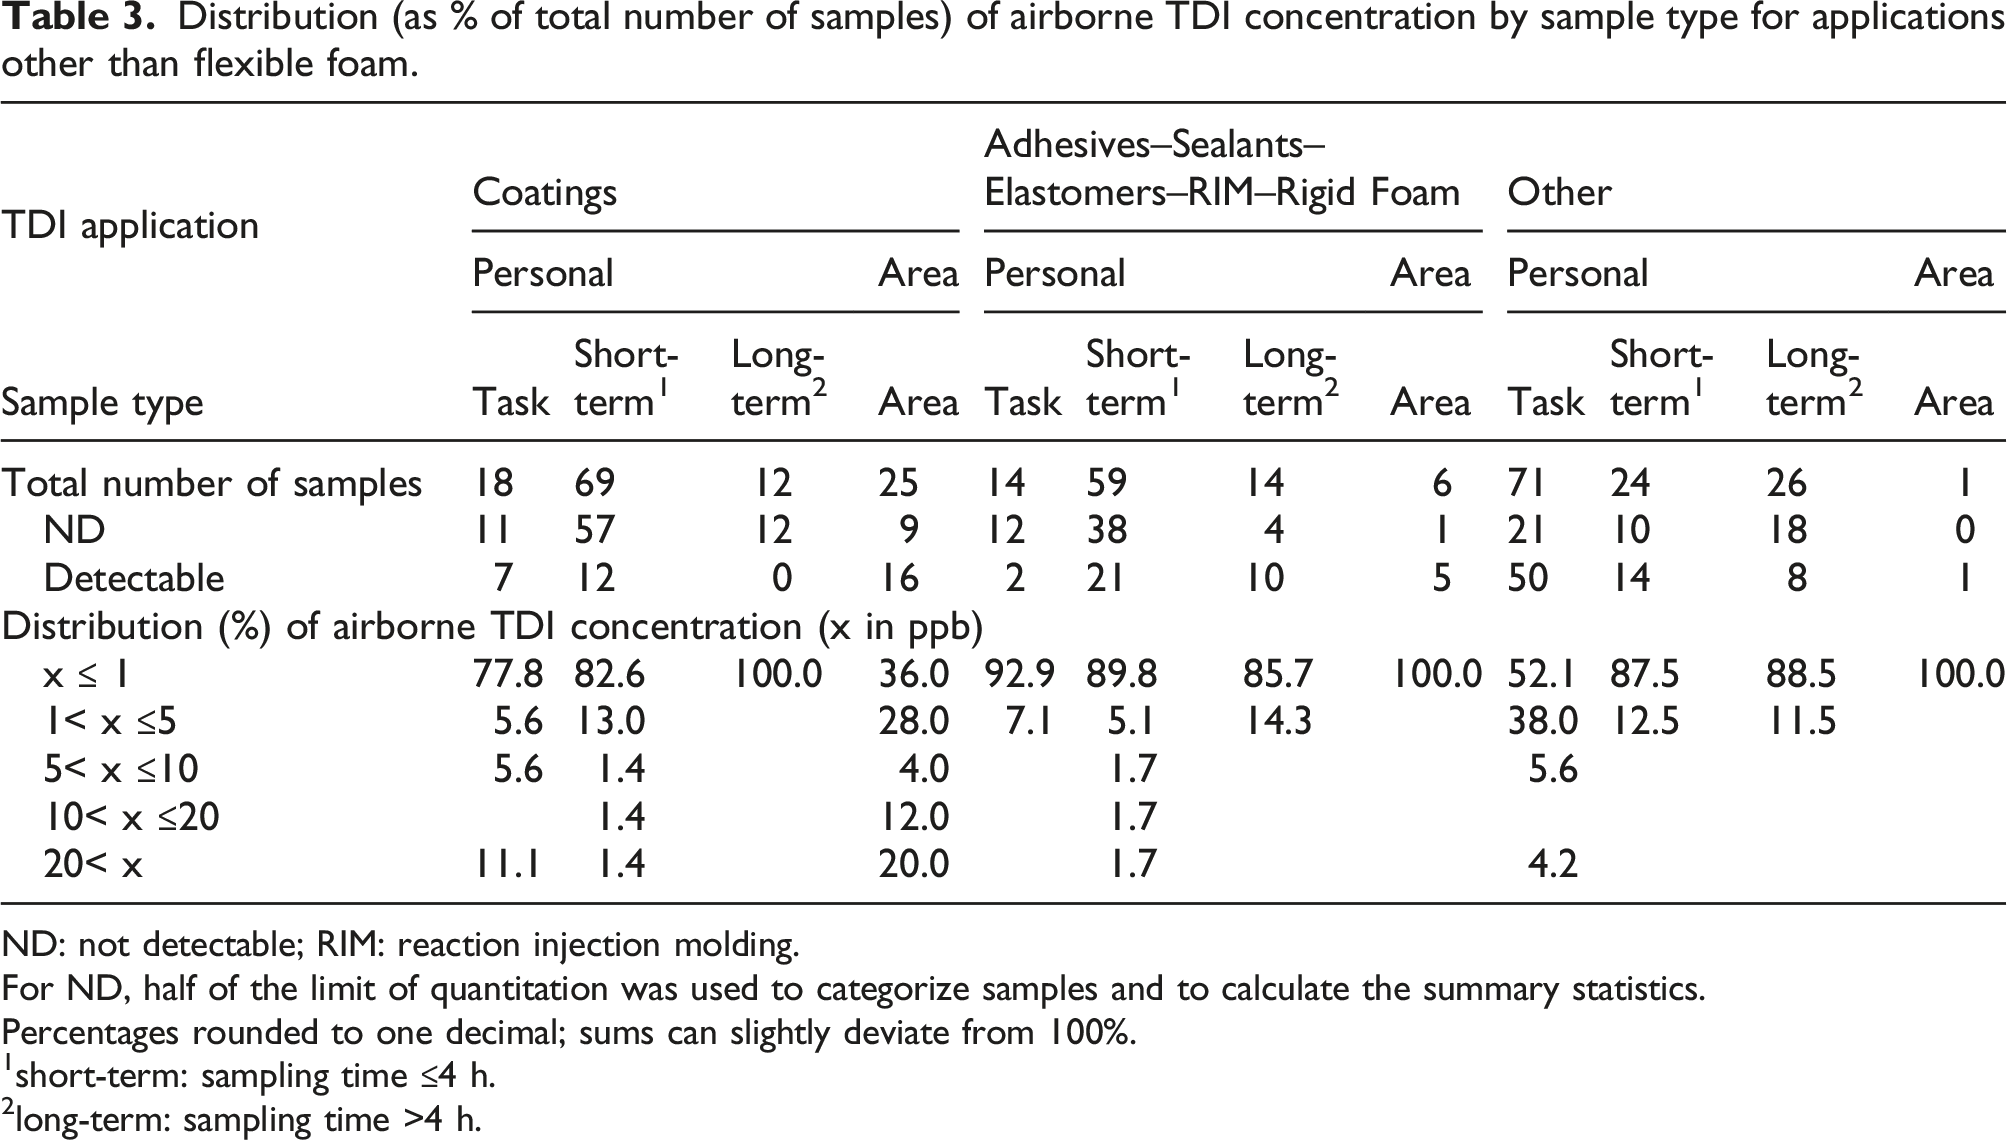
ND: not detectable; RIM: reaction injection molding.
For ND, half of the limit of quantitation was used to categorize samples and to calculate the summary statistics.
Percentages rounded to one decimal; sums can slightly deviate from 100%.
1short-term: sampling time ≤4 h.
2long-term: sampling time >4 h.
Distribution (as % of total number of samples) and summary statistics of airborne TDI concentration by sample type for flexible foam applications.
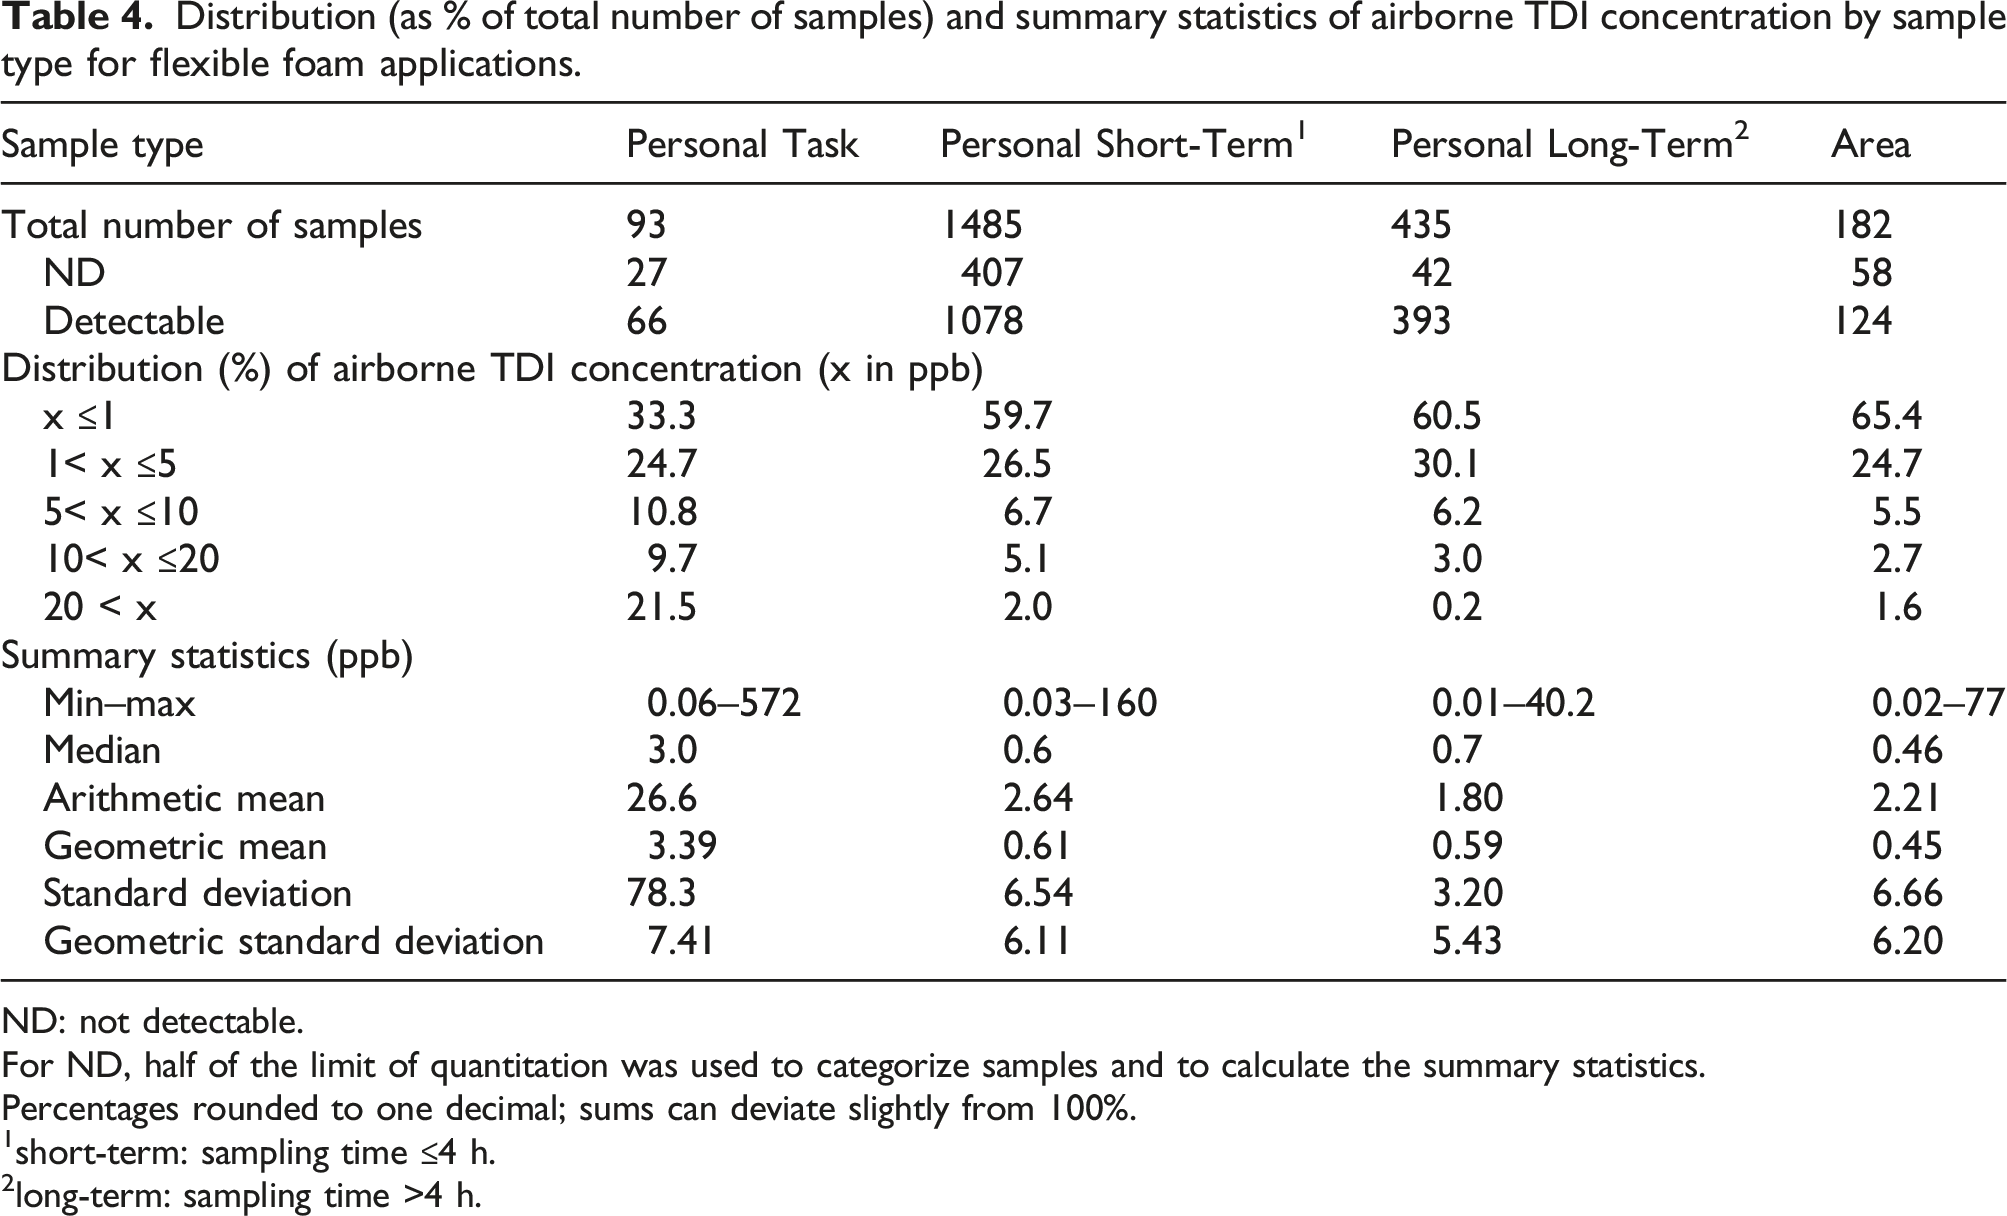
ND: not detectable.
For ND, half of the limit of quantitation was used to categorize samples and to calculate the summary statistics.
Percentages rounded to one decimal; sums can deviate slightly from 100%.
1short-term: sampling time ≤4 h.
2long-term: sampling time >4 h.
Distribution (as % of total number of samples) of airborne TDI concentrations for short-term (≤4 h) personal samples and frequency of confirmed use of respiratory protective equipment (as % of samples in the respective concentration range) for various job roles in the flexible foam application.
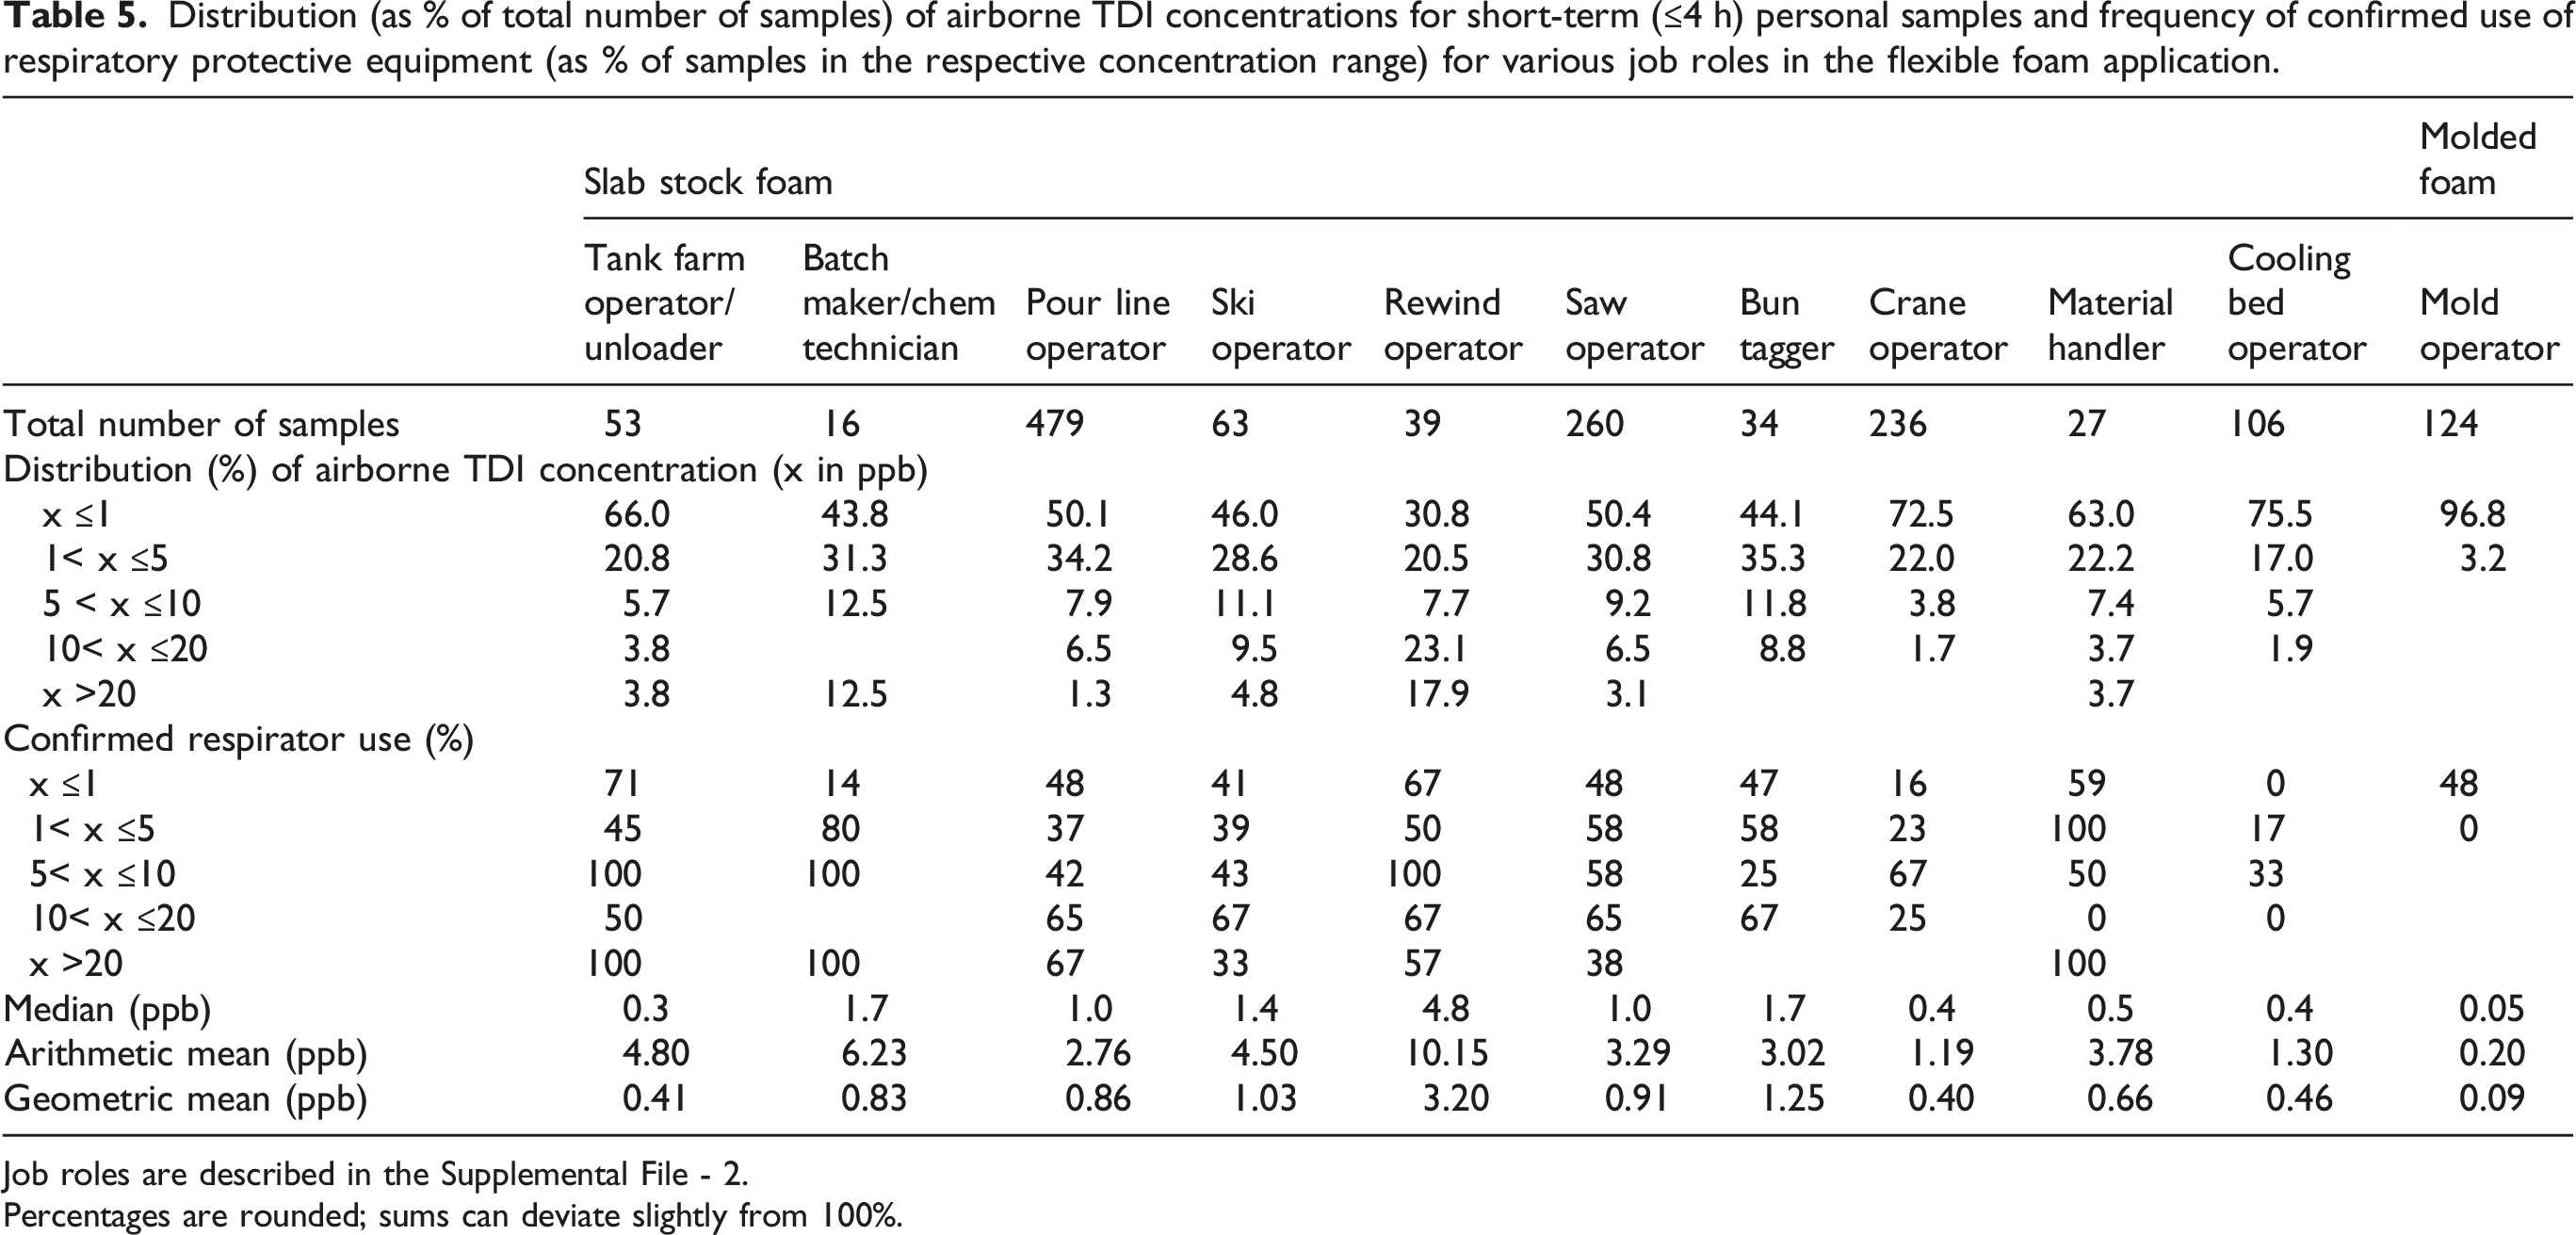
Job roles are described in the Supplemental File - 2.
Percentages are rounded; sums can deviate slightly from 100%.
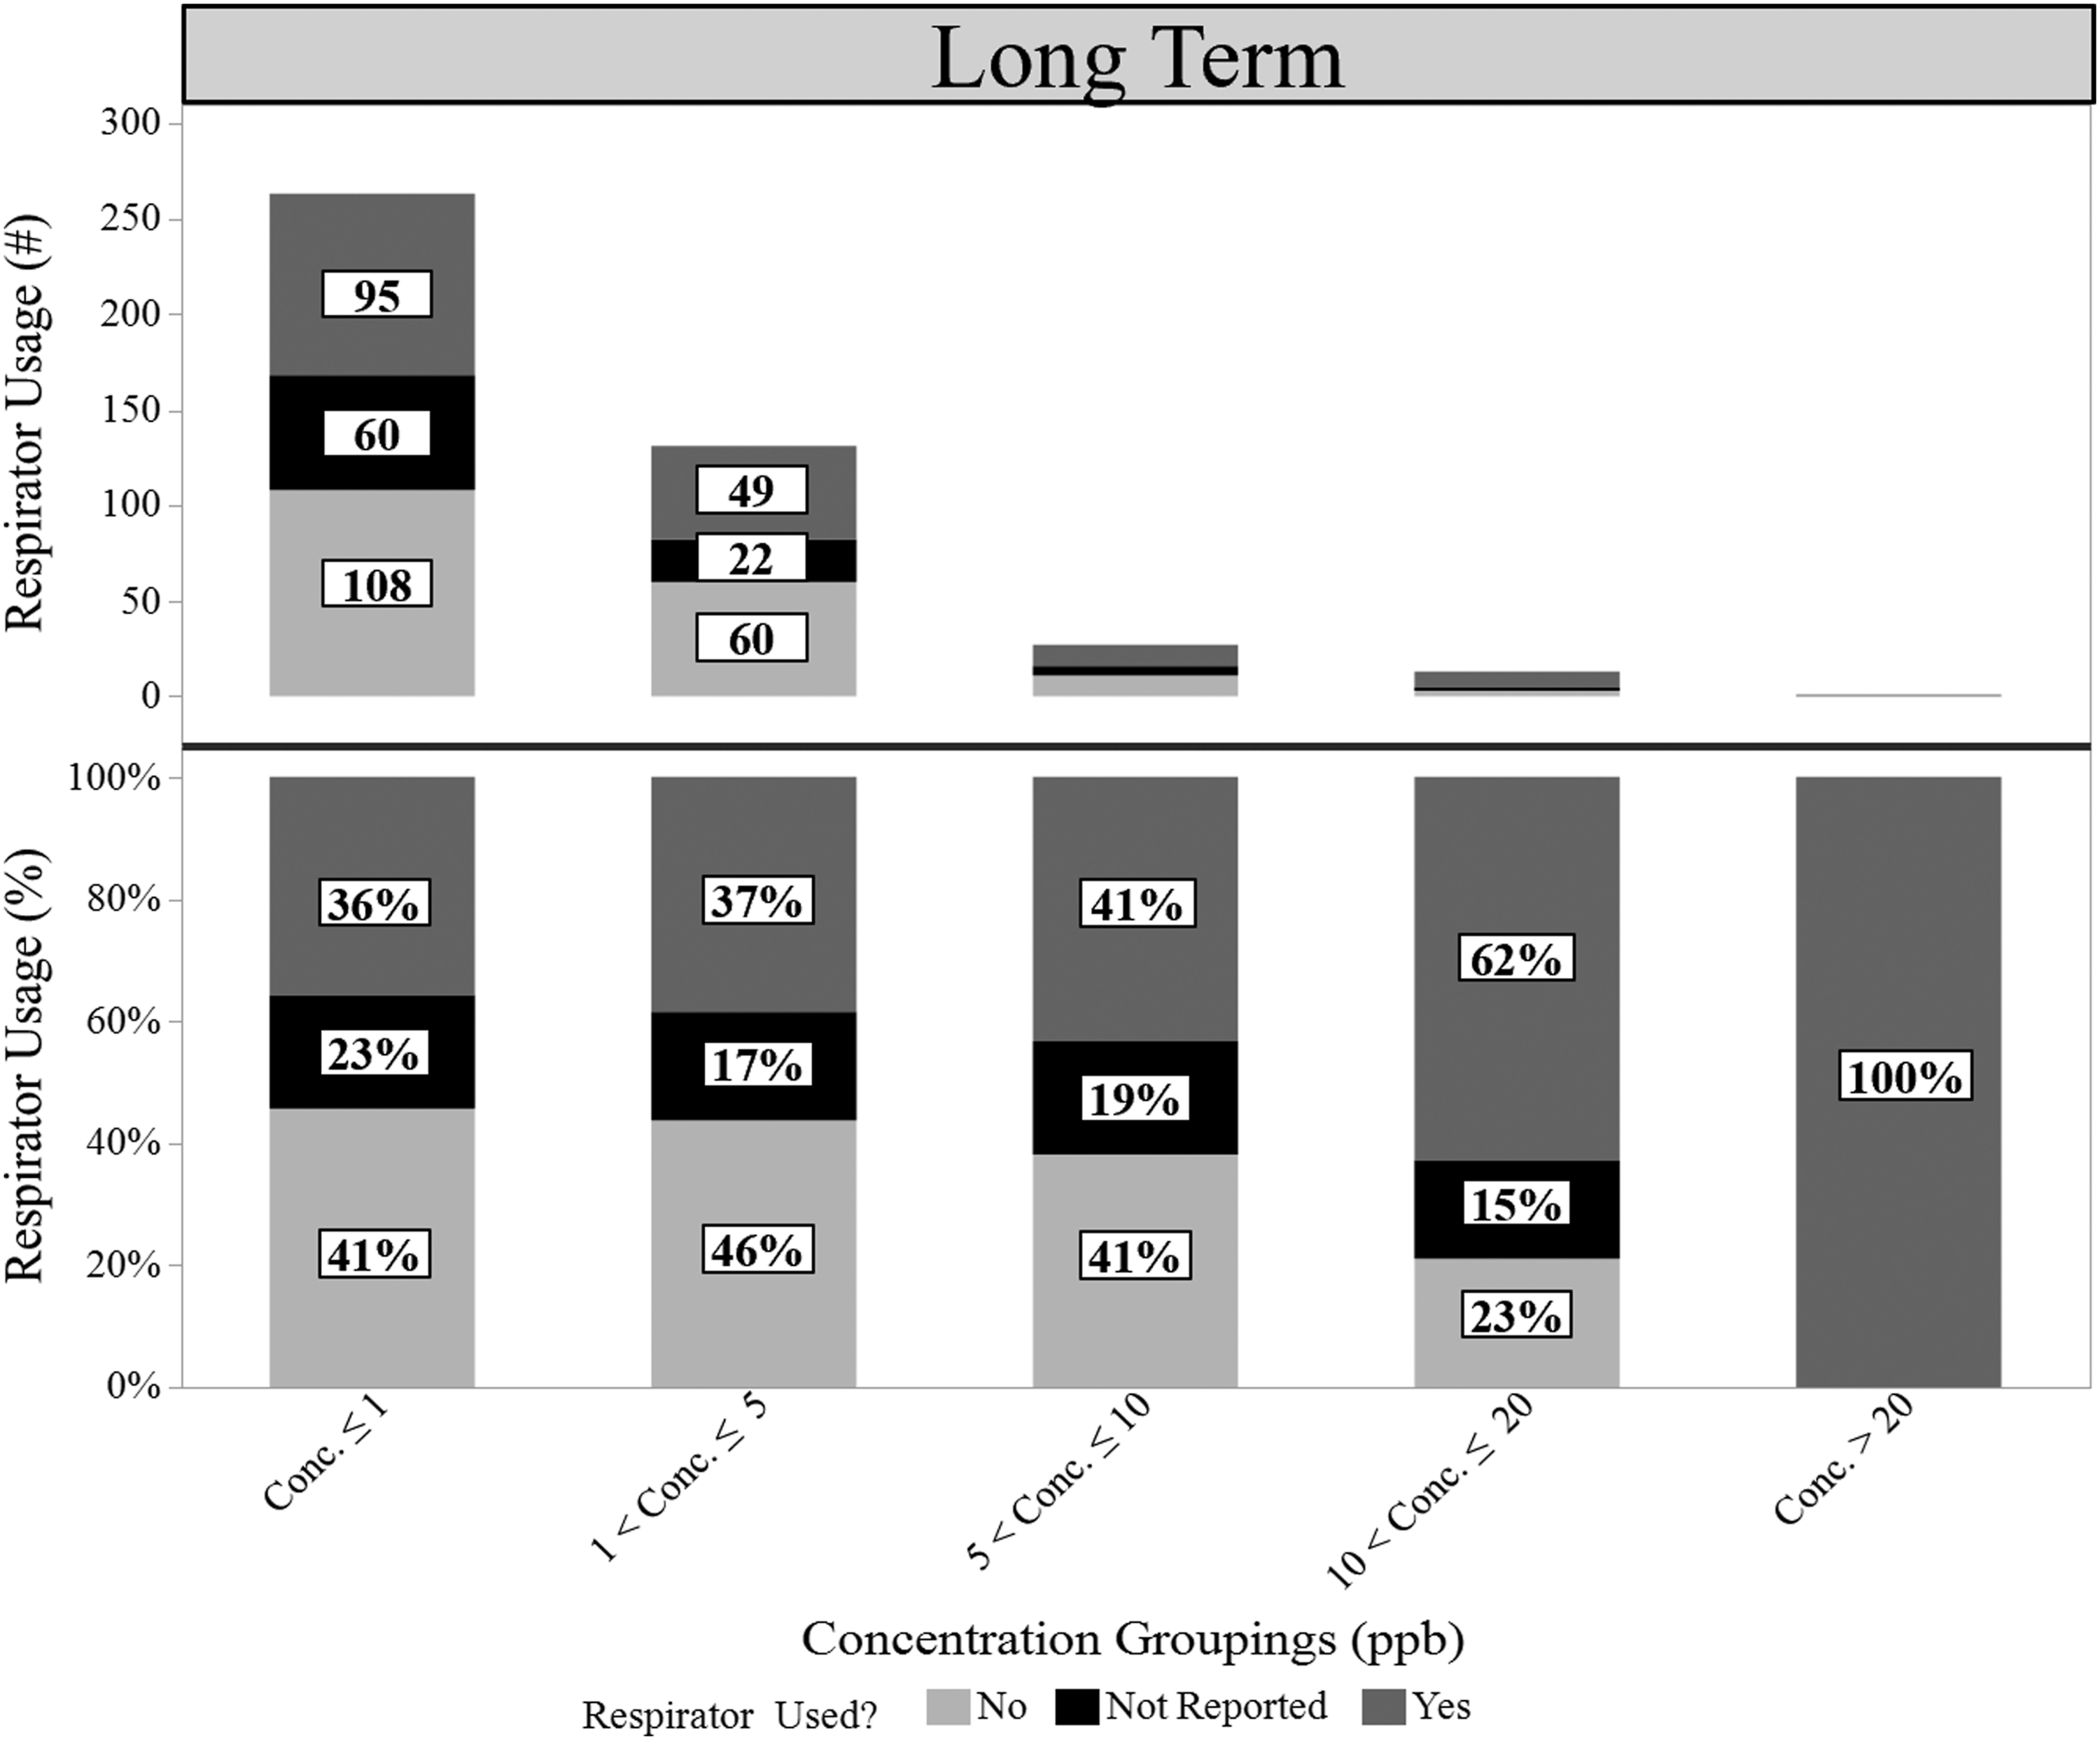
Distribution (as % of total number of samples) of airborne TDI concentrations for long-term (>4 h) personal samples and frequency of confirmed use of respiratory protective equipment (as % of samples in the respective concentration range) for various job roles in the flexible foam application.
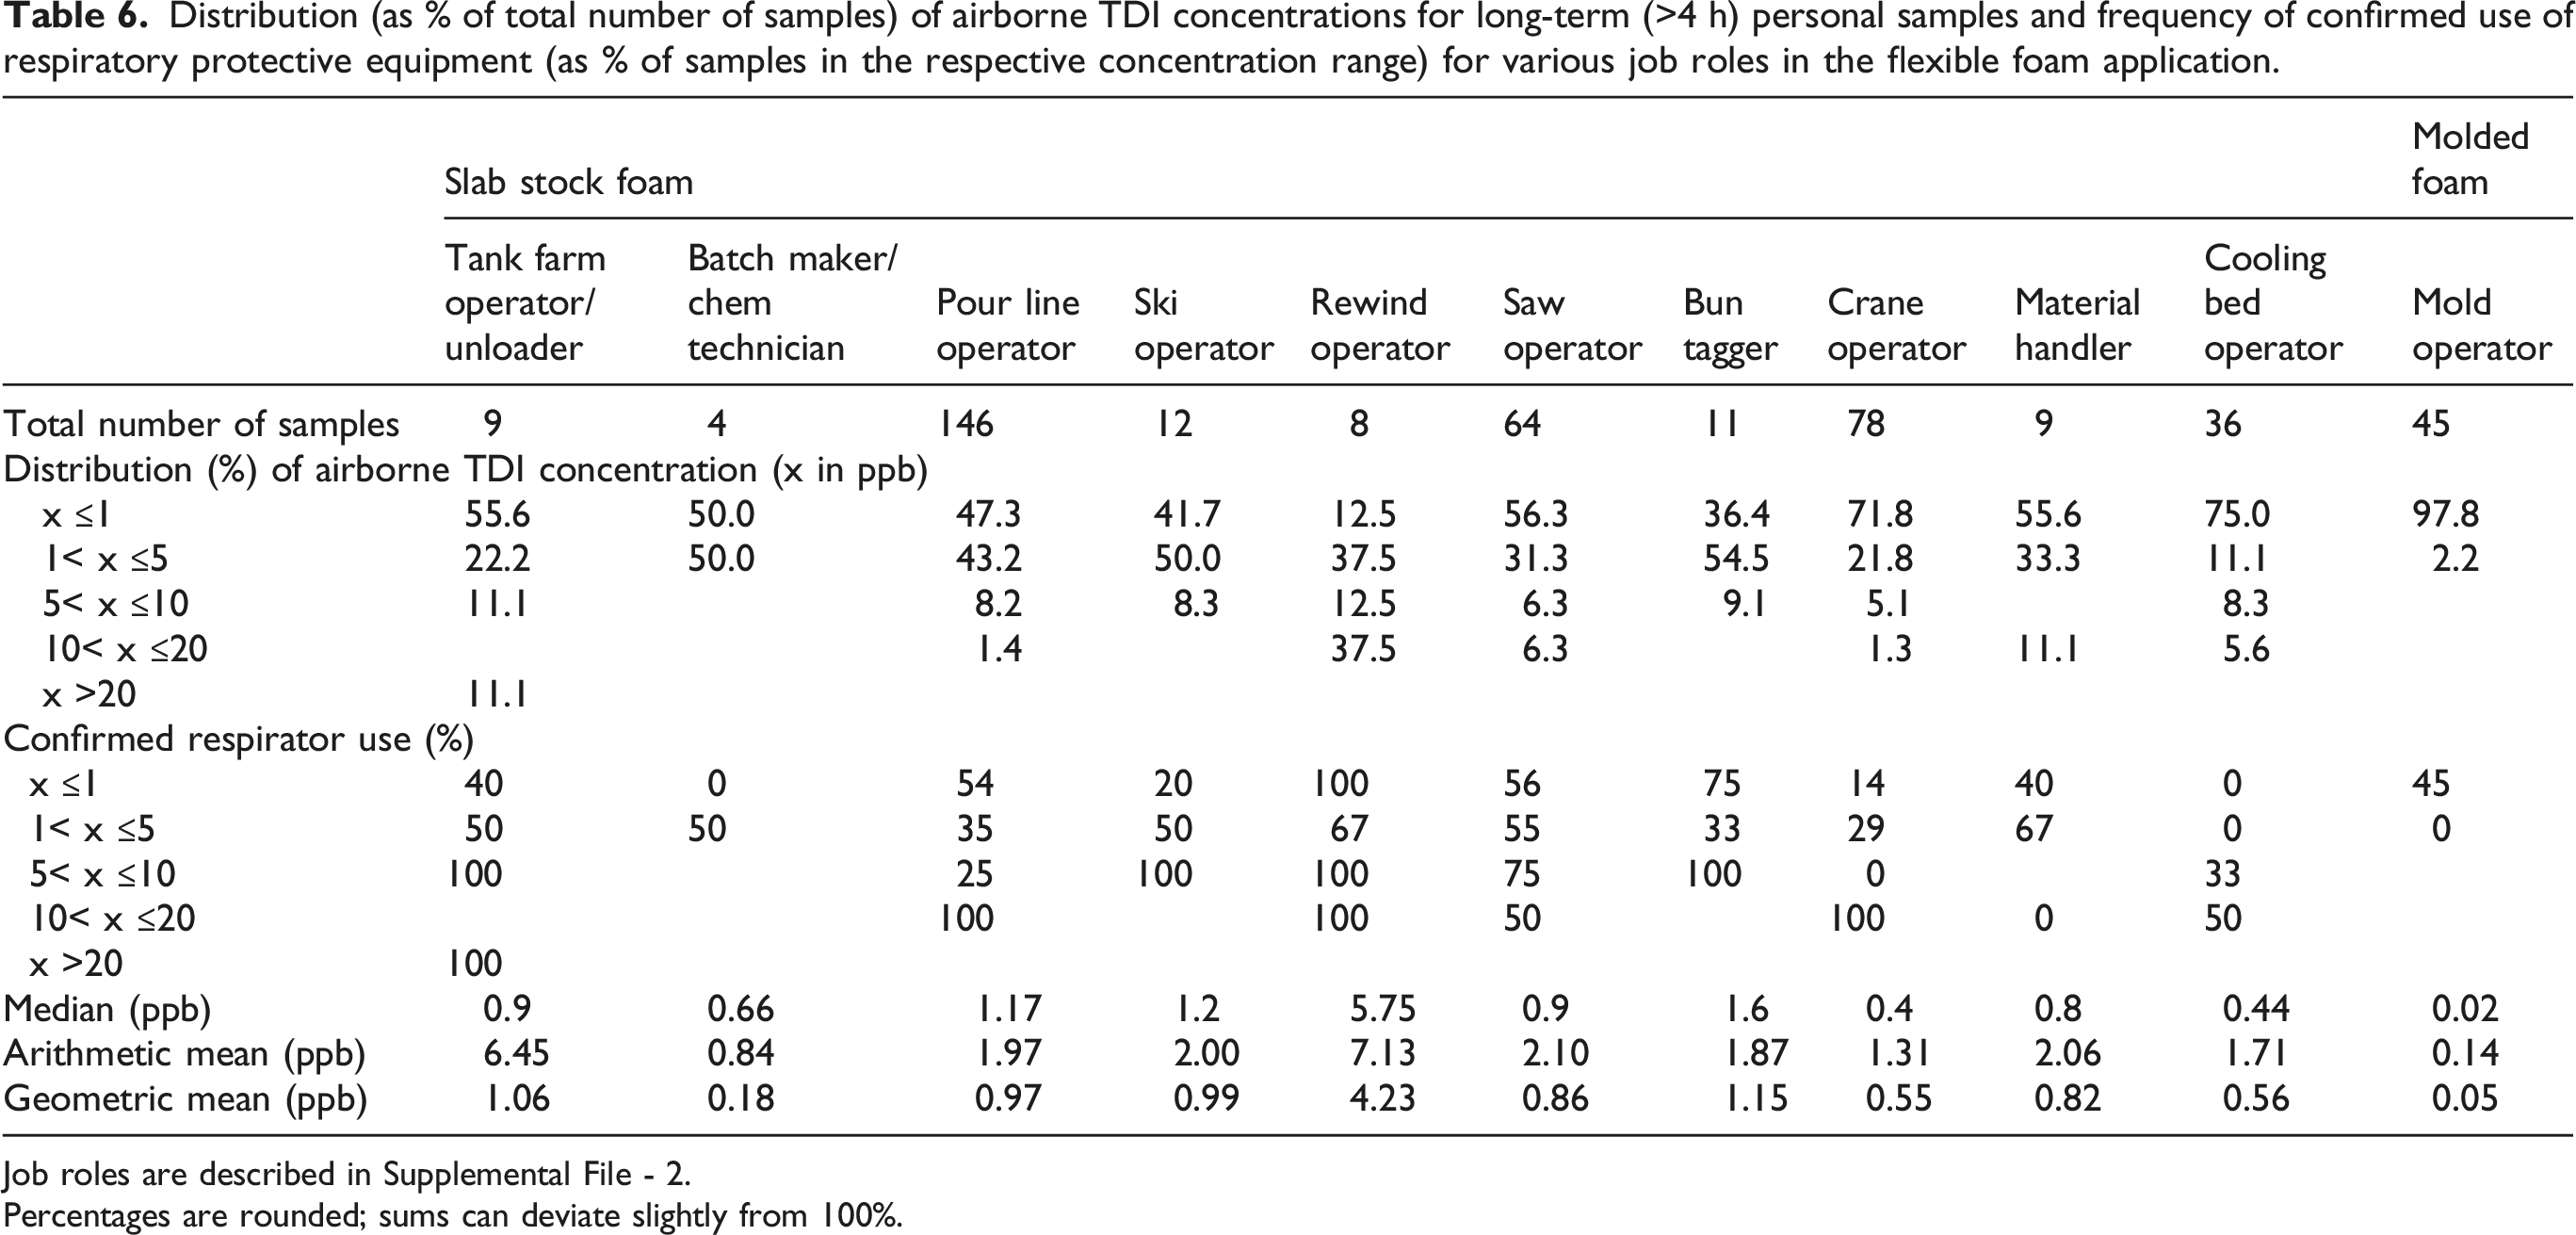
Job roles are described in Supplemental File - 2.
Percentages are rounded; sums can deviate slightly from 100%.
Detailed overview of flexible foam data
Since the Flexible Foam category had the most samples and the most samples at high concentrations, this data subset was explored in greater detail.
Overview by sample type and use of respiratory protection
Table 4 presents the distribution of the 2195 samples in the Flexible Foam category: 1485 short term, 435 long term, 93 task, and 182 area samples. The medians for TDI sample concentrations were less than 5 ppb for all sample types. The arithmetic means (averages) for TDI sample concentrations were also less than 5 ppb for the personal -short term, -long term, and area samples. However, for the personal task samples, the median was 3 ppb, while the average was 26.6 ppb, indicating the presence of a number of high exposure concentrations in the dataset. This again highlights the importance of considering both median and average when analyzing exposure data.
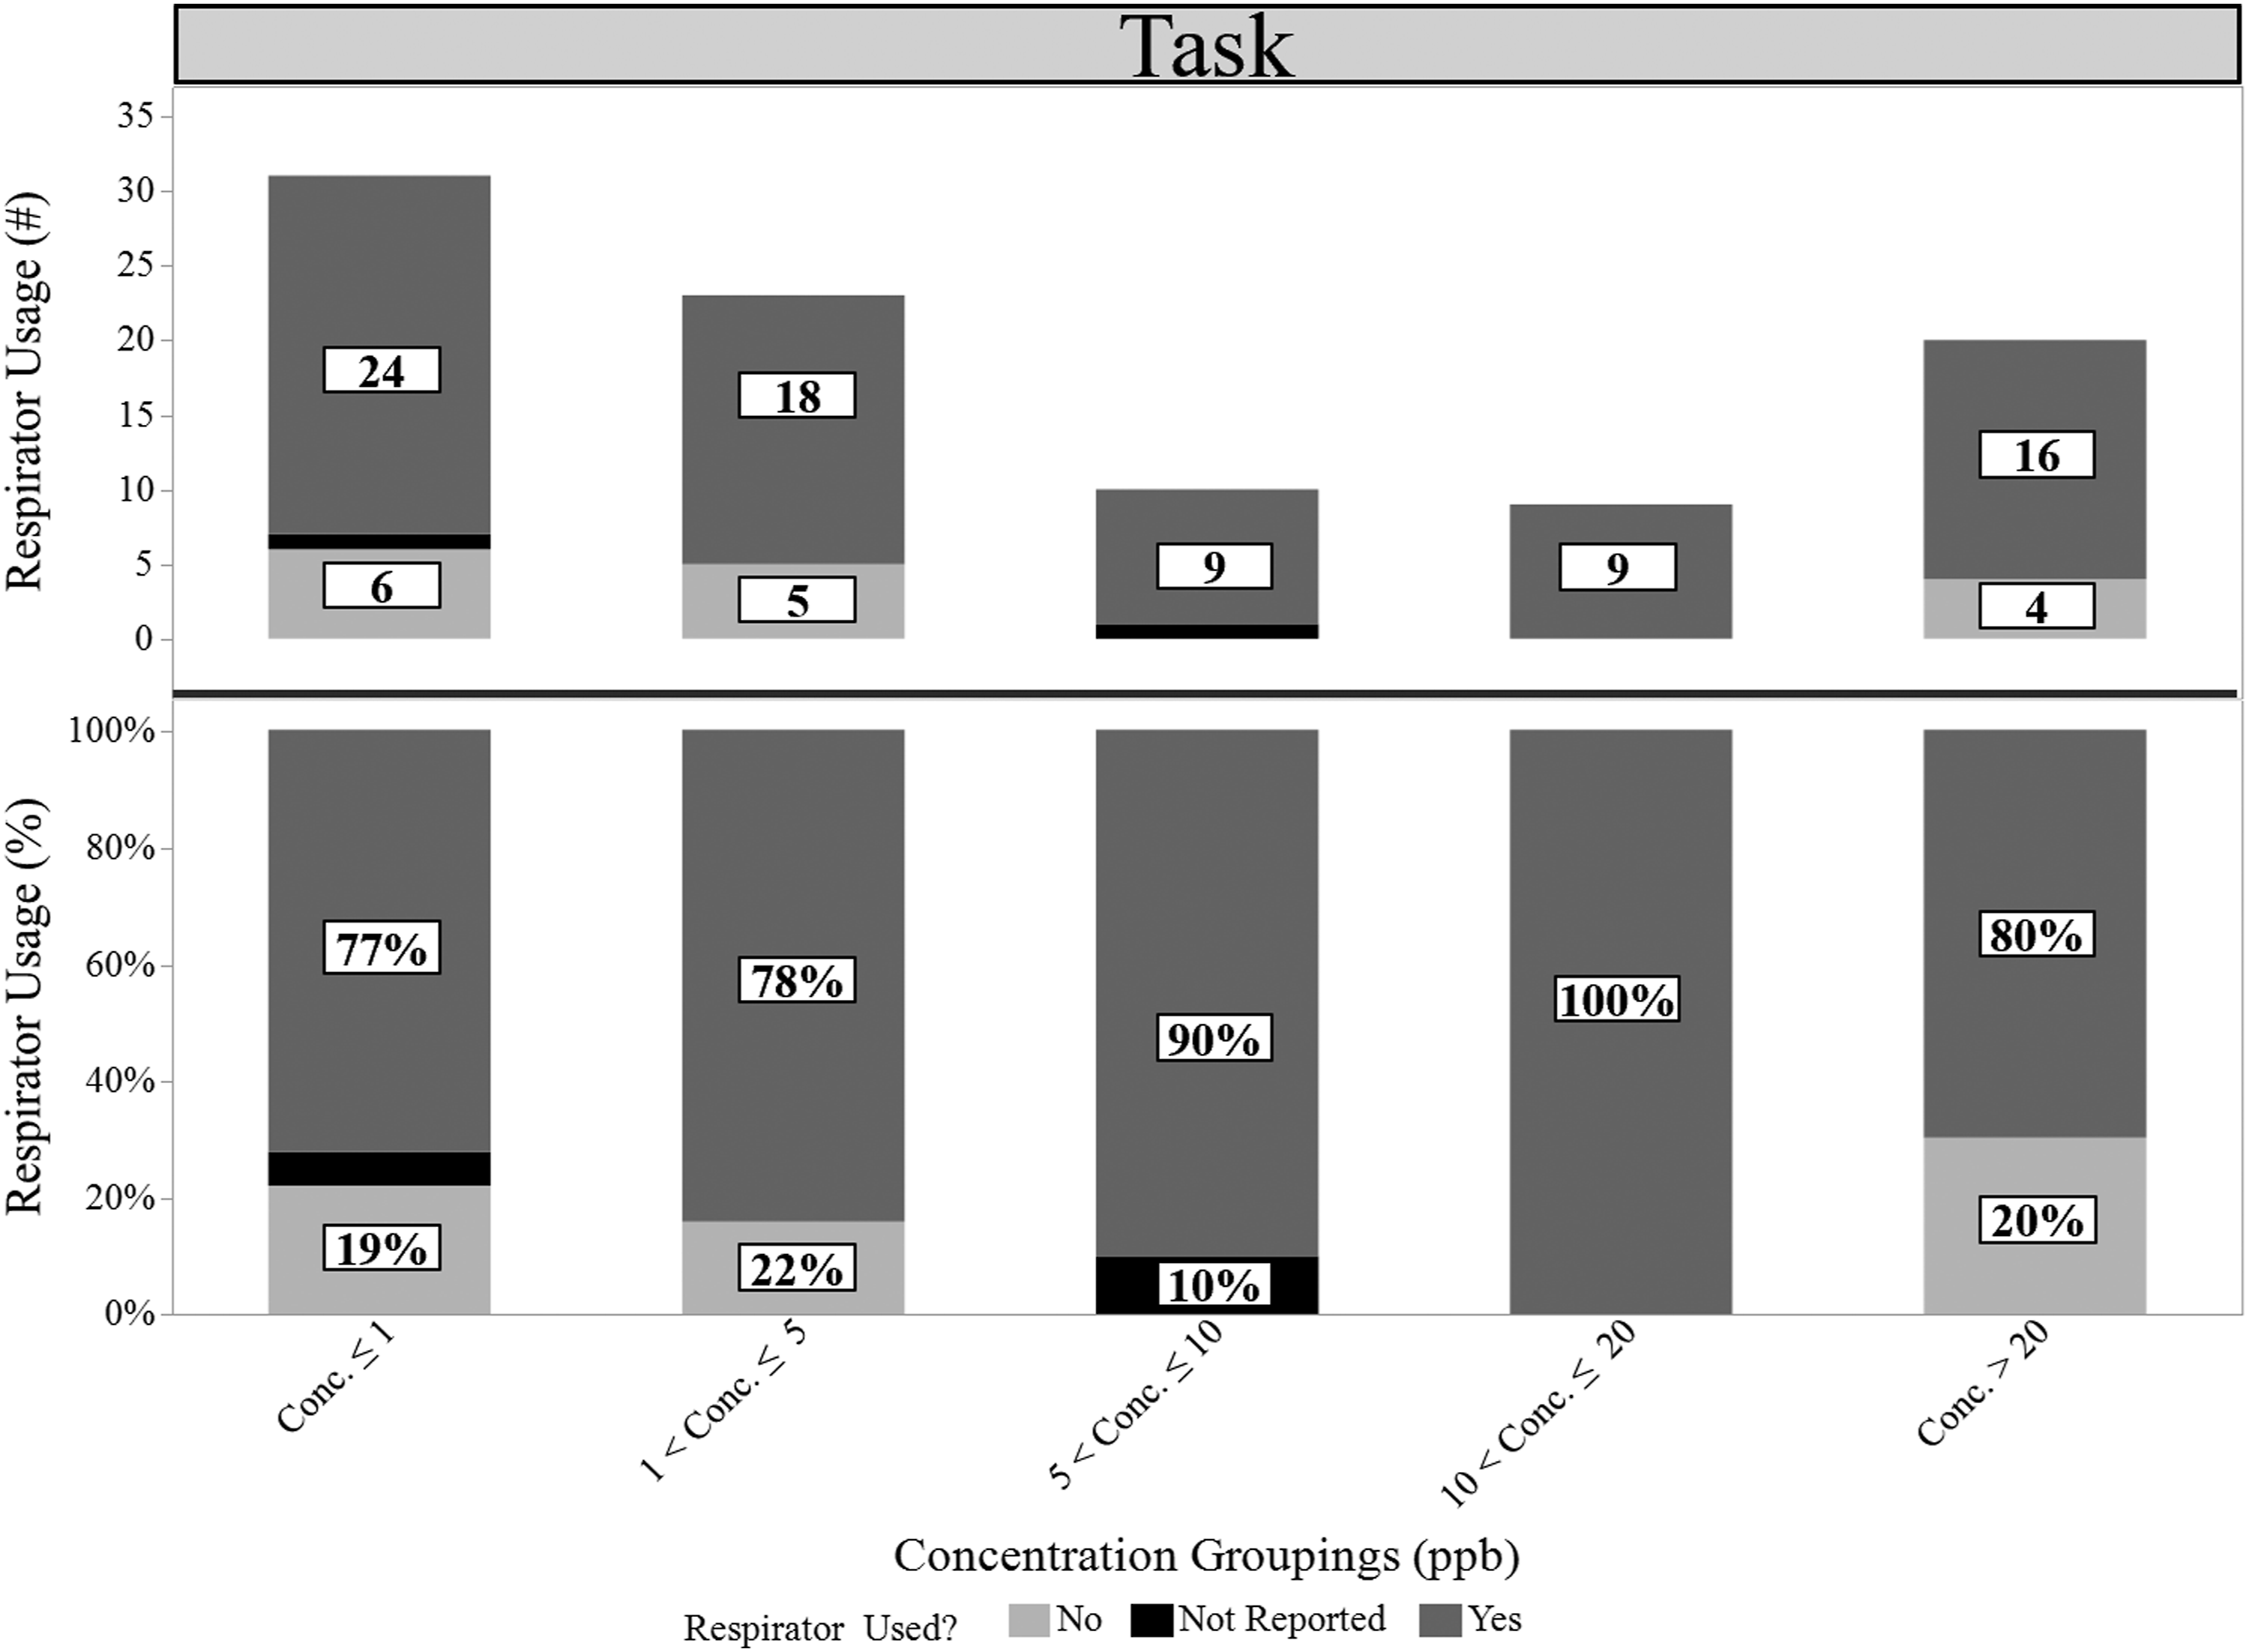
Overall, many of the data points were less than 5 ppb: task (58%), short-term (∼86%), long-term (91%), and area (∼90%). However, there were samples with airborne TDI concentrations greater than 5 ppb, and this made it important to study respirator use during these work scenarios and locations. Figures 2, 3, and 4 highlight the respirator usage for the personal samples (i.e., short-term, long-term, and task, respectively) in flexible foam production. The raw data contained information on whether a respirator was used (“Yes”), not used (“No”), or not reported. For the short-term personal samples, it was observed that respirators were not used in 30–35% of the cases for the three groupings greater than 5 ppb (i.e., 5–10 ppb, 10–20 ppb, greater than 20 ppb). Respirator use frequency was also reported for the long-term samples, and although there were fewer samples in the “greater than 20 ppb” category, the authors were able to confirm that respirators were used for all of the long-term samples that had TDI concentrations greater than 20 ppb (in the flexible foam subset). It should be noted that the long- and short-term personal samples had a higher proportion with respirator use “Not reported” compared to the task samples. This could reflect that the industrial hygienist taking the samples was more likely to record the use of respirators (or lack thereof) for task samples in these situations since the focus was on a particular work task. The “personal task” sample type had the highest reported percent respirator use in each of the groupings compared to the short- and long-term personal samples. The greater frequency of reported respirator use during task samples was likely related to the awareness that certain work tasks carry a high potential for exposure. In turn, the lower frequency of reported respirator use in the long term samples could be related to the perception that general tasks in the flexible foam industry do not carry as great a risk of exposure; it could also be due to previous air monitoring that indicated a low risk for exposure, and therefore workers were not required to wear respiratory protection. Respirator usage for Short Term (≤4 h) Personal samples in flexible foam: count (#): top panel, percentage (%): bottom panel. Counts less than 60 are not displayed on the graph due to short height of the bars. Respirator usage for Long Term (>4 h) Personal samples in flexible foam: count (#): top panel, percentage (%): bottom panel. Counts less than 20 are not displayed on the graph due to short height of the bars. Respirator usage for Personal Task samples in flexible foam: count (#): top panel, percentage (%): bottom panel. Percentages less than 5% and counts equal to 1 are not displayed on the graph due to short height of the bars.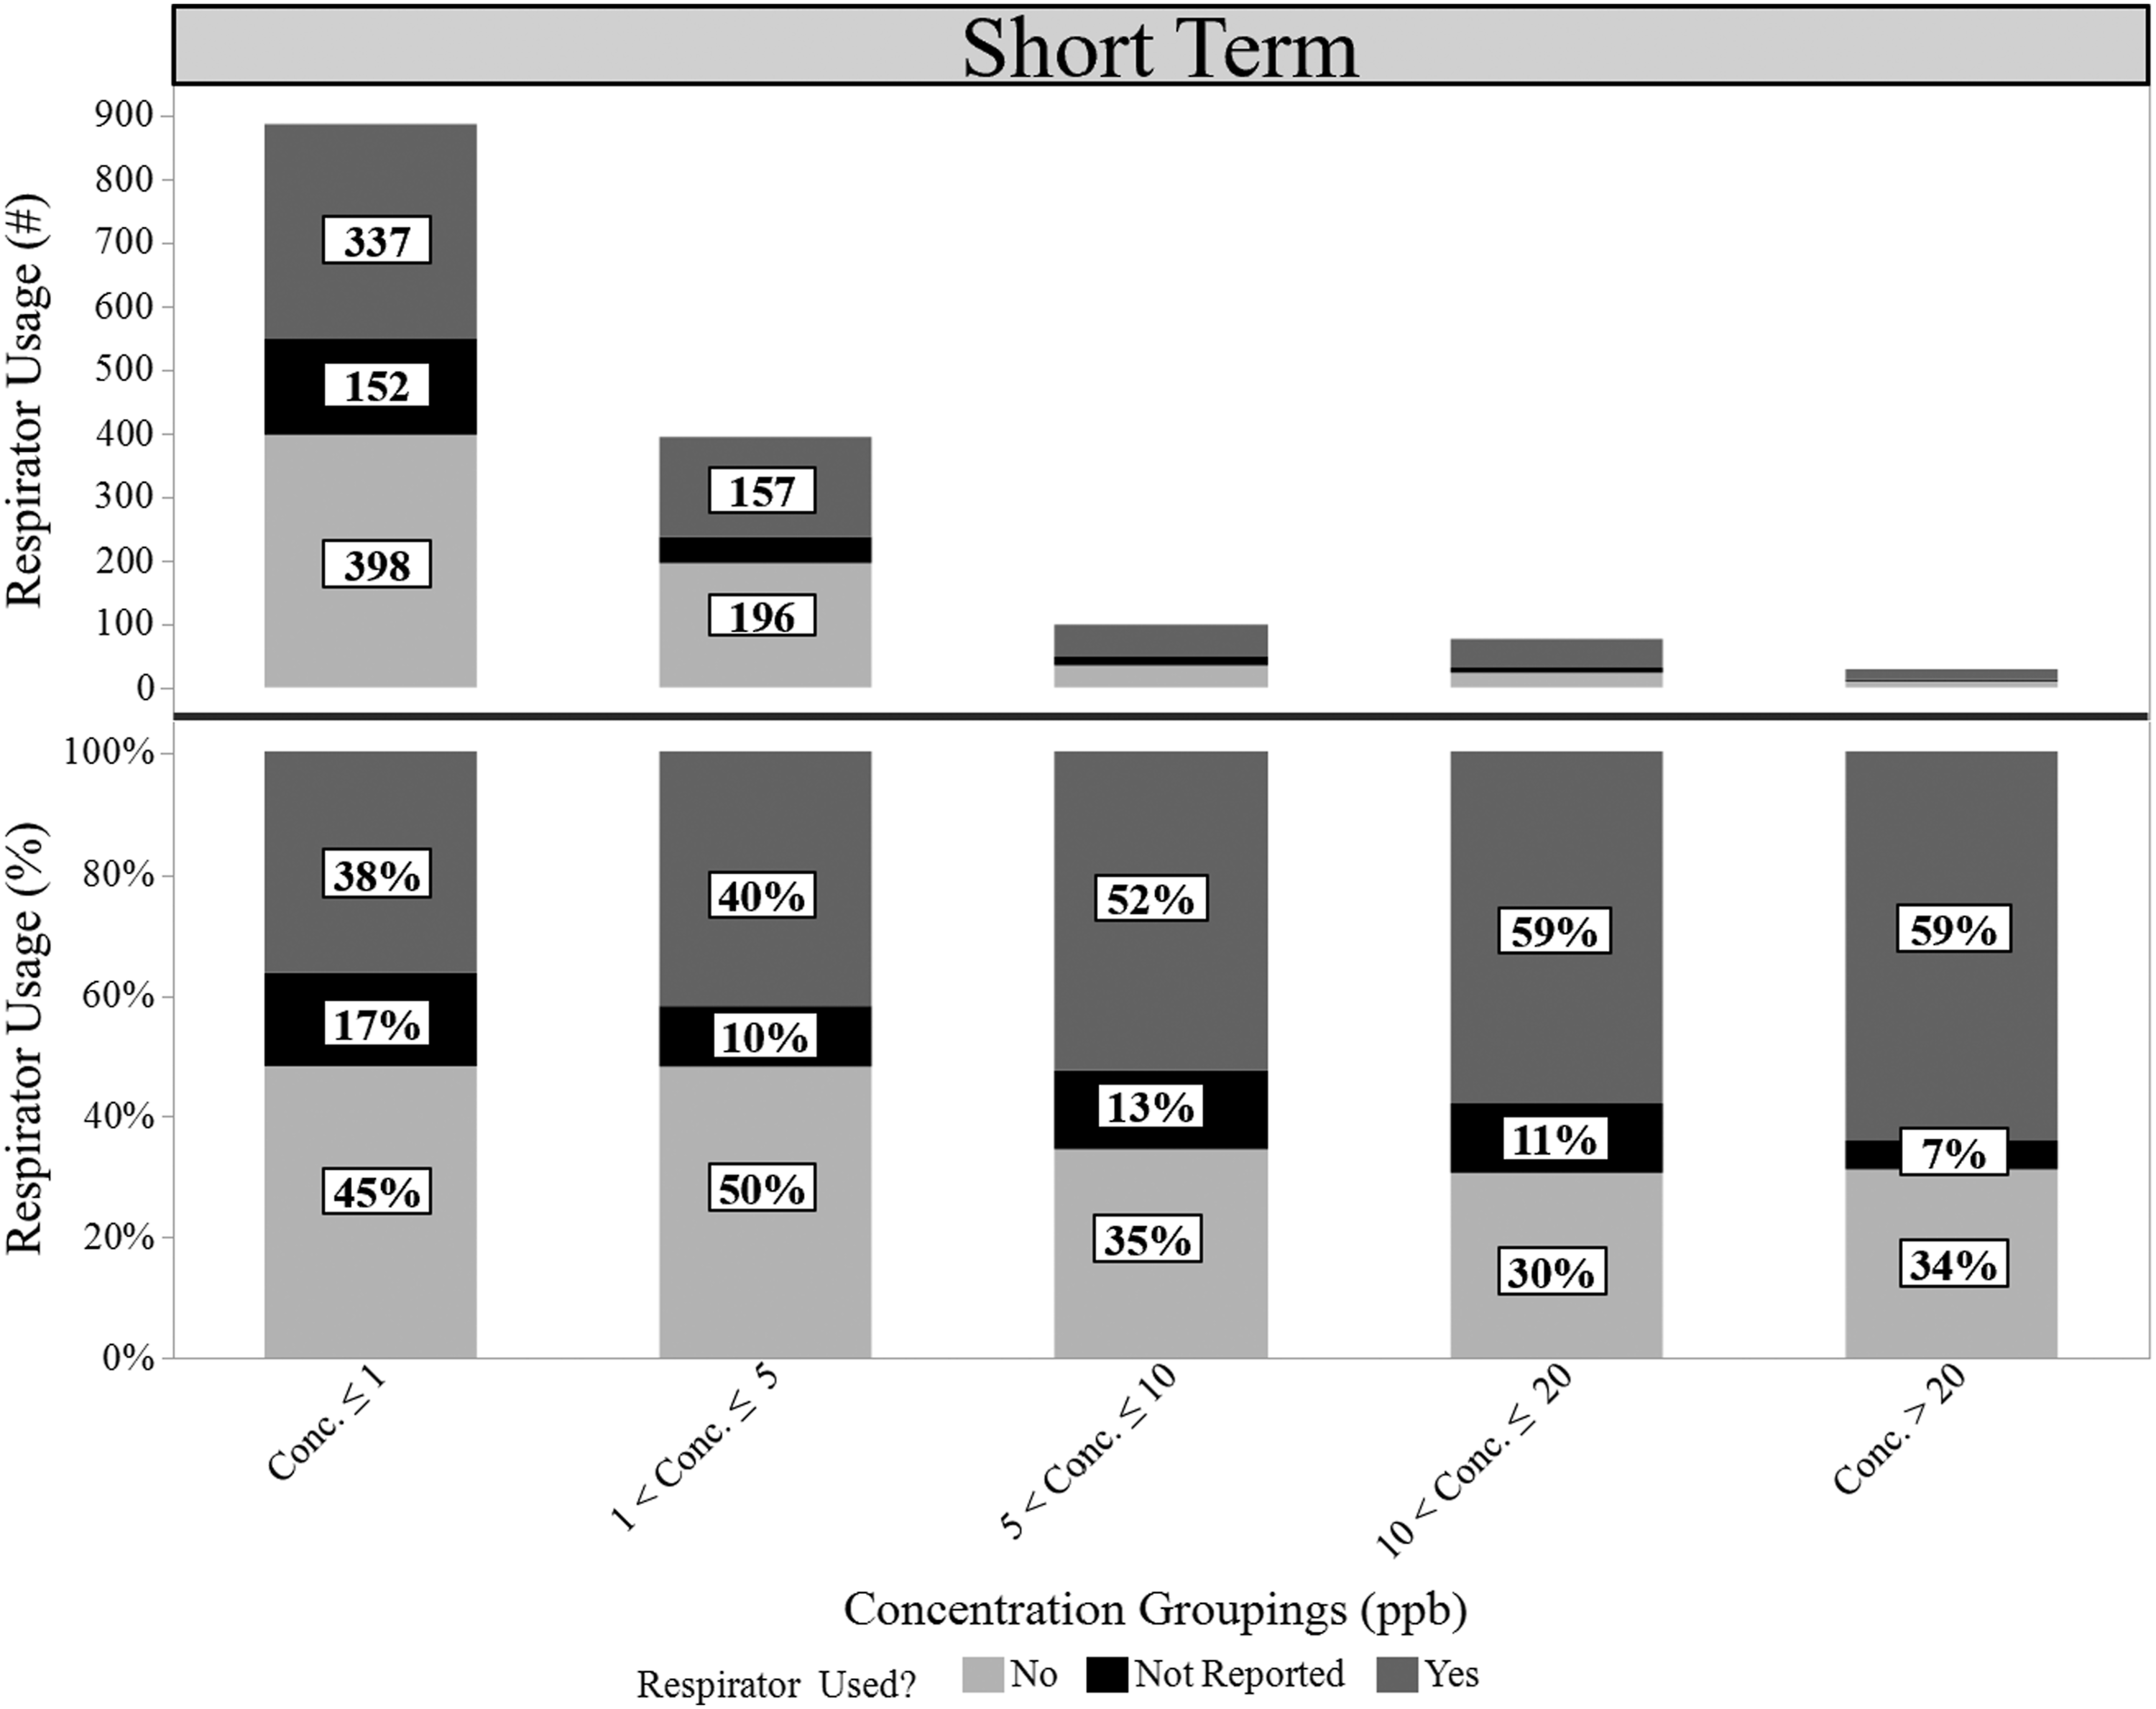
Overview by job roles in flexible foam applications
Many different descriptions were given for the job roles for personal samples taken in the Flexible Foam TDI-based PU Type category. The authors consulted with representatives of the US-based Polyurethane Foam Association to arrive at the consolidated job role descriptions (applicable in all regions) used in this study. The consolidated job roles were: Tank Farm Operator/Unloader, Batch Maker/Chem Tech, Pourline Operator, Ski Operator, Rewind Operator, Saw Operator, Bun Tagger, Crane Operator, Material Handler, Cooling Bed Operator, and Mold Operator. See Supplemental File – 2 for detailed job role descriptions and locations on the manufacturing line. The following paragraphs detail the breakdown per job role of concentrations and respiratory protection frequency in each of the personal sample categories: short term, long term, and task, respectively.
Distribution (as number of samples) of airborne TDI concentrations for task-based (typically <½ h) personal samples and frequency of confirmed use of respiratory protective equipment (as % of samples in the respective concentration range) for various job roles in the flexible foam application.
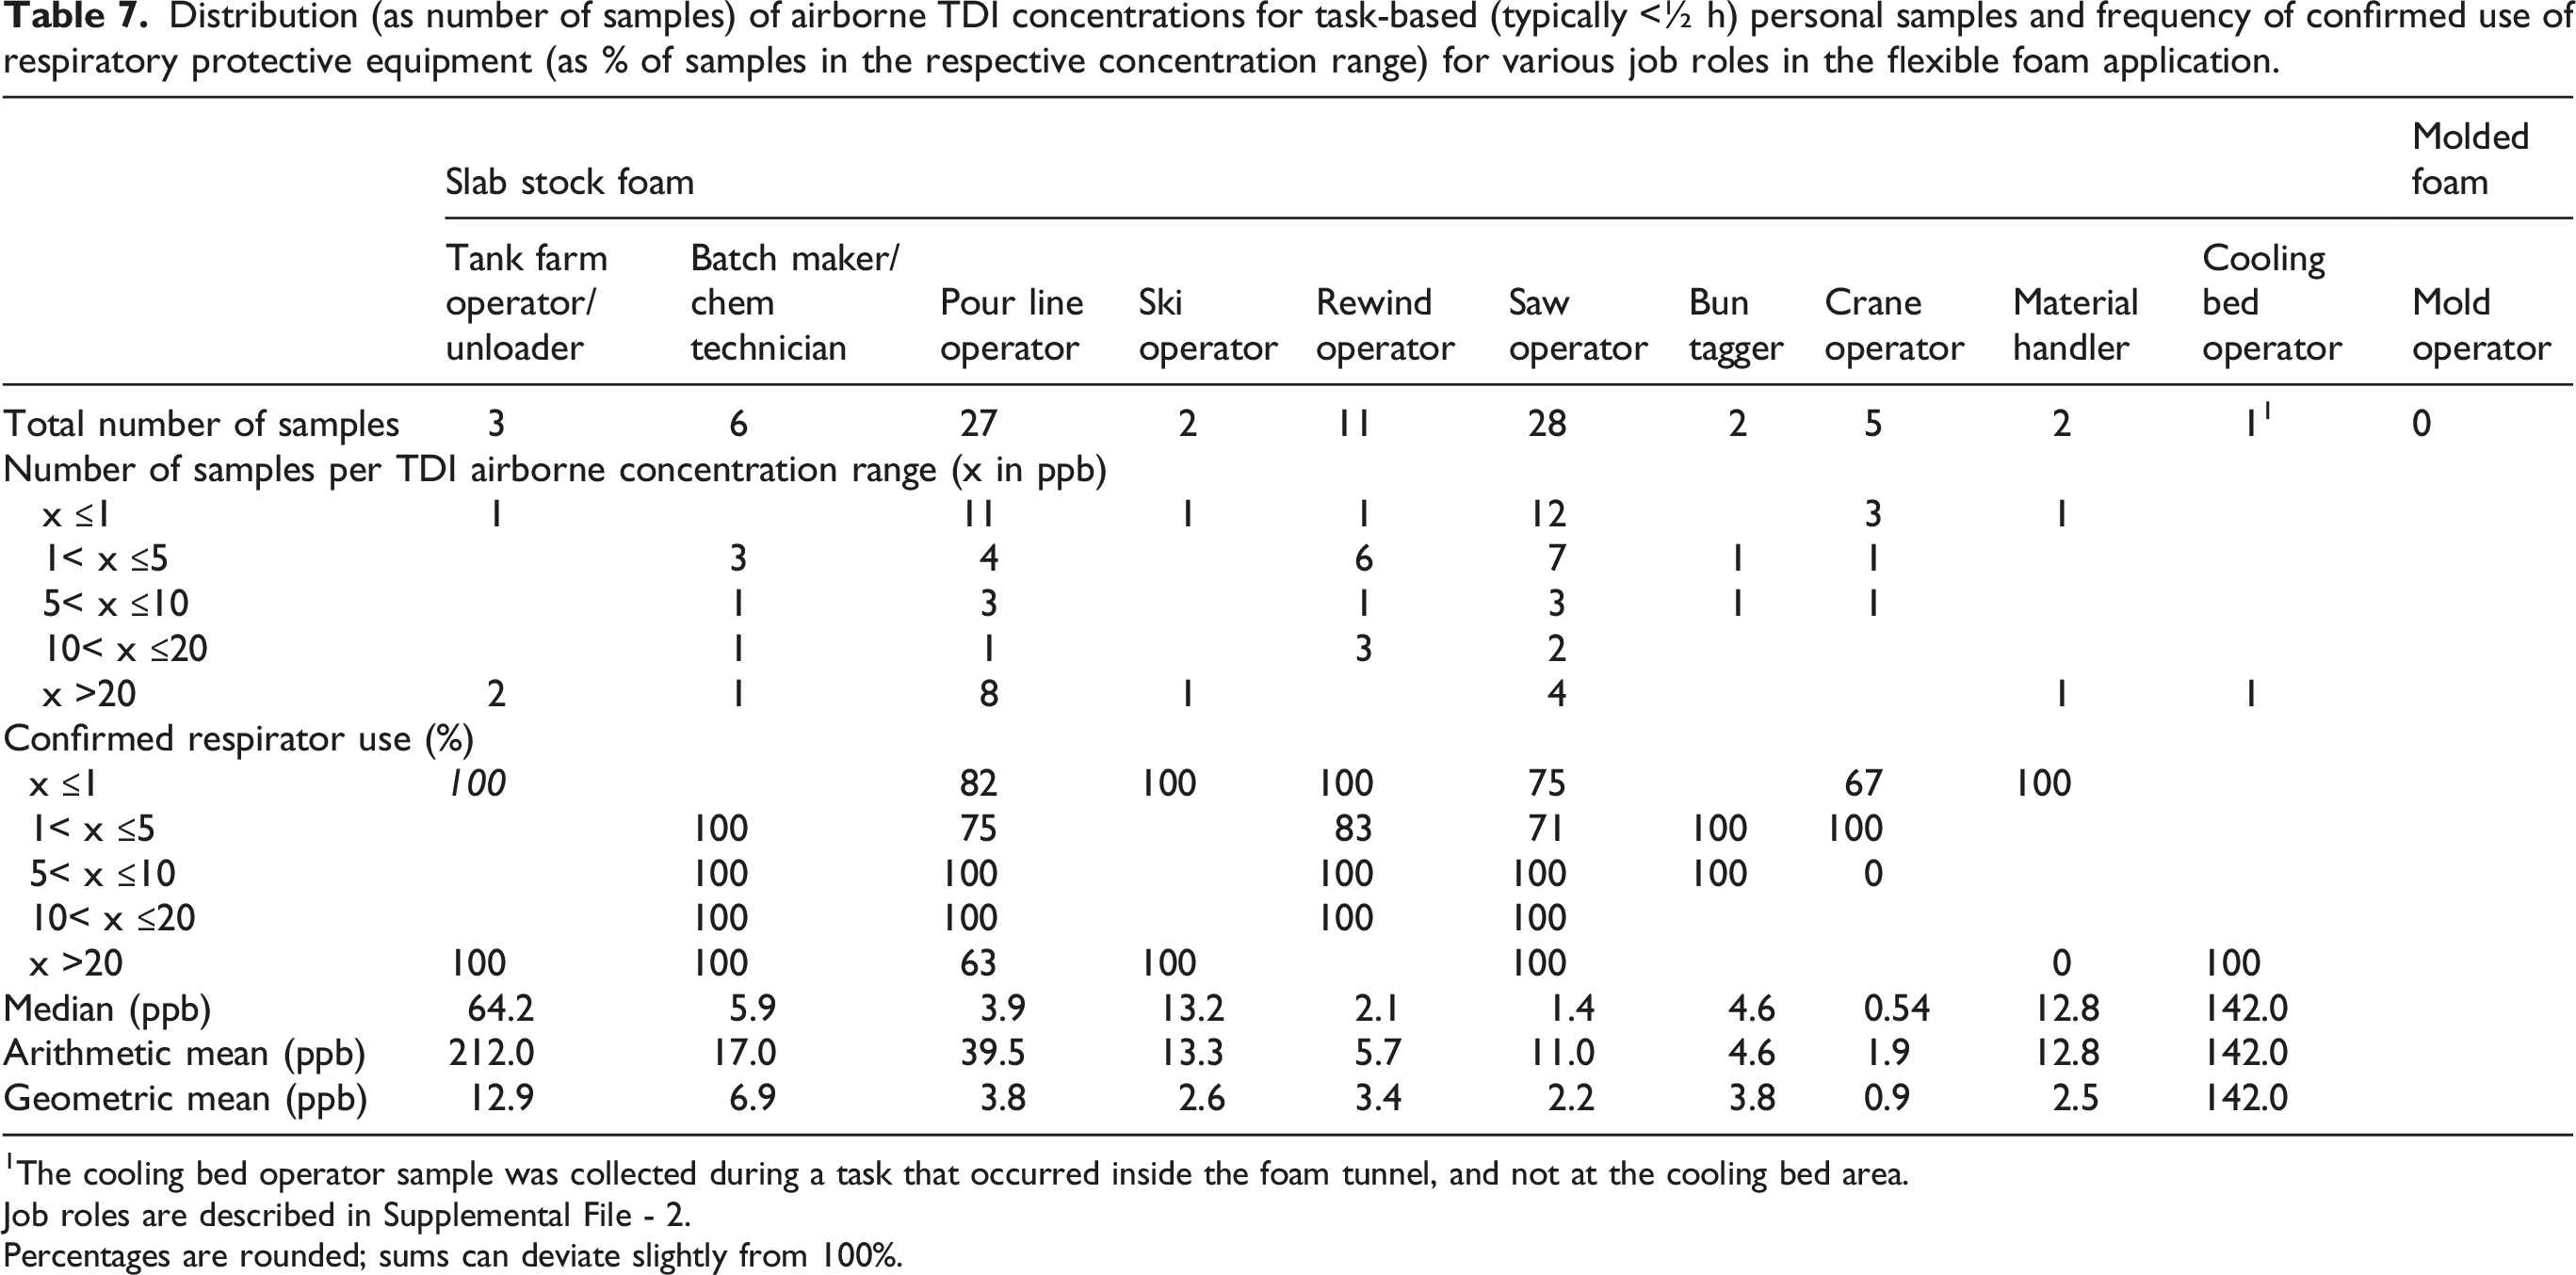
1The cooling bed operator sample was collected during a task that occurred inside the foam tunnel, and not at the cooling bed area.
Job roles are described in Supplemental File - 2.
Percentages are rounded; sums can deviate slightly from 100%.
Tables 5 and 6 also document the positively recorded use of respiratory protection for each job role by sample concentration range. There could have been long-term samples that included a short task where a respirator was worn only for a very short duration but this use was not recorded in the raw data. For this reason, only clearly identified samples with respirator use were counted for this analysis (“Yes,” as indicated above). At sample concentrations >20 ppb, there were four job roles in the short-term samples where the confirmed respirator use was less than 100%: Pourline Operator, Rewind Operator, Saw Operator, and Ski Operator. At concentrations <20 ppb, respirator use was <50% among several job roles in both the long- and short-term samples.
Table 7 summarizes the air sampling concentrations by job role for personal task samples. Compared to the short- and long-term samples, the task samples had higher median and average sample concentration values for several job roles. Half of the job roles (5 out of 10) had median task sample values that were greater than 5 ppb; eight of the 10 job roles with task samples had average concentrations greater than 5 ppb. Two job roles, Cooling Bed Operator and Tank Farm Operator/Unloader, had median and average concentration values >50 ppb. For these higher concentration samples (which are counted under the “x >20 ppb” column), respiratory protection was generally used. Compared to the short- and long-term personal samples, there was a higher proportion of job roles with 100% confirmed respirator use in the task samples. As previously discussed, this could reflect the industrial hygienist intentionally recording the use of respirators since the focus was on a specific task.
Overview of molded foam applications
According to Tables 5 and 6, there were 169 samples collected in molded foam applications: 124 short-term, 45 long-term. There were no task or area samples collected in molded foam applications. Short-term sample results showed that 120 of the sample results were in the 0–1 ppb range and 4 samples were in the 1–5 ppb range. Long-term sample results showed that 44 of the sample results were in the 0–1 ppb range; 1 sample was in the 1–5 ppb range.
Discussion
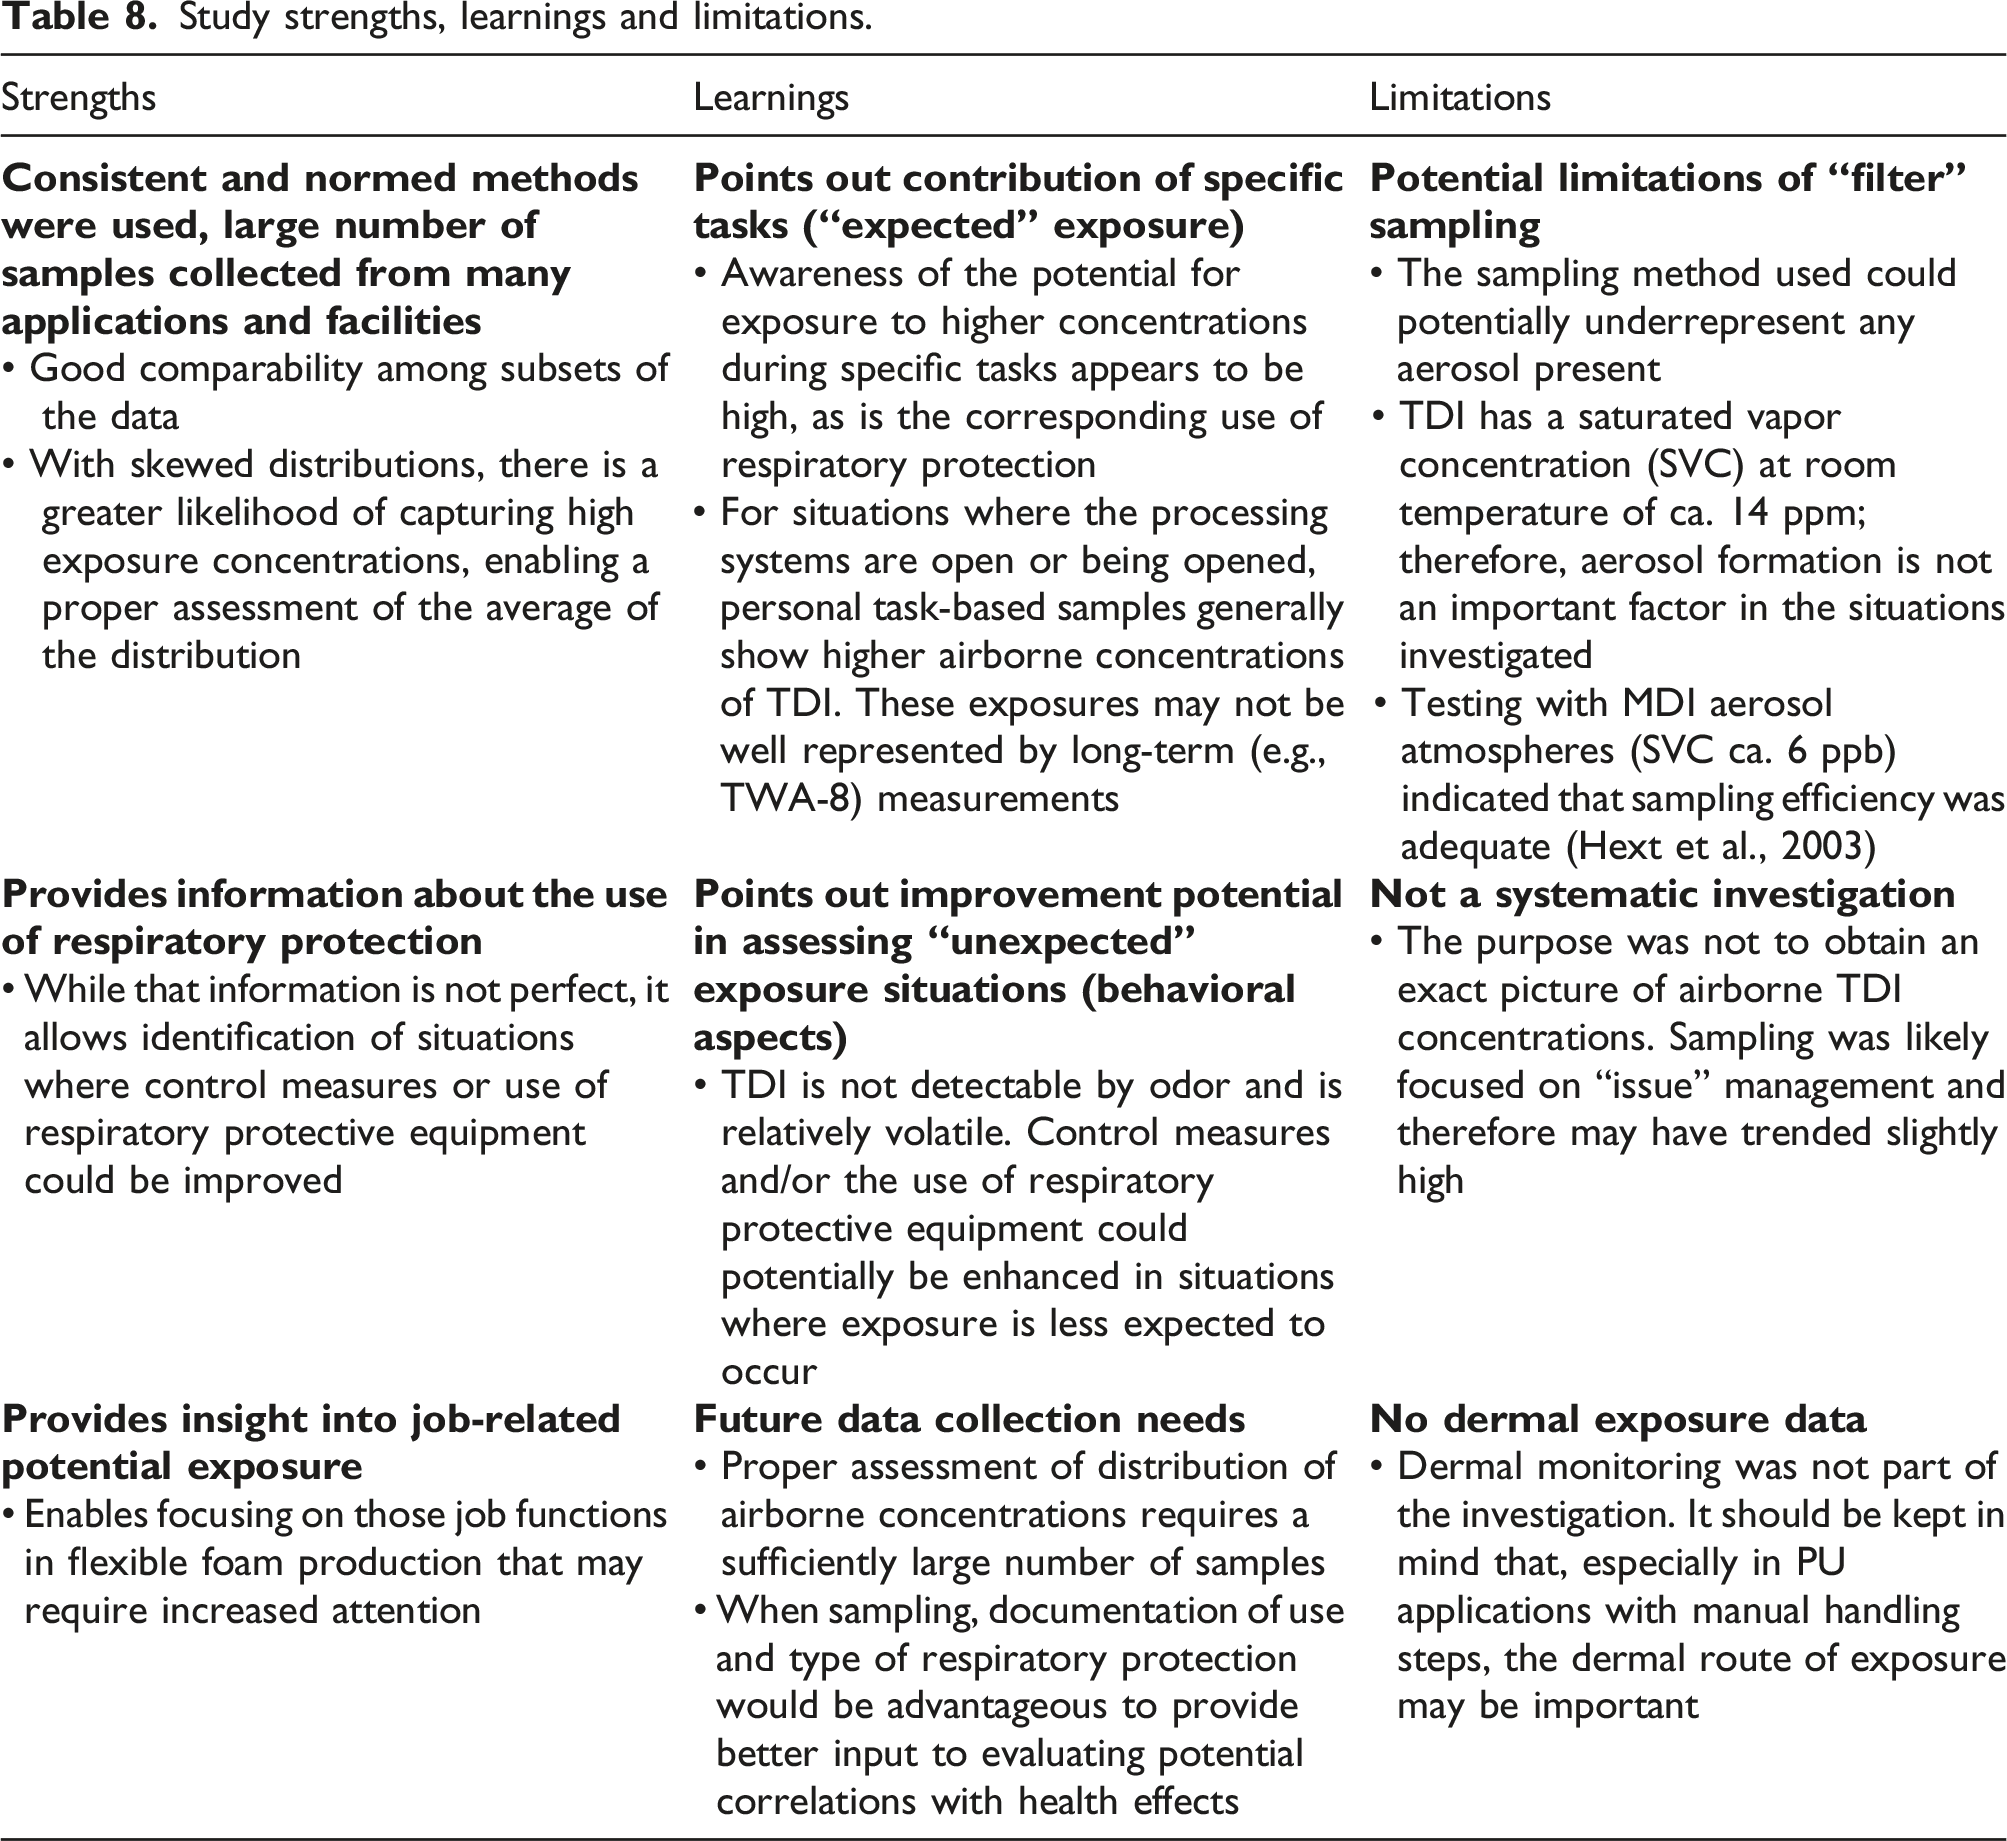
Overall, the analysis of TDI workplace air concentrations over the last 15 years indicates that exposures to TDI are low across multiple sectors: over 60% of the short-term and long-term personal samples showed air concentrations below 1 ppb. For situations where the processing systems are open or being opened, personal task-based samples generally show higher airborne concentrations of TDI. These exposures may not be well represented by long-term (e.g., TWA-8) measurements.
Other studies have arrived at similar general conclusions. For comparison, a summary table is presented in Supplemental File – 3, covering studies that were published in peer-reviewed literature during the 2001-2021 timeframe (Austin, 2007; Broberg et al., 2008; Brzeznicki and Bonczarowska, 2015; Fairfax and Porter, 2006; Gui et al., 2014; Jones et al., 2017; Kääriä et al., 2001; Rother and Schlüter, 2021; Rühl and Kersting, 2011; Säkkinen et al., 2011; Sennbro et al., 2004; Swierczynska-Machura et al., 2015; Tinnerberg and Mattsson, 2008; Spence and Plehiers, 2021). Median and GM exposure concentrations were found to typically be 0.2–1.5 ppb, and exposures ranged up to 89 ppb. Average concentrations were generally somewhat lower than observed in the data set summarized in this paper. As mentioned before, this set could potentially tend toward higher exposure values, but it is also quite possible that the large number of samples taken may have uncovered a greater number of high exposures. While many studies, including this one, may not have systematically investigated all possible exposure scenarios, a definite strength of this study compared to all other published data is the large number of samples that were taken.
A limitation of this study is that no dermal exposure information was analyzed. During most of the time period evaluated (2005–2020), robust dermal monitoring methods were not available. More recently, Harari et al. (2016) developed methods for quantifying dermal samples by analyzing gloves that were exposed to isocyanates, and showed that while such sampling is possible, highly sensitive and specific methods are needed. It is therefore all the more important for industrial hygienists to remember that dermal exposure to TDI has the potential to contribute to the induction of sensitization and should therefore be minimized when assessing worker exposure to TDI, even when airborne concentrations are low. Biomonitoring can also be used as a tool in a comprehensive exposure assessment to encompass all routes of exposure, and to evaluate the effectiveness of work practices, controls, and personal protective equipment (PPE) (Bello et al., 2020; Cocker and Jones, 2017).
Respirators were worn in more than 75% of all task samples evaluated. This suggests that there is high awareness of situations when TDI exposure potential is present. However, there appears to be an opportunity to increase the use of respirators and/or other control measures in situations where the expectation of encountering brief high exposures is not so obvious. The hierarchy of controls for workplace exposure reduction (CDC, 2015) indicates that engineering controls are the first line of defense, followed by administrative controls, and then PPE; engineering and administrative controls should first be explored for reducing or eliminating these less obvious brief high exposures. The installation of a well enclosed and ventilated foam tunnel is a good example of an effective engineering control in a slab stock foam facility. Reducing the size of the tunnel opening at the pour head (e.g., through use of transparent hanging curtains) could further improve the effectiveness of the ventilation system in controlling airborne TDI concentrations. A good example of administrative controls in the slab foam industry is the requirement to keep workers out of the tunnel as much as possible and, when they do have to enter, having written work practices specifying that they wear a respirator (PPE).
Study strengths, learnings and limitations.
Conclusion
The key benefits of this study lie in the fact that it allowed assessment of job-specific exposure profiles combined with the corresponding use of respiratory protection. The key learnings were that, on the one hand, respiratory protection is frequently used when exposure is expected; on the other hand, further improvement may be needed to reduce exposure when it is less expected, whether that be through engineering controls, or by increasing the use of protective equipment. Overall, this manuscript shows that development of best practices across the industry would be a way to improve awareness and promote product stewardship in the industries studied.
Finally, this study suggests opportunities for improvement in exposure data collection in the future. Proper assessment of distribution of airborne concentrations requires a sufficiently large number of samples. In addition, it would be advantageous if exposure sampling records include documentation of use and type of respiratory protection. This would allow more thorough evaluation and the ability to make correlations to health effects, as appropriate.
Supplemental Material
Supplemental Material—Toluene diisocyanate occupational exposure data in the polyurethane industry (2005-2020): A descriptive summary from an industrial hygiene perspective
Supplemental Material for Toluene diisocyanate occupational exposure data in the polyurethane industry (2005-2020): A descriptive summary from an industrial hygiene perspective by Catherine Sayles, Natalie Finnegan, Timothy Pike, and Mark W Spence in Toxicology and Industrial Health
Footnotes
Author’s note
The opinions expressed are those of the authors and not of Covestro LLC, the International Isocyanate Institute, Inc., or its member companies.
Declaration of conflicting interests
The author(s) declared the following potential conflicts of interest with respect to the research, authorship, and/or publication of this article: CS, NF, and TP are employed by Covestro LLC, a producer of TDI. MWS is employed by the International Isocyanate Institute, Inc. The Institute is funded by producers of TDI and MDI.
Funding
The author(s) disclosed receipt of the following financial support for the research, authorship, and/or publication of this article: This project was sponsored by the International Isocyanate Institute.
Supplemental Material
Supplemental material for this article is available online.
References
Supplementary Material
Please find the following supplemental material available below.
For Open Access articles published under a Creative Commons License, all supplemental material carries the same license as the article it is associated with.
For non-Open Access articles published, all supplemental material carries a non-exclusive license, and permission requests for re-use of supplemental material or any part of supplemental material shall be sent directly to the copyright owner as specified in the copyright notice associated with the article.