
Abstract
Adult numeracy is underresearched especially regarding numeracy practices. Research shows general correlations between numeracy skills and the use of these skills, indicating that low proficient groups use their skills less often than others do. Earlier research also shows correlations of low numeracy skills and practices with low income. Both results feed stereotypes that vulnerable subgroups—with low numeracy proficiency or a low monthly budget—would not calculate much and this would even cause their complicated income situation. Findings of this article show that the tighter the budget is the more likely vulnerable subgroups are to monitor it by frequent calculations of prices, costs, or budgets. This article connects representative Programme for the International Assessment of Adult Competencies data from the German data set with a local sample of people with lowest income. Findings show that vulnerable subgroups calculate more often than other parts of the population, but they mostly do without technical devices.
Introduction
In times of economic uncertainties, a growing number of adults face financial difficulties (Green, 2017). There are stereotypes that blame those adults for their situation. Among these statements is the assumption that overindebted 1 adults would not take sufficient care of their economic affairs and that they would therefore be responsible for their financial situation. This article aims on challenging these stereotypes.
Low numeracy skills and low daily use of these skills correlate (Reder, 2017). However, is there also a correlation between economic vulnerability and rare use of skills? Does this correlation hold true for different numeracy practices? Observations from a local study (n = 68) in Germany about overindebted and homeless adults show that these adults, living in difficult economic situations, have to calculate prices, costs, and budgets quite often. During the interviews, we learned that adults with low income usually calculate quite frequently but do not use any technical devices for these calculations. The observation of frequent numeracy practices appears plausible from the specific contexts of economic constraints. However, it forms a contrast to the general connection between competencies, income, and practices. This article takes up this question and examines whether we can confirm the results of the nonrepresentative local study using data of the representative study Programme for the International Assessment of Adult Competencies (PIAAC).
PIAAC generally shows a positive correlation indicating low numeracy (or literacy) skills correlate with low numeracy (or literacy) practices (Organisation for Economic Co-operation and Development [OECD, 2013]). However, does this hold true for different subgroups? Does it hold true for all aspects of numeracy practices?
We will first take up the state of research on numeracy, which is quite underresearched compared with literacy. We then define certain social groups as vulnerable subgroups, which are not necessarily economically excluded, but face a high risk, thus being vulnerable to exclusion.
Review of Literature
Adult Numeracy
Research on adults with low literacy and numeracy skills has a long tradition. Bynner and Parsons (2005) show that low numeracy among other effects increases the risks of unemployment and low income. Several questions arose around the lives of low-skilled adults, focusing their stigma (Beder, 1991). Meanwhile, Belzer and Pickard (2015) revisited the problem of stigma and stereotypes and received much attention on the question of stereotypes that even scholars (re)produce.
For a better acknowledgement of diverse practices, authors from the “New Literacy Studies” (Street, 2003) claim that literacies and numeracies should be considered pluralistic, diverse, and local (Barton & Hamilton, 1998). Street (2005) suggested “applying new literacy studies to numeracy as a social practice” (see also Yasukawa, Rogers, Jackson, & Street, 2018).
This article uses data from PIAAC on numeracy skills and practices. By taking into account the PIAAC assessment data, we implicitly accept that numeracy skills could be measured by assessments. This position relates to what Street described as an autonomous model of literacy (Street, 1995). By analyzing numeracy practices, we as well widen this narrow concept and refer to discussions on literacy and numeracy practices intending to open the view on everyday practices.
For this analysis, we use the PIAAC definition for numeracy. This is “the ability to access, use, interpret and communicate mathematical information and ideas, in order to engage in and manage the mathematical demands of a range of situations in adult life” (OECD, 2012, p. 33; see also OECD, 2016).
Numeracy Practices
In both fields—numeracy and literacy—little attention is given to practices. However, the discussion on practices goes back to the 1980s. Lave and Wenger (1991) developed a theory of learning that does not focus the individuals’ competences but understands humans as social beings and thus learning in and for belonging to communities of practice (see also Barton & Tusting, 2005). This became one of the roots for studies on situated literacies (Barton & Hamilton, 2003) and on literacy practices (Reder & Davila, 2005; Thériault, 2016; Zeuner & Pabst, 2011). Further discussion of numeracy (Gal et al., 2009) brought the early and famous works by Lave (1988) and her Adult Math Project back into the discussion on defining numeracy as a competence domain for PIAAC. Numeracy practices can be defined as the use of competences in a given context—or numerate environment (Evans, Yasukawa, Mallows, & Creese, 2017). These scholars prepared the ground for recent research with skill uses. The skills use questions in PIAAC do not precisely operationalize the approach of literacy and numeracy practices, but serve as a fair proxy. Low proficient adults do not merely stop using their low skills (Grotlüschen, Reder, Mallows, & Sabatini, 2016). Reder (1994) suggested a practice-engagement theory pointing out that there are strong relationships between skills and practices in a certain domain. However, he urges caution when it comes to formulating causalities. He suggests the term of embedded practices (Reder, 2017).
Evans (2017) suggests distinguishing between simple and advanced numeracy practices within the set of variables from PIAAC (see also Perry, Helmschrott, Konradt, & Maehler, 2017).
Northcote and Marshall (2016) discuss results of the Australian Everyday Mathematics Project. They point out that one of the biggest proportions of every mathematical activities relate to financial aspects, and that the majority of mathematical activities tends to be simple or quite simple tasks. According to the study, almost 90% of the mathematical activities are mental calculations. Calculators are only rarely used (Northcote & Marshall, 2016).
In sum, we see that general correlations between skills and practices might suggest that certain population subgroups only rarely use their numeracy skills in daily life. More examination is necessary to show if all or only some numeracy practices follow this general correlation.
Vulnerable to Exclusion: Population Subgroups
Vulnerability is a terminology that differentiates a common dichotomy of inclusion and exclusion. This dichotomy has widely been discussed from different perspectives (Bourdieu, 2007; Luhmann, 2015; Young, 2010). Inclusion implies access to cultural and economic resources. On the contrary, exclusion means the denial or limitation of this access to resources. Like Castel (2000) points out, exclusion should not be referred to as a dichotomy but as a continuum. The concept of vulnerability refers to this idea of a continuum of inclusion and exclusion. The core difference is that people are not only excluded or included, but that an in-between group is vulnerable to exclusion.
The interpretation of vulnerability is highly relevant. In case low skills correlate with exclusion, this is a strong call for action for policy makers. In case all adults performing at low literacy levels are seen as excluded, this is a strong stereotype against low-skilled adults. The next two paragraphs present findings from both perspectives and offer the theory of vulnerability for further exploration.
First, international large-scale assessments like PIAAC (OECD, 2013, 2016) report proficiencies of population subgroups by sociodemographic categories as well as socioeconomic status (Kastner & Schlögl, 2014; Rammstedt, 2013) and point at economic and social exclusion of low-skilled adults. PIAAC shows that adults with low basic skills are more likely to be unemployed and more likely to work in low-income jobs (OECD, 2013). A number of national basic skills surveys report similar results (Agence Nationale de Lutte contre l’Illettrisme, 2005; Bynner & Parsons, 2005; Department for Business, Innovations and Skills, 2011; Grotlüschen & Riekmann, 2011). Still there is a distinction between being unemployed and having lower skill levels. Being unemployed can go hand in hand with low basic skills but low skills and unemployment are not equivalent.
Second, in-depth analyses suggest that even though some subpopulations show low proficiency in numeracy or literacy, they still do participate in the labor market and use their low competences quite regularly (Grotlüschen et al., 2016). Stereotypes about low proficiency and social exclusion partly stem from media reports (Hamilton, 2012) but surveys do not confirm them (Grotlüschen, Riekmann, & Buddeberg, 2015). Still the risk of exclusion is higher than the risk of those with higher literacy or numeracy competences (Grotlüschen et al., 2016).
Third, this results into a paradox. The majority of a certain subpopulation is socially and economically included, while the risk of exclusion is still high, compared with other subpopulations. To capture this paradox, we suggest using the term vulnerability. Vulnerability does not claim that majorities of vulnerable subpopulations are excluded, while it still points at the danger they could more easily become excluded than others do. The term vulnerability stems from medical and psychological sciences (Shi, Stevens, Lebrun, Faed, & Tsai, 2008). However, vulnerability also became a term to identify other at-risk groups by their living conditions: The complete transposition of the concept into a social context sees selected livelihoods, such as the ability to earn a living or to participate in socio-cultural life, as an object of endangerment, as in the case of health. For example, poorly qualified people are vulnerable to unemployment; those living alone are vulnerable to social isolation and so on. (Streich, 2009, p. 303, translated by the authors)
Among definitions of vulnerable groups, Streich (2009) reports financial problems and unemployment and housing problems. He interprets the term vulnerability as different from socioeconomic status or social inequality, because it contains an ethic responsibility to protect vulnerable people (Streich, 2009).
For this article, we define groups, which carry features of economic vulnerability. These groups are adults with low proficiency in numeracy, unemployed adults, long-term unemployed, and overly indebted or homeless adults. We assume that financially vulnerable subgroups have to handle financial decisions carefully. They may even have to calculate more often than wealthier subpopulations. Economic vulnerability has far-reaching ramifications for those affected. These persons face the risk of economic exclusion due to poverty, cultural exclusion due to stigmatizing reactions, social exclusion due to isolation and the loss of supporting network connections, and institutional exclusion primarily from institutions in the social, educational, and health sectors (Cutter, Boruff, & Shirley, 2003). The reciprocal effects of these forms of exclusion increase their vulnerability (Böhnke, 2015).
Several aspects of economic vulnerability appear in countries, which participated in PIAAC. Unemployment is low in Germany compared with the 2000s (6.1% in 2016; DESTATIS, 2017). Long-term unemployment, however, has stayed stable (Bonna, 2015). Unemployment is one of the main causes for overindebtedness (Bouyon & Musmeci, 2016). Unemployment and income levels below the poverty line as well as separation and disease count among the primary causes for overindebtedness in 46% of cases, while consumer behavior, housekeeping, or general lack of knowledge in financial matters are of secondary importance (Ulbricht, 2016). Homelessness is also primarily a socioeconomic problem and is, if at all, only indirectly traceable to a lack in numeracy. Increases in homelessness occur in Denmark, France, Germany, Ireland, Italy, the Netherlands, and New Zealand in the past couple of years, whereas levels in Finland and the United States, for example, lowered (OECD, 2017). The primary factors for this development are rising poverty and rising rental levels, which marginalize the young, the families with children, and migrants (Serme-Morin, 2017).
In sum, economic vulnerability is rising in several countries. The danger of stereotypes is still given and reproduced (Belzer & Pickard, 2015; Hamilton, 2018). One stereotype would claim that economically vulnerable adults seldom apply numeracy practices for budgeting and thus would be responsible for their economic failure (Butterwegge, 2015). Recent data sets allow deeper examination of this claim.
Research Questions: Vulnerable Subgroups and Numeracy Practices
In our local nonrepresentative study on homeless and overly indebted adults, it became obvious that this specific vulnerable subgroup frequently applies certain numeracy practices, namely calculating prices, costs, and budgets. This observation forms a contrast to the general observation that low basic skills correlates with low practices (OECD, 2013; Reder, 2017). It also forms a contrast to stereotypic images of this subpopulation that characterize them as passive people who do not actively deal with their economic situation. This leads to the research questions:
Do adults with low numeracy skills use numeracy practices less or more often than adults with average skills? Does the pattern change when the index of six numeracy practices is split into the six individual numeracy practice questions, especially into the three simple practices and the three advanced numeracy practices?
Do economically vulnerable adults (unemployed, long-term unemployed, and overly indebted or homeless) apply the numeracy practices less or more often than the population averages?
How frequent is the use of technical devices among these economically vulnerable subgroups?
Method: PIAAC Plus Local Sample of Overindebted and Homeless Adults
Data Collection
The article draws on data from two sources. The first is the German scientific use file (n = 5.465; Montalvan & Lemay, 2016) from the first round of the Survey on Adult Skills (PIAAC), collected in 2011/2012. Calculations regarding the OECD average use the public use files. PIAAC assesses numeracy skills and defines levels of competencies reaching from very high (Level 5) to very low (Level 1 and below). The survey includes background information such as age, gender, formal education, employment and income, and skill uses.
The second source of data is a nonrepresentative sample of overindebted or homeless adults from a local study with receivers of social benefit in Germany (n = 68). Half of the sample require advice concerning overindebtedness; the others search for advice concerning housing problems, general social problems, or migration. This sample answered some of the questions on numeracy practices taken from PIAAC. The interviews were paper based. During the interviews, it became obvious that overindebted or homeless adults use certain numeracy practices quite often but usually lack technical devices (especially computers and spreadsheet software) supporting these calculations.
Method
We used two groups of variables. The first group describes vulnerable subpopulations
Low skilled: Numeracy skills define adults with low numeracy (Level 1 and below) as vulnerable subgroup (low skilled).
Unemployed: The job status variable distinguishes employed from unemployed. This definition grounds on the relationship between employment and income (Variable: C_D05grp).
Long-term unemployed: In Germany, a period of unemployment longer than 12 months indicates long-term unemployment, which implies a decrease in the amount of social transfers. Therefore, we used the derived variable defining person neither employed or looking for work nor in education in the 12 months preceding the survey to describe the group of long-term unemployed (Variable: NEET).
Overindebted and/or homeless. Overindebted and homeless form the entire local sample, n = 68.
The selection of these groups follows the pattern of an escalation of vulnerability. (a) Statistically speaking, many low-skilled adults receive low incomes. (b) Unemployment results into temporary exclusion from full income. According to the definition applicable to Germany, (c) long-term unemployed are exposed to this situation for more than 12 months. Benefit payments are strongly limited after 1 year of unemployment. (d) Overindebtedness and homelessness are visible indications that a serious financial burden has been effective for a longer period.
We decided not to analyze the interrelation of numeracy practices and monthly income. On the first glance, this variable should serve well defining an economically vulnerable subgroup. The variable in PIAAC however relates to personal monthly income and not to household income. This would mean for instance that even highly educated women might achieve only a low personal monthly income due to gender-related work structures while possibly being part of an average or high-income household.
The second group of variables consists of six PIAAC skill use variables in daily life and the corresponding index of numeracy at home (NUMHOME) derived from these variables. 2 At home in this case means that the numeracy practices are performed outside of work. We especially focused on two out of these variables, because they are highly relevant for low-income and low-skill subpopulations: the frequency of calculating prices, costs, and budgets and the frequency of using a calculator (either handheld or computer based).
Frequency of calculating prices, costs, or budgets (Variable: H_Q03b). According to the observations drawn from the local study, the application of this practice might be higher among the vulnerable subgroups.
Frequency of the use of a calculator 3 —either handheld or computer based (Variable: H_Q03d). Interviewees reported a rare use of computer software supporting these calculations, partly due to economic reasons.
To answer the corresponding questions, PIAAC offered a 5-point frequency scale
Never (1)
Less than once a month (2)
Less than once a week but at least once a month (3)
At least once a week but not every day (4)
Every day (5) (more detailed: Reder, 2017).
In the German PIAAC sample, the means for the variables concerning the use of numeracy skills at home reaches from 1.28 to 3.49 with standard errors reaching from 0.01 to 0.13. Some of the advanced practices are rarely used by anyone, regardless of skills or occupational situation.
Analyses of the PIAAC data set were executed using R (international survey package) and with the IDB Analyzer. Both ensure the correct application of plausible values, weights, and the correct merging of national data files.
The objective of this article is describing vulnerable subgroups concerning their life situations and their numeracy practices. Therefore, mainly descriptive analyses and cross-tabulations have been executed. Statistical significances were calculated when comparing the vulnerable subgroups with their contrast groups (e.g., unemployed vs. employed; low-skilled vs. high-skilled). Standard errors are reported in all tables. Significant differences of means are noted in the text.
Findings: Vulnerable Subgroups and their Numeracy Practices
We started to analyze the interrelation of numeracy practices and numeracy skills (low skills). In a second step, we proceeded to analyzing interrelations of numeracy practices and economic vulnerability (unemployment, long-term unemployment, homelessness, and overindebtedness).
Low Skills and Numeracy Practices
We related numeracy practices at home with the PIAAC levels of numeracy skills. Table 1 presents numbers for selected variables. Findings for all variables on skill use are presented in Table A1 (see the appendix). On OECD average like on German average, we can distinguish between practices that are more or less frequent. Among the frequent practices are “using a calculator” (OECD average: 2.82 on a scale from 1 [never] to 5 [every day]), “calculating prices, costs, or budgets” (2.79), “use or calculate fractions or percentages” (2.20), and “using simple algebra or formulas” (2.03). According to Evans (2017), we define these variables as simple numeracy practices. “Using advanced math or statistics” (1.25) and “preparing charts, graphs, or tables” (1.42) appear less frequently on a general base. We define these variables as variables on advanced numeracy practices.
Frequency of Selected Numeracy Practices by Numeracy Levels.
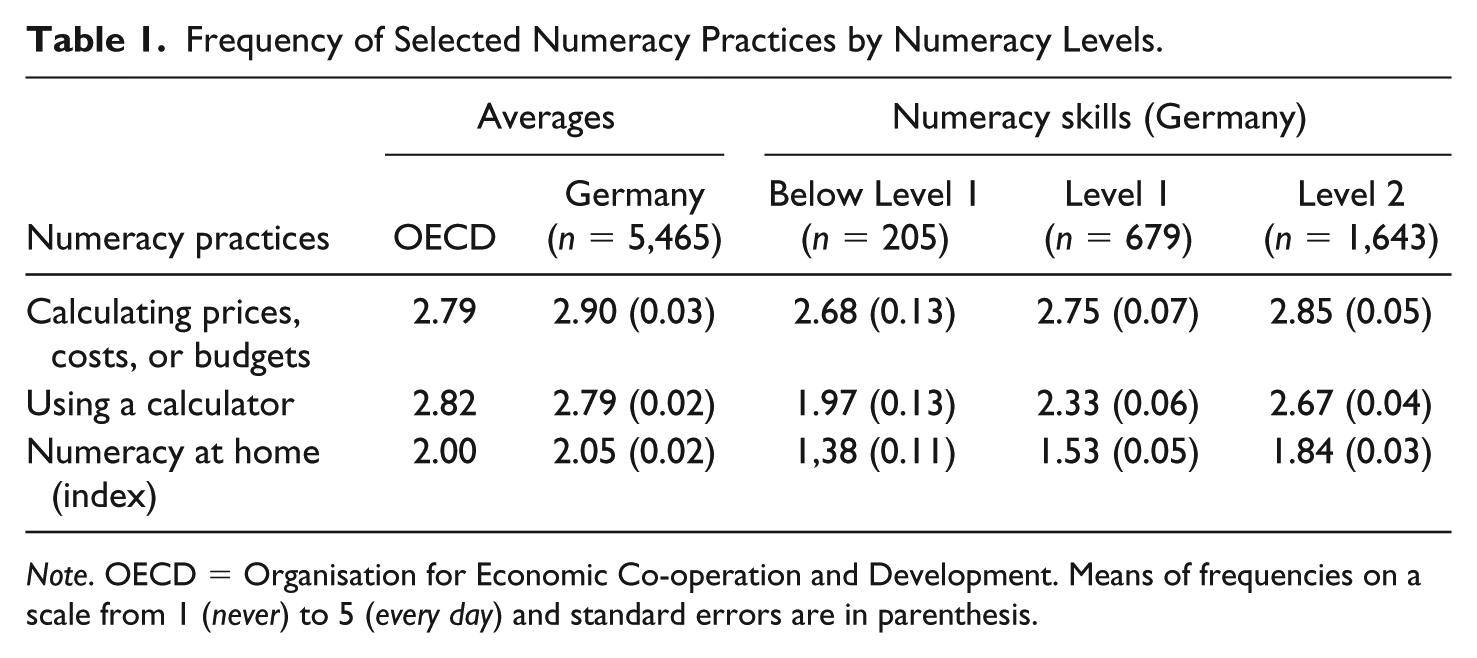
Note. OECD = Organisation for Economic Co-operation and Development. Means of frequencies on a scale from 1 (never) to 5 (every day) and standard errors are in parenthesis.
The index for numeracy use at home (NUMHOME) and all single variables show a negative correlation with the level of skills. This general correlation was reported earlier (OECD, 2013). The correlation is stronger for the variables regarding advanced numeracy practices. Adults with numeracy skills on the lowest levels (Level 1 and below) hardly ever apply these practices. Table A1 shows a strong and significant increase of frequency with higher numeracy levels.
Simple numeracy practices are more common among adults with low numeracy skills. This is particularly evident for the variable “calculating, prices, costs, and budgets.” The differences in frequency between those with numeracy skills on Level 1 or below compared with numeracy Level 2 are statistically nonsignificant. Calculating prices, costs, and budgets is the practice with the highest mean of frequency on the lowest numeracy levels (below Level 1: 2.68). Like other practices, the frequency increases with higher numeracy skills. However, increase is very flat. Even adults with very low numeracy skills calculate prices, costs, and budgets quite regularly.
One possible explanation of these particular results might be that the variable about calculating prices, costs, and budgets shows very little variance related to skills and therefore offers only low discrimination. It might therefore not be suitable for comparing subpopulations. We would chose a second interpretation: The variable shows that adults with low numeracy calculate quite often. But they do not calculate more often than higher numerate adults. This might be due to the fact that low numeracy skills have some correlation with income (OECD, 2013) but they are not a valid indicator for income. To discuss the interrelation between economic vulnerability and numeracy practices in a second step, we focused on the remaining three subgroups. These are unemployed, long-term unemployed, and overindebted and homeless.
Unemployment, Long-Term Unemployment, Debt and Homelessness, and Numeracy Practices
In this section, we relate calculating prices, costs or budgets to the economically vulnerable subgroups. Table 2 represents the frequency of the two selected numeracy practices of the vulnerable subgroups defined above (“calculating prices, costs, and budgets” and “using a calculator”) and the index for numeracy practices at home (NUMHOME) as well as the skill use of the OECD average and the German average. The results for the vulnerable subgroups refer to the German PIAAC data set. Table A2 (see the appendix) shows the figures for all available variables concerning numeracy practices at home.
Frequency of Selected Numeracy Practices by Vulnerable Subgroups.
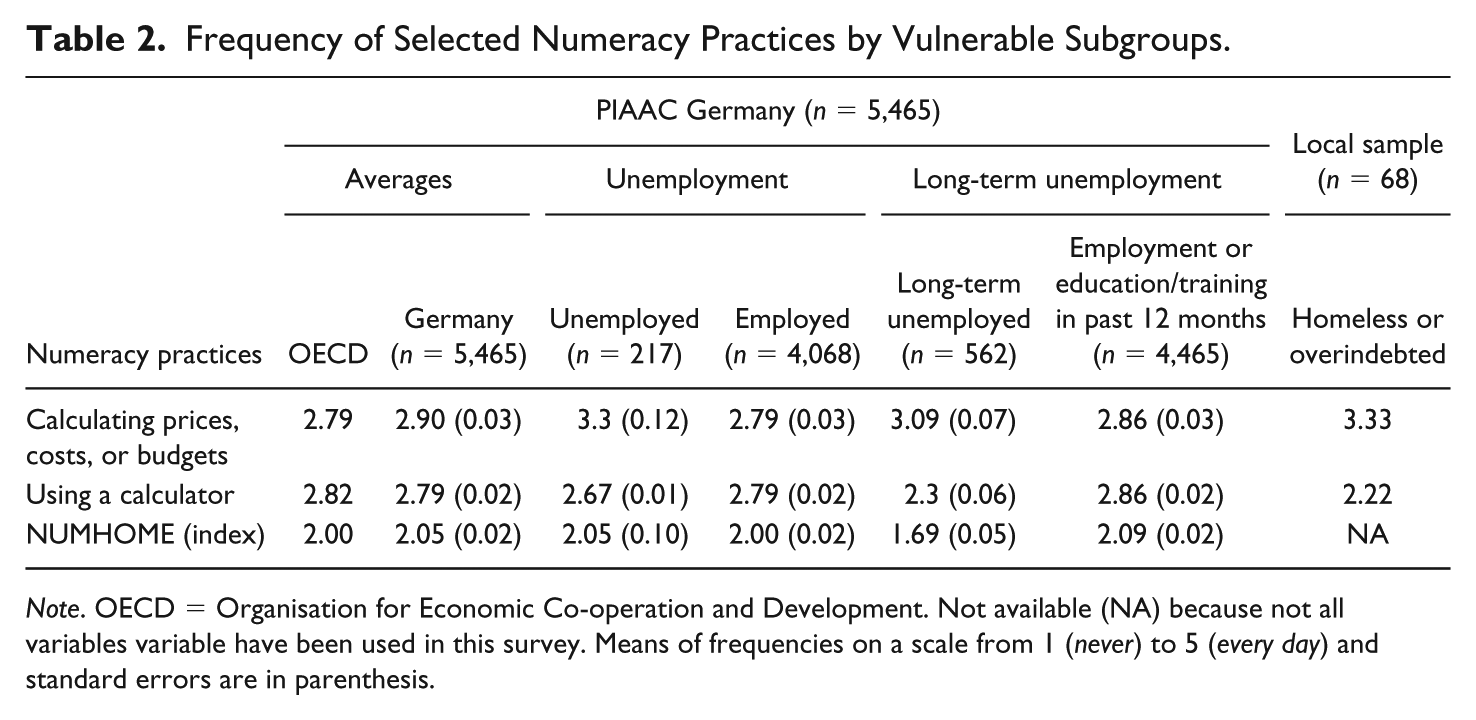
Note. OECD = Organisation for Economic Co-operation and Development. Not available (NA) because not all variables variable have been used in this survey. Means of frequencies on a scale from 1 (never) to 5 (every day) and standard errors are in parenthesis.
The use of simple numeracy practices appears less among the vulnerable subgroups compared with the corresponding contrast group (e.g., unemployed vs. employed). The only exception is “calculating prices, costs or budgets.” Compared with the German average of the use of this practice (2.90) all vulnerable subgroups show more frequent use of calculating costs and budgets (except adults with low numeracy as discussed above).
The presentation of results concerning the vulnerable subgroups follows the escalating pathway from (a) temporary unemployment, (b) long-term unemployment, (c) to overindebtedness and homelessness.
(a) Currently unemployed adults calculate costs or budgets significantly more often (3.3) than employed (2.79).
(b) Long-term unemployed as well significantly more often (3.09) calculate costs or budgets compared with those in employments or in education during the preceding 12 months (2.86). The difference, however, is smaller than in the case of temporary unemployment.
(c) Overindebted and homeless showed the highest mean of all vulnerable subgroups concerning calculating costs or budgets (3.33). Although we cannot directly compare the means of the two different samples, a high mean of calculating costs or budgets can be reported. Under the conditions of high debt and homelessness, budgeting appears most often.
We conclude that this particular practice is more relevant for vulnerable subgroups than for the population in general. It therefore deviates from the usual pattern (low skills leading to low practices). Calculating prices, costs, or budgets is a numeracy practice, which is more relevant for adults with a low income than for wealthier adults. Accordingly, people with low income calculate more often due to their lower income flexibility.
The third research question refers to the use of technical devices. During the data collection of the local survey about overindebted and homeless, we not only observed the high frequency of calculating prices, costs, and budgets but also the fact that the interviewees not very often use technical devices. This included as well handheld calculators as computer software facilitating calculations. If this observation could be supported by the representative data set (PIAAC), one might conclude that vulnerable subgroups are forced to calculate in daily life very often but at the same time do not facilitate these calculations by the use of technical devices like calculators or spreadsheet software.
Using a calculator belongs to the simple numeracy practices. We decided to use “using a calculator” as a proxy for use of technical devices. Compared with “calculating prices, costs, and budgets” the trend for “using a calculator” is in the opposite direction. All vulnerable subgroups use calculators less often than the average populations in the countries participating in PIAAC (mean = 2.82) or in Germany (mean = 2.79). There are also significant differences between the vulnerable subgroups and their corresponding comparison groups.
(a) Adults who are temporarily unemployed use calculators less often than those who are currently employed. Their mean for the use of calculators is 2.67. The difference to employed adults (2.79) is statistically significant.
(b) Within the group of long-term unemployed, the use is less frequent (2.3) compared with persons who have been employed or in education training during the 12 months preceding the survey (2.86). The difference between the two groups is statistically significant.
(c) An even lower mean relates to homeless and overindebted adults from the local sample (2.22).
Here the results follow the escalating pathway of the vulnerable subgroups. Among the subgroups the currently unemployed have the highest mean of frequency (2.67), the mean among long-term unemployed is lower (2.3) and among overindebted and homeless it is lowest (2.22).
These three subgroups as well as adults with low numeracy (numeracy Level 1 or below) show that even if we can report a high degree of daily calculations of prices, costs, and budgets these calculations are not necessarily supported by the use of calculators. We conclude that the tighter the budgets are the more budgeting takes places. The tighter the budgets are the lower the use of technical devices.
Discussion and Desiderata
Based on the results presented above, we can answer the research question about selected numeracy practices of vulnerable subgroups. In the local survey among overindebted and homeless adults, we observed that many of them calculate frequently in everyday situations. They are forced to budgeting by their economic situation. PIAAC as a representative source of data supports this observation. PIAAC shows the general correlation between skills and practices when looking at all numeracy practices combined to an index variable (NUMHOME). In other words, the index of numeracy practices at home offered by PIAAC is in line with expectations. Looking at the single variables, we can highlight “calculating prices, costs, and budgets.” This single practice appears to be more relevant for adults in tense financial situations than for wealthier adults. Budgeting is not index-compliant, as certain vulnerable subgroups perform this practice even more frequently than the average. We conclude that it is worth analyzing PIAAC data beyond the index variables. The index variables show a valid overall picture but casualties described by individual variables might get out of sight when only relying on the indexes.
The interpretation of the results suggests that overindebtedness and homelessness, (long-term) unemployment and low numeracy proficiency imply the risks to low budgets and thus a high need of control with low access to technical devices. In sum, evidence indicates that vulnerability consists in low income over a long time, possibly (but not necessarily) leading to debt and loss of home and very tight budgets. Low numeracy proficiencies increase vulnerability to unemployment and unemployment in turn increases the vulnerability to extremely low budgets.
We defined the vulnerable subgroups following an escalating pathway from adults with low numeracy over unemployed and long-term unemployed to overindebted and homeless. Budgeting is in fact most frequent at the most disadvantaged end of this pathway. Overindebted adults calculate costs and budgets most frequently. Following the model of escalating financial tension, one should assume more budgeting among long-term unemployed than among short-term unemployed. In this particular case, however, the situation is reverse. Those who have entered unemployment for less than 1 year calculate more frequently. We suggest that this group faces a change in employment status and therefore has to find orientation in the new situation by more frequent budgeting.
The frequency of numeracy practices however cannot be predicted by single variables alone. There are obviously a whole series of factors that are not statistically represented in the data set. It therefore makes sense to use Reder’s term embeddedness. Embeddedness describes that competences and practices are connected but that there is no monocausal relationship (Reder, 2017).
Referring to the theoretical framework of PIAAC numeracy Evans (2017) suggested differentiating between simple and advanced numeracy practices. We reconnect this to practice-engagement theory (Reder, 1994). This appears to be in line with the results of Northcote and Marshall (2016). According to the Everyday Mathematics Project, most of the daily mathematic activities also can be indicated as simple practices.
Three economically vulnerable subgroups (currently unemployed, long-term unemployed, and homeless and overindebted) already have to get along without job or housing. They are still making use of their numeracy practices. All vulnerable subgroups use simple numeracy practices for monitoring their tight budgets. Many of them make little use of technical devices supporting their budgeting as shown by data about using calculators. We suppose that they have little access to technical devices due to their economic situation, although this cannot be drawn from the PIAAC data themselves. Northcote and Marshall (2016) report low use of calculators compared with written and most of all mental calculations.
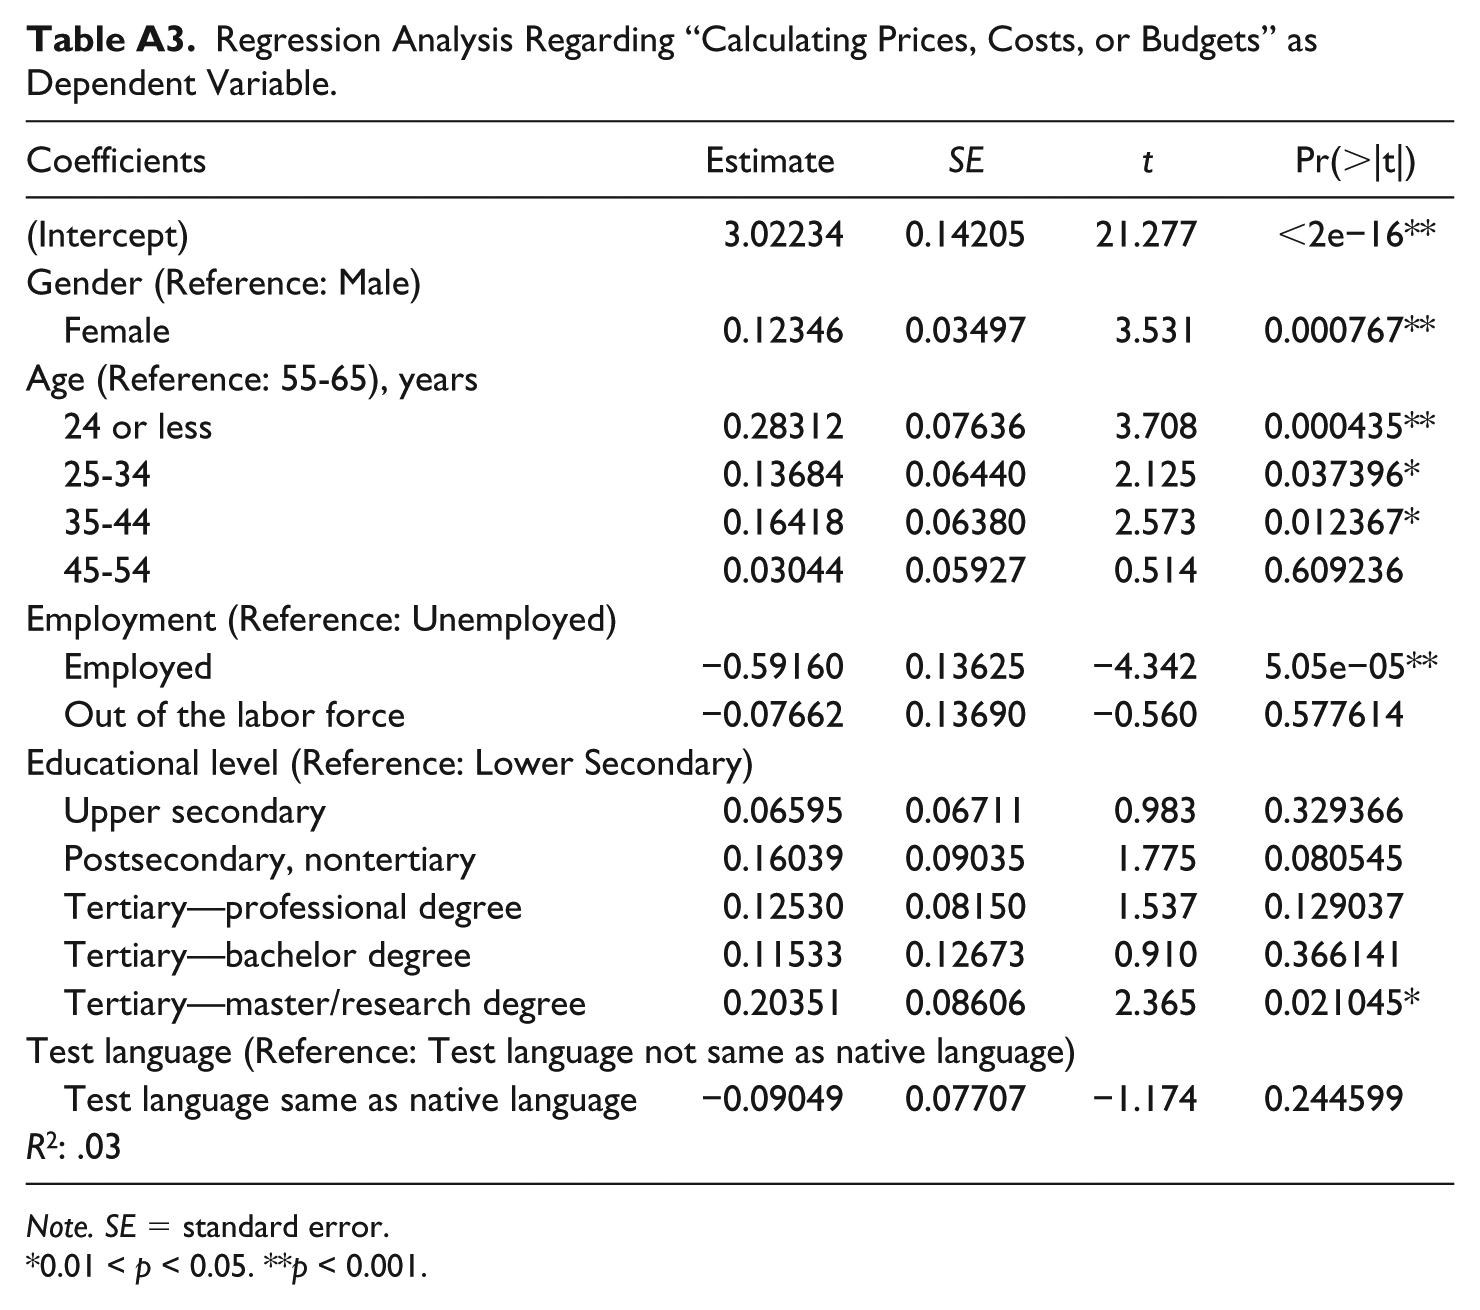
Further analyses would strengthen the findings. The overlap between (a) low numeracy skills, (b) unemployment, (c) long-term unemployment, and (d) overindebtedness and homelessness may be substantial. Multivariate analyses would be of high interest. A first glance shows a strong and significant effect of employment and smaller but significant effects of gender and age (Table A3, see the appendix).
Conclusions
Common stereotypes about low-skilled adults portray them as a uniform group of adults dependent from assistance and help (Belzer & Pickard, 2015). In addition, they are often attributed the responsibility for their financial situations because they would not care enough about the situation.
PIAAC reported a general correlation of low skills with low practices (OECD, 2013). Regarding numeracy practices, this holds true for the index variable on numeracy practices at home (NUMHOME) and for most of the single variables, especially the variables on advanced numeracy practices. Out of the analyzed PIAAC variables, “calculating prices, costs, and budgets” forms the only exception. This variable, however, is of importance for answering the question, if people living in difficult economic circumstances (unemployment, long-term unemployment, homelessness, overindebtedness) care for their situation. Based on the results presented above, we would argue that frequent budgeting is one indicator for taking responsibility for the situation. This contradicts the statement that the lack of self-responsibility is responsible for the financial problems. Vulnerable subgroups need to monitor their tight budgets even more often than the wealthier subgroups. The variable, however, only says that comparing prices can be a daily practice. It does not inform whether the practice comes to a correct result.
Following the interpretation of Belzer and Pickard (2015) adults with low numeracy do not necessarily represent “heroic victims” dependent from help and assistance. Instead, they might as well represent the “competent comrade.” The data presented here show that one should be careful not to blame the victim. Being homeless, being overindebted, living on social benefit, or generating very low income is not necessarily a result of too little numeracy or financial literacy. It could also be seen as the result of (very) low incomes, personal crises and personal upheavals, or of the complexity of liberalized consumer markets.
Vulnerable groups, which are often blamed for being responsible for their economic situations, in fact take care of their situations by frequent calculations in daily life. This is true as well for adults with low numeracy at least regarding simple numeracy practices. Vulnerable groups like those defined for this article show numeracy practices in their daily lives. It is important to record this fact, because numeracy is not just mathematics (Gal & Tout, 2014; Yasukawa et al., 2018). Numeracy is an important aspect for participation and for being critical. Numeracy is relevant for scrutinizing what companies want to sell (with complicated contracts), what politicians want to tell (with complicated budgets), or what media produce (with complicated statistics). This implies some critical views on the world: “That is why we can say that numeracy is not less than math but more. It is why we don’t need to call it critical numeracy—being numerate is being critical” (Tout, 1997, p. 13, see also Geiger, Goos, & Forgasz, 2015, p. 535).
We have shown that some numeracy practices are part of the daily lives of people living in difficult economic situations. To achieve critical competences, however, education remains necessary. Welfare states carry a responsibility for enabling adults to increase or preserve their numeracy skills. This is consistent with Streich’s notion of an ethic responsibility (Streich, 2009) to protect vulnerable groups. Educational planning should as well focus on vulnerable groups, because—like Cutter et al. (2003) point out—they face institutional exclusion in the social, educational, and health sectors.
Footnotes
Appendix
Regression Analysis Regarding “Calculating Prices, Costs, or Budgets” as Dependent Variable.
| Coefficients | Estimate | SE | t | Pr(>|t|) |
|---|---|---|---|---|
| (Intercept) | 3.02234 | 0.14205 | 21.277 | <2e−16** |
| Gender (Reference: Male) | ||||
| Female | 0.12346 | 0.03497 | 3.531 | 0.000767** |
| Age (Reference: 55-65), years | ||||
| 24 or less | 0.28312 | 0.07636 | 3.708 | 0.000435** |
| 25-34 | 0.13684 | 0.06440 | 2.125 | 0.037396* |
| 35-44 | 0.16418 | 0.06380 | 2.573 | 0.012367* |
| 45-54 | 0.03044 | 0.05927 | 0.514 | 0.609236 |
| Employment (Reference: Unemployed) | ||||
| Employed | −0.59160 | 0.13625 | −4.342 | 5.05e−05** |
| Out of the labor force | −0.07662 | 0.13690 | −0.560 | 0.577614 |
| Educational level (Reference: Lower Secondary) | ||||
| Upper secondary | 0.06595 | 0.06711 | 0.983 | 0.329366 |
| Postsecondary, nontertiary | 0.16039 | 0.09035 | 1.775 | 0.080545 |
| Tertiary—professional degree | 0.12530 | 0.08150 | 1.537 | 0.129037 |
| Tertiary—bachelor degree | 0.11533 | 0.12673 | 0.910 | 0.366141 |
| Tertiary—master/research degree | 0.20351 | 0.08606 | 2.365 | 0.021045* |
| Test language (Reference: Test language not same as native language) | ||||
| Test language same as native language | −0.09049 | 0.07707 | −1.174 | 0.244599 |
| R2: .03 | ||||
Note. SE = standard error.
0.01 < p < 0.05. **p < 0.001.
Declaration of Conflicting Interests
The author(s) declared no potential conflicts of interest with respect to the research, authorship, and/or publication of this article.
Funding
The author(s) received the following financial support for the research, authorship, and/or publication of this article: Hamburg Research Authority, Funding Grant: LFF-FV52.