
Abstract
This study investigates the relationship between racial segregation and housing market outcomes in depopulating cities, focusing on Cleveland, OH (1986–2021). Findings reveal that moderately integrated neighborhoods with high Black isolation maintained stable values, while highly segregated areas experienced sharp declines, intensifying post-2008 in low- and medium-income areas. High-income segregated neighborhoods showed resilience, highlighting income-based disparities in market dynamics. These findings emphasize the need for income-sensitive, racially inclusive housing policies to counteract segregation’s negative effects and support equitable revitalization in shrinking urban contexts.
Introduction
Urban planners and policymakers increasingly acknowledge the importance of understanding and addressing the challenges facing shrinking cities, particularly those confronted with sustained population loss and economic decline. More than half of the urban areas in developed nations are experiencing some form of depopulation, notably in Europe, North America, and East Asia (UN-Habitat 2022). In the United States alone, 35 percent of cities with populations over 10,000 are classified as shrinking, exhibiting marked demographic and economic distress (Hartt 2019). These conditions are often characterized by heightened poverty rates, crime, and limited fiscal capacities—factors that constrain a city’s ability to maintain critical services and infrastructure, thereby exacerbating cycles of urban distress (Manville and Kuhlmann 2016).
Shrinking cities also present complex demographic dynamics. Economic restructuring, suburbanization, declining fertility rates, aging populations, and the out-migration of younger residents all contribute to persistent population decline (Lauf, Haase, and Kleinschmit 2016; Olsen 2013; Wirth et al. 2016). In many instances, these trends intersect with enduring racial segregation, which can deepen spatial inequalities and intensify localized socioeconomic disparities (Fol 2012). Cities such as Cleveland and Detroit exemplify how racial factors have historically shaped housing abandonment, vacancy proliferation, and neighborhood disinvestment (Bentley et al. 2016; Ehrenfeucht and Nelson 2013).
Despite these distinctive circumstances, existing urban planning literature remains predominantly oriented toward growth-centered paradigms—such as Logan and Molotch’s growth machine model (Logan and Molotch 1987)—that focus heavily on phenomena like gentrification and displacement. Such perspectives may overlook the particular realities faced by shrinking cities, including how structural segregation operates differently in contexts of prolonged depopulation. Consequently, limited research has explicitly explored how racial segregation shapes neighborhood desirability, specifically measured by housing prices, within shrinking urban environments. Understanding why certain neighborhoods maintain appeal while others experience ongoing decline in the context of racial composition and spatial patterns of segregation is especially critical (Clark 1986; Nijman and Wei 2020).
To address these gaps, this study explicitly investigates how neighborhood-level racial segregation relates to residential preferences—interpreted here through the lens of housing transaction prices—in a shrinking urban setting. Using Cuyahoga County, OH, the home of Cleveland, as a representative case, the analysis draws on housing transaction data from 1986 through 2021 and neighborhood demographic and socioeconomic characteristics from 1990, 2000, 2010, and 2020. Local spatial entropy-based diversity indices and isolation-exposure measures capture nuanced segregation patterns, distinguishing various neighborhood segregation scenarios and their relationships with housing market trajectories.
This research employs a hedonic pricing framework, interpreting housing prices as market reflections of household preferences influenced by neighborhood racial composition and socioeconomic contexts, without implying direct causal relationships. Importantly, this study critically reassesses conventional interpretations of stable or rising housing prices in affluent, racially homogeneous neighborhoods as straightforward indicators of resilience. Rather, it suggests that such market stability may partly reflect structural factors, including exclusionary practices embedded in restrictive zoning, and historically racialized perceptions of neighborhood value (Galster 2012; Rothstein 2017).
Furthermore, by comparing segregation dynamics observed in shrinking cities with those documented in more growth-oriented urban contexts, this study contributes to an emerging discussion on how spatial inequalities persist or evolve under conditions of sustained depopulation. It emphasizes the importance of context-sensitive policy approaches that acknowledge historical patterns of exclusion and encourage equitable revitalization and inclusive neighborhood change.
While urban-segregation research has emphasized growing urban contexts, this analysis contributes to a broader understanding of how entrenched spatial inequalities are reflected in housing-market patterns specifically in shrinking cities—a topic that remains comparatively less examined.
The paper proceeds by reviewing relevant literature on urban shrinkage, racial segregation, and housing market processes, particularly highlighting how traditional neighborhood-change models require reconsideration under sustained depopulation. The methodology section then details the spatial segregation metrics and hedonic regression approach. Finally, empirical findings elucidate complex interactions between local segregation patterns, neighborhood desirability, and residential market behaviors, offering targeted policy implications for equitable revitalization in shrinking cities.
Urban Shrinkage and Neighborhood Change
Urban shrinkage refers to a sustained process of population loss and economic decline that leads to increased housing vacancies, economic distress, and lower urban quality of life (Park et al. 2021). Two primary drivers have been identified in the literature: migration-driven population shifts, and absolute population decreases resulting from low birth rates and aging populations (Lauf, Haase, and Kleinschmit 2016; Wirth et al. 2016). In the United States, out-migration is often influenced by factors like economic restructuring, suburbanization, and natural disasters, whereas absolute population decline is more prevalent in countries undergoing demographic transitions, such as Germany, Japan, and Korea.
Conceptual perspectives from urban sociology and economics offer insight into the dynamics of urban shrinkage and neighborhood change. A key framework is the invasion and succession model, rooted in human ecology, which was developed by Park and Burgess (1925). This model views demographic change in neighborhoods through an ecological lens, proposing that new demographic groups “invade” and eventually succeed existing populations. Park (1952) further suggests that neighborhoods develop unique social systems, with residents drawn to communities that mirror their own backgrounds (Useem, Useem and Gibson 1960). These preferences reinforce patterns of spatial segregation and shape demographic stability or shifts within urban neighborhoods.
However, the invasion-succession model, which assumes an orderly transition of populations, does not capture the dynamics unfolding in shrinking cities. In these cities, the process is often abruptly disrupted by population loss rather than gradual demographic shifts. As white residents begin to leave in response to the arrival or growth of minority populations, a phenomenon commonly referred to as “white flight,” this departure accelerates disinvestment and leads to sharp declines in neighborhood desirability and property values (Beauregard 2009; Hamilton 2014). Unlike the gradual change described in classical models, this pattern creates a cycle of decline, where fear of integration, ongoing discrimination, and fewer job opportunities lead to more people leaving the neighborhood. Schwirian (1983) describes this phenomenon through the concept of a “tipping point,” where demographic changes precipitate rapid neighborhood decline, highlighting the fragility of urban areas under prolonged depopulation. In shrinking cities, these tipping points are easier to reach, as smaller population bases make neighborhoods more vulnerable to demographic change.
Segregation and Housing Prices
Racial segregation plays a critical role in shaping housing markets and neighborhood stability (Massey 1990; Owens 2019). This relationship operates via both demand-side preferences and supply-side constraints. On the demand side, households often choose neighborhoods based on racial and socioeconomic considerations, reinforcing patterns of segregation rooted in historical discrimination and economic disparities (Galster 1988; Schill and Wachter 1995). Clark (1991) notes that race-linked income differences can influence housing choices, with higher-income white residents frequently outbidding minorities for homes in predominantly white areas. The phenomenon exacerbates with white flight negatively affecting African American communities by limiting access to education and employment opportunities, thereby intensifying residential segregation (Boustan 2014). Systemic discrimination on the supply side further influences housing prices, compelling minority homebuyers to pay higher-than-average prices compared to white homebuyers for similar properties (Bayer et al. 2017). For instance, Bayer et al. (2017) showed that African American and Hispanic homebuyers in several large U.S. metros paid roughly 2 percent more than white buyers for comparable homes, reflecting persistent market biases.
In addition, segregation intersects with economic stratification, affecting local housing markets by elevating property values in affluent neighborhoods and depressing them in disadvantaged areas (Owens 2019; Pangallo, Nadal, and Vignes 2019). These patterns create fragmented urban landscapes where wealth concentrates in certain enclaves, while poverty persists in others—dynamics often felt acutely by minority communities in shrinking cities with sustained economic decline.
Existing studies of residential segregation in cities like Chicago, Detroit, and Cleveland (Galster 2012; Massey and Denton 1993) often emphasize macro-level socioeconomic trends, such as population loss, economic restructuring, or city-wide spatial inequalities (Mallach 2012). Mallach (2012), for example, demonstrates how rising vacancy rates in shrinking cities exacerbate socioeconomic vulnerabilities, further depressing housing market values and limiting opportunities for neighborhood renewal. However, these broader studies rarely delve into how traditional planning and housing market policies, which are generally growth-oriented and assume continual population inflows and economic expansion, inadequately address the unique segregation and housing market dynamics in shrinking urban contexts. Ryan (2012) explicitly highlights this gap by emphasizing that shrinking cities, such as Cleveland and Detroit, experience intensified demographic imbalances, racial segregation, and housing market instability precisely because traditional growth-oriented models fail to recognize these local complexities. Ryan argues that urban policies must therefore shift from conventional growth frameworks toward more localized, equity-driven approaches aimed at stabilizing neighborhoods, reducing segregation, and supporting sustainable housing markets in conditions of prolonged population loss.
Shrinking Cities, Segregation, and Neighborhood Dynamics
Unlike growing metropolitan areas, where demographic succession can drive neighborhood revitalization, shrinking cities face ongoing vacancies, weak investment, and entrenched racial isolation (Mallach, Haase, and Hattori 2017). Depopulation exacerbates racial and economic segregation, as social stigmatization heightens and incentives for redevelopment decline (Dewar and Thomas 2012; Wacquant 2008). As a result, neighborhoods may enter self-reinforcing cycles of segregation and deteriorating property values, compounded by systemic inequities and historical discrimination (Beauregard 2009; Hamilton 2014). These disruptions diverge markedly from classic invasion-succession patterns that assume demographic replacement; instead, shrinking cities often experience what Dewar and Thomas (2012) describe as “post-invasion dynamics without succession,” wherein departing residents are not replaced, fueling persistent vacancy and deepening segregation.
Recent empirical work accentuates these distinct dynamics in shrinking cities. For example, Morckel and Durst (2023) highlight Cleveland’s uniquely polarized vacancy trends relative to other Ohio metros, emphasizing the complex interplay between neighborhood decline, vacancy, and local segregation. This underscores the importance of examining segregation and housing markets with an approach tailored to shrinking urban contexts, rather than relying on assumptions derived from growth-oriented settings.
Research Gaps and Objective
Although the broader literature has examined links between racial segregation and housing prices, much of it targets larger metropolitan areas or uses macro-level approaches that overlook fine-grained local variations in shrinking cities (Freixas and Abbott 2019). In addition, while previous studies extensively investigate the relationships between income segregation and housing market outcomes (Owens 2019; Quick and Revington 2022), there remains a notable gap in understanding how these relationships intersect specifically with racial segregation, particularly regarding their evolution over extended time periods within the unique context of shrinking cities. Indeed, existing research rarely captures how racial segregation patterns and their intersection with income disparities evolve in cities experiencing long-term population decline and widespread disinvestment.
Shrinking cities often exhibit unique spatial processes—such as persistent or long-term duration of vacancies, reinforced segregation, and “post-invasion” neighborhood dynamics—that differ fundamentally from those in growing urban environments. Addressing this intersection between racial segregation, income disparities, and housing market outcomes is especially important given the compound effects these factors have on neighborhood stability and desirability.
To address these shortcomings, this study investigates the temporal and spatial relationships between racial segregation and housing prices in Cuyahoga County, Ohio, which includes the city of Cleveland—a prototypical shrinking city—over the extended period of 1986 to 2021. Specifically, it aims to (1) measure neighborhood segregation at the block-group level using local diversity and isolation indices, (2) analyze how segregation patterns relate to housing prices across multiple historical intervals, and (3) examine how these relationships differ among neighborhoods with distinct income levels. By centering on a shrinking-region context, represented by Cuyahoga County and anchored by the city of Cleveland, and employing nuanced local indicators, the study offers new insights into the intricate ways that segregation and market valuations converge, informing more effective policy interventions and urban revitalization strategies.
Study Area
As noted, this study focuses on Cuyahoga County, Ohio, which includes the city of Cleveland and several surrounding municipalities (Figure 1). Once a major center for heavy manufacturing and the automotive industry, Cleveland’s population peaked at 914,808 in 1950 before declining to 505,616 by 1990 and 372,624 by 2020. Although Cleveland remains the largest and most economically pivotal city within the county, the broader region’s population and industrial decline have affected many of the surrounding municipalities as well. Cuyahoga County has likewise experienced persistent population loss, registering a 10.4 percent decrease between 1990 and 2020.
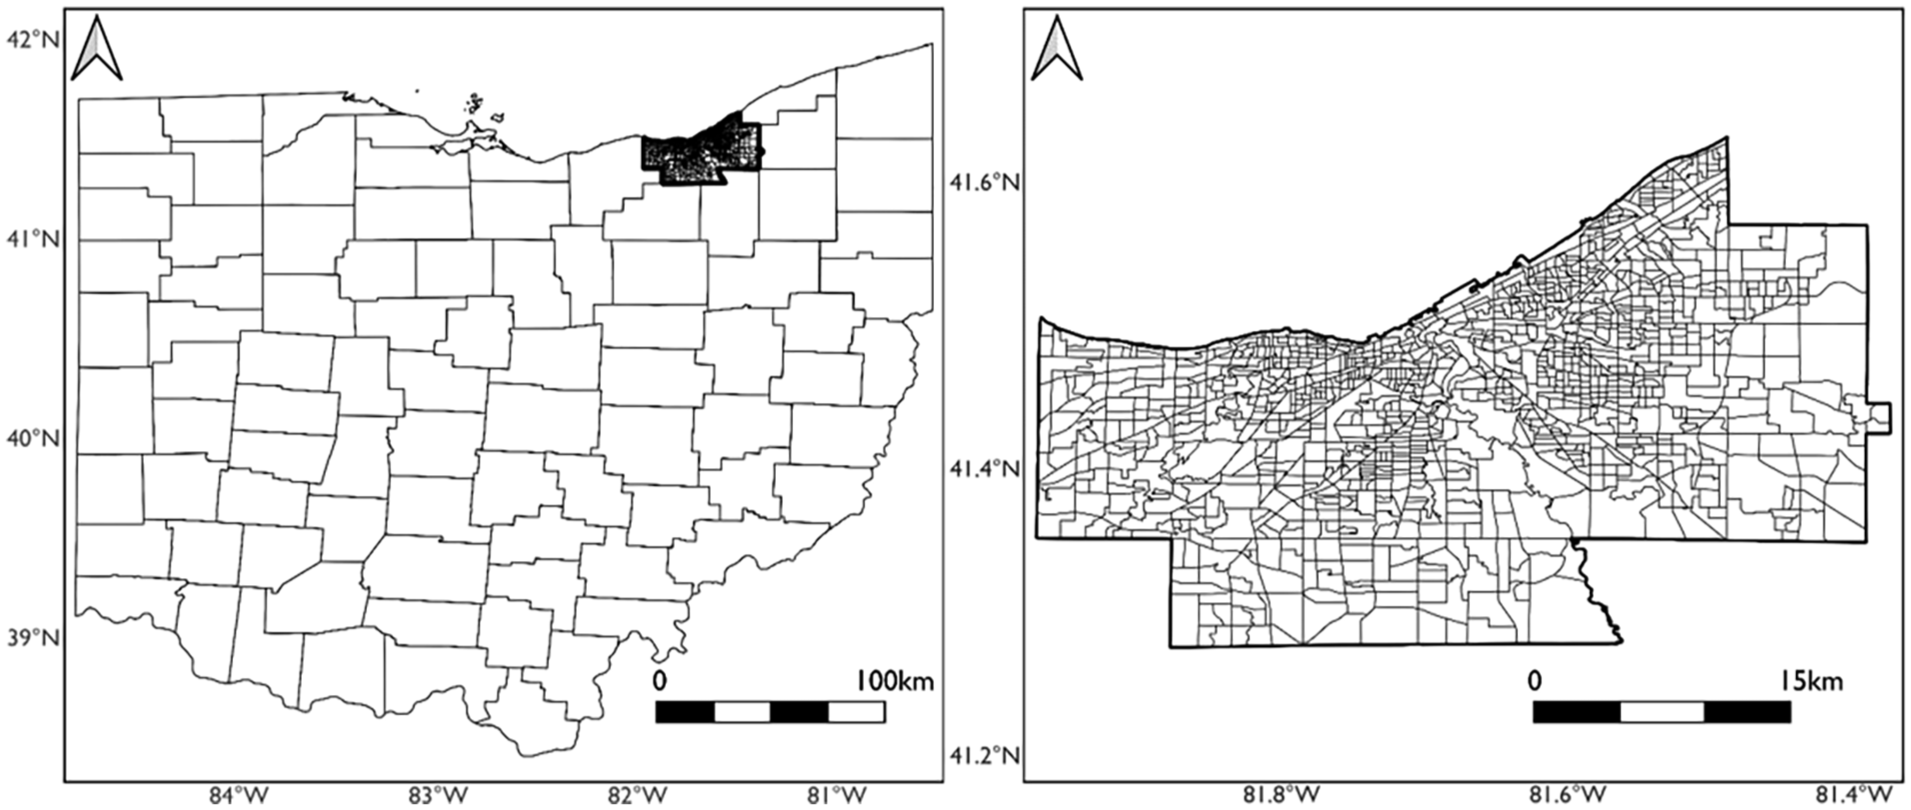
Study area: Cuyahoga County, Ohio.
Alongside these demographic changes, Cleveland’s poverty rate is nearly double that of other U.S. cities with populations exceeding 250,000. The city’s housing vacancy rate rose from 8.82 percent in 1980 to 15.68 percent in 2020, far above the average for large urban centers. These factors collectively highlight the gravity of Cleveland’s economic and population decline, which has unfolded over several decades due to a range of structural and local conditions. Within this context, Cleveland’s sharp depopulation offers a compelling setting for exploring how racial segregation relates to housing prices—interpreted in this study as indicators of residents’ locational preferences. The city’s prolonged challenges provide a unique lens for understanding broader urban housing market dynamics in shrinking metropolitan areas. These challenges have extended outward into its geographical context as well.
Data Acquisition and Processing
Property Data
The primary dependent variable for this research consists of residential property sales from 1986 to 2021. These data were obtained from the Northeast Ohio Community and Neighborhood Data for Organizing (NEOCANDO) platform, an online resource developed by Case Western Reserve University’s Poverty Center. The original dataset included 379,435 parcel-level records containing details such as year built, number of bedrooms and bathrooms, architectural style, construction material, owner occupancy, lot shape, and property condition.
To focus on transactions reflective of typical market values, sales in the top and bottom 1 percent of prices were removed (Noh and Li 2024). Parcels missing critical information (e.g., sale price, year built) or reporting anomalous data (e.g., an implausible number of bedrooms) were excluded. Transactions recorded as warranty deeds were retained, while other transaction types (e.g., quitclaim, probate court, or sheriff sales) were excluded to maintain market comparability. All prices were then adjusted to account for inflation using the Housing Price Index from the Federal Housing Financing Agency (Noh, Newman, and Lee 2021).
For analytic clarity, the dataset was divided into four periods—1986–1995 (labeled 1990), 1996–2005 (2000), 2006–2015 (2010), and 2016–2021 (2020)—in order to capture distinct economic and demographic shifts over time. These sequential data segments contained 64,130, 87,894, 68,570, and 61,750 observations, respectively, totaling 282,344 valid transactions. Housing characteristics (e.g., dwelling age, size, style) were included as independent variables in the hedonic model to better isolate the relationships between segregation measures, income levels, and property sale prices. By interpreting sale prices as proxies for buyer preference, this framework allows for a clearer understanding of how racial segregation corresponds with residential choice in a shrinking urban environment.
Socioeconomic and Neighborhood Data
For the analysis of socioeconomic and neighborhood conditions, this study uses census block groups as the spatial unit. The block-group-level data range from 1990 to 2020 and come from the National Historical Geographic Information System (NHGIS) (Manson 2020), which compiles both U.S. decennial census data and American Community Survey estimates. Key variables include demographic attributes—such as the percentage of individuals under 18 or over 65 years of age—and indicators of educational attainment, including the proportion of those holding a high school diploma or a university degree. Additional neighborhood characteristics include the percentage of female-headed households with children under 18 years of age, vacant housing units, owner occupancy rates, median housing value, and median household income.
The dataset also incorporates amenity-related variables such as proximity to airports, hospitals, golf courses, elementary schools, cemeteries, and parks, which were calculated using the shortest network distance in ArcGIS (Hussain et al. 2019; Payton et al. 2008). These measures offer insight into how geographic positioning and access to resources may relate to housing market prices, interpreted in this analysis as indicators of residents’ preferences.
Neighborhood income levels were derived using the median household income of each block group, with income quartiles established for 1990, 2000, 2010, and 2020. Individuals in the bottom 25 percent are labeled as Group 1, those in the 25 to 75 percent range as Group 2, and those in the top 25 percent as Group 3 (Moro et al. 2021). Census block groups were chosen over census tracts to capture more granular spatial variation in racial diversity, housing prices, and other neighborhood characteristics. While tracts are larger and generally more stable for longitudinal studies, they may obscure notable within-tract differences. Using block groups allows for the application of local-scale spatial segregation measures, refining adjacency-based calculations to more accurately reflect on-the-ground neighborhood interactions (Oka and Wong 2014; Wong 2016). This scale is particularly valuable in urban settings where sub-tract level variation is substantial.
Segregation Index
To evaluate racial segregation, this study employs two local spatial indices: a local spatial entropy-based diversity index (to measure evenness and clustering) and a local spatial isolation index (to capture isolation-exposure) (Oka and Wong 2014; Wong 2008, 2016). These measures integrate spatial interactions to illuminate geographic patterns of segregation within a single urban area, making them well-suited for assessing neighborhood-level differences.
For the evenness dimension, the final model focuses on two population groups: Non-Hispanic Black residents and all other residents (Lutfi et al. 2015; Massey and Denton 1988). This dichotomy was selected to clarify how segregation manifests specifically around Non-Hispanic Black populations relative to others. The calculation of these indices aggregates populations from both the target block group and its adjacent block groups, creating a composite count that serves as the foundation for the entropy-based diversity and isolation measures. Various spatial scales were tested—adjacent block groups, second-level adjacent block groups, adjacent census tracts, and county-level global measures—to assess how segregation patterns shift when different neighborhood definitions are applied. The analysis ultimately centered on two levels of adjacent block groups, which yielded the most interpretable representation of local segregation. Figure 2 illustrates this spatial framework: the selected block group is highlighted in dark, the first-level adjacent block groups appear in medium gray, and the second-level adjacent block groups are shown in light gray, encompassing both the medium gray zone and its immediate neighbors.
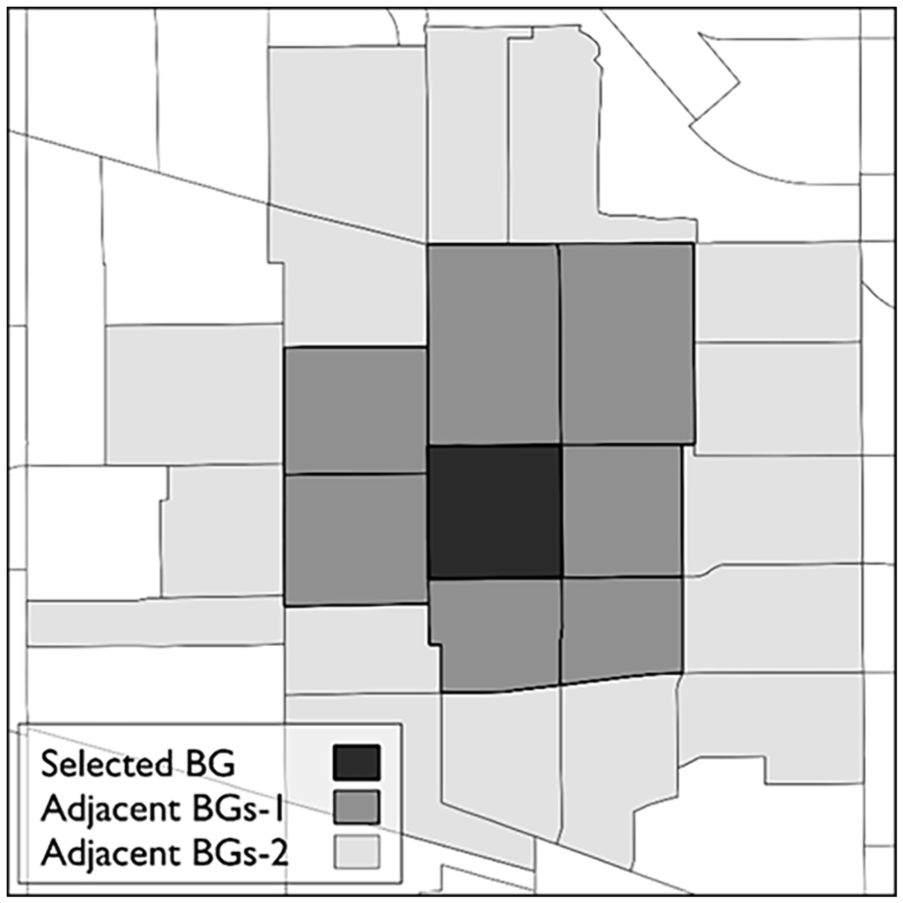
Adjacent block groups for local segregation index.
The local spatial entropy-based diversity index for evenness is calculated using the following formula:
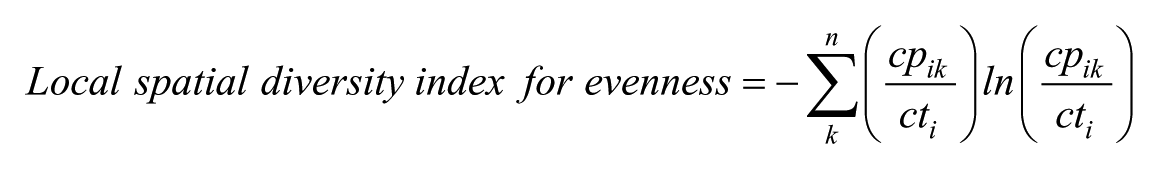
where

where
Following the calculation of the even-cluster (entropy-based diversity) and isolation-exposure (local spatial isolation) dimensions, each block group was classified into one of four quadrants (Hogrebe and Tate 2019), as illustrated in Figure 3. This classification hinges on whether a block group’s values for evenness and isolation fall above or below the mean value. Group 1, labeled “Racially even with the least isolation,” comprises block groups exhibiting higher-than-average evenness and lower-than-average isolation. Group 2, identified as “Racially even but with some Non-Hispanic Black isolation,” encompasses areas with higher-than-average evenness as well as higher-than-average isolation. Group 3, described as “Clustered with higher Non-Hispanic Black isolation,” includes block groups whose evenness values are below the annual mean but whose isolation values exceed that mean. Finally, Group 4, termed “Clustered with less Non-Hispanic Black isolation,” consists of block groups featuring both lower-than-average evenness and lower-than-average isolation.
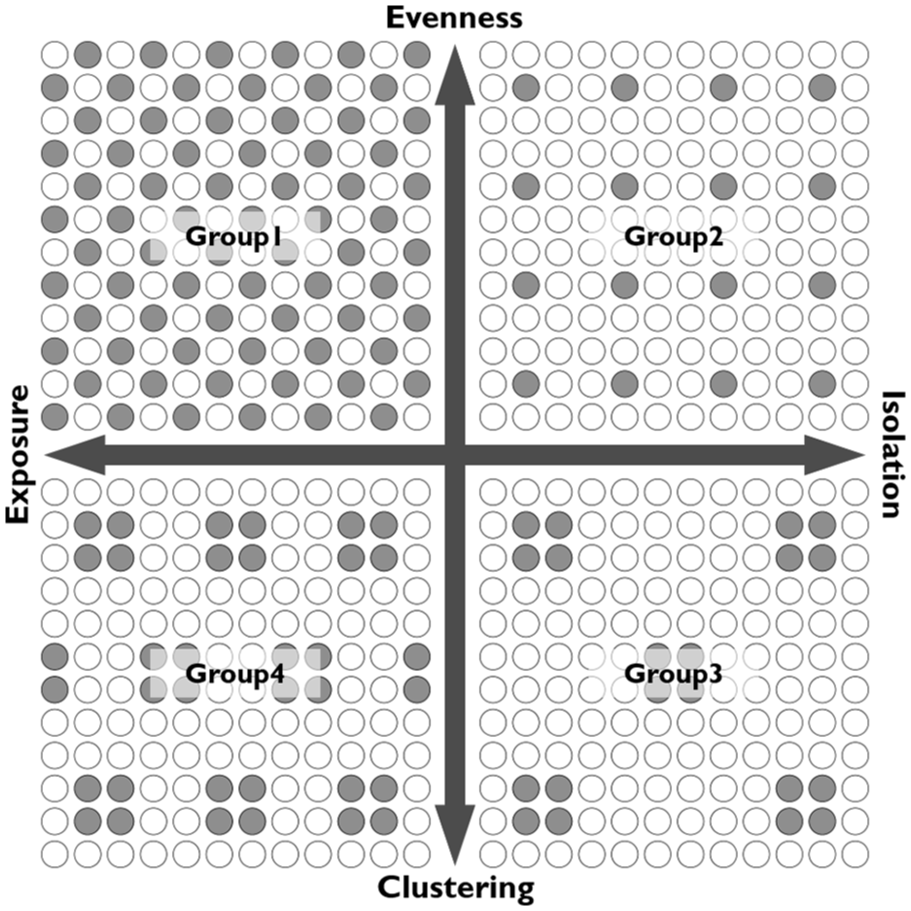
Group classification based on spatial dimensions of segregation.
By allowing for distinctions in both the racial composition (evenness) and spatial isolation of neighborhoods, this grouping schema provides a nuanced perspective on how segregation patterns may relate to housing prices—here interpreted as signals of buyers’ residential preferences—within Cleveland’s diverse urban landscape.
It is important to acknowledge that segregation indices are often correlated with other neighborhood characteristics, such as income levels, poverty rates, and housing conditions. To ensure the robustness of our statistical analyses, we explicitly tested for multicollinearity among explanatory variables using variance inflation factor (VIF) diagnostics, which revealed no significant multicollinearity issues affecting our results.
Hedonic Modeling
The hedonic model uses multiple regression analysis to explore how various amenities and dis-amenities relate to property values, interpreting differences in housing prices as indications of buyers’ preferences (Redfearn 2009; Seo et al. 2019). By controlling for building and neighborhood attributes, it assumes a market equilibrium in which buyers and sellers share information and preferences, resulting in stable market prices (Glaeser and Gyourko 2018; Hilber and Vermeulen 2016; Rosen 1974). In real estate research, the hedonic framework is widely employed to generate a detailed understanding of the factors that shape housing market outcomes (Gauvin, Vignes and Nadal 2013; Noh, Newman, and Lee 2021). Following recent applications that focus on long-run capitalization effects rather than causal identification (Eshaghnia, Heckman and Razavi 2023; Potrawa and Tetereva 2022), we treat the estimated coefficients as associations—signals of market valuation—not causal effects.
A key strength of the hedonic model lies in its ability to control for structural and neighborhood characteristics, thereby facilitating comparison across properties in multiple locations (Feng and Humphreys 2018; Hussain et al. 2019; Noh, Newman, and Lee 2021; Ottensmann, Payton and Man 2008). By quantifying how specific attributes of each dwelling or neighborhood are reflected in market transaction prices, the model yields insights that benefit developers, policymakers, and researchers alike. It clarifies how participants in the housing market respond to different property features—such as building age or proximity to amenities—and how these preferences collectively shape price variations (Chau and Chin 2003).
In this study, the hedonic model is used to examine how neighborhood segregation relates to housing transaction prices. The approach incorporates four main categories of explanatory variables: (1) key variables representing neighborhood segregation conditions (

where βn are parameter vectors, and
This study initially considered employing a Spatial Hedonic model. However, it was ultimately excluded for four principal reasons. First, the dataset spans from 1986 to 2021, rendering the assumption of spatial autocorrelation across lengthy time intervals less appropriate. Second, constructing a spatial weight matrix for over 200,000 observations and running the spatial regression was not feasible in terms of computing power and memory issues. Third, all the duplicate sales, which is substantial, had to be excluded to create a weight matrix. Lastly, when a random sample of 4,000 observations (from 1990, 2000, 2010, and 2020) was tested within a Spatial Hedonic framework, the outcomes did not substantially differ from those of the non-spatial model. Consequently, the standard hedonic model was deemed more suitable for this research.
Descriptive Statistics
The descriptive statistics of long-term neighborhood data at the block group level revealed several notable insights (Table 1). The Local Diversity Index, measured by the distribution of Non-Hispanic Black residents and others, showed an overall increasing trend, reflecting growing diversity in neighborhoods over time. This trend was consistent across both low- and high-income areas; however, the diversity index remained lower in high-income areas, indicating these neighborhoods are less diverse compared to low-income areas. In contrast, the Local Isolation Index remained relatively stable throughout the period, with high-income areas being slightly less isolated than their low-income counterparts. This pattern highlights the persistence of segregation, as low-income neighborhoods tend to experience greater isolation despite exhibiting higher levels of diversity than high-income areas.
Descriptive Statistics (Block Group).
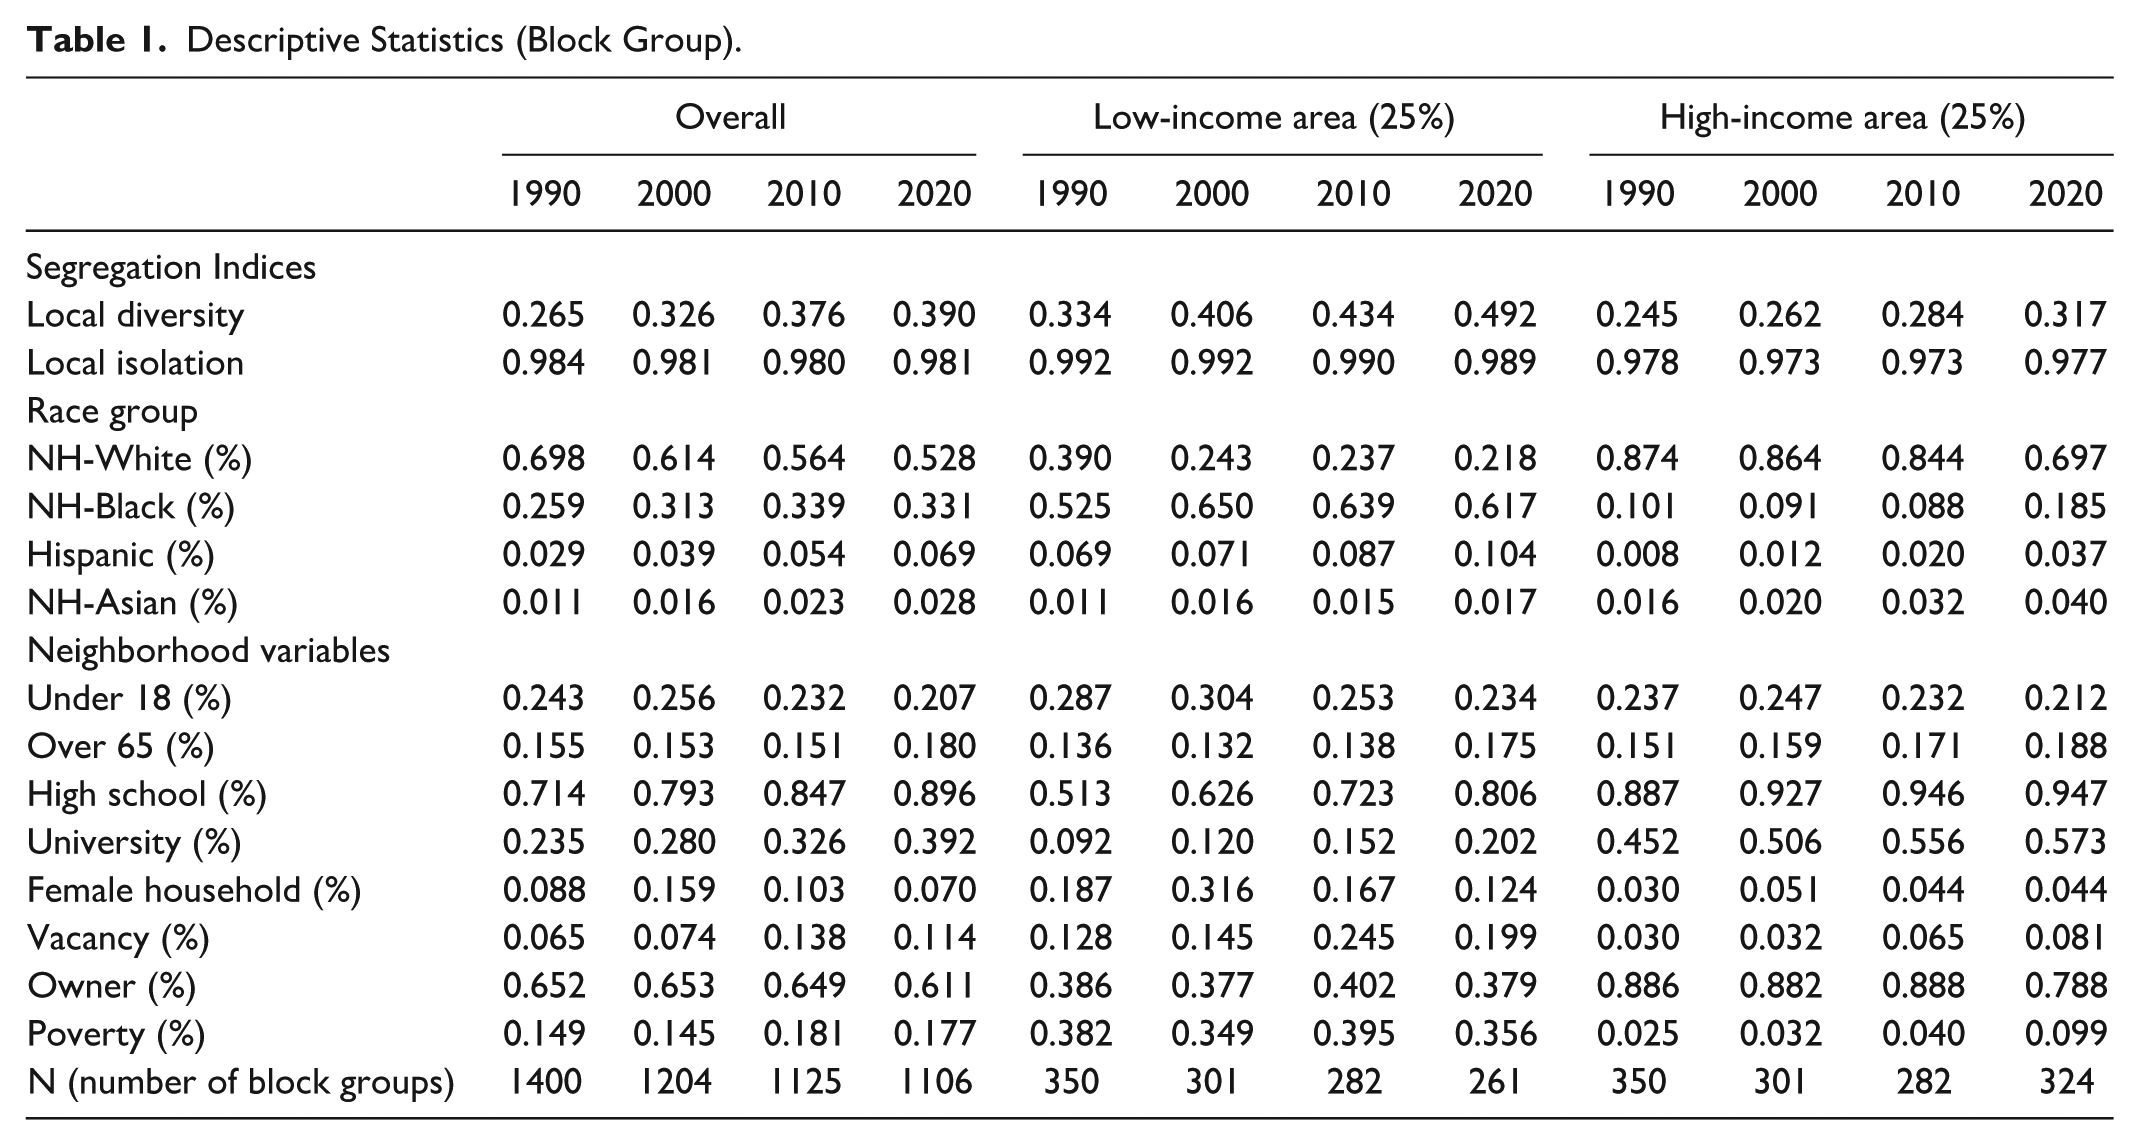
In terms of racial groups, the Non-Hispanic White population in Cuyahoga County exhibited a continuous decline over time, with a sharp drop in high-income areas by 2020. In contrast, the Non-Hispanic Black population steadily increased, accounting for 33 percent of the population after 2010, especially concentrated in low-income block groups. In high-income areas, the Non-Hispanic Black population rose sharply from 8.8 to 18.5 percent between 2010 and 2020. Meanwhile, the Hispanic and Non-Hispanic Asian/Islander populations have shown continuous growth, although they still represent a much smaller percentage compared to the two dominant racial groups.
Figure 4 illustrates the spatial distribution of segregation groups for four different years. Group 1, characterized by even racial distribution and low isolation, is located primarily in the outer regions of the county and shows minimal changes over time. Group 2, characterized by a balanced racial distribution but significant isolation, is primarily located in the northern and central regions, gradually expanding over time. Group 3, with lower evenness and high isolation, is the dominant category in the central and northeastern sections of the county. Over the 30-year period, the concentration of this group has increased, indicating worsening racial segregation. Meanwhile, Group 4, characterized by clustered populations but reduced isolation, is positioned adjacent to Group 3 and displays moderate growth. Overall, the data reveal a consistent and growing trend of segregation, with Group 3’s growth indicating increased racial clustering and isolation, especially in the central urban areas.
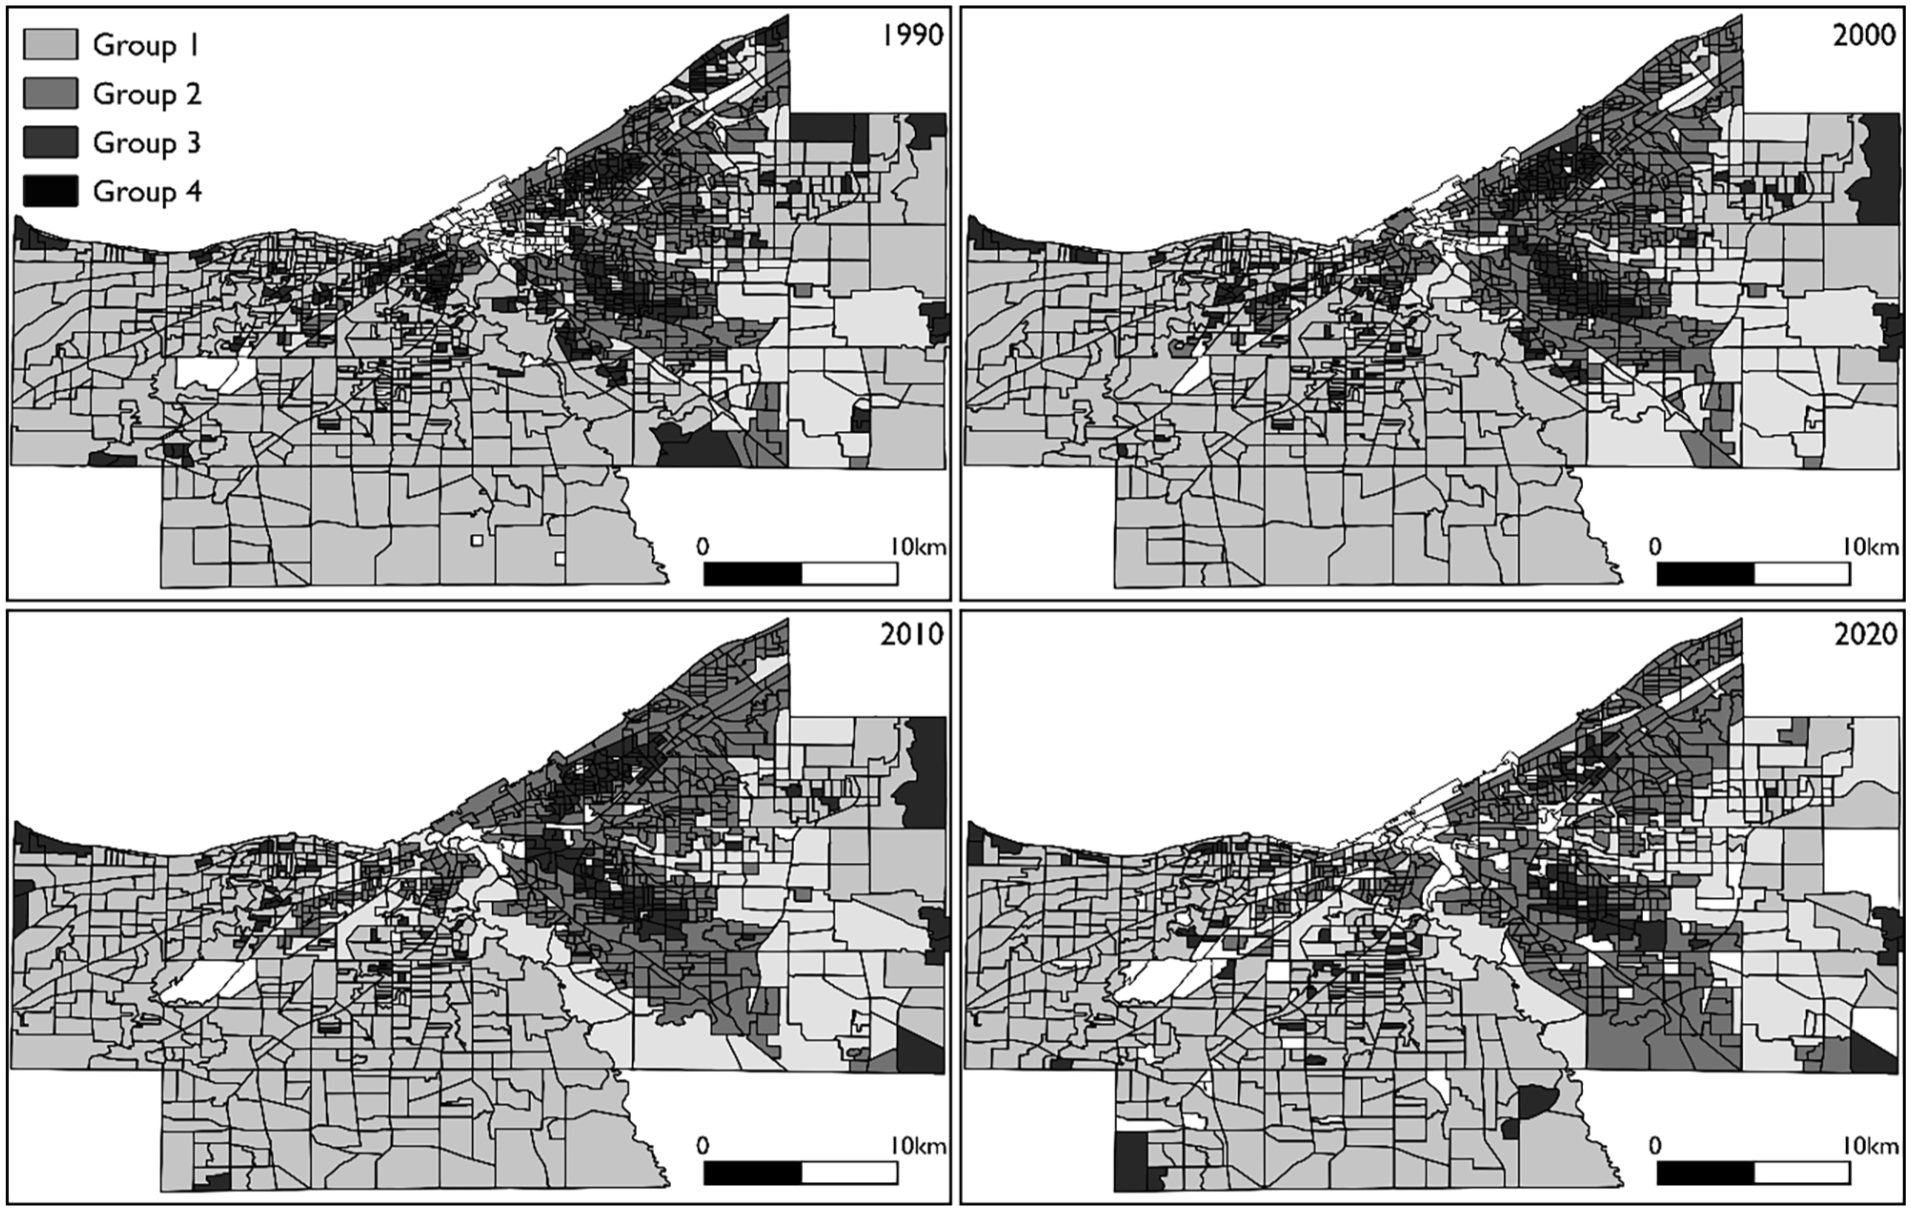
Segregation group distribution.
Figure 5 depicts the relationship between the natural logarithm of housing prices and two local segregation indices—Local Diversity Index for evenness and Local Isolation Index. The diversity plots show four time periods (1990, 2000, 2010, 2020), while the isolation plots show 1990 and 2020. The vertical dashed line represents the mean value of each index for the respective period, providing a reference point for distinguishing different levels of segregation. The plots show that the correlation between housing prices and segregation indices shifts noticeably before and after this mean threshold.
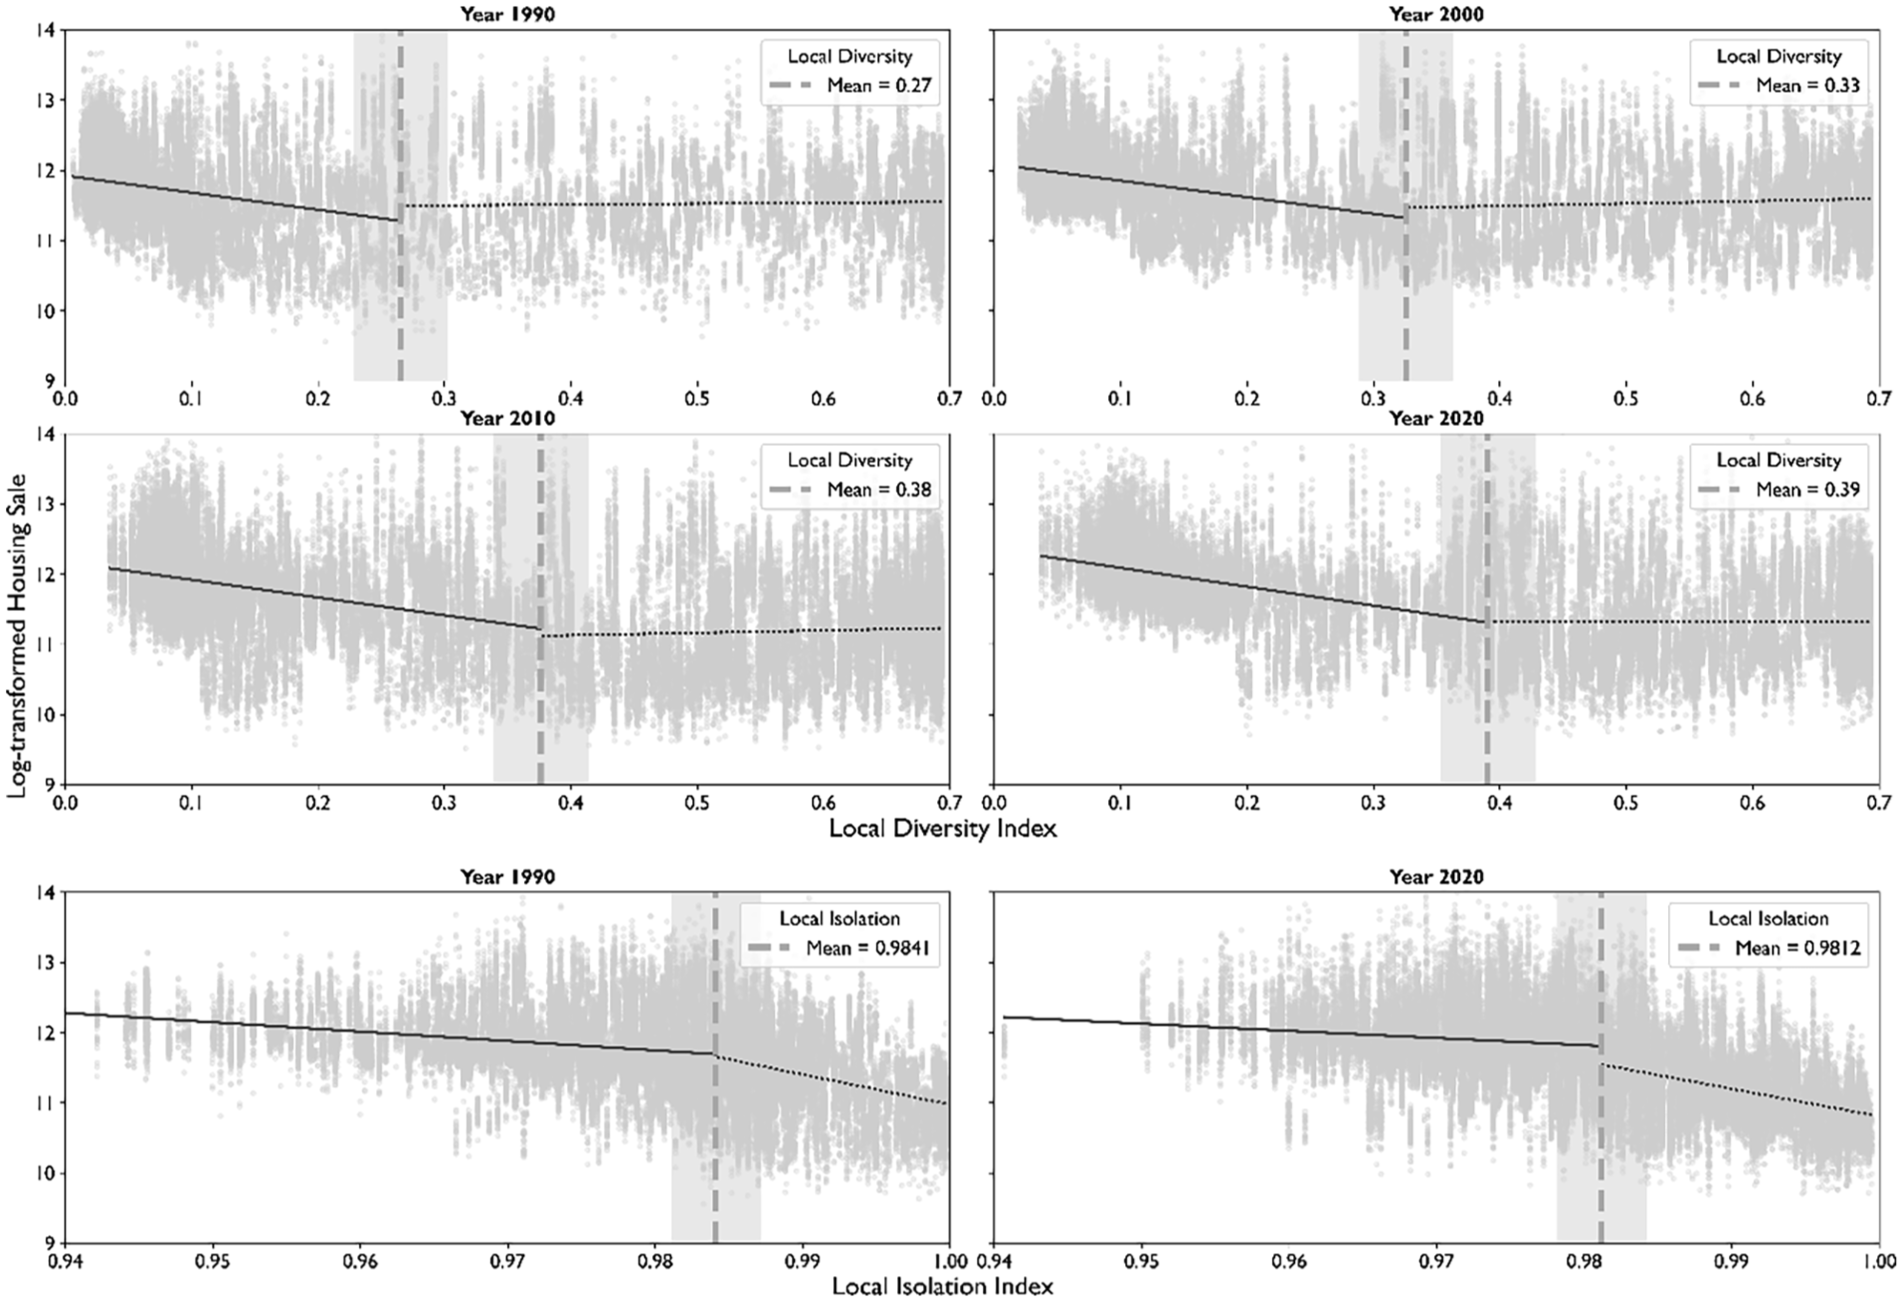
Scatter plot: housing price and segregation indices.
For the Local Diversity Index, a negative relationship is observed between housing prices and diversity levels below the mean, although the slope slightly differs between the examined periods (1990–2020). This indicates that housing prices are generally associated with higher values as neighborhoods become more racially clustered (i.e., closer to zero on the index). However, beyond the mean value, the relationship either remains stable or slightly shifts toward a positive correlation, suggesting that housing prices might be somewhat positively correlated with neighborhoods becoming more racially balanced. Related to the Local Isolation Index, a consistent negative trend is visible over time, with higher isolation levels generally associated with lower housing prices. After the mean value, the slope becomes steeper, indicating a stronger negative correlation with housing prices as neighborhoods become more isolated.
Overall, these results demonstrate that the relationship between segregation and housing prices significantly changes depending on whether the segregation indices are above or below the mean threshold. This shift in correlation patterns justifies the categorization of the four segregation groups, highlighting the necessity of distinguishing areas based on their levels of racial integration and segregation to better understand their distinct associations with housing prices.
Hedonic Model for Housing Transaction
Table 2 presents the results of the hedonic model, highlighting how income levels and segregation groups relate to housing prices. Directly beneath the primary table, additional findings show the coefficients for the local segregation indices. Overall, Segregation Group 2, which represents neighborhoods with a moderate racial balance and a higher level of isolation, consistently exhibits a positive and statistically significant relationship with housing prices across all observed periods. Notably, this relationship becomes stronger over time, with the 2016–2021 period associated with approximately 18 percent higher transaction prices (p < 0.001). Such neighborhoods may offer a blend of stability and racial diversity that appears increasingly attractive to homebuyers, even in a shrinking-city context.
Regression Results: All Housing Transaction.
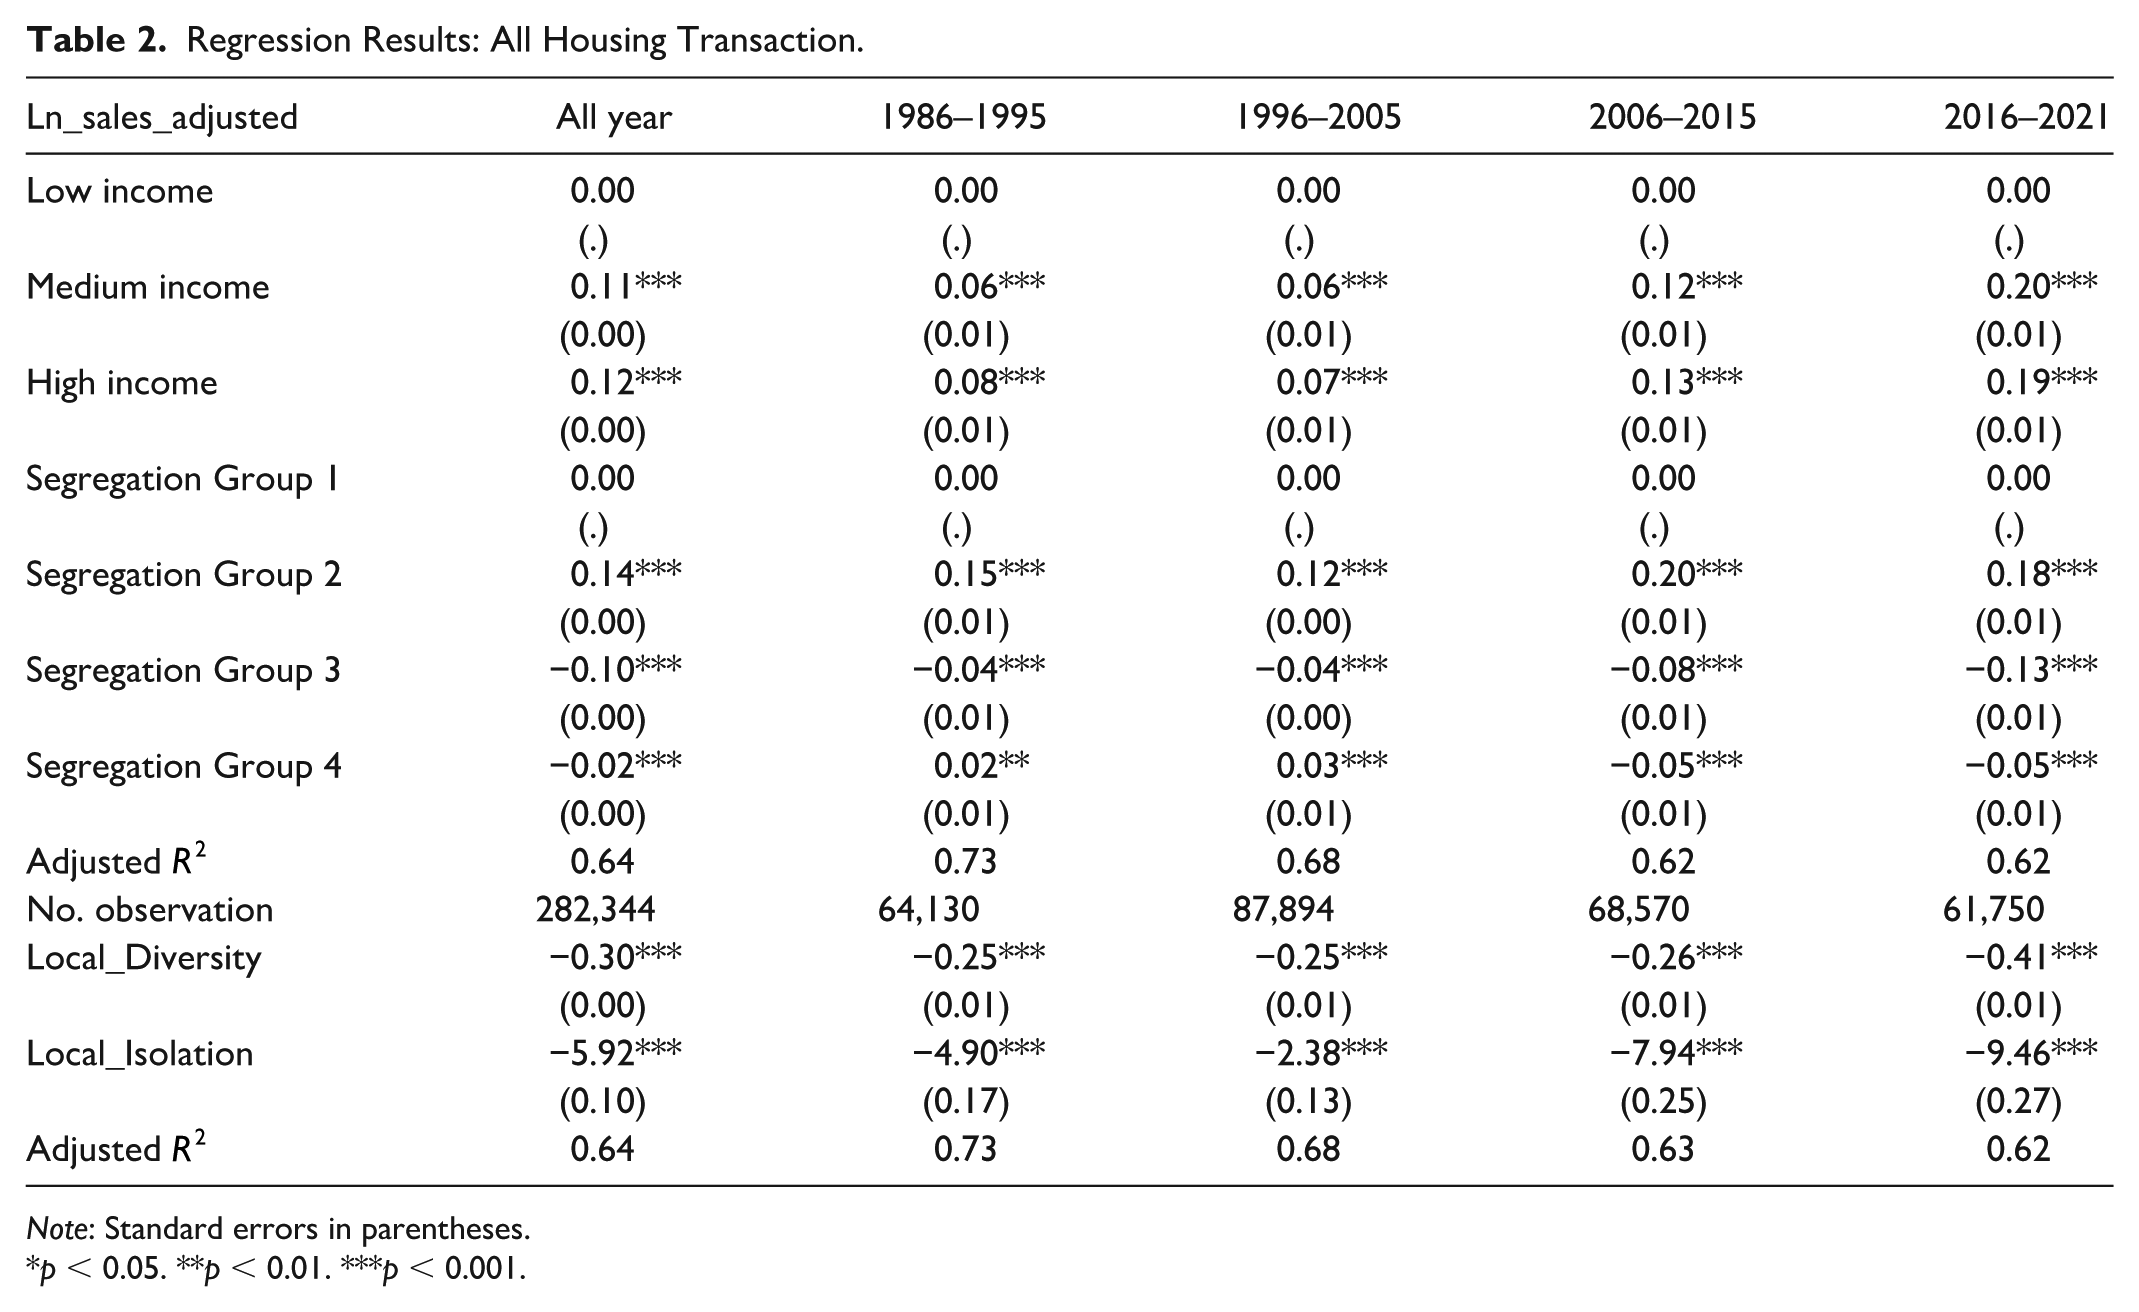
Note: Standard errors in parentheses.
*p < 0.05. **p < 0.01. ***p < 0.001.
In contrast, Segregation Group 3, characterized by highly segregated areas with both high clustering and isolation, shows a negative association with housing prices that intensifies over time. While the effect was comparatively small in 1986–1995 (−0.04, p < 0.001), it becomes more pronounced in the later years, dropping to −0.13 (p < 0.001) by 2016–2021. These findings suggest that neighborhoods experiencing significant segregation may be growing increasingly vulnerable to economic decline. Meanwhile, Segregation Group 4 (clustered areas with lower levels of isolation) also demonstrates a consistently negative relationship with housing prices, albeit to a lesser degree than Group 3. The 2016–2021 period sees this association move to −0.05 (p < 0.001), indicating that concentrated Non-Hispanic Black communities with somewhat lower isolation still confront downward pressure on property values, particularly after 2006–2015.
Significant differences emerge when looking at income levels. Medium- and high-income neighborhoods show positive and significant coefficients across all periods, with these relationships strengthening over time. By 2016–2021, medium-income neighborhoods see housing values roughly 20 percent higher compared to low-income areas, while high-income tracts experience a 19 percent boost. These patterns point to a level of resilience among higher-income neighborhoods, where the broader economic challenges of a shrinking city appear less detrimental. Low-income areas, by comparison, remain the most vulnerable, with little indication of improvement in housing values.
Finally, an additional set of results at the bottom of Table 2 reveals consistently negative coefficients for local diversity indices, suggesting that greater racial diversity, on its own, does not correlate with higher transaction prices in shrinking cities. In fact, the coefficient grows more negative over time, moving from −0.25 (p < 0.001) in 1986–1995 to −0.41 (p < 0.001) in 2016–2021. Similarly, the local isolation index registers a strong and increasingly negative relationship, reaching −9.46 (p < 0.001) by the most recent period. These patterns underscore the economic challenges that highly isolated communities face over time.
Taken together, these findings illustrate the substantial role racial segregation plays in shaping housing price trajectories within Cuyahoga County. While neighborhoods exhibiting moderate racial integration (Group 2) appear to sustain or elevate their property values, more segregated neighborhoods (Group 3) continue to lose ground economically. Higher-income areas show greater resilience despite the presence of segregation, whereas low-income neighborhoods generally see limited improvements in housing values. This analysis highlights the importance of addressing racial and economic segregation to support more equitable and sustainable outcomes in shrinking urban contexts.
Spatial Heterogeneity in the Effects
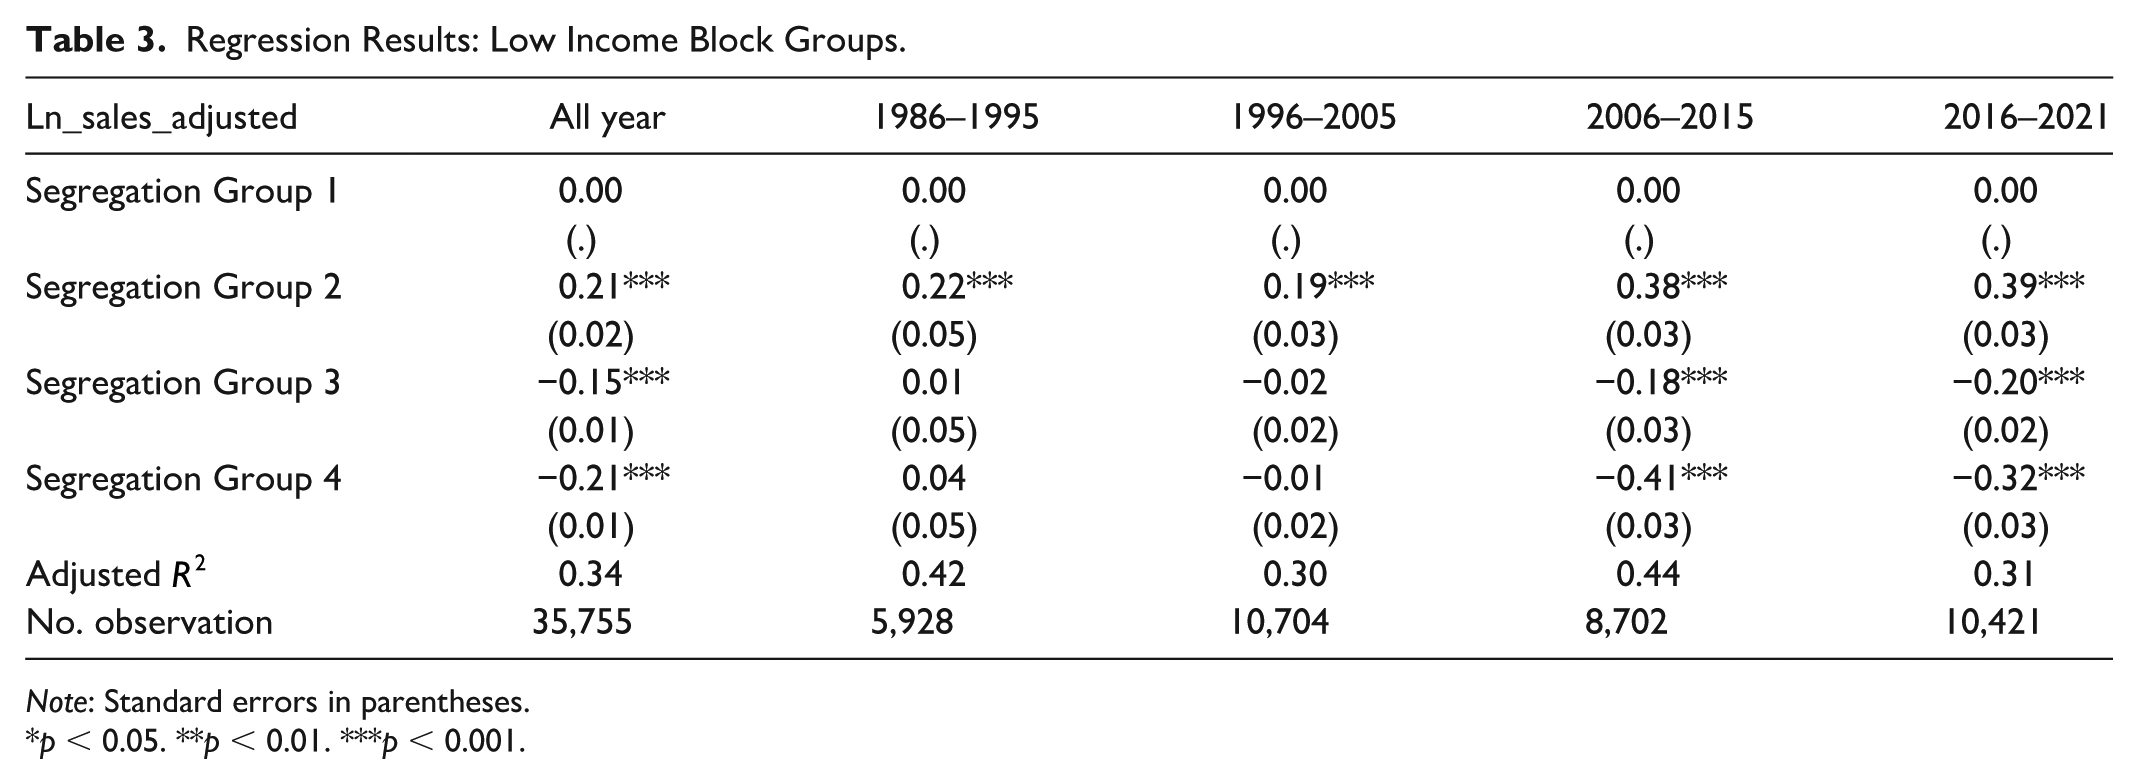
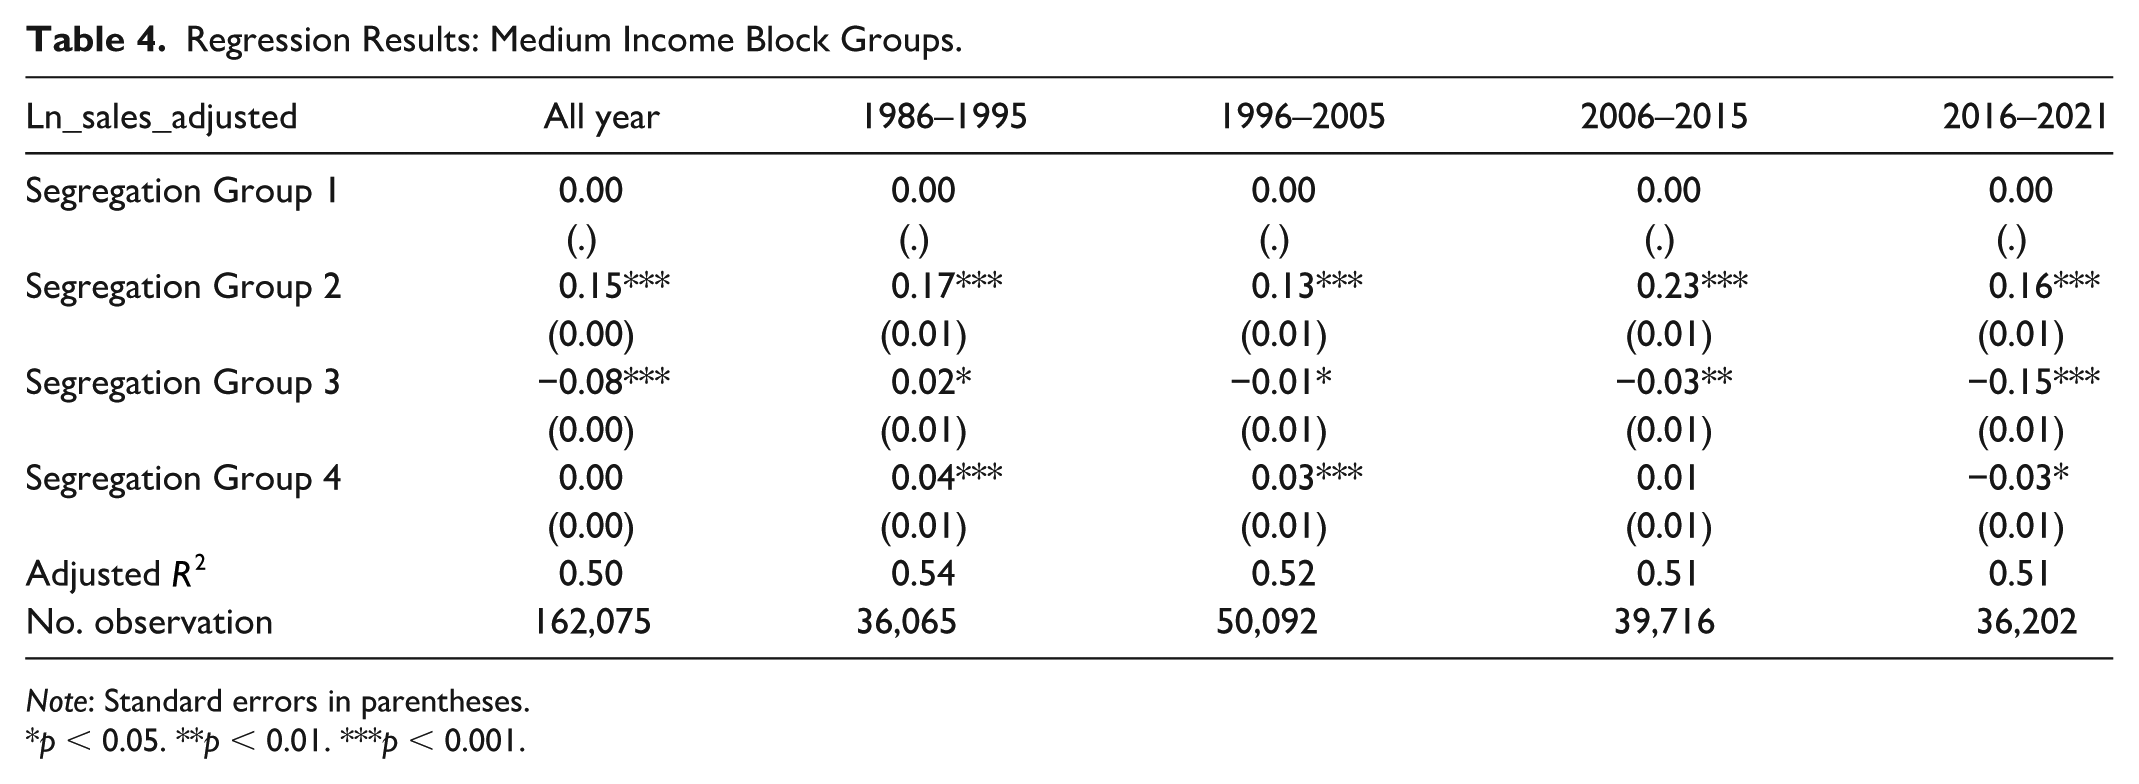
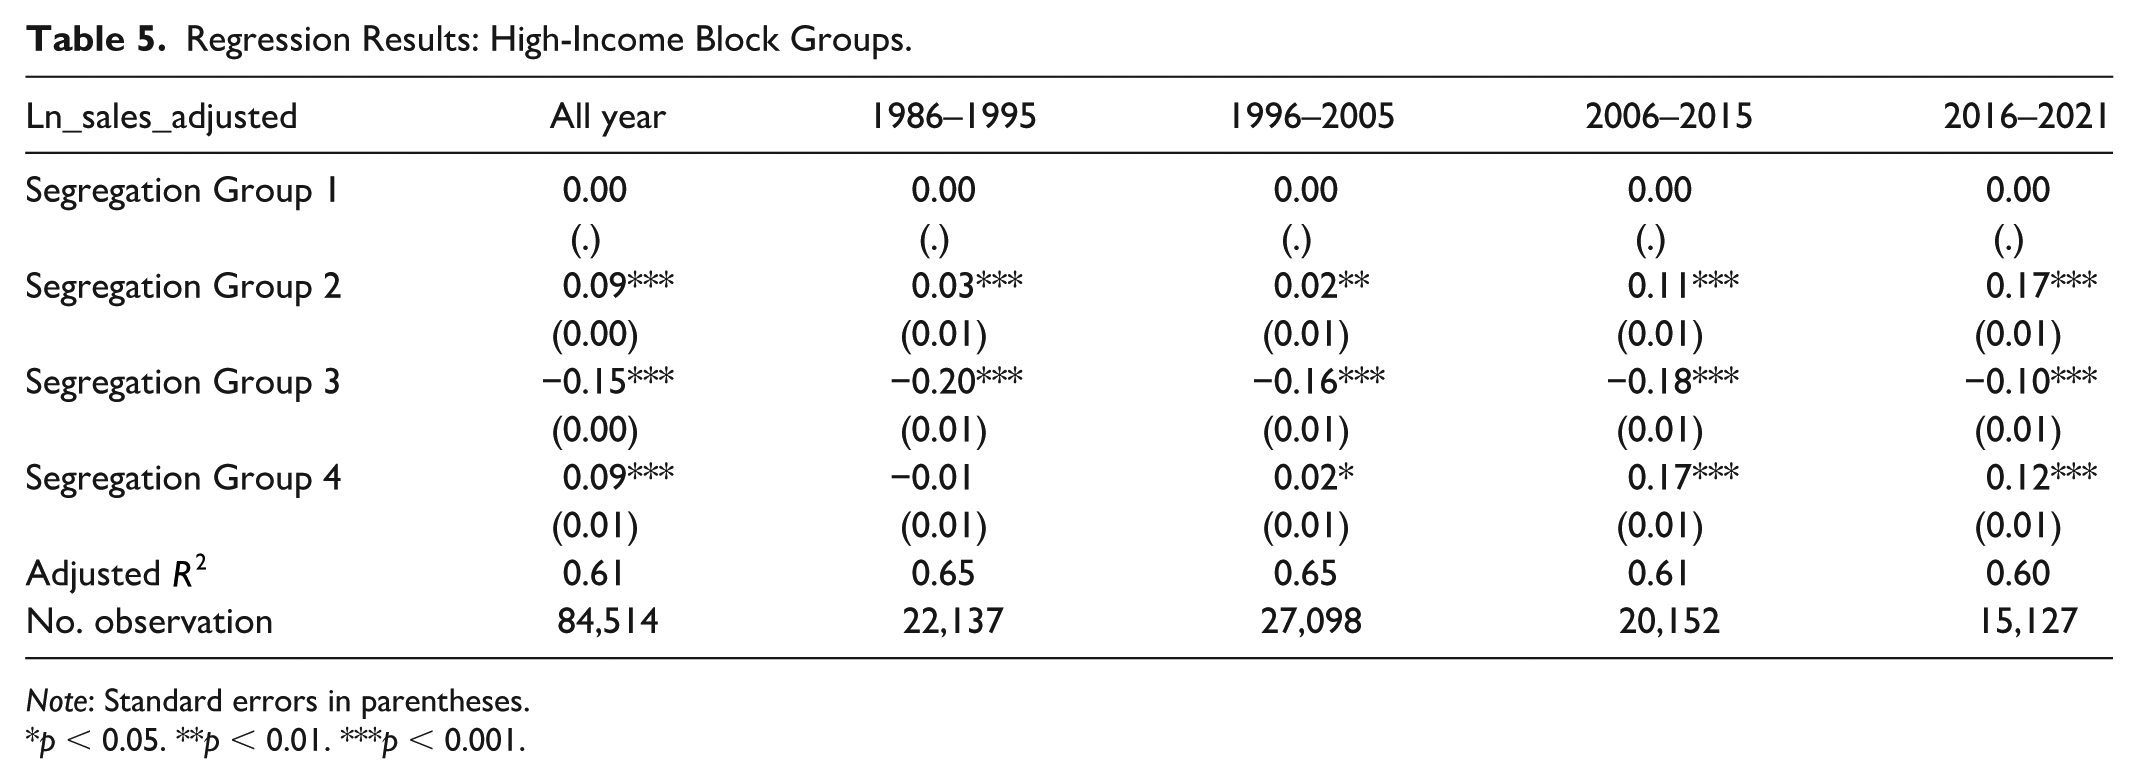
Tables 3–5 present how local segregation relates to housing prices across different income categories, underscoring notable spatial heterogeneity in buyer preferences. Because this analysis uses a hedonic model, higher or lower transaction prices are interpreted here as indications of stronger or weaker desirability among potential homeowners.
Regression Results: Low Income Block Groups.
Note: Standard errors in parentheses.
*p < 0.05. **p < 0.01. ***p < 0.001.
Regression Results: Medium Income Block Groups.
Note: Standard errors in parentheses.
*p < 0.05. **p < 0.01. ***p < 0.001.
Regression Results: High-Income Block Groups.
Note: Standard errors in parentheses.
*p < 0.05. **p < 0.01. ***p < 0.001.
A key takeaway is the consistently positive relationship of Segregation Group 2—characterized by relatively balanced racial composition and high isolation—across all income groups and time periods. This pattern suggests that neighborhoods combining moderate racial integration with some degree of isolation consistently sustain stronger property values, indicating a market preference for this specific racial configuration across various income levels.
In contrast, Segregation Group 3—defined by high isolation and low evenness—shows varied outcomes depending on neighborhood income. In low-income areas (Table 3), Group 3 is not strongly associated with housing prices until the 2006–2015 and 2016–2021 periods, when it becomes a clearly negative factor. This shift points to an emerging market disfavor or heightened economic disadvantage linked to extreme segregation in lower-income contexts. In medium-income neighborhoods (Table 4), Group 3’s negative relationship is marginal at first but intensifies significantly (p < 0.001) as time progresses, suggesting growing market sensitivity to segregation in mid-income areas. Conversely, in high-income neighborhoods (Table 5), Group 3 remains negatively associated with housing prices throughout, but its magnitude declines over time, implying that more affluent communities, while not entirely insulated, may be better able to mitigate the adverse market perceptions associated with segregation.
Segregation Group 4—with low evenness and low isolation—further highlights the context-dependent nature of these market preferences. In low-income areas, Group 4 initially shows no clear relationship to property values but becomes increasingly negative from 2006–2015 onward, indicating a rising market aversion to less-isolated forms of segregation among economically constrained neighborhoods. In medium-income communities, Group 4 is initially linked to modestly higher prices (3–4%, p < 0.001) but shifts to a slight negative relationship (−3%, p < 0.1) by 2016–2021. By contrast, in high-income neighborhoods, Group 4 remains positively associated with property values, with estimated price differences of approximately 17 percent (p < 0.001) in 2006–2015 and 12 percent (p < 0.001) in 2016–2021. These findings indicate that, while Group 4 becomes more detrimental in lower- and middle-income markets, it continues to be perceived favorably (as reflected in property values) in wealthier areas.
In sum, these results point to a persistent market preference for moderate racial balance (Group 2) and a complex interplay of negative or mixed outcomes for more segregated patterns (Groups 3 and 4). The influence of segregation on housing prices—and by extension, perceived desirability—varies markedly by both income level and time period. Such heterogeneity reinforces the importance of considering both racial composition and socioeconomic context when evaluating housing market dynamics in shrinking urban environments.
Discussion
This study examined how neighborhood-level racial segregation corresponds with housing market outcomes in Cuyahoga County, Ohio—a shrinking region anchored by the city of Cleveland—across the period from 1986 to 2021. The results indicate that segregation patterns and housing prices are strongly intertwined, with notable variations according to the extent of Non-Hispanic Black isolation and neighborhood income levels.
Segregation Patterns and Housing Market Dynamics
The housing market distinguishes sharply between moderate and extreme segregation, reinforcing premiums in neighborhoods in transition while deepening discounts in areas of concentrated isolation. Neighborhoods with moderate racial diversity yet higher Non-Hispanic Black isolation exhibited relatively stronger and positive associations with housing price compared to other segregation categories. This aligns with earlier research suggesting that many homebuyers favor racially homogeneous environments, resulting in relative market stability driven by demographic preferences (Davis, Gregory, and Hartley 2024). The arrival of Hispanic and Asian populations into historically Non-Hispanic Black-majority neighborhoods may have further bolstered housing demand, mirroring broader demographic shifts observed in other shrinking cities (Bagchi-Sen et al. 2020). These findings suggest that such neighborhoods can function as transitional areas—economically appealing yet socially complex.
In contrast, neighborhoods exhibiting high racial clustering and intense isolation consistently demonstrated negative associations with housing price, a trend that worsened with major economic shocks such as the 2008 mortgage foreclosure crisis. Prior to the crisis, segregated neighborhoods showed modest negative associations with housing prices (approximately 3% – 4%). However, these negative associations intensified notably after the crisis, reaching magnitudes corresponding to approximately 20 percent lower relative price indicators in low-income neighborhoods and about 15 percent lower in medium-income neighborhoods during the 2006–2021 period. These patterns are consistent with earlier research identifying pronounced minority segregation as associated with increased vulnerability to housing market volatility during economic downturns (Rugh and Massey 2010). The sustained negative associations observed in these neighborhoods suggest ongoing market perceptions of lower residential desirability, potentially reflecting persistent structural disadvantages and limited recovery following economic shocks.
Income-Based Variation in Housing Market Impacts
Table 6 distills how income level and segregation jointly shape price responses. Three contrasts stand out clearly. First, low-income neighborhoods with high segregation experienced the earliest and steepest negative price associations following the 2008 foreclosure crisis, underscoring their acute vulnerability amid prolonged disinvestment. Second, medium-income neighborhoods with similarly high segregation exhibited a delayed yet intensifying negative association post-2016, pointing to unresolved stigmatization despite relatively stronger economic resources. Third, high-income neighborhoods generally maintained stable or rising prices, especially in areas combining racial balance with moderate isolation, while even highly clustering affluent neighborhoods (Group 3) displayed negative associations even though that weakened over time.
Income and Segregation Interactions on Housing Price Effects.
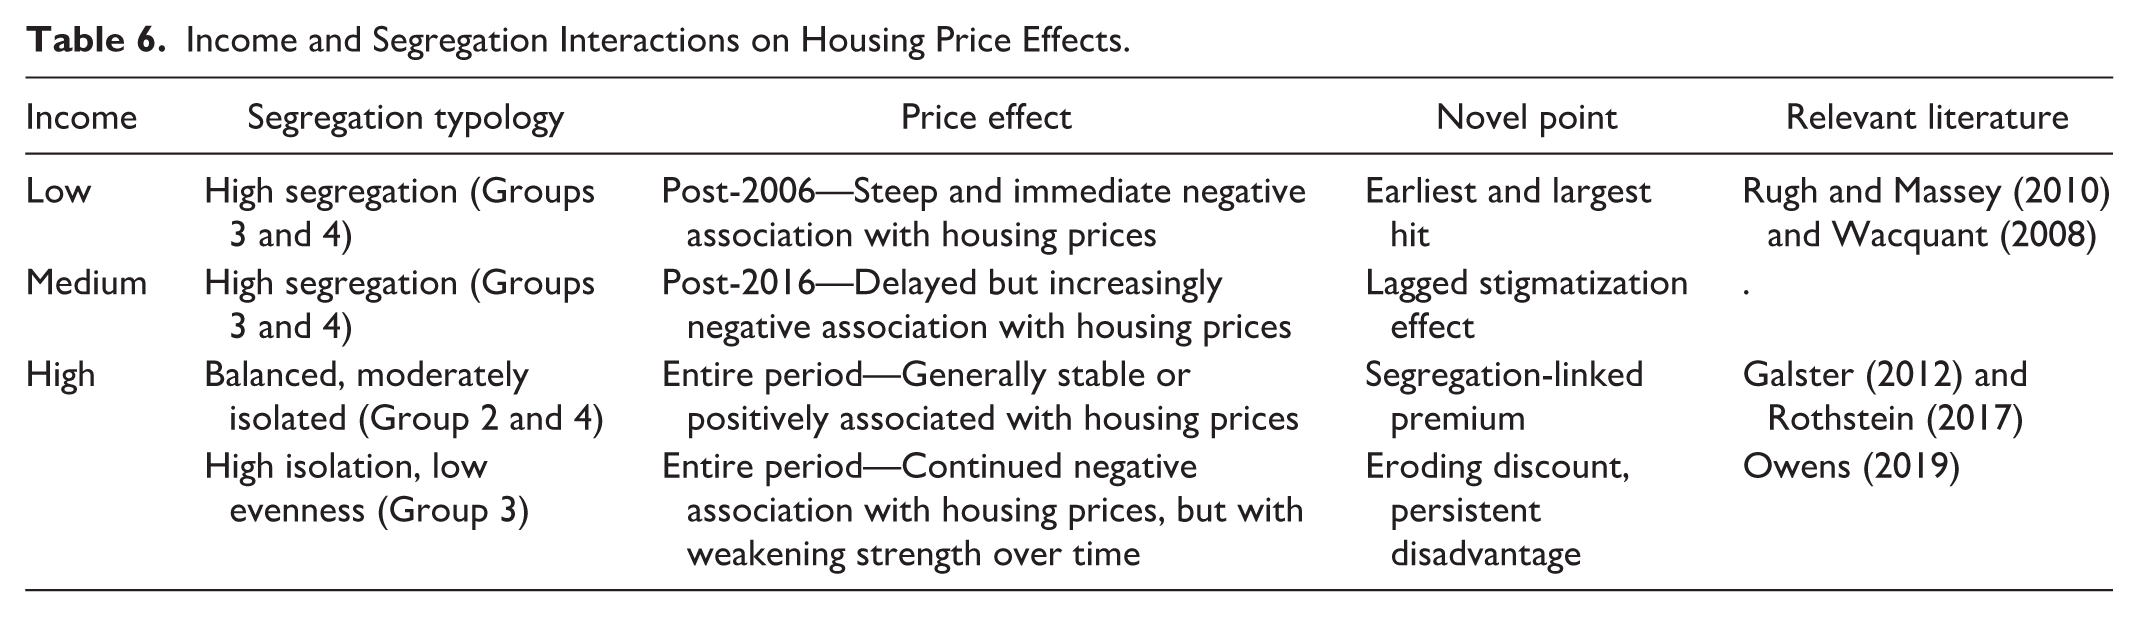
The comparative stability—and, for certain segregation typologies, increasing premiums—in high-income neighborhoods warrants careful interpretation. Rather than signaling genuine resilience, this persistent premium likely reflects structural exclusion and historically ingrained racism in American housing markets (Galster 2012; Rothstein 2017). Affluent neighborhoods frequently preserve property values through explicit or implicit barriers against lower-income and minority households—such as restrictive zoning, exclusionary lending, and entrenched cultural stigmas—that artificially inflate market desirability and property prices (Owens 2019). Thus, stable or positive price trajectories in affluent areas may not represent true economic resilience but rather enduring processes of socioeconomic and racial exclusion.
Conversely, the pronounced vulnerability of economically disadvantaged, highly segregated neighborhoods reveals persistent systemic neglect and racialized marginalization. Their steep, sustained price discounts reflect not isolated events but the accumulated effects of discriminatory lending, historical disinvestment, and entrenched stigma (Rugh and Massey 2010; Wacquant 2008). This enduring distress highlights the depth of structural racism, particularly under severe economic shocks, emphasizing the critical need for targeted, equity-oriented urban policies.
Meanwhile, the relative housing-market strength observed in neighborhoods characterized by moderate diversity yet high Non-Hispanic Black isolation requires careful interpretation within contemporary debates on mixed-race and mixed-income urban policies. Although such neighborhoods showed positive market associations, these premiums may reflect selective demographic shifts where higher-income newcomers integrate economically while lower-income Black residents remain socially isolated. Such shifts often produce outcomes—both intended and unintended—such as gentrification, displacement, and inequitable market-driven integration (Mah 2021; Small, Manduca and Johnston 2018). Consequently, while initial market outcomes appear favorable, deeper analysis indicates potential risks that demand balanced, inclusive planning strategies.
Taken together, these nuanced market responses call for interventions that recognize local histories, legal constraints, and established market patterns. Policymakers must carefully foster neighborhood diversity, equitable reinvestment, and broader socioeconomic integration—actions particularly vital for promoting equity and resilience in shrinking cities like Cleveland.
Policy Implications
The intricate interplay among racial segregation, housing prices, and neighborhood economic conditions in shrinking cities underscores the urgency of policies tailored to local environments and legal frameworks. In particular, targeted economic incentives can help address the vulnerabilities identified in this study—especially for low- and medium-income areas that have yet to fully recover from shocks such as the 2008 foreclosure crisis. These incentives can operate through three complementary instruments:
Conditional property-tax abatements, tied to affordability covenants, lower ownership costs while ensuring that newly built or renovated units remain accessible to moderate-income households (Local Housing Solutions 2021).
Block-level rehabilitation grants or 1 percent improvement loans stabilize aging housing stock and prevent speculative turnover in the hardest-hit census tracts (County Health Rankings & Roadmaps 2022).
Land-bank transfers to community land trusts convert tax-delinquent parcels into mixed-income or neighborhood-commercial use, reinvigorating price trajectories without direct race-based targeting (Shybalkina 2022).
At the same time, housing policy must be embedded within broader economic development strategies. Municipal initiatives can link segregated neighborhoods to employment centers through improved transit, while upgrading local amenities—schools, parks, and community facilities—to enhance neighborhood appeal for all residents. Aligning affordability tools with these revitalization efforts can help shrinking cities like Cleveland cultivate more economically diversified and resilient communities, indirectly fostering racial integration and reducing vulnerability to future economic shocks.
Finally, because historically segregated neighborhoods remain highly exposed to market volatility, policymakers should adopt forward-looking frameworks—such as early-warning vacancy indices or flexible subsidy set-asides—that can be deployed rapidly when new disruptions emerge. A practical equity-focused toolkit might include:
Community land trusts that secure affordable housing and retain legacy residents.
Right-to-return covenants granting displaced re-enters first claim on refurbished or newly constructed units.
Transit-oriented inclusionary-zoning overlays that require mixed-income development along corridors where price spikes are most likely.
Revolving rehabilitation funds offering low-interest loans once vacancy or tax-delinquency levels exceed preset thresholds.
Implemented together, these instruments can counter entrenched housing-market disparities and chart a more inclusive course for cities facing sustained population loss.
Conclusion
This study examined the relationship between racial segregation and single-family housing prices in Cuyahoga County, Ohio—which contains the City of Cleveland and its surrounding municipalities —over the 1986–2021 period. Segregation patterns are closely associated with house-price trajectories. Block groups that mix some racial diversity with high Black isolation have held or gained value, whereas deeply segregated, low-income areas have lost value—especially during and after the 2008 foreclosure crisis.
Several limitations should be noted. First, this study focuses exclusively on Cleveland and Cuyahoga County due to constraints on housing transaction data, limiting the broader applicability of its results. Expanding research to include additional shrinking cities and regions would help verify whether the observed patterns hold under different economic or demographic conditions. Second, the analysis targets the single-family housing market, omitting multifamily and rental segments that can be particularly relevant in low-income, segregated neighborhoods. Future research incorporating these housing types may provide a more comprehensive view of market dynamics. Finally, reliance on decennial census data restricts the ability to capture short-term demographic or market fluctuations, potentially affecting the temporal resolution of the findings. Moreover, certain neighborhood indicators—such as detailed household composition, short-term migration flows, and rental-market characteristics—are constrained by the availability and temporal resolution of our data sources. Employing more granular data sources, where available, could enhance the precision of future analyses.
Given these constraints, future studies could compare shrinking and growing cities to explore the ways in which segregation dynamics diverge under varying conditions of urban growth. Investigating whether preferences for segregated versus integrated neighborhoods change in response to evolving economic, demographic, or regional factors could also offer valuable insights for urban policy. In addition, integrating other contextual variables—such as proximity to employment, school quality, and local amenities—may yield a deeper understanding of how segregation influences long-term housing market outcomes and broader urban stability.
By centering on Cleveland as a representative case, this study illuminates how local segregation patterns uniquely affect housing prices in declining urban settings. Building upon this framework, future research could incorporate policy implications, zoning regulations, and the influence of urban governance to develop more targeted, context-sensitive strategies for promoting neighborhood integration, market resilience, and equitable revitalization across diverse metropolitan contexts.
Footnotes
Declaration of Conflicting Interests
The authors declared no potential conflicts of interest with respect to the research, authorship, and/or publication of this article.
Funding
The authors received no financial support for the research, authorship, and/or publication of this article.