
Abstract
The older population in the United States is growing rapidly, yet their residential mobility patterns are understudied. Using the confidential version of the American Community Survey, this study examines variations in residential mobility outcomes across population subgroups, focusing on racial/ethnic and educational groups. Findings reveal disparities among older adult households: households of color and less-educated households often relocate to high-poverty areas, while non-Hispanic whites and college-educated households move to low-poverty areas. These trends highlight residential mobility’s role in perpetuating neighborhood inequality and underscore the need for improved neighborhood quality and accessibility for older adults, whether relocating or aging in place.
Keywords
Introduction
In the United States, the older population, defined as individuals aged sixty-five and older, is rapidly increasing in both size and proportion due to the aging of the large baby boom generation and rising life expectancies. Projections indicate that over the next two decades, more than fifty million U.S. households will have householders aged sixty-five or older, including over 17.5 million with householders aged eighty or older (McCue 2018). As finances, functional status, household structure, and care needs evolve with age, older adults’ residential needs and preferences also shift.
One way older adults adapt to their changing needs is through residential relocation (Wiseman 1980). Declines in physical and mental health may prompt them to move to age-friendly neighborhoods with access to health and support services or closer to adult children (Begley and Chan 2022; Spring et al. 2017). Although older adults have lower mobility rates compared with younger age groups (5.7% for those sixty-five and older vs 14.2% for those under sixty-five), data from the 2023 American Community Survey (ACS) show that more than 3.4 million people aged sixty-five and over relocated in the twelve months preceding the survey. This number is expected to increase as more baby boomers reach retirement age.
Residential environments significantly influence the lives of residents (Ellen and Turner 1997; Sharkey and Faber 2014), with older adults being particularly vulnerable to environmental and health risks (Mather and Scommegna 2017). Research increasingly highlights the connections between older adults’ health and neighborhood characteristics, particularly the link between high-poverty neighborhoods and poor health outcomes (Padeiro et al. 2022; Yen, Michael, and Perdue 2009). These findings suggest that existing residential segregation in U.S. neighborhoods may worsen health and well-being disparities among older adults. However, relatively little is known about the neighborhoods older adults move into and out of, or how mobility patterns vary across population subgroups. This study aims to fill that gap.
Using the confidential version of the ACS and regression models, we examine the household characteristics associated with moves to low- or high-poverty neighborhoods. The internal ACS microdata, which identify the previous and current home locations of mover households, makes this annual and nationally representative survey particularly valuable for studying residential mobility trends among smaller population subgroups. The findings reveal substantial disparities between racial/ethnic and educational attainment groups, indicating that residential mobility often perpetuates neighborhood inequality. Moves by non-Hispanic white and college-educated older households are associated with relocations to low-poverty census tracts, whereas households with householders of color and those with less-educated householders are more likely to move into high-poverty census tracts. These results underscore a pressing need for planners to address inequities in older adult mobility.
Older Adult Mobility and Neighborhood Inequality
Residential Segregation, Mobility, and Older Adults
Residential inequality and segregation remain persistent challenges in American society, limiting opportunities and access to resources for marginalized people and communities (Ellen and Steil 2019; Massey and Denton 1993). Neighborhood segregation restricts the residential mobility options of disadvantaged groups (Bruch 2014; Charles 2003); otherwise, residential mobility often reinforces urban spatial structures marked by racial and socioeconomic stratification, with households tending to move to neighborhoods similar to their origin (Boustan 2010; Sharkey 2012). Despite extensive research, however, there is still limited understanding of how residential mobility patterns among older adults are linked to neighborhood inequality and segregation. Anecdotal evidence highlights the need for greater attention to older adults’ mobility patterns. Figure 1 shows the white-to-non-white racial dissimilarity index, a measure of neighborhood segregation, by age group in 2011 and 2021. It indicates that residential segregation decreased across all age groups in 2021 compared with 2011, consistent with findings from recent decennial censuses (Logan and Stults 2022). Two key trends emerge. First, segregation rises significantly after the 25–34 age group, with sharper increases observed in older age groups in both years. Second, tracking the same birth cohorts over time reveals a decline in within-cohort racial segregation over the life course, except for individuals born in 1946 or earlier (i.e., sixty-five years and over in 2011). These patterns suggest that older adults’ mobility has substantially contributed to uneven population distributions, emphasizing the importance of understanding residential mobility trends among this group.
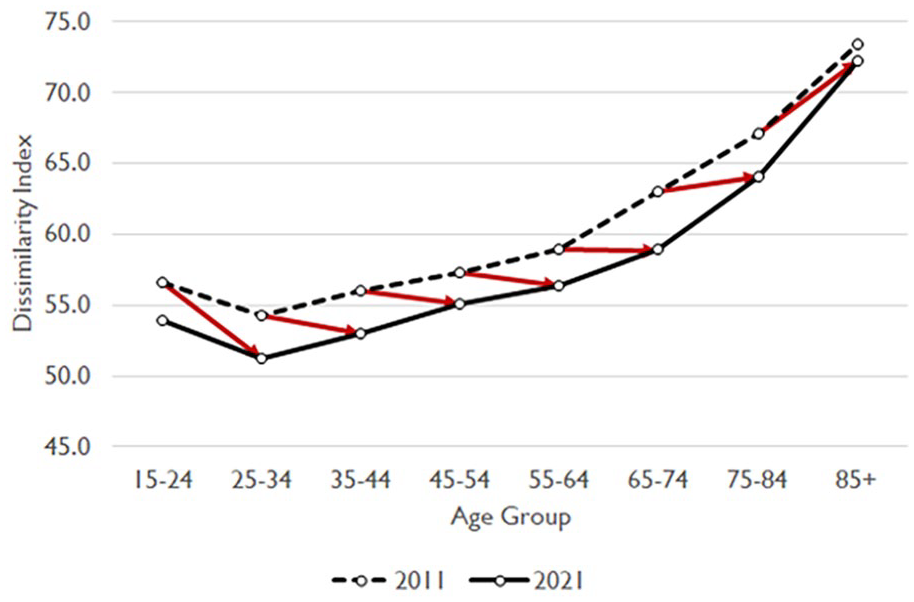
White to non-white racial dissimilarity index by age, 2011–2021.
Disparities in Neighborhood Environments and Well-being Among Older Adults
Residential segregation and neighborhood inequality significantly contribute to disparities in how people age (Ailshire and García 2018). Socioeconomically disadvantaged neighborhoods adversely affect older adults’ physical health, mental well-being, and cognitive function, even when individual characteristics are controlled. For instance, older adults in low socioeconomic status (SES) neighborhoods report poorer self-rated health compared with those in higher SES areas (Subramanian et al. 2006). In addition, these neighborhoods are linked to higher rates of obesity (Grafova et al. 2008), heart disease (Freedman, Grafova, and Rogowski 2011), depressive symptoms (Kubzansky et al. 2005), and mobility difficulties (Balfour and Kaplan 2002). A review by Yen, Michael, and Perdue (2009) highlights numerous studies associating neighborhood disadvantage—characterized by high poverty, low incomes, and high unemployment—with poorer health outcomes among older adults. Recent reviews have also confirmed the connections between neighborhood environments and older adults’ well-being, including happiness and life satisfaction (Padeiro et al. 2022). Further, research has identified causal effects of place on health and mortality, linking lower mortality rates to neighborhoods with higher SES status, better healthcare access, milder climates, and lower crime rates (Deryugina and Molitor 2021; Finkelstein, Gentzkow, and Williams 2021). These findings underscore the critical role of neighborhood context in shaping health trajectories as people age.
Racial and Socioeconomic Disparities in Residential Mobility Patterns
Research on residential mobility across all age groups has examined how mobility patterns vary across population subgroups, focusing particularly on race and income. Using data from the Panel Study of Income Dynamics (PSID), South and Crowder (1997) found that high SES households were more likely to move to census tracts with a higher proportion of non-Hispanic white residents. In contrast, black movers were more likely to leave non-Hispanic white tracts and less likely to move into them, while non-Hispanic white movers were often relocated from more integrated areas to predominately non-Hispanic white tracts. Building on this, South, Crowder, and Chavez (2005) further found that among households originating in high-poverty neighborhoods, non-Hispanic white individuals were most likely to move to low-poverty areas. Conversely, black households in low-poverty neighborhoods had the highest likelihood of relocating to high-poverty areas. In addition, economically pressured residents with fewer resources frequently move to more disadvantaged neighborhoods, characterized by lower median incomes, higher poverty, and increased crime rates (DeLuca, Garboden, and Rosenblat 2013; Desmond and Shollenberger 2015).
Determinants of Older Adult Mobility
Research on older adult mobility draws on several theoretical frameworks to explain migration. Wiseman (1980) proposed that migration decisions are influenced by triggering mechanisms, push and pull factors, personal circumstances, and external conditions. Empirical studies have applied these frameworks to explore the factors influencing older adults’ relocation decisions, focusing on housing circumstances, community attachment, and household characteristics.
Homeownership and housing suitability play pivotal roles. Older adults often downsize or transition from owner-occupied to renter-occupied homes due to changes in health and marital status (Painter and Lee 2009). Homeowners are generally less likely to move than renters (Longino et al. 2008; Stoeckel and Porell 2010). Older adults residing in multiunit buildings or homes that fail to meet their needs, such as those lacking accessibility, are more likely to relocate (Granbom et al. 2019; Weeks, Keefe, and Macdonald 2012). Conversely, housing that facilitates single-floor living or is easy to maintain reduces the likelihood of moving (Granbom et al. 2019; Smetcoren et al. 2017).
Community ties significantly impact mobility. Older adults with strong place attachment, long-term residency, and proximity to social networks are less likely to move (Ewen et al. 2014; Longino et al. 2008). Resistance to relocation can stem from the challenges of adapting to new environments and routines (Atchley 1989; Stoeckel and Porell 2010). Family ties and social networks often guide residential mobility decisions, with older adults preferring to move closer to relatives and friends (Begley and Chan 2022; Spring et al. 2017). These connections reduce relocation friction and provide incentives for moving (Buchel et al. 2020).
Household characteristics also influence migration. While older adults are generally less likely to move as they age, relocation becomes more common post-retirement (Longino et al. 2008). Higher financial resources and education levels correlate with an increased likelihood of moving (Stoeckel and Porell 2010; Weeks, Keefe, and Macdonald 2012). Marital status can affect mobility, though its impact varies; widowhood, for instance, often triggers a move, particularly within the first year of loss (Chevan 1995). Poor health, including depression, falls, and hospital admissions, serves as a significant push factor, increasing the likelihood of relocation (Granbom et al. 2019; Stoeckel and Porell 2010).
Residential Mobility Among Older Adults
While neighborhood conditions may play a crucial role in older adults’ health and well-being, relatively little research has explored the characteristics of the neighborhoods to which older adults relocate and how these vary across population subgroups. In Wiseman (1980)’s conceptualization, decisions about destinations are informed by knowledge of potential locations, availability of desired amenities and services, opportunities for engagement in the community, location of family and friends, and outside recruiting (e.g., advertising); these are mediated through influences and constraints such as older adults’ financial resources and cost of living. The life course model suggests certain types of destinations motivated by one’s particular life stage (amenity-rich locations, those proximate to support networks, and institutional settings).
Marois, Lord, and Morency (2019) found that early retirees in the Quebec region exhibited income-driven relocation patterns, with higher-income individuals moving to wealthier neighborhoods. Similarly, Li, Hu, and Guo (2022) observed that most older adults in the United States who had recently moved reported their new neighborhoods to be of similar or better quality than their previous ones. This was particularly true for those relocating to areas with transportation alternatives, age-restricted housing, or suburban settings. In contrast, “long-distance movers” were more likely to report worse neighborhood quality, likely due to relocating closer to family rather than for amenities. Molinsky et al. (2020), using AARP’s Livability Index, found that most older movers selected neighborhoods with similar livability scores to their previous ones. Only 11 percent moved to areas with higher livability scores, while 14 percent moved to less livable areas. These findings highlight the uneven distribution of livable communities across the nation, as well as the complex interplay of race, income, and neighborhood contexts in shaping mobility and location choices for older adults.
In summary, residential mobility is closely linked to persistent neighborhood inequality and segregation, a challenge that is particularly pronounced for older adults who are more vulnerable to the adverse effects of poor neighborhood conditions. Despite this, there is limited research on residential mobility outcomes of older adults, especially using nationally representative samples. This paper aims to address this gap by examining how residential mobility patterns for older adults vary across population subgroups, with a particular focus on race and educational attainment.
Methods and Data
This study examines residential mobility patterns among older adult households, defined as those with householders sixty-five years and older. While previous research explored mobility rates (i.e., aging in place vs relocating) and its determinants, this paper emphasizes the quality of mobility by analyzing characteristics of destination neighborhoods compared with origin neighborhoods. Following established conventions (Crowder, Pais, and South 2012; South and Crowder 1997), the primary focus is on changes in neighborhood poverty rates between origin and destination. A positive value indicates a move to a high-poverty neighborhood, while a negative value denotes a move to a low-poverty neighborhood.
To examine residential mobility patterns across racial/ethnic and educational attainment groups, we employ a multivariate regression model:

where yijk,t + 1 represents the difference in poverty rates between the origin and destination neighborhoods for household i in origin neighborhood j in metropolitan area k that relocated to a different neighborhood between year t and year t + 1. Neighborhoods are defined as census tracts, a widely accepted proxy for neighborhoods (Crowder, Pais, and South 2012; Massey and Denton 1993). The vectors
The model includes Metropolitan Statistical Area (MSA) fixed-effects (σk) and year fixed-effects (τt) to account for time-invariant metro-specific factors and year-specific variations affecting all older adult households. There are 366 metropolitan areas, and each state’s non-metropolitan areas have their own fixed-effects. The sample includes all moves nationwide, encompassing metro and non-metro areas. Standard errors are clustered at the origin census tract-level. The analysis is restricted to households with householders aged sixty-five and older in year t who relocated to a different census tract between year t and year t + 1. Household sample weights were applied to produce nationally representative estimates, and all monetary values were adjusted to 2019 dollars. 2
Our analysis of residential mobility among older adult households is based on the confidential version of the American Community Survey (ACS) microdata from 2011 to 2019. While previous residential mobility studies often used panel data (e.g., PSID, HRS, SIPP, New York Fed Consumer Credit Panel), these data sets have limitations, such as biennial collection and underrepresentation of smaller racial/ethnic groups and low-income populations due to survey design and smaller sample sizes (Meijer and Karoly 2017; Mateyka and Hall 2024). The ACS, an annual and nationally representative household survey, serves as a benchmark for other public and private surveys and databases. Although it cannot assess full family relationships and is inherently cross-sectional as in PSID and HRS, its internal files offer unique advantages, making it novel and well-suited for studying residential mobility among older adult households.
First, similar to the ACS Public Use Microdata Sample (PUMS), the restricted-use data provides extensive demographic and socioeconomic information for millions of individuals and households. In addition, the confidential version includes detailed geographic data on both current residence and previous residence at the census block level, allowing researchers to identify origin and destination. Finally, its large sample size ensures sufficient statistical power and precision to analyze residential mobility patterns among small population subgroups. These strengths make the data a robust resource for exploring residential mobility among older adults.
Although cross-sectional, the ACS’s unique data structure links household and neighborhood characteristics prior to a move (year t) with the outcomes following the move (year t + 1). For example, the 2019 ACS survey collects data on individuals and households in 2019. In the questionnaire, it asks whether the individuals and households moved between 2018 and 2019 and if they moved, their residential locations in both years. With this variable, we can analyze residential mobility outcomes in year t + 1 (e.g., 2019) in relation to household and neighborhood characteristics in year t (e.g., 2018). By leveraging this temporal linkage, the analysis provides valuable insights into the dynamics of residential mobility among older adult households from 2011 to 2019.
Our primary dependent variable is the difference in poverty rate between the origin and destination census tracts. While neighborhood poverty is a widely used metric, we recognize that it can be an imperfect measure. First, the relative status of a neighborhood with a 10-percent poverty rate can differ significantly across regions, such as Napa, California and El Paso, Texas. To address this limitation, we also use the within-Metropolitan Statistical Area (MSA) percentile rank of neighborhood poverty rates as an alternative measure. This approach allows us to capture differences in the relative status of neighborhoods within the same metropolitan area, rather than relying solely on absolute poverty rates. The estimated coefficients from this analysis reflect the relative change in neighborhood status between origin and destination. Both poverty rate and within-MSA poverty percentile were obtained from the internal ACS data.
Neighborhood poverty may not fully capture the most relevant characteristics of older adults, particularly those in retirement communities. Reina and Aiken (2022) highlighted that traditional neighborhood measures, such as poverty rates, might not adequately reflect the needs of elderly subsidized households. Instead, they emphasized health and well-being indicators as more relevant measures of neighborhood characteristics. Previous literature also suggests that local amenities significantly impact well-being of older adults and thus serve as push and pull factors of their migration (Finkelstein, Gentzkow, and Williams 2021; Padeiro et al. 2022; Wiseman 1980). Building on these, our analysis incorporates alternative neighborhood measures to ensure robustness. We draw on a broad set of socioeconomic characteristics and amenities to provide a more comprehensive view. From the ACS, additional socioeconomic indicators include share of households with single-mother householders, college graduate share, median household income, median property value, and median gross rent. To further capture neighborhood amenities, we use data from the National Neighborhood Data Archive (NaNDA) to measure the availability of amenities, such as grocery stores, museums and libraries, senior centers, and hospitals. 3
We account for household and neighborhood characteristics associated with residential mobility outcomes. Although the ACS data are not longitudinal, we can derive individual household characteristics prior to a move (i.e., year t) using their time-invariant attributes or other relevant variables. For demographic and life cycle factors, we assume that characteristics such as sex, race/ethnicity, and citizenship status remain unchanged over a year. In addition, variables like age and marital status prior to a move can be inferred using available data (e.g., age, marital status, change in marital status in the past twelve months). Among socioeconomic factors, educational attainment serves as a key variable of interest, acting as a proxy for lifetime income. Since many older adults are retirees, current income may be less indicative of their economic well-being. However, the ACS does not capture time-variant household characteristics before a move, such as household income, employment status, homeownership, or household size. To avoid potential bias from variables that might be directly correlated with mobility outcomes, we exclude them from our base regression models. Nonetheless, we conduct robustness tests to examine whether including these variables at t + 1 impacts our findings.
Previous research highlights that neighborhood characteristics significantly influence residential mobility decisions, whether through the physical environment or social ties (Ewen et al. 2014; Longino et al. 2008). Accordingly, we account for origin neighborhood characteristics using the available ACS variables, including distance from the Central Business District (CBD); share of residents aged sixty-five and over; share of people of color; poverty rate; college graduate share; share of households with single-mother householders; vacancy rate; single-family unit share; median household income; median home value; and median gross rent. The primary objective is to control for neighborhood attributes that may shape residential mobility outcomes, rather than to establish causal relationships between these characteristics and mobility outcomes. From this perspective, the results can be interpreted as regression-adjusted means of outcomes rather than causal associations.
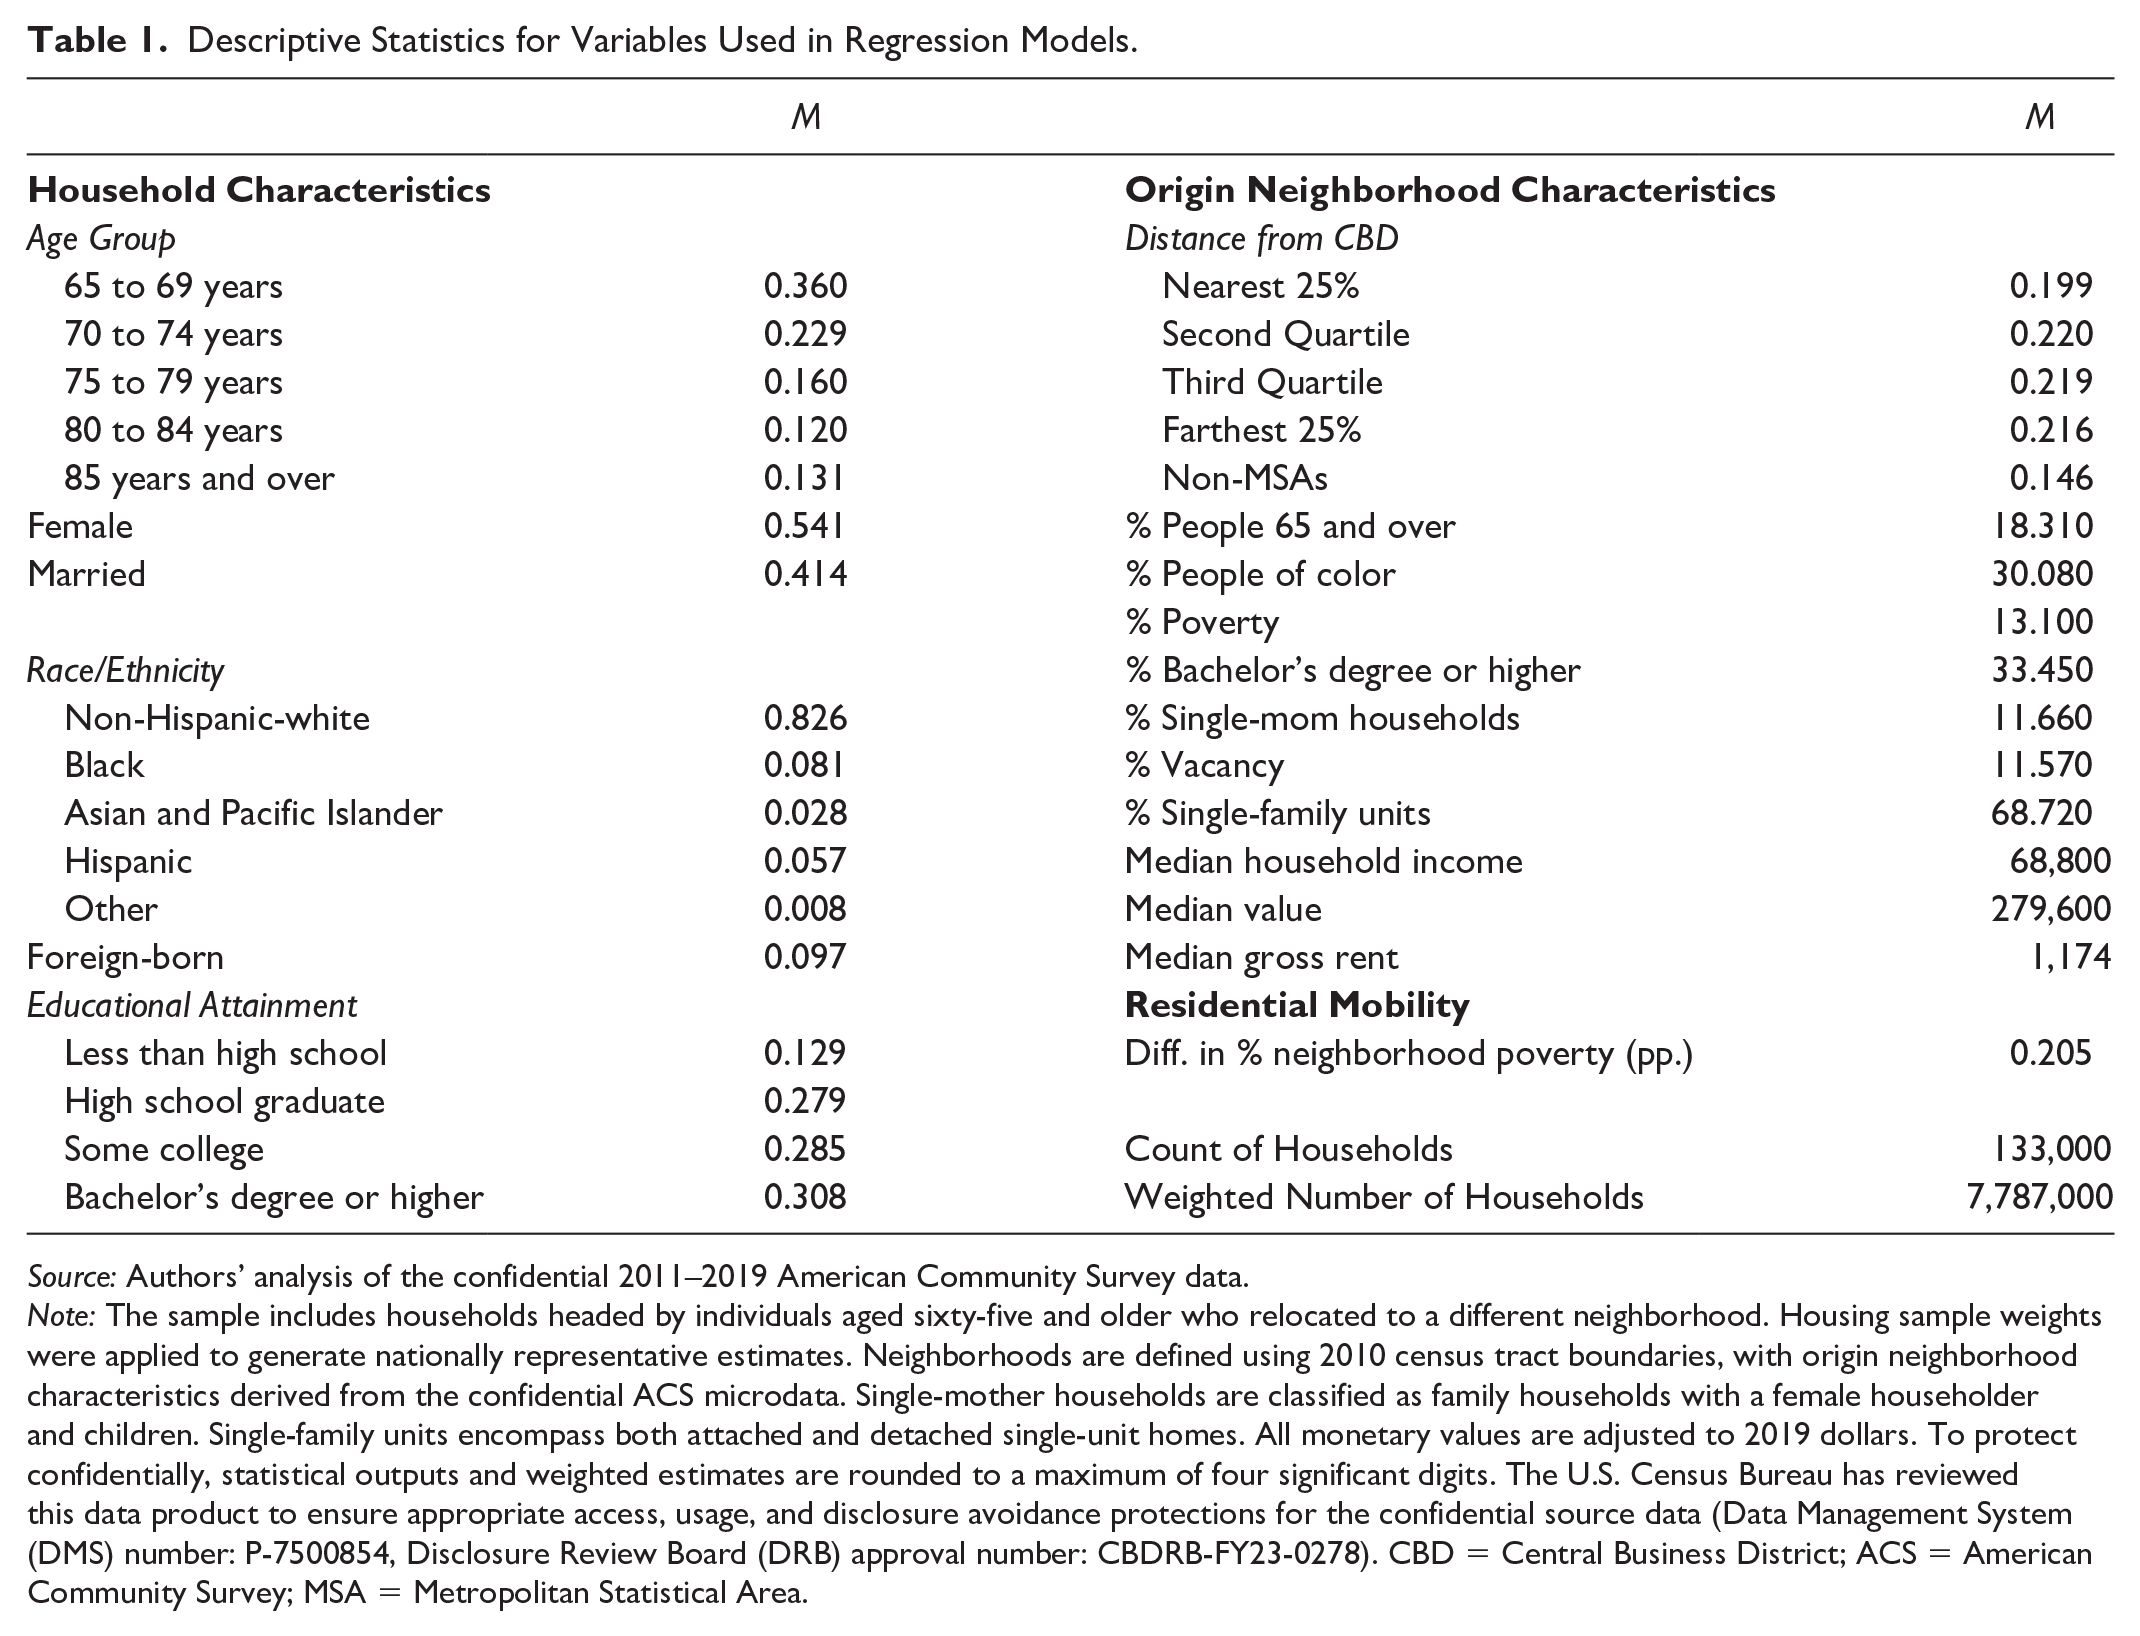
Table 1 presents the descriptive statistics for the variables used in the regression models. Based on the pooled cross-sectional 2011–2019 ACS sample, approximately 7.8 million households with householders aged sixty-five and older relocated to a different census tract during the period. On average, this corresponds to about 865,000 older adult households moving to a new neighborhood in each survey year. The average difference in neighborhood poverty rates between origin and destination is about 0.2 percentage points, suggesting overall residential mobility trends toward census tracts with a slightly higher poverty rate.
Descriptive Statistics for Variables Used in Regression Models.
Source: Authors’ analysis of the confidential 2011–2019 American Community Survey data.
Note: The sample includes households headed by individuals aged sixty-five and older who relocated to a different neighborhood. Housing sample weights were applied to generate nationally representative estimates. Neighborhoods are defined using 2010 census tract boundaries, with origin neighborhood characteristics derived from the confidential ACS microdata. Single-mother households are classified as family households with a female householder and children. Single-family units encompass both attached and detached single-unit homes. All monetary values are adjusted to 2019 dollars. To protect confidentially, statistical outputs and weighted estimates are rounded to a maximum of four significant digits. The U.S. Census Bureau has reviewed this data product to ensure appropriate access, usage, and disclosure avoidance protections for the confidential source data (Data Management System (DMS) number: P-7500854, Disclosure Review Board (DRB) approval number: CBDRB‑FY23‑0278). CBD = Central Business District; ACS = American Community Survey; MSA = Metropolitan Statistical Area.
Racial and Socioeconomic Disparities in Residential Mobility Outcomes
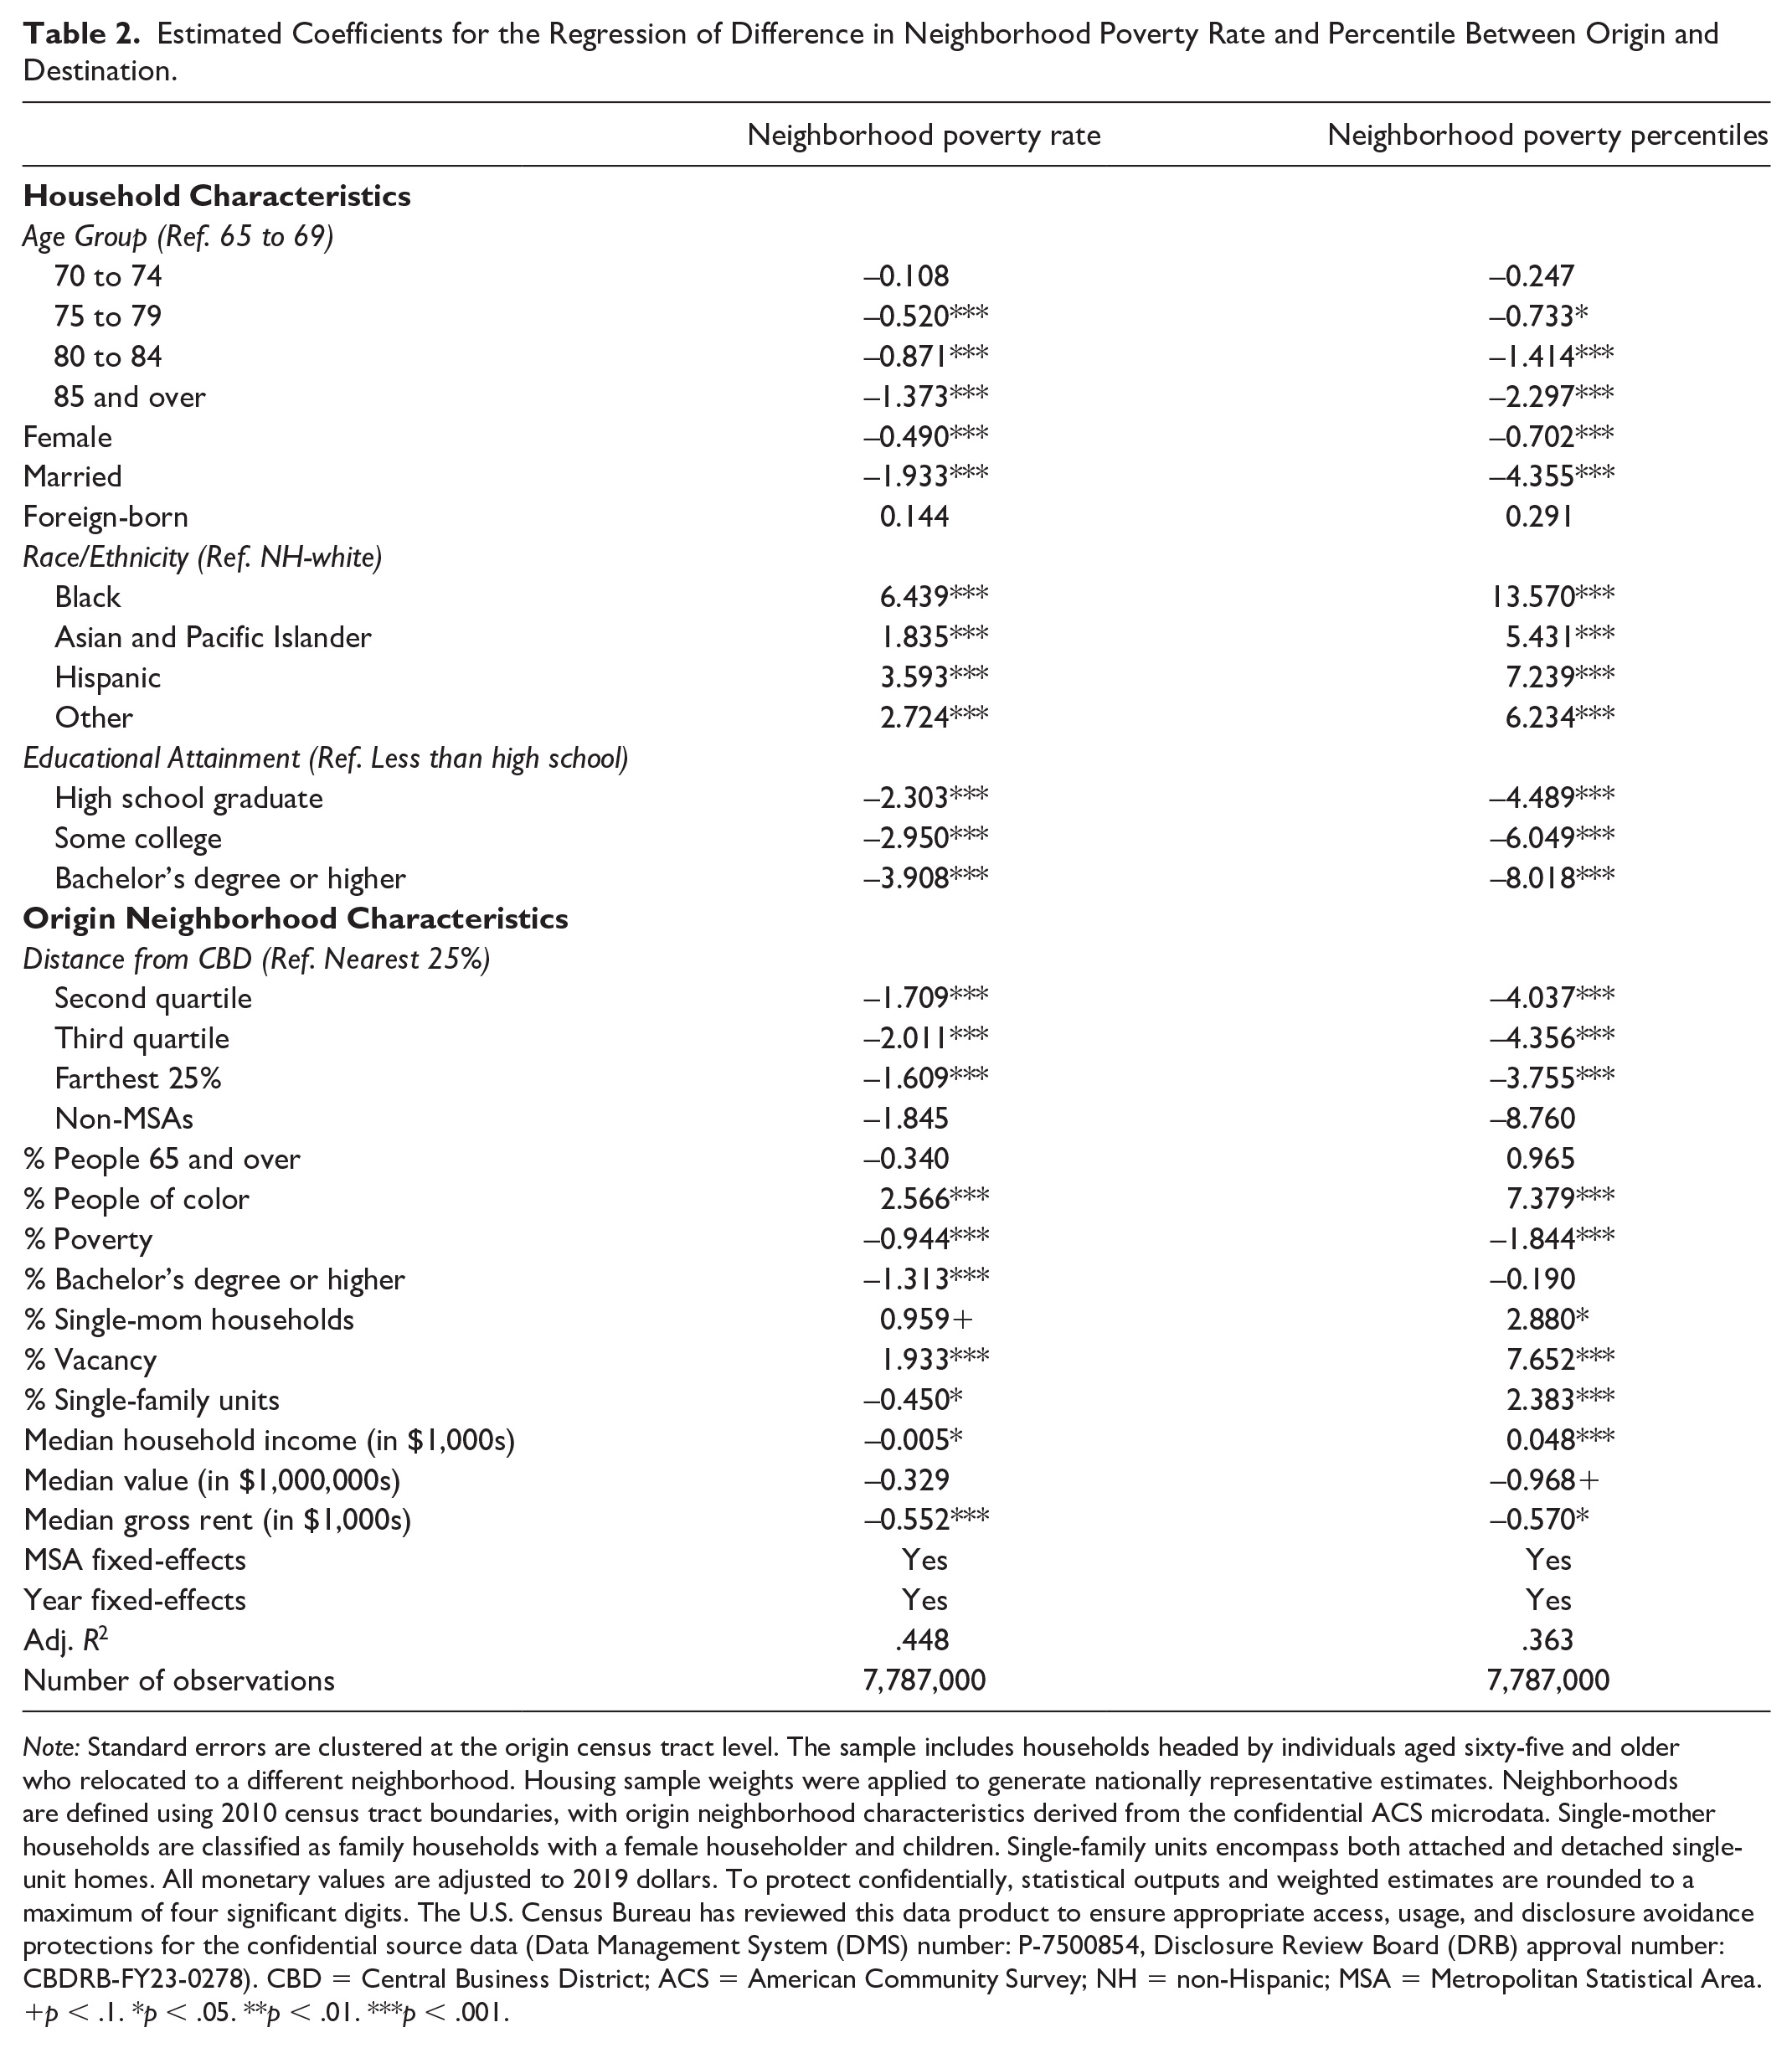
We begin by analyzing variations in residential mobility outcomes across population subgroups, controlling for relevant covariates. Table 2 presents differences in neighborhood poverty levels as a function of household and neighborhood characteristics. The first column reports changes in neighborhood poverty rates between origin and destination census tracts, while the second column shows results based on the within-MSA neighborhood poverty percentile.
Estimated Coefficients for the Regression of Difference in Neighborhood Poverty Rate and Percentile Between Origin and Destination.
Note: Standard errors are clustered at the origin census tract level. The sample includes households headed by individuals aged sixty-five and older who relocated to a different neighborhood. Housing sample weights were applied to generate nationally representative estimates. Neighborhoods are defined using 2010 census tract boundaries, with origin neighborhood characteristics derived from the confidential ACS microdata. Single-mother households are classified as family households with a female householder and children. Single-family units encompass both attached and detached single-unit homes. All monetary values are adjusted to 2019 dollars. To protect confidentially, statistical outputs and weighted estimates are rounded to a maximum of four significant digits. The U.S. Census Bureau has reviewed this data product to ensure appropriate access, usage, and disclosure avoidance protections for the confidential source data (Data Management System (DMS) number: P-7500854, Disclosure Review Board (DRB) approval number: CBDRB‑FY23‑0278). CBD = Central Business District; ACS = American Community Survey; NH = non-Hispanic; MSA = Metropolitan Statistical Area.
p < .1. *p < .05. **p < .01. ***p < .001.
The regression results indicate that, after controlling for household and neighborhood characteristics, mover households with a black older adult householder experienced an average increase of 6.4 percentage points in neighborhood poverty rates, or 13.6 percentiles in within-MSA rankings, compared with non-Hispanic white movers. Similarly, Asian and Hispanic households relocated to census tracts with higher poverty rates than their non-Hispanic white counterparts, with increases ranging from 1.8 to 3.6 percentage points, or 5.4 to 7.2 percentiles. Regarding educational attainment, households with college-graduate householders moved to census tracts with poverty rates about 3.9 percentage points lower, or 8.0 percentiles lower, than those with householders without a high school diploma. These findings underscore that older adult households of color and those with lower educational attainment are disproportionately likely to relocate to high-poverty neighborhoods compared with their non-Hispanic white and college-educated counterparts.
Table 2 reveals substantial disparities in mobility outcomes among older adult households across racial/ethnic and educational attainment groups. However, given the close correlation between race/ethnicity and educational attainment, the observed results may be influenced by confounding effects. To account for this, we examine interactions between them to explore how residential relocation outcomes vary within each educational attainment group across racial/ethnic categories. The summarized results are presented in Table 3. 4
Summarized Results of Regression Analysis with Race/Ethnicity-Educational Attainment Interactions.

Note: Full regression results are reported in Supplemental Appendix Table B-4. Standard errors are clustered at the origin census tract level. The sample includes households headed by individuals aged sixty-five and older who relocated to a different neighborhood. Housing sample weights were applied to generate nationally representative estimates. Neighborhoods are defined using 2010 census tract boundaries, with origin neighborhood characteristics derived from the confidential ACS microdata. Single-mother households are classified as family households with a female householder and children. Single-family units encompass both attached and detached single-unit homes. All monetary values are adjusted to 2019 dollars. To protect confidentially, statistical outputs and weighted estimates are rounded to a maximum of four significant digits. The U.S. Census Bureau has reviewed this data product to ensure appropriate access, usage, and disclosure avoidance protections for the confidential source data (Data Management System (DMS) number: P-7500854, Disclosure Review Board (DRB) approval number: CBDRB‑FY23‑0278). NH = non-Hispanic; MSA = Metropolitan Statistical Area.
p < .1. *p < .05. **p < .01. ***p < .001.
The estimated coefficients for the interaction terms are statistically significant and negative, suggesting that the racial/ethnic disparities in mobility outcomes are smaller among households with higher educational attainment compared with those with lower levels. 5 Using these coefficients, we predict the difference in neighborhood poverty for all cases, while holding other covariates constant (Table 4).
Predicted Difference in Neighborhood Poverty Rate by Race/Ethnicity and Educational Attainment.

Note: Standard errors are clustered at the origin census tract level. The sample includes households headed by individuals aged sixty-five and older who relocated to a different neighborhood. Housing sample weights were applied to generate nationally representative estimates. The joint significance of neighborhood poverty quintile and race/ethnicity was tested based on the regression results shown in Table 3 and by Stata 16’s postestimation command “margin.” To protect confidentially, statistical outputs and weighted estimates are rounded to a maximum of four significant digits. The U.S. Census Bureau has reviewed this data product to ensure appropriate access, usage, and disclosure avoidance protections for the confidential source data (Data Management System (DMS) number: P-7500854, Disclosure Review Board (DRB) approval number: CBDRB‑FY23‑0278). NH = non-Hispanic.
The simulation predicts that older adult households with a black householder without a high school diploma are likely to relocate to census tracts with poverty rates 9.8 percentage points higher than those of their origin census tracts. In comparison, non-Hispanic white households are expected to move to census tracts with a 1.4 percentage point higher than those of origin tracts, resulting in an 8.4 percentage point disparity compared with their black counterparts. While the racial gap diminishes with higher educational attainment, black college-educated households are still predicted to experience an increase in neighborhood poverty by 2.5 percentage points, compared with 1.4 percentage points for non-Hispanic white households without a high school diploma. Similar trends are evident among Hispanic households, highlighting that education alone does not fully eliminate racial disparities in mobility outcomes. 6
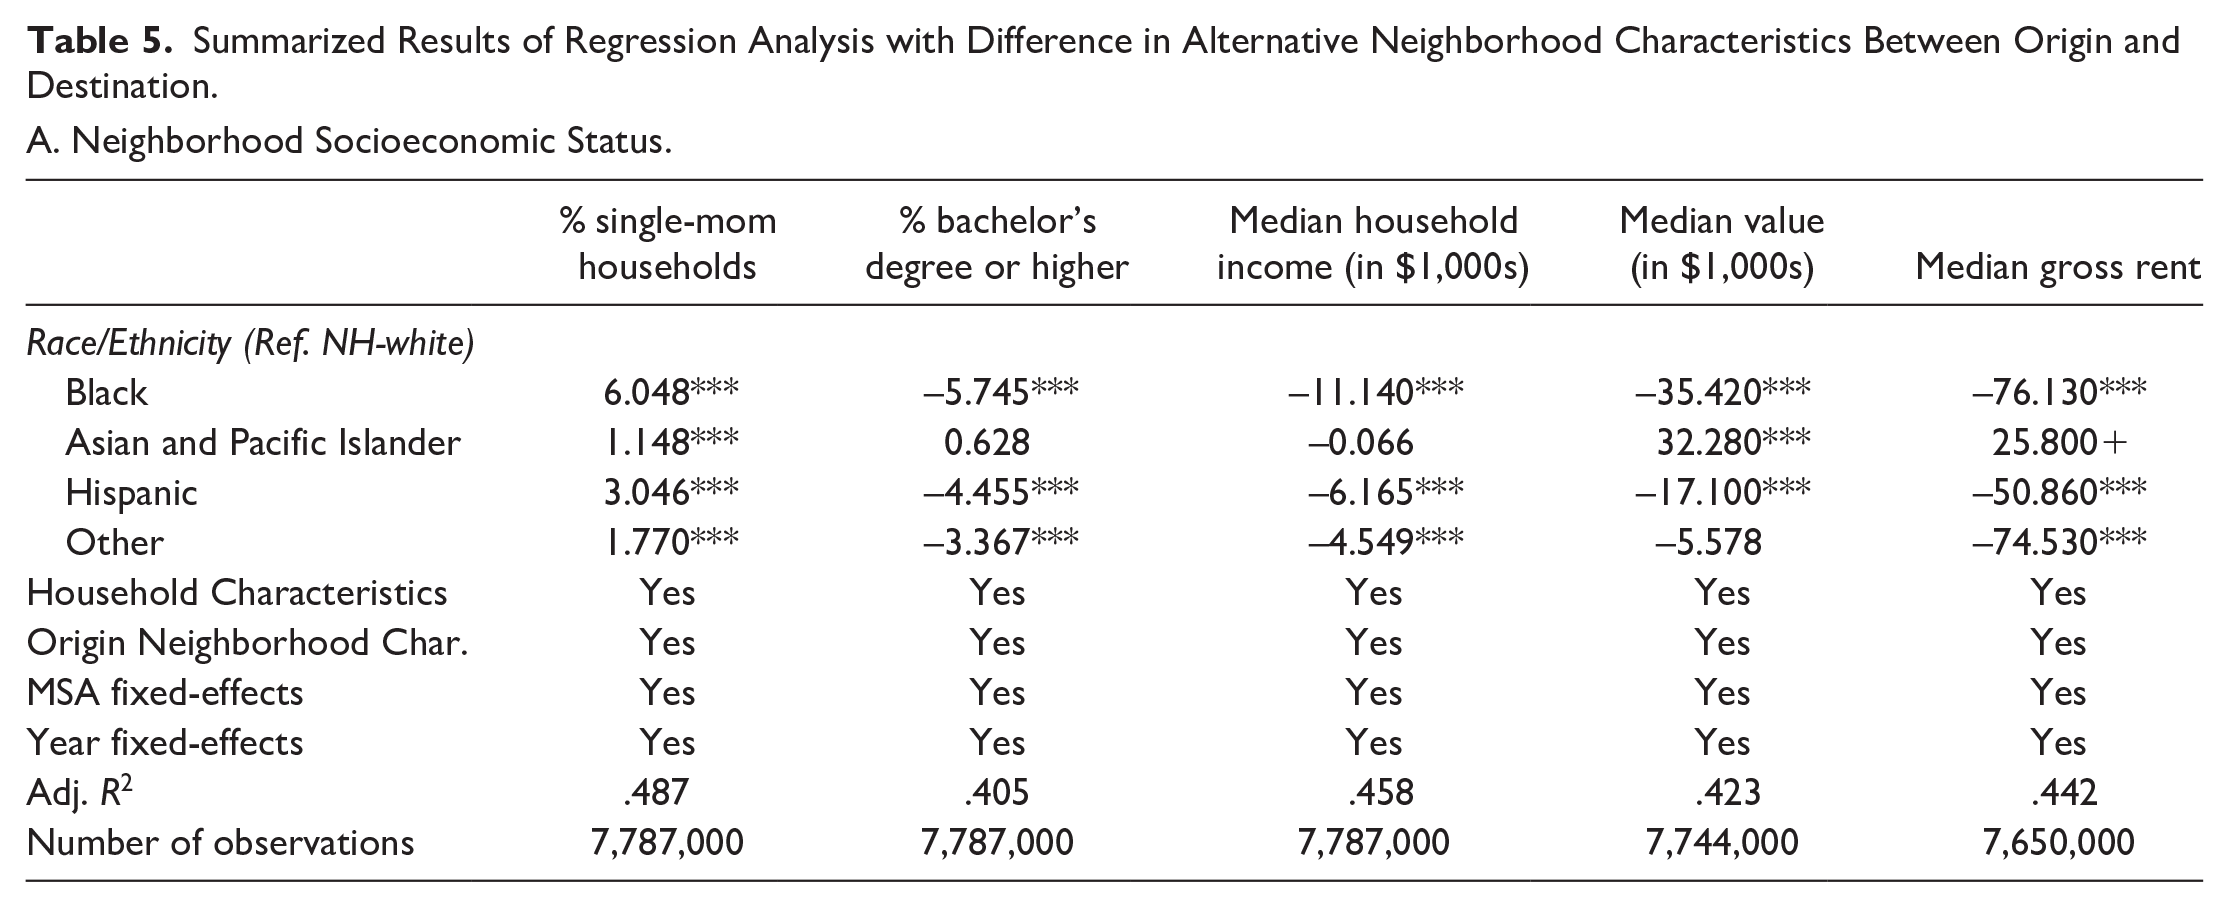
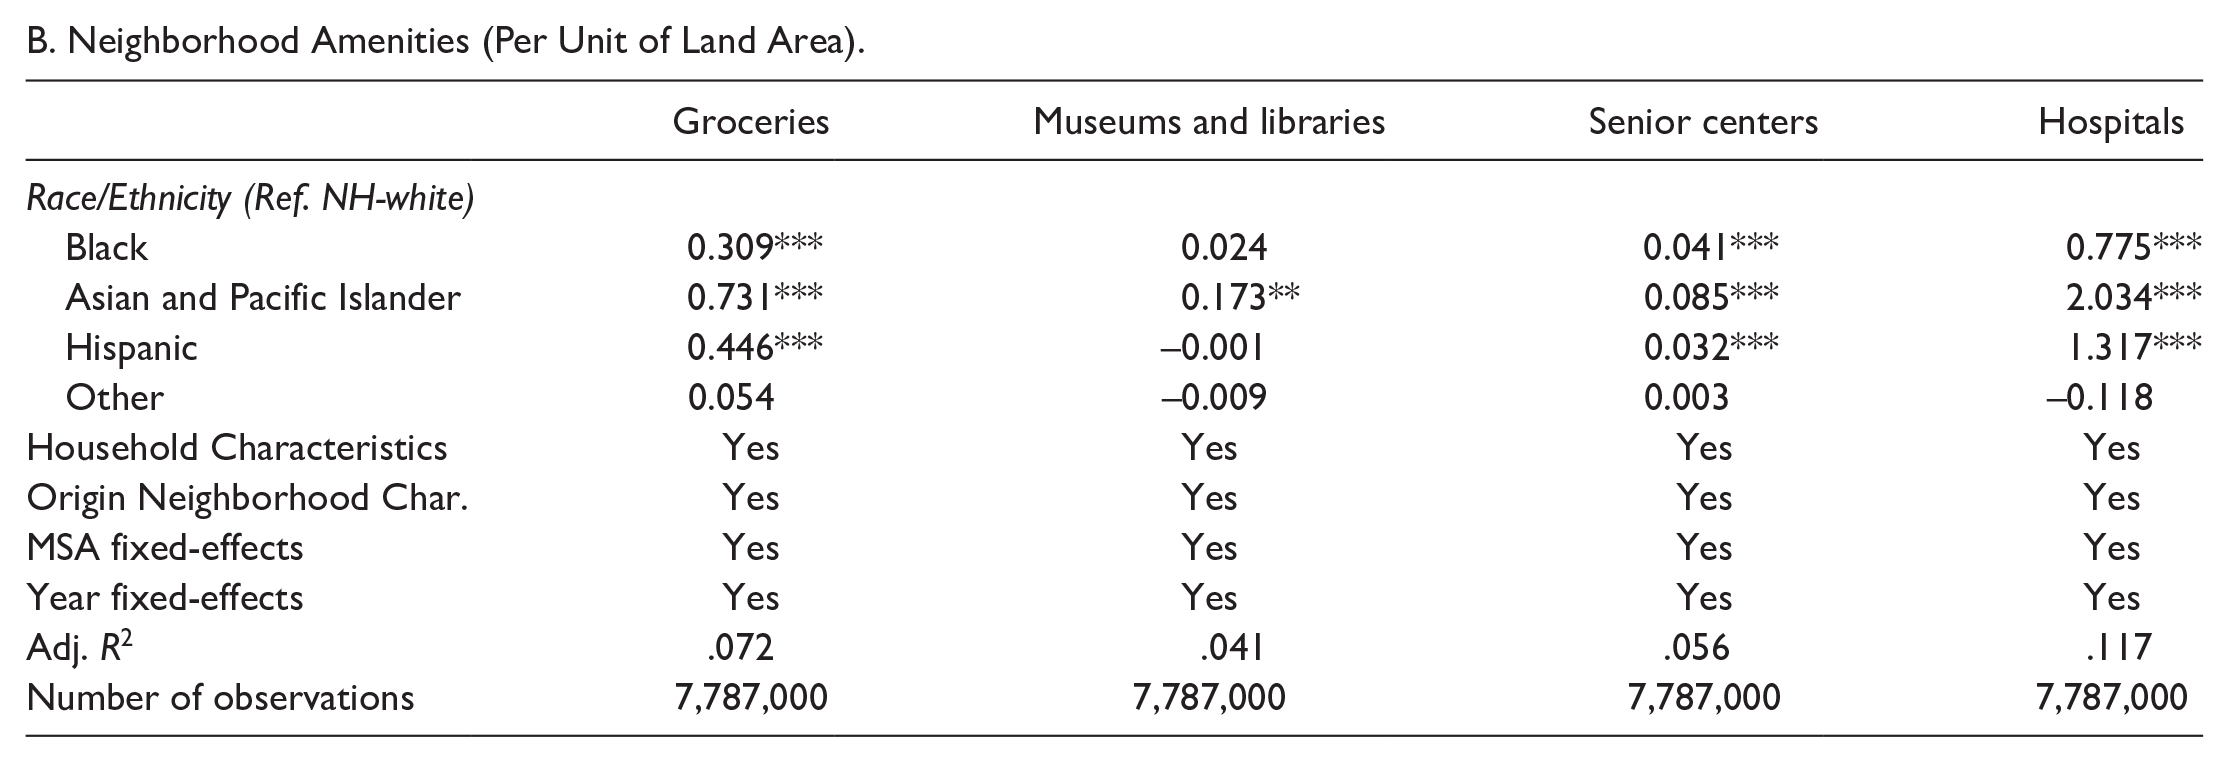
Beyond neighborhood poverty, we broaden our analysis to include a more comprehensive set of socioeconomic characteristics and neighborhood amenities as alternative measures of residential mobility outcomes (Table 5). For socioeconomic characteristics, the results consistently indicate that older adult households with black and Hispanic householders relocate to census tracts with a lower SES than their origin, in contrast to non-Hispanic white movers. Specifically, these neighborhoods exhibit a greater proportion of single-mother households and lower college graduate shares, household incomes, and housing prices (Panel A of Table 5).
Summarized Results of Regression Analysis with Difference in Alternative Neighborhood Characteristics Between Origin and Destination.
A. Neighborhood Socioeconomic Status.
B. Neighborhood Amenities (Per Unit of Land Area).
C. Neighborhood Amenities (Per Capita).
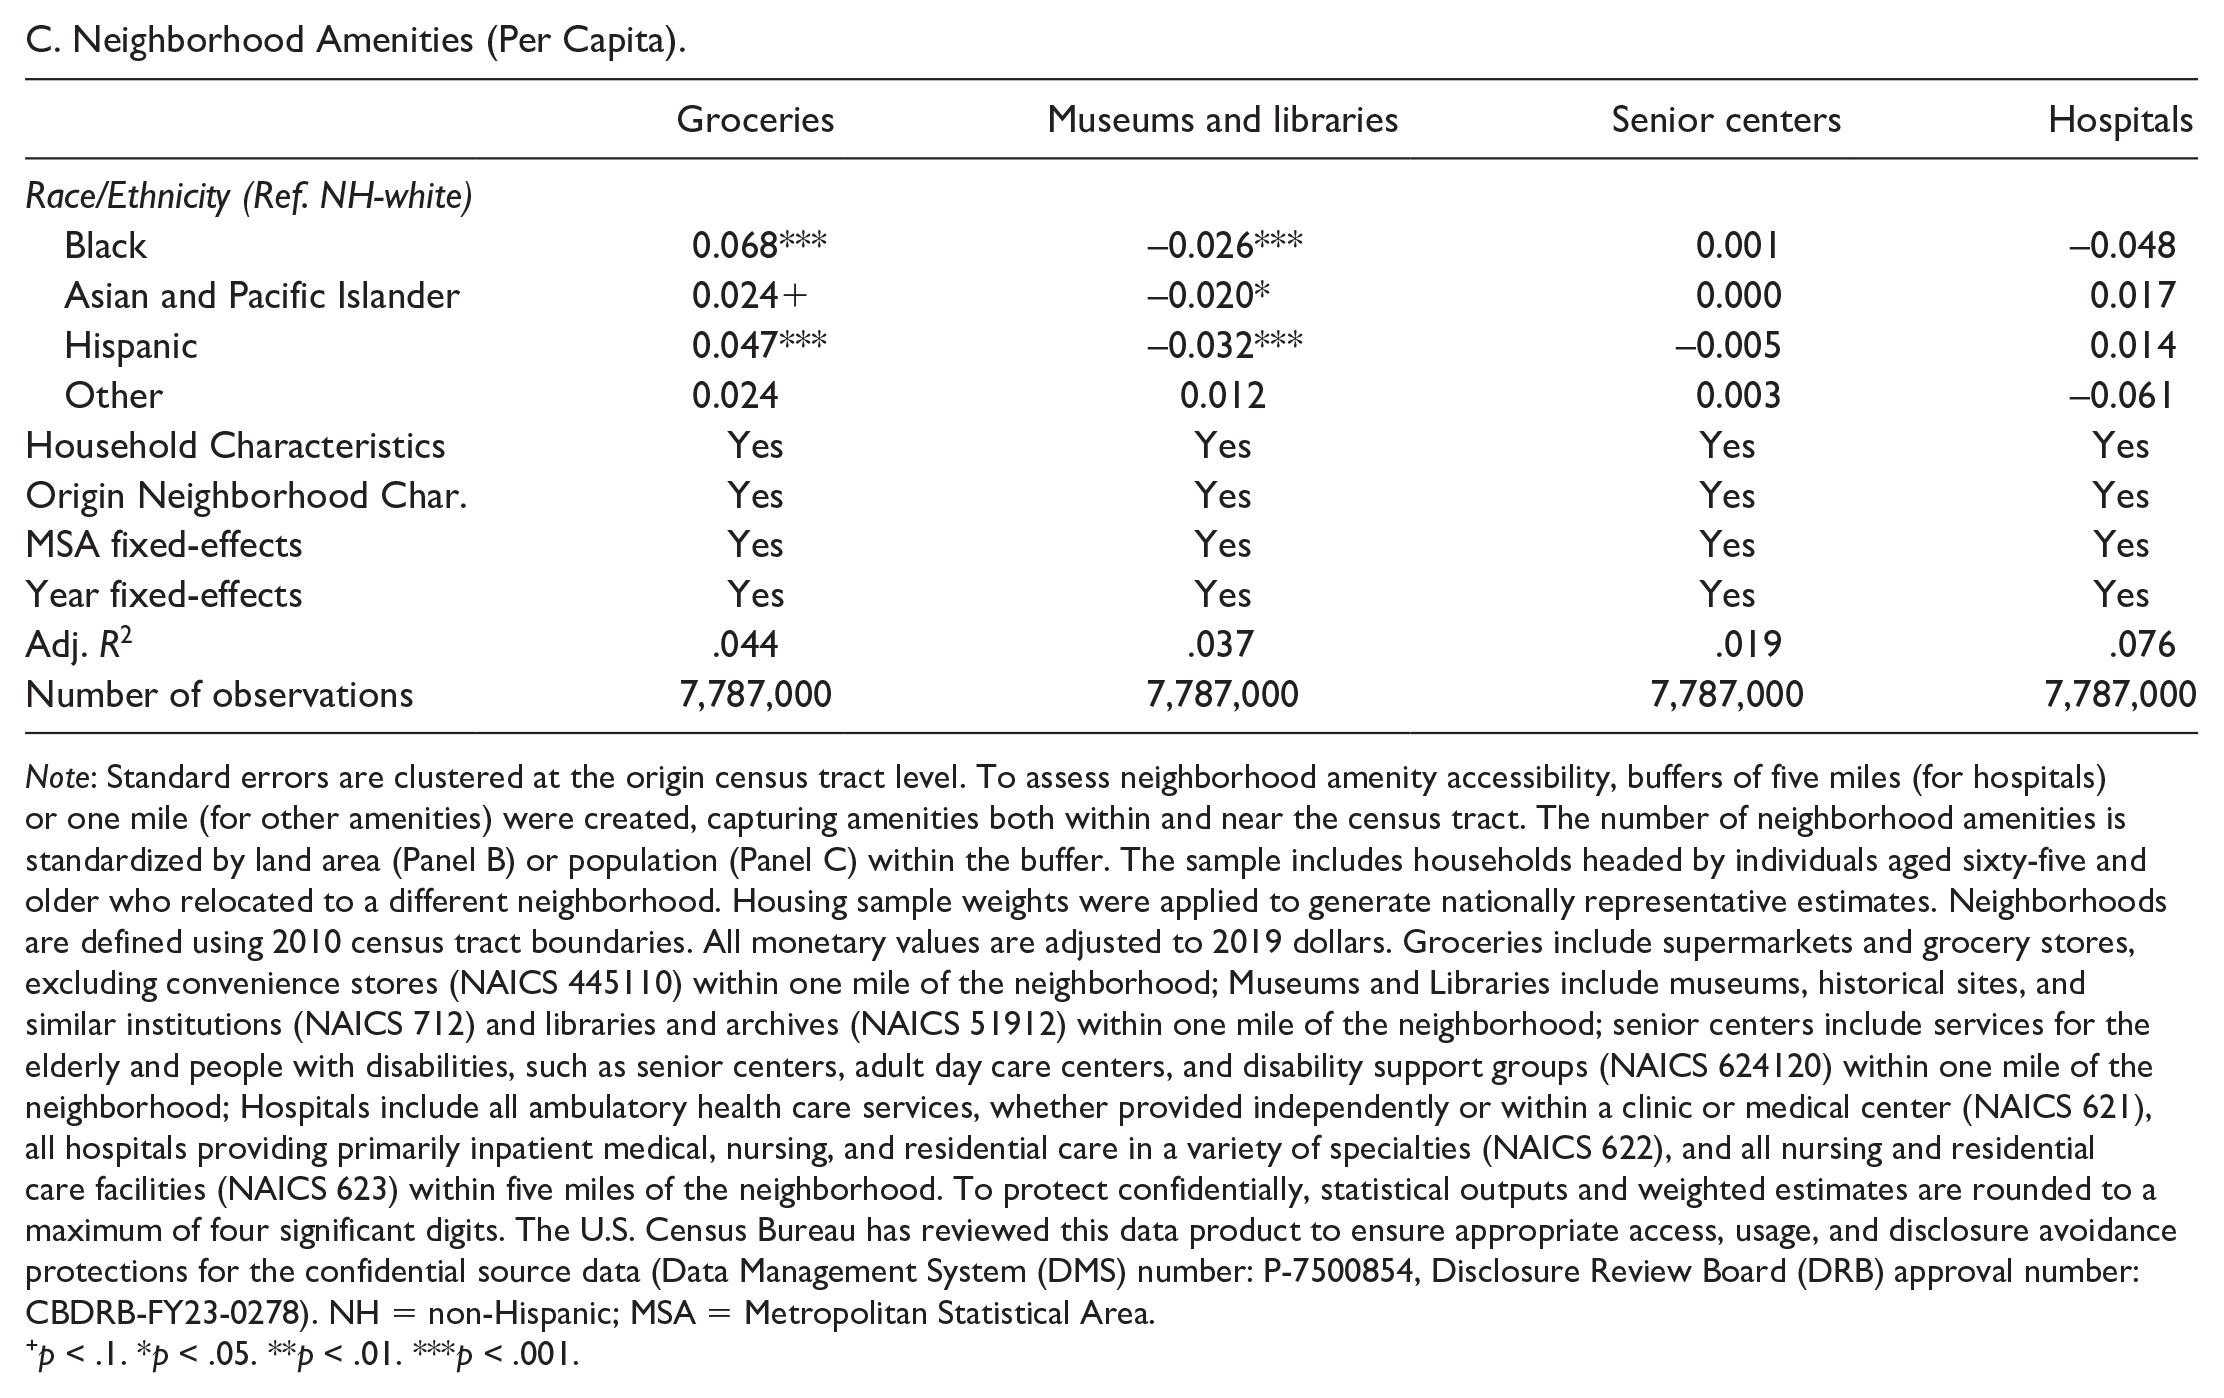
Note: Standard errors are clustered at the origin census tract level. To assess neighborhood amenity accessibility, buffers of five miles (for hospitals) or one mile (for other amenities) were created, capturing amenities both within and near the census tract. The number of neighborhood amenities is standardized by land area (Panel B) or population (Panel C) within the buffer. The sample includes households headed by individuals aged sixty-five and older who relocated to a different neighborhood. Housing sample weights were applied to generate nationally representative estimates. Neighborhoods are defined using 2010 census tract boundaries. All monetary values are adjusted to 2019 dollars. Groceries include supermarkets and grocery stores, excluding convenience stores (NAICS 445110) within one mile of the neighborhood; Museums and Libraries include museums, historical sites, and similar institutions (NAICS 712) and libraries and archives (NAICS 51912) within one mile of the neighborhood; senior centers include services for the elderly and people with disabilities, such as senior centers, adult day care centers, and disability support groups (NAICS 624120) within one mile of the neighborhood; Hospitals include all ambulatory health care services, whether provided independently or within a clinic or medical center (NAICS 621), all hospitals providing primarily inpatient medical, nursing, and residential care in a variety of specialties (NAICS 622), and all nursing and residential care facilities (NAICS 623) within five miles of the neighborhood. To protect confidentially, statistical outputs and weighted estimates are rounded to a maximum of four significant digits. The U.S. Census Bureau has reviewed this data product to ensure appropriate access, usage, and disclosure avoidance protections for the confidential source data (Data Management System (DMS) number: P-7500854, Disclosure Review Board (DRB) approval number: CBDRB‑FY23‑0278). NH = non-Hispanic; MSA = Metropolitan Statistical Area.
p < .1. *p < .05. **p < .01. ***p < .001.
When evaluating neighborhood amenities, the results present a mixed picture. Compared to non-Hispanic white households, black and Hispanic households are more likely to move to census tracts that have higher densities of grocery stores, senior centers, and hospitals per unit of land area (Panel B of Table 5). However, this pattern is largely attributed to the higher population density of these destination neighborhoods. When amenities are measured on a per-capita basis, there are no statistically significant differences in the availability of senior centers or hospitals across racial/ethnic groups (Panel C of Table 5). While black and Hispanic movers tend to experience improvements in access to grocery stores after moving, compared with non-Hispanic white counterparts, the patterns were opposite for museums and libraries.
Additional Tests
Previous research indicates that mobility outcomes can be especially disruptive for households with limited resources (DeLuca, Garboden, and Rosenblatt 2013; Desmond and Shollenberger 2015). To address this issue, we conducted stratified regression analyses by tenure status (owner- and renter-occupied households) and household income class (bottom 25%, middle 50%, and top 25%). 7 The results, presented in Table 6, should be interpreted with caution, as both tenure and income status were observed after moving. 8
Estimated Coefficients for the Regression of Difference in Neighborhood Poverty Rate Between Origin and Destination, Stratified by Tenure and Income Status.

Note: Full regression results are reported in Supplemental Appendix Table C-1. Standard errors are clustered at the origin census tract level. The sample includes households headed by individuals aged sixty-five and older who relocated to a different neighborhood. Housing sample weights were applied to generate nationally representative estimates. Neighborhoods are defined using 2010 census tract boundaries. To protect confidentially, statistical outputs and weighted estimates are rounded to a maximum of four significant digits. The U.S. Census Bureau has reviewed this data product to ensure appropriate access, usage, and disclosure avoidance protections for the confidential source data (Data Management System (DMS) number: P-7500854, Disclosure Review Board (DRB) approval number: CBDRB‑FY23‑0278). NH = non-Hispanic; MSA = Metropolitan Statistical Area.
p < .1. *p < .05. **p < .01. ***p < .001.
Despite this limitation, the findings reveal notable patterns. First, racial and socioeconomic disparities were even more pronounced among renter and low-income households. While post-move observation of tenure and income status necessitates cautious interpretation, these results suggest that unequal mobility outcomes are even more pronounced among socioeconomically disadvantaged groups. At the same time, the findings suggest that the racial/ethnic and educational gaps persist even within the socioeconomically advantaged group (i.e., homeowners and top 25% income earners). 9
Conclusion and Planning Implications
The older population in the United States is growing in size and share. By 2030, one in five individuals will be aged sixty-five or older, and by 2038, one-third of households will have householders in this age group (McCue 2018). However, many older households face housing insecurity and cost burdens, with inequalities among older adults becoming more pronounced (Joint Center for Housing Studies 2019). Understanding the mobility patterns of older adults is critical for supporting those who move and those who wish to remain in place but may have to relocate due to unsuitable housing, inadequate neighborhood supports, or other needs.
Our findings reveal significant disparities in residential mobility among older households. Households of color are more likely to move to high-poverty census tracts, even when controlling for covariates like educational attainment. These racial inequities reflect and reinforce settlement patterns shaped by systemic racism, which has historically constrained access to opportunities for households of color (Ailshire and García 2018). In addition, older households with less-educated householders, often with lower lifetime earnings, are more likely to relocate to areas with higher poverty rates than their previous neighborhoods. Such disparities can profoundly impact the health and well-being of older adults (Mather and Scommegna 2017; Padeiro et al. 2022; Yen, Michael, and Perdue 2009).
While the ACS data provides essential insights, it also has limitations. Census tract boundaries may not align with how older adults perceive and define their neighborhoods. By excluding moves within the same census tract, this analysis may underestimate overall residential mobility and may obscure subgroup-specific differences. The ACS data lacks identifiers for federally assisted or age-restricted housing, limiting our ability to account for key constraints on relocation as well. Furthermore, the cross-sectional nature of ACS prevents controlling for variables like income, employment status, and housing tenure before a move. The model could not incorporate variables influencing mobility outcomes, such as proximity to social ties, health status, and financial wealth (Begley and Chan 2022; Granbom et al. 2019; Spring et al. 2017; Stoeckel and Porell 2010). Some of these concerns could be relieved by robustness checks that include household characteristics after a move, but research based on alternative panel data with additional variables will help us deepen our understanding in future work. 10
The findings underscore a pressing need for planners to address inequities in older adult mobility. Expanding supportive and affordable housing across neighborhoods is essential. This includes developing options for older adults at all income levels, such as accessible apartments with lower maintenance costs. In lower-density areas, creating diverse housing options is particularly urgent. Policy interventions at various levels can support housing stability for older adults. These include reducing housing costs through utility assistance and property tax abatements, providing housing search counseling, retrofitting homes for aging-related needs, and expanding in-home support services. Such measures can help older adults stay in their communities or relocate to low-poverty neighborhoods without financial or accessibility barriers. Investments in local infrastructure and amenities are crucial for older adults in high-poverty neighborhoods. Diverse housing options, including intergenerational living and senior housing, should be prioritized. Ensuring these amenities are accessible, high-quality, and affordable is critical for equity.
Planning for an aging population requires a comprehensive neighborhood design and service provision (Forsyth, Molinsky, and Kan 2019). Neighborhood infrastructure must accommodate active older adults and those with disabilities. Social engagement opportunities, open spaces, safe streets, transportation alternatives, and robust support networks are essential. Community programs enhancing age-friendliness, like village networks and naturally occurring retirement community (NORC) organizations, can play a pivotal role. Planners can support these initiatives by partnering with nonprofit, private, and government sectors to create equitable environments for older adults.
Supplemental Material
sj-docx-1-jpe-10.1177_0739456X251326055 – Supplemental material for Disparities in Residential Mobility Outcomes Among Older Adults in the United States
Supplemental material, sj-docx-1-jpe-10.1177_0739456X251326055 for Disparities in Residential Mobility Outcomes Among Older Adults in the United States by Hyojung Lee, Whitney Airgood-Obrycki and Jennifer Molinsky in Journal of Planning Education and Research
Footnotes
Declaration of Conflicting Interests
The author(s) declared no potential conflicts of interest with respect to the research, authorship, and/or publication of this article.
Funding
The author(s) disclosed receipt of the following financial support for the research, authorship, and/or publication of this article: This research was conducted while the authors were Special Sworn Status researchers of the U.S. Census Bureau at the Boston Research Data Center and the Georgetown University Research Data Center. Results and conclusions are those of the authors and do not necessarily reflect the views of the U.S. Census Bureau. The results shown in this draft have been reviewed by the U.S. Census Bureau’s Disclosure Review Board, authorization numbers CBDRB-FY21-POP001-0066, CBDRB-FY22-046, and CBDRB‑FY23‑0278.
Supplemental Material
Supplemental material for this article is available online.
Notes
Author Biographies
References
Supplementary Material
Please find the following supplemental material available below.
For Open Access articles published under a Creative Commons License, all supplemental material carries the same license as the article it is associated with.
For non-Open Access articles published, all supplemental material carries a non-exclusive license, and permission requests for re-use of supplemental material or any part of supplemental material shall be sent directly to the copyright owner as specified in the copyright notice associated with the article.