
Abstract
Neighborhoods are typically conceptualised as static administrative units with clearly defined boundaries. However, residents’ everyday mobility forms activity spaces which are variable in both extent and fabric. This study introduces a novel aggregate model of individualized activity spaces based on Public Participation geographic information system (PPGIS) data collected in Espoo (Finland) to capture the variable and fuzzy character of the spaces people frequent in their everyday lives. Building on the theoretical concept of soft spaces, we propose a GIS-based method for identifying functional neighborhoods which could be useful in planning practice with a view to knowledge, actor involvement, and planning policies.
Keywords
Introduction
Background and Research Objectives
Administrative territories with fixed boundaries represent a key frame for policy and decision making as well as a common analytical unit in spatial modeling and analysis. However, the potential mismatches between administrative boundaries and functional spaces have been well documented in various contexts.
In the context of planning and policy making, issues of territoriality, scale, and rescaling, referring to the challenge of finding the appropriate spatial level of intervention have been discussed since the 1970s (see, e.g., Brenner 2004, 2016; Raffestin and Butler 2012; Soja 1971). Starting in the late 2000s, the debate has gained momentum through the introduction of the concept of “soft spaces” (Cavaco et al. 2022; Haughton and Allmendinger 2007; Purkarthofer and Granqvist 2021). Soft spaces are newly emerging, fluid spaces in between clearly defined administrative territories and are said to better reflect the “real geographies” of planning challenges, therefore providing suitable spatial frames for policy responses. While soft spaces can affect decision and policy making through new governance mechanisms, powerful spatial imaginaries, and ad-hoc actor constellations (Purkarthofer 2022), they are not claimed to replace administrative territories. As a result, questions about the relationship between soft and hard spaces, and about the mutual influence of policy decisions associated with them often remain unanswered (Purkarthofer 2016). A broad range of spatial delineations have been termed soft spaces, including macro-regions and megaregions (Harrison and Gu 2021; Purkarthofer, Sielker, and Stead 2022), cross-border regions (Zimmerbauer and Paasi 2020), city regions (Haughton and Allmendinger 2015; Olesen 2017), and development corridors (Jauhiainen and Moilanen 2011), highlighting the demand for a concept to grasp the emergence of new flexible spatial delineations in governance practice.
In the context of geospatial analysis, mismatches have been identified between static boundaries and the ways residents use urban space (Hasanzadeh, Broberg, and Kyttä 2017), using various methods, such as GPS tracking (Laatikainen, Hasanzadeh, and Kyttä 2018) or complex modeling (Hasanzadeh et al. 2019). These studies have not only highlighted significant variation between individuals’ use of space but also painted an overall picture of an increasingly mobile urban population. These findings suggest that more attention needs to be paid to ways of optimizing neighborhood boundaries to accurately reflect the issues at hand. However, at the same time, these studies have pointed to methodological limitations related to data availability and softer approaches of modeling boundaries (Hasanzadeh, Laatikainen, and Kyttä 2018).
In this article, we challenge traditional definitions of neighborhoods which are based on rigid and often arbitrary criteria and explore how conceptualizations of neighborhoods could build on the activity and mobility patterns of residents. To do so, this article brings together arguments from the fields of planning theory and geospatial analysis related to rethinking administrative boundaries with the aim to make a methodological, theoretical, and practical contribution to further the discussion on planning in functional spaces. First, it introduces a novel methodology for modeling functional neighborhood areas (FNAs) based on individual activity spaces, examines variations in activity space characteristics, and reflects on differences between administrative boundaries and FNAs. Second, these findings are discussed from the viewpoint of soft spaces with the aim to address three largely overlooked aspects in the soft spaces literature: the conceptualization of soft spaces at the sub-local and neighborhood scale; the derivation of soft spaces from spatially referenced data (rather than political and governance consideration); and the systematic identification of soft spaces to comprehensively cover an administrative territory, albeit in an overlapping and fuzzy manner. Third, the article explores the potential implications of the presented methodological and theoretical advancements for planning practice.
“Hard” and “Soft” Delineations of Neighborhoods
Various definitions of urban neighborhoods exist, catering to various purposes and resulting in different spatial delineations. In the context of public policy, neighborhoods typically represent the lowest tier of a hierarchical territorial structure and are delineated as bounded administrative areas. In different areas and depending on the use domain, various ways have been used to draw practical boundaries for neighborhoods (Gauvin et al. 2007). For example, in census geography, the definition of neighborhoods often uses homogeneity and contiguity as the main criteria (Gauvin et al. 2007). In the housing literature, on the contrary, neighborhoods are often identified based on criteria such as homogeneous property values, socioeconomic characteristics, political jurisdictions, school districts, or other similar housing attributes (Clapp and Wang 2006).
While areal delineations of neighborhoods with fixed, static boundaries might have served the original practical or administrative purposes, empirical evidence suggests that they often poorly correspond with the ways residents use urban space (Hasanzadeh, Broberg, and Kyttä 2017). For example, a growing body of literature on environmental health promotion has empirically shown that such delineations usually do not represent the true mobility and environmental exposure of the inhabitants. In a study conducted in the Helsinki area in Finland, Laatikainen, Hasanzadeh, and Kyttä (2018) have demonstrated that the administrative boundaries matched only 35 percent of the actual use of space by residents as captured by GPS devices. Other studies have shown that the actual use of space may not always be centered immediately around an individual’s home (Hasanzadeh 2019). Multicentral travel behavior and multilocal living are increasingly relevant in modern life (Hasanzadeh et al. 2021; Kajosaari et al. 2021). Similar observations have also been reported in other contexts (Lee et al. 2008; Perchoux et al. 2013). Consequently, the variability of personal activity spaces is increasingly acknowledged and considered in person-environmental research. This has manifested as various attempts in conceptualizing, modeling, and using various individualized delineations (Hasanzadeh 2021; Smith, Foley, and Panter 2019).
The more analytical body of literature has often attributed the mismatch between neighborhood definitions and people’s actual use of spaces to methodological limitations regarding the modeling of these spaces (Hasanzadeh, Broberg, and Kyttä 2017). At the same time, this mismatch can be attributed to an increasingly mobile population in urban environments and the fact that our existing neighborhood boundaries are not optimized to capture these spatial practices. Modern cities have evolved to accommodate new lifestyles which among many other factors, are significantly driven by an increased amount of mobility by individuals. Urban inhabitants have developed a growingly multilocal lifestyle which revolves not only around their place of residence as the core of their activity space, but also their other important everyday places such as work, study, and recreational places (Hasanzadeh et al. 2021). This has rendered the definition of neighborhoods even more elusive and has resulted in an ever-increasing fuzziness in their boundaries. Hasanzadeh, Laatikainen, and Kyttä (2018) argue that the spaces containing people’s everyday activities (“activity spaces”) are dynamic and variable in both extent and fabric. Empirical research implementing person-based approaches has provided evidence supporting this argument (Hasanzadeh, Broberg, and Kyttä 2017; Lee et al. 2008; Perchoux et al. 2013).
At the same time, the concept of soft spaces addresses such fluid areas within and between traditional hard spaces, characterized both by their new spatial delineation, potentially outlined by “fuzzy boundaries,” and their ways of policy implementation. Soft spaces describe the emergence of new spaces of policy and decision making which exist between and alongside these administrative territories. Allmendinger and Haughton (2009) characterize soft spaces as differing from “hard spaces,” which are the formal and institutionalized planning processes which are depicted as slow and complex, due to all the substantial and procedural requirements associated with the planning task (Allmendinger and Haughton 2007, 2009). Studies have claimed that soft spaces have been used in a performative manner (Mattila and Heinilä 2022), for visioning (Mikuła 2023), strategy development (Allmendinger and Haughton 2009), branding (Zimmerbauer and Terlouw 2024), and as governance mechanisms (Purkarthofer and Granqvist 2021) and have identified political and governance considerations as main reasons for their emergence. However, soft spaces have rarely been based on spatially referenced data on residents’ mobility patterns. 1 Such an interpretation of soft spaces could bring together analytical and conceptual perspectives on soft spatial delineations of neighborhood boundaries.
Individual differences in the delineation of activity spaces are likely to be reflected in larger spatial units, such as neighborhoods, which collectively represent the urban spaces inhabited by a group of residents. Integrating these individual models into larger-scale boundaries at the neighborhood level offers a means to delineate the FNAs and incorporate the inherent fluidity of spaces into otherwise rigid models. However, empirical research has rarely attempted to redefine such boundaries using individual-level mobility data. While a few studies have attempted to provide new delineations using aggregation of cognitive maps (Lohmann and McMurran 2009; Talen and Shah 2007) or by applying machine learning algorithms on building data (Arribas-Bel, Garcia-López, and Viladecans-Marsal 2021) or volunteer geographic data (Aadland, Farah, and Magee 2016), to the best of authors’ knowledge remapping neighborhood boundaries has not been attempted before using a combination of digital participatory mapping and activity space modeling.
Materials and Methods
Study Area
Our analysis covers the municipality of Espoo in Southern Finland. With 297,000 inhabitants, Espoo is the second-largest municipality in Finland and part of the country’s largest urban area, the Helsinki metropolitan area (Official Statistics of Finland 2020). 2
Espoo is a multicenter city with five distinct center areas (Tapiola, Leppävaara, Matinkylä-Olari, Espoon keskus, and Espoonlahti) and good private and public transport connections to the surrounding municipalities, including the regional center of Helsinki to the East. Various administrative territories are employed in the municipal organization in diverse uses, including land-use planning, social and health care services, as well as municipal statistics (City of Espoo 2022a). In this study, we use Espoo’s forty-six postal code areas as administrative units. These units are widely used in research as well as in practice and for various administrative purposes. Additionally, many of the datasets from the city of Espoo, including those used in this study, are calculated, and published using postal code areas as a unit of analysis.
Data Collection
Data were collected through an online mapping survey using softGIS methodology. SoftGIS is a public participation geographic information system (GIS) (PPGIS) method that combines Internet maps with traditional questionnaires (Brown and Kyttä 2014). The results are geocoded as qualitative and quantitative data that can be analyzed with GIS and statistical programs (Hasanzadeh et al. 2023).
The PPGIS dataset was collected in fall 2020. 3 A random sample of 15,000 Espoo residents aged 18 to 80 years was ordered from the Finnish Population Register Center. These sample members received a letter of invitation to participate in the online survey, followed by a reminder postcard. The online survey was also promoted openly by the City of Espoo and could be accessed at the municipal website. The representativeness of data collected with the open survey was compared with data from the randomized sample. The two datasets did not considerably differ from each other and were merged for the purpose of this study.
The PPGIS survey included several mapping activities concerning the respondents’ current behaviors in and perceptions of the city of Espoo, as well as activities where they were requested to map future development ideas. The mapping activities used in this study include mapping of the main place of residence, place of work or school, and other places that the respondent frequently visits in day-to-day life. The survey also included personal-level questions concerning the respondents’ demographic background and socioeconomic status and perceived well-being. Altogether 4,198 respondents participated in the survey and mapped a total of 53,810 visited places. For this study, the sample was narrowed to the 3,132 respondents who had mapped a home location within Espoo. The geographic representativeness of the sample in the study area was deemed satisfactory as the survey reached 1.2 to 3.4 percent of the adult population in all the postal code areas.
GIS Modeling and Calculations
Modeling FNAs
This study set out to define an FNA for each neighborhood in Espoo with the aim to conceive of alternative boundaries that—unlike administrative boundaries—are based on the actual use of space by the inhabitants. To operationalize this, we used an exposure-based definition of activity spaces based on the individualized residential exposure model (IREM) (Hasanzadeh, Laatikainen, and Kyttä 2018). IREM is an activity space model which produces individualized raster (a grid-based representation of spatial data) files as output. Each raster provides a refined picture of the actual use of space by the individual where the value of each pixel corresponds with the extent of exposure at the location. The exposure values in this model are based on the estimated amount of direct contact with the place. This is operationalized based on the data on everyday locations and travel patterns reported by individuals. In other words, the exposure values are weighted by the frequencies of visits to each location and travel modes. That is, a more frequent trip using walking or biking would result in a higher place exposure than a low-frequency trip made with motorized travel modes. The method is fully described in previous studies (Hasanzadeh, Laatikainen, and Kyttä 2018). An example of the model is illustrated in Figure 1.
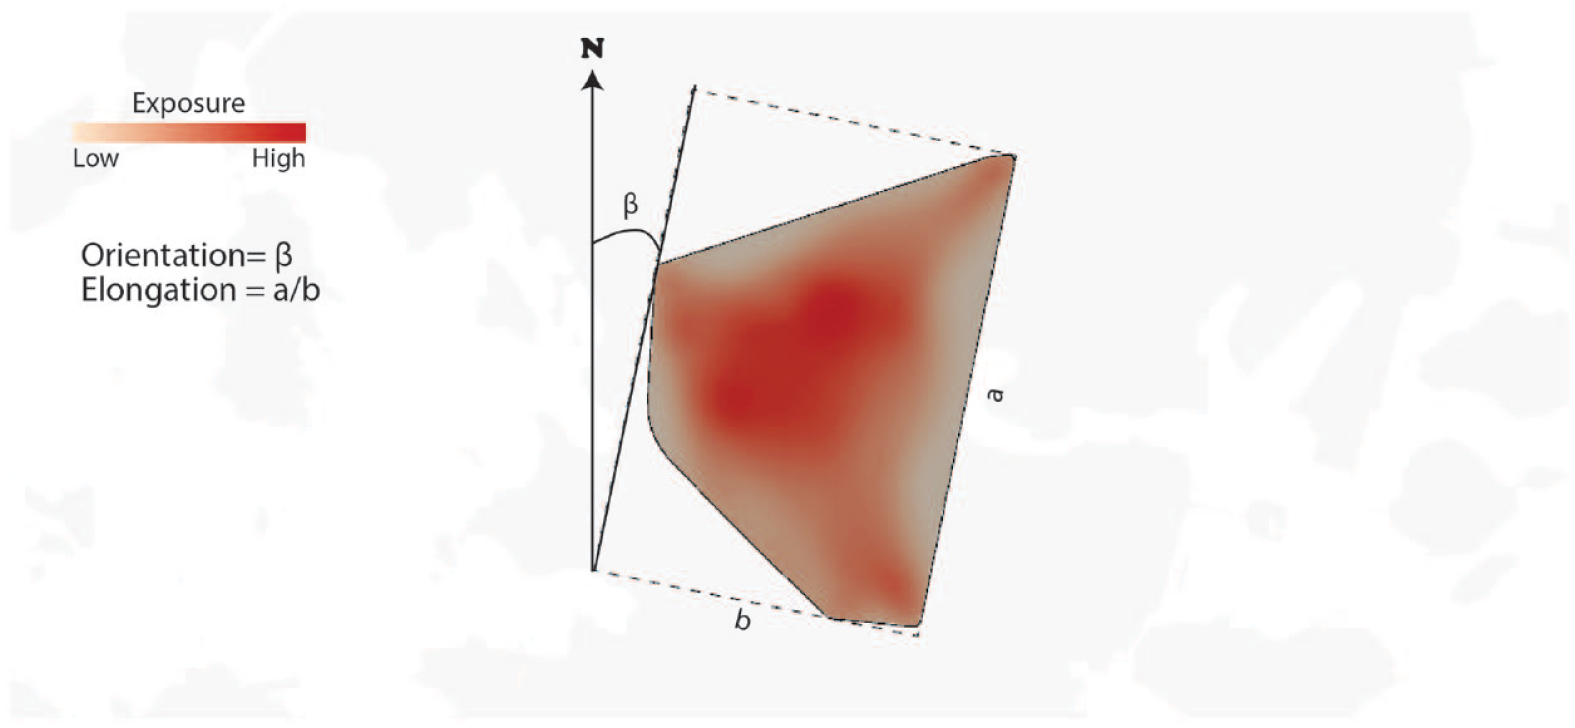
Example of an activity space model and geometric measurements.
In this study, we take a novel analytical step by creating an aggregated exposure model for each neighborhood area. This was done by overlaying the exposure raster files of all residents of a neighborhood and summing up the exposure values pixel by pixel through a raster calculation process. Upon the creation of aggregate raster models, areas of high exposure were identified and delineated as polygons through an iterative reading of pixel values (Laatikainen, Hasanzadeh, and Kyttä 2018). This was operationalized by putting the individualized pixel values in an order from the highest to the lowest values and then extracting the desired percentile (Laatikainen, Hasanzadeh, and Kyttä 2018). In this study we extracted the areas of high exposure at 3 levels of 80th, 90th, and 95th percentiles, corresponding to the top 20, 10, and 5 percent highest exposure values, respectively. These different levels of sensitivity result in three FNAs, each differing from the administrative neighborhood boundaries (see Figure 2). The most compact level, comprising the top 5 percent exposure areas, is used as FNA throughout this study.
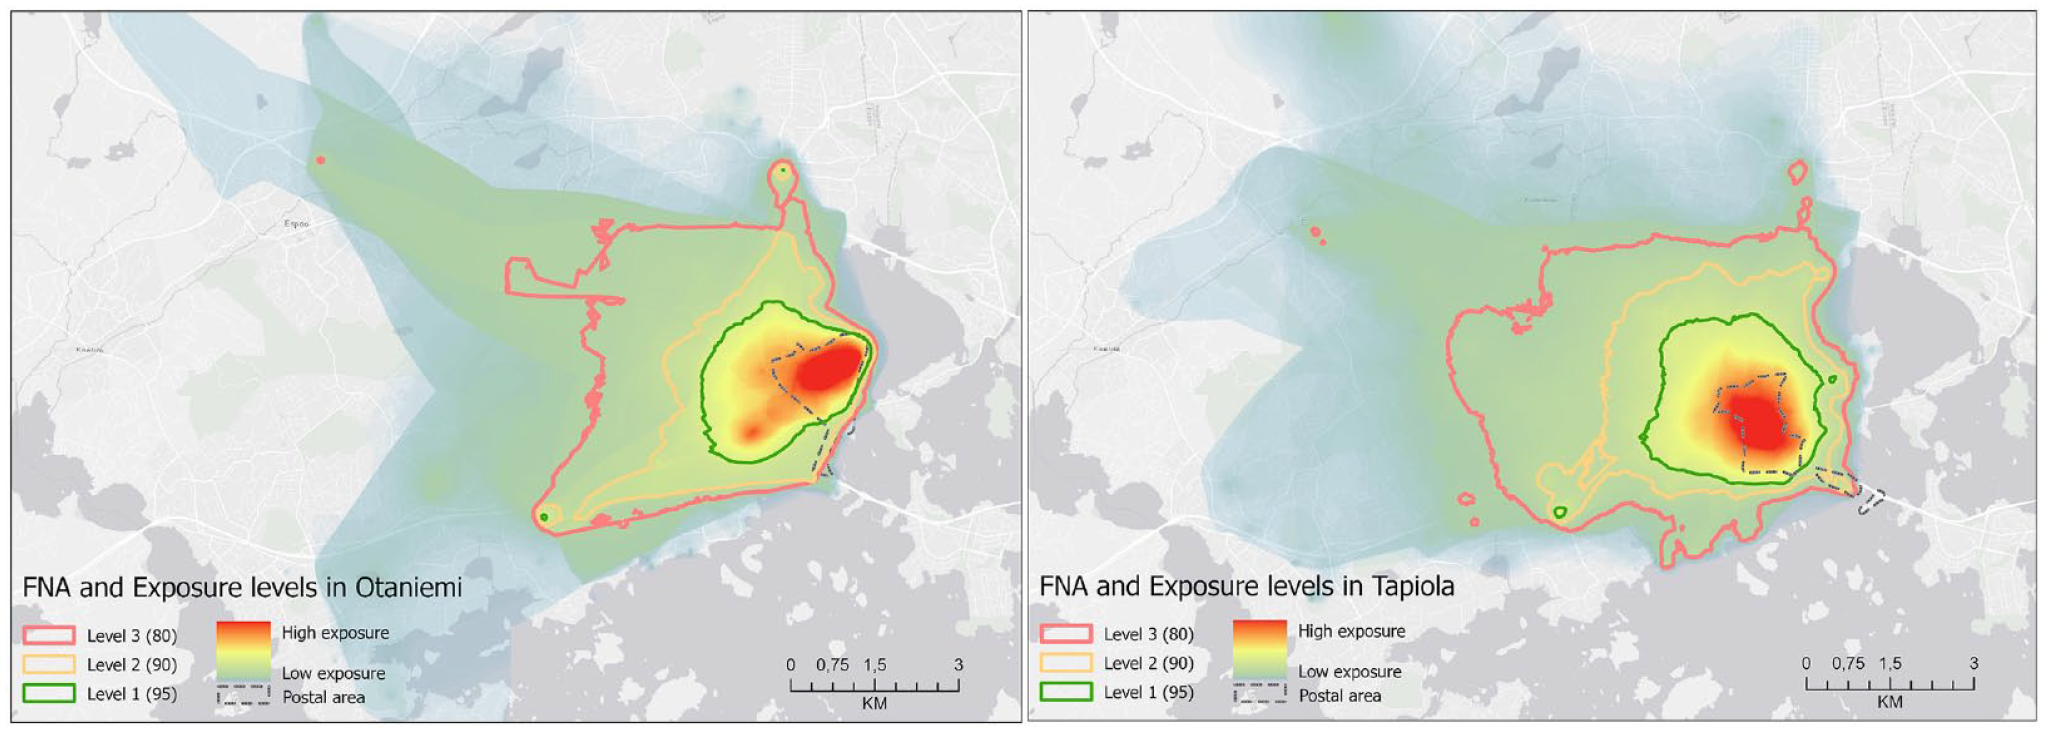
Aggregate exposure model and FNAs for two adjacent neighborhoods in Espoo (left: Tapiola, right: Otaniemi).
All exposure models were created using the Python scripts available from the original creators (Hasanzadeh 2018). A new Python script using ArcPy and other open-source geospatial libraries was developed and used for creating the aggregate models.
Activity space measurements and other GIS and statistical analyses
To measure and compare the characteristics of individual activity spaces, the three geometric measures of area, orientation, and elongation introduced in previous studies were used (Hasanzadeh, Laatikainen, and Kyttä 2018). An example of an activity space model and how these measures are calculated is shown in Figure 1. Area of activity space is calculated as planar area measured in square kilometers. Area of activity space has been often used to capture the geographical extent of an individual’s mobility. A compact activity space is associated with localized active travel, whereas an overly large activity space often indicates the use of motorized travel modes (Hasanzadeh 2019).
Orientation of activity space is measured as the deviation of each activity space from the north. Orientation is measured by placing a minimum fitting rectangle on the activity space and measuring the angle between the longest edge and the north in degrees. Orientation captures the overall direction of an individual’s mobility and indicates whether a certain direction dominates the travel pattern (Sherman et al. 2005; Yuan and Xu 2022).
Elongation is measured as the ratio of the longer edge of the minimum fitting rectangle to the shorter edge. Elongation has been used to capture the extent of travel. A highly elongated activity space has been associated with a bicentric travel pattern comprising less diverse travel destinations within a single direction (Hasanzadeh 2019).
Results
FNAs and Their Distribution
Altogether, 138 FNAs were created for the 46 neighborhoods of Espoo included in the analysis. The average areas for models at 80th, 90th, and 95th percentiles were 28.3, 13.95, and 6.9 km2, respectively. Figure 2 shows examples from two adjacent neighborhoods of Tapiola and Otaniemi in southeast Espoo.
As illustrated in Figure 2, the created models, even in their most compact form (95th percentile), considerably overlap with each other. This observation supports the argument that, when conceptualized as the areas most frequently used by residents, neighborhoods have fuzzy boundaries and should be considered as soft spaces rather than as hard spaces with fixed boundaries.
Figure 3 illustrates that there is considerable overlap between the FNAs. Five areas emerge as crucial hot spots (Tapiola, Matinkylä, Leppävaara, Espoon keskus, and Viherlaakso), meaning that these areas are frequented by residents from various neighborhoods. In part, the location of hotspots corresponds to the central areas identified in urban zone data (Syke 2021).
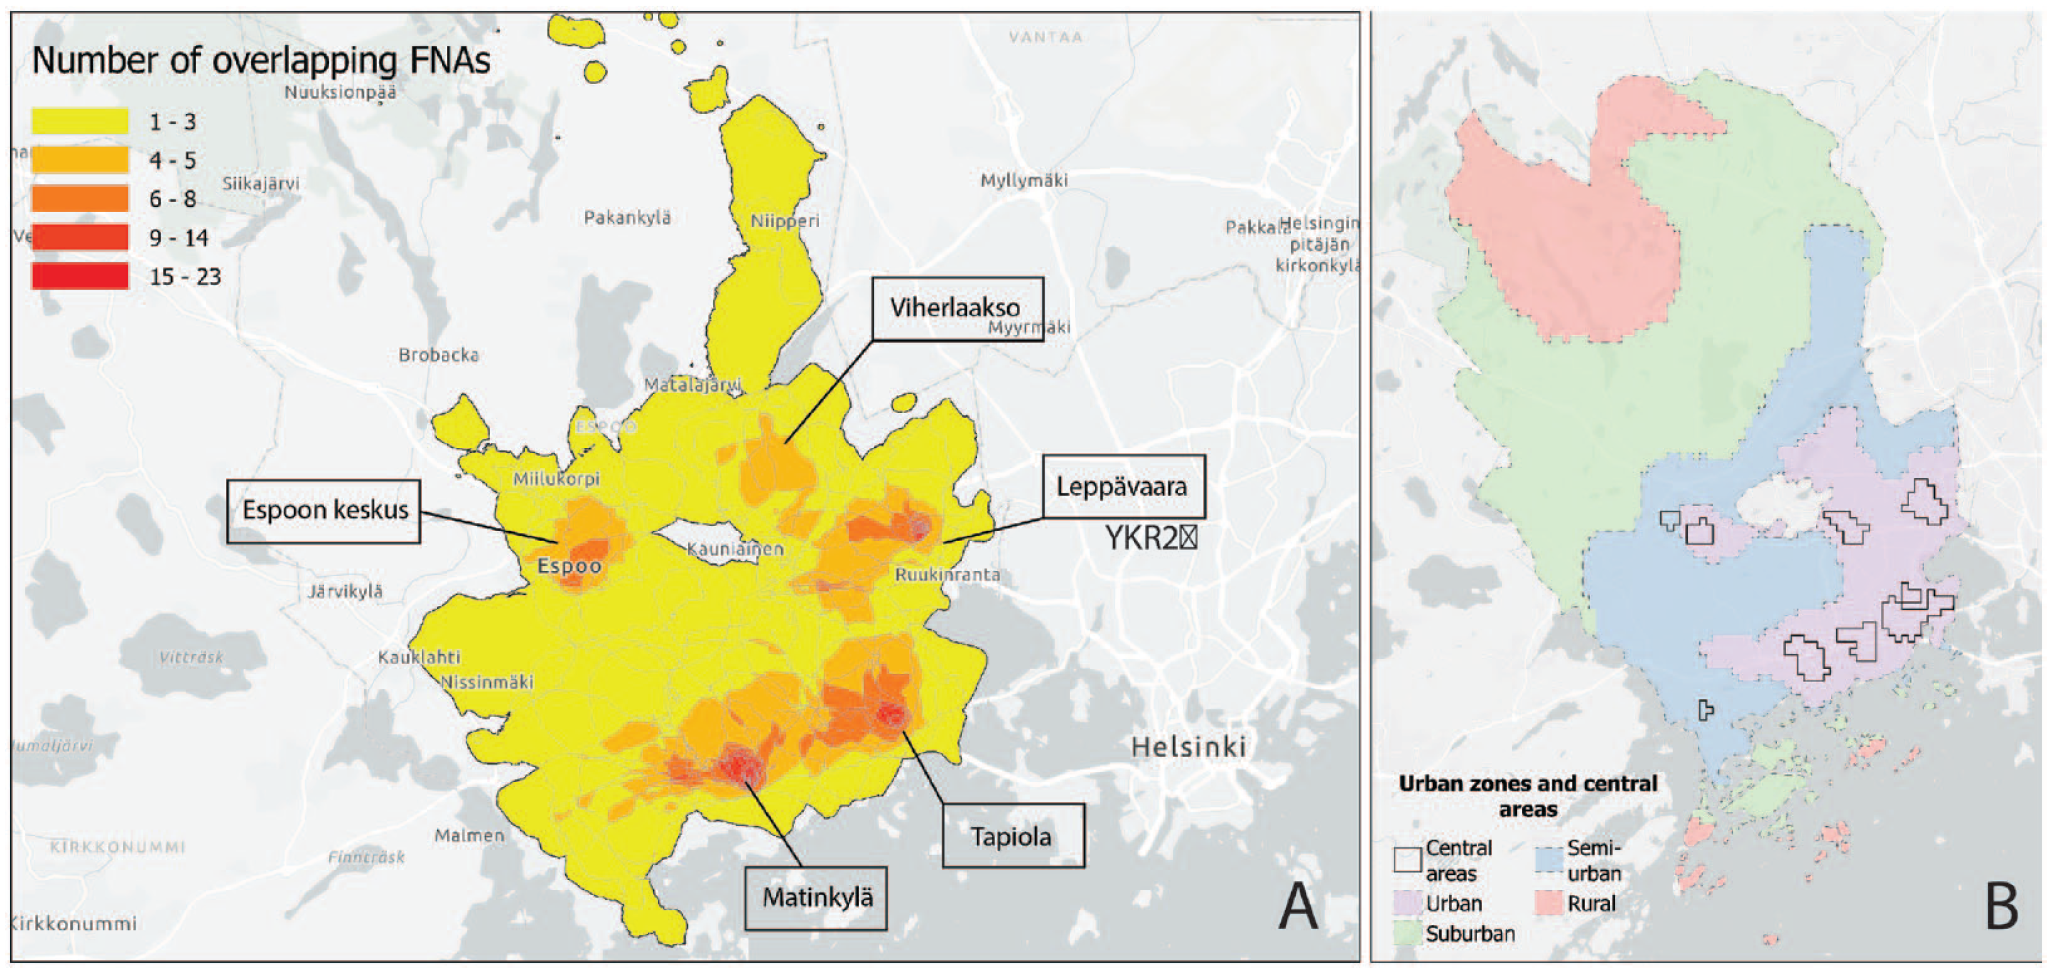
(A) An overlap map of FNAs. (B) Urban central areas according to urban zone data (Syke 2021).
Variations within and across FNAs
A comparison of FNA area with the administrative boundary area for each neighborhood is shown in Figure 4. The difference in areas varied significantly across the neighborhoods ranging from 5 to 86 percent with an average value and standard deviation of 45 and 18 percent, respectively. Differences between the sizes of administrative units and the FNAs are most outstanding in the larger neighborhoods of northern Espoo. However, when adjusted for the size of an administrative unit, differences become larger toward the southeastern areas of Espoo, meaning that residents in these areas tend to move more beyond their own neighborhood. While the northern areas are characterized by lower population density, large green areas, and higher percentage of households with children, the southern areas are more densely populated and provide better accessibility to other areas including the capital area’s center. The southeastern areas also have slightly better economic status manifested as lower unemployment rate and higher average income (see also Appendix).
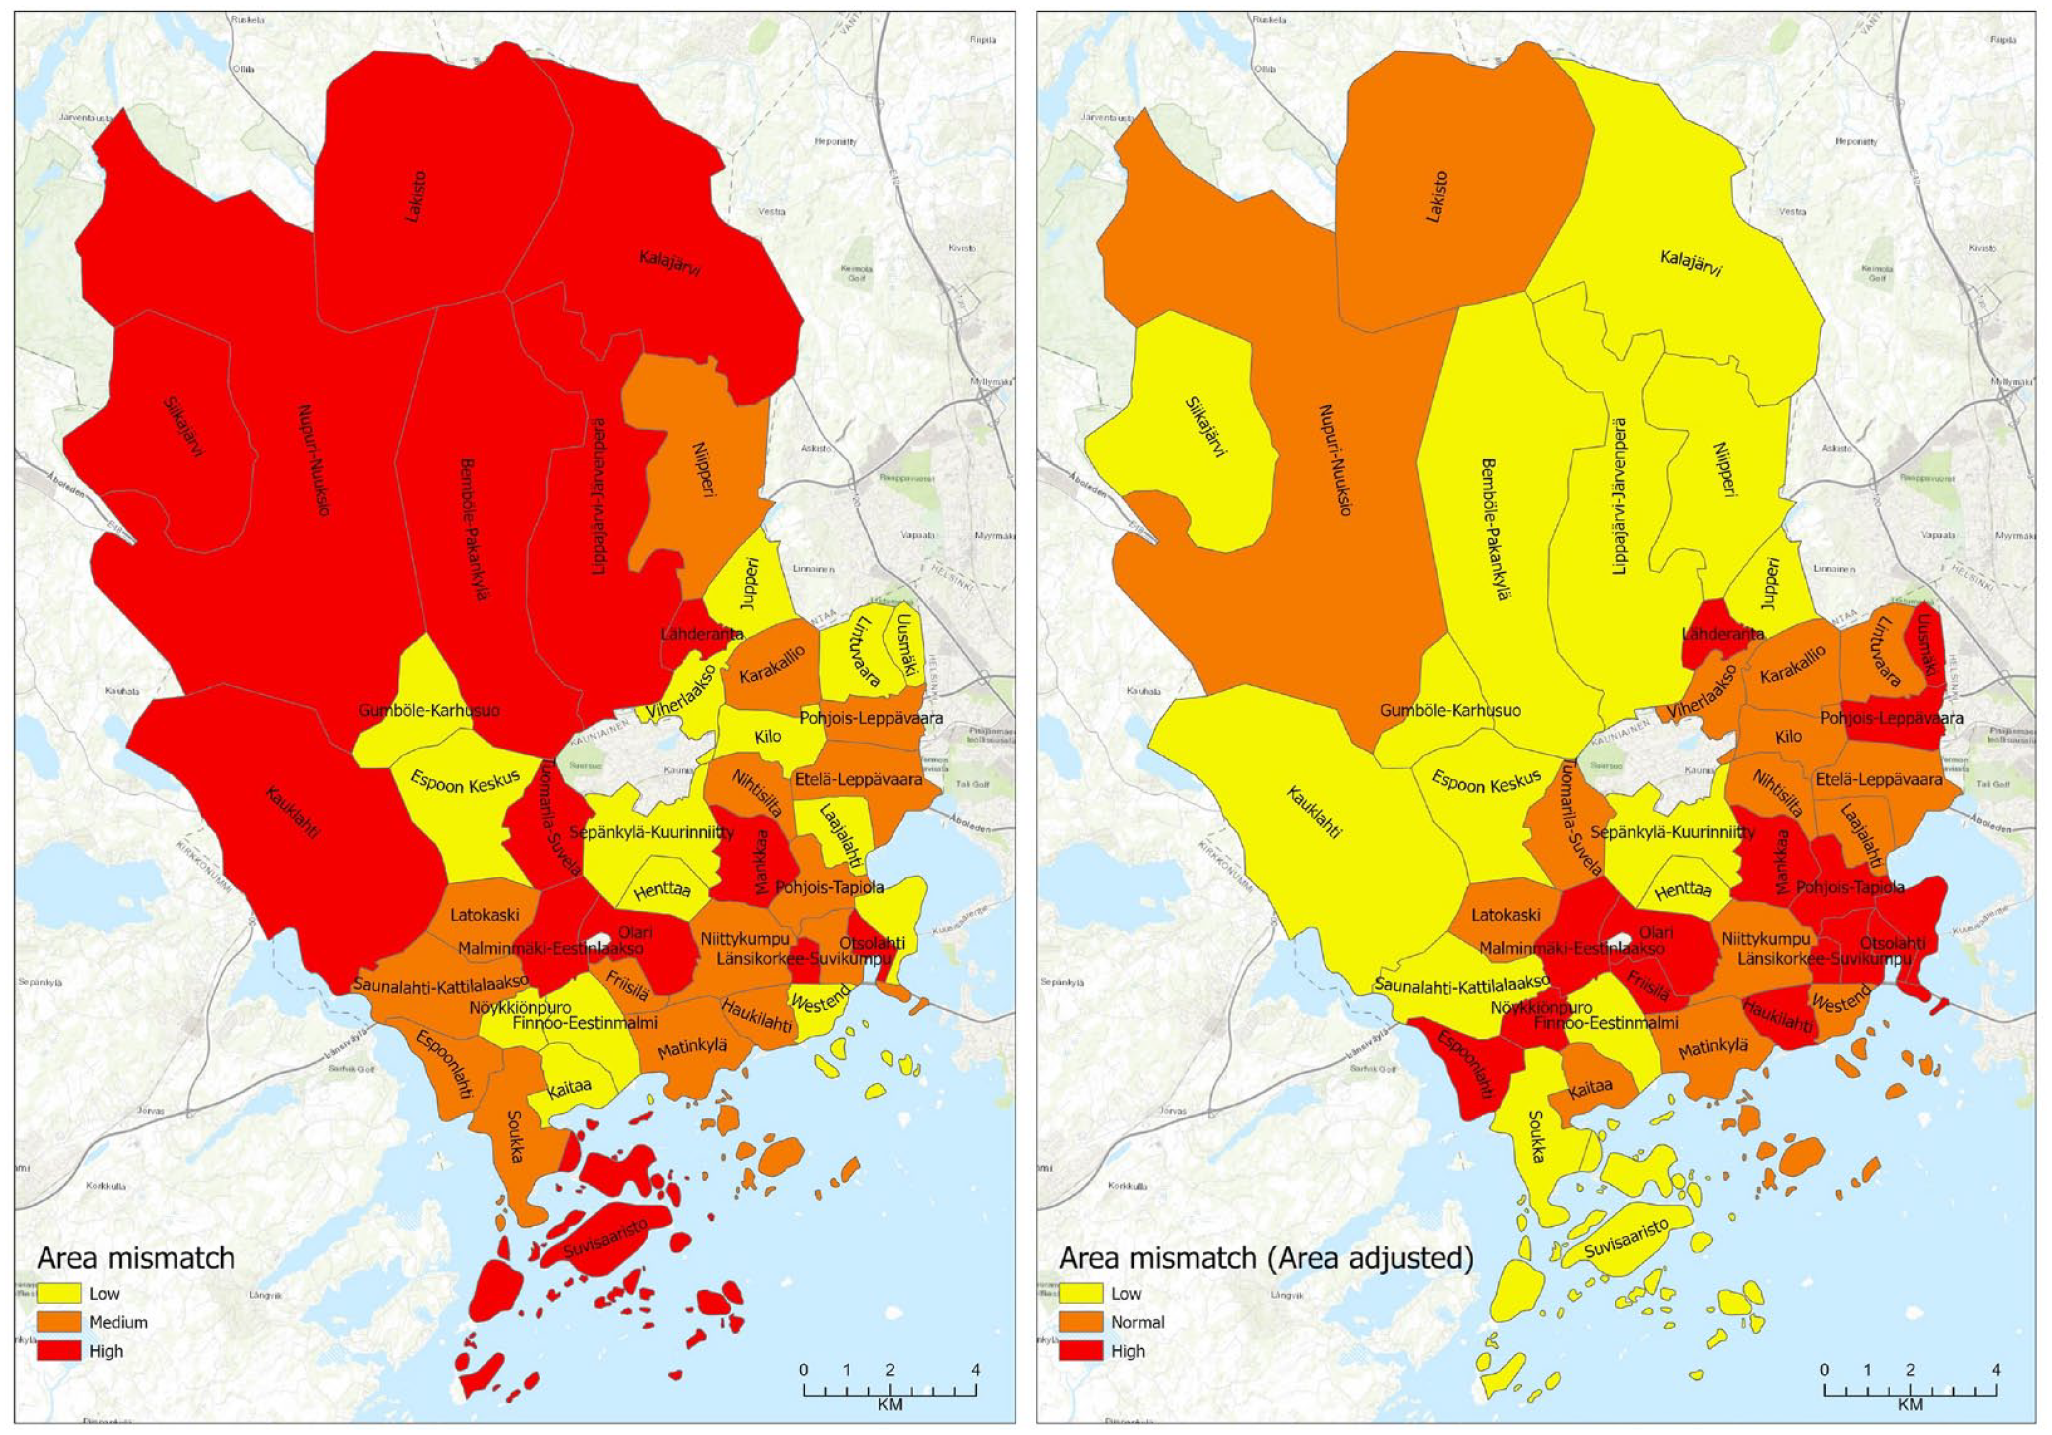
The difference between the area of FNA and administrative boundary.
We compared the activity space differences between individuals in each neighborhood in terms of area, elongation, and orientation. Figure 5 illustrates the standard deviation and mean values of these measurements across all neighborhoods.
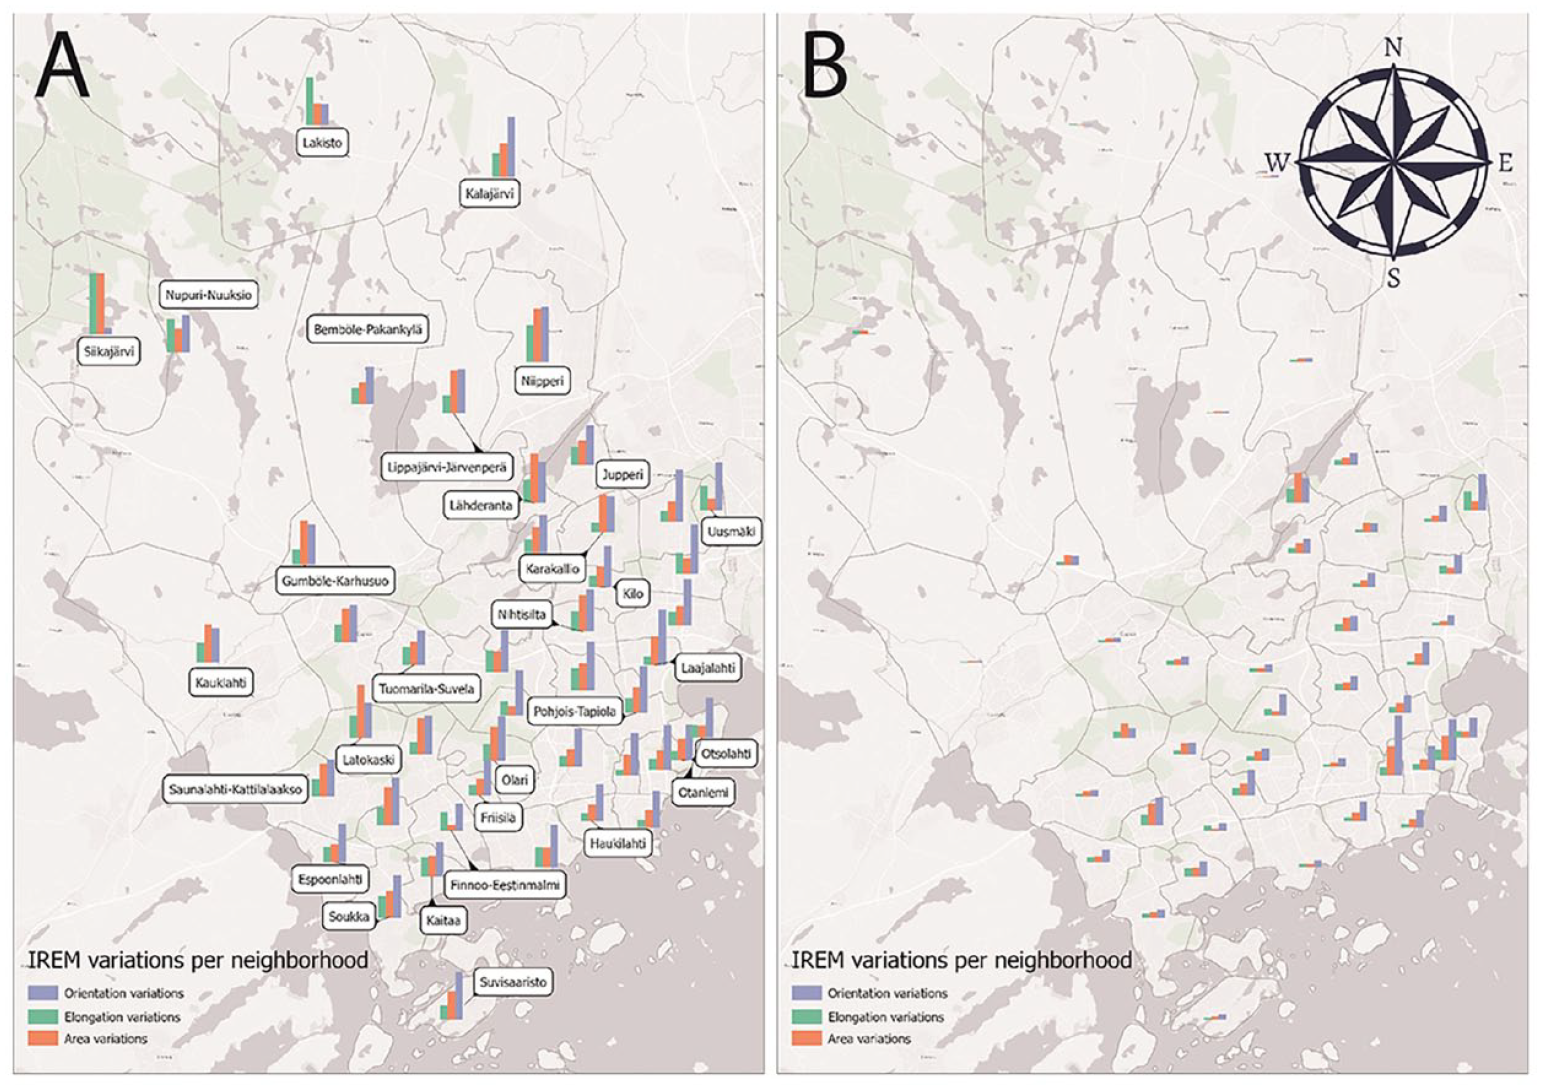
Individual variations (std) in the three activity space models (IREM) measurements: orientation, elongation, and area. (A) Measurement variations within neighborhood. (B) Measurement variations within neighborhood adjusted by neighborhood area.
As shown in Figure 5A, area and elongation variations were most significant in northern areas of Espoo whereas variations in orientation were most remarkable in eastern neighborhoods. When adjusting for the effects of neighborhood size (Figure 5B), the variations in northern areas diminished, while in eastern areas, they got more prominent.
Discussion
This article has demonstrated that a new conceptualization of neighborhood boundaries is possible—or even necessary when aiming to capture spatial relationships and mobility patterns. Based on the aggregation of individual activity spaces, we have created new FNAs. In the remainder of this section, we reflect on the applied modeling approach, the meaning of our analysis with a view to soft spaces, and the potential implications of the proposed approach for planning practice.
Mapping FNAs Using Person-Based Activity Space Models
Various methods have been used to model and map individual activity spaces. Despite the methodological differences, most studies have used activity space models in a similar way: to provide an individualized spatial unit of analysis for geospatial analysis and exploring person-environment relationships (Hasanzadeh 2021). While it is scientifically impossible to derive individual-level data from an aggregate model without falling into the ecological fallacy trap (Openshaw 1984), the opposite can potentially result in a strong model. In other words, individualized activity space models can be aggregated to produce a refined picture of how a group of people, for instance, those living in the same area, interact with their everyday environment.
The individualized activity space model used in this study, IREM, was adopted from an earlier study (Hasanzadeh, Laatikainen, and Kyttä 2018). This method uses the mobility data of an individual to provide a refined picture of their activity space based on place exposure. The individual models were aggregated on a neighborhood level to form FNAs. To the best of the authors’ knowledge, this is the first time that individual activity space models have been applied to redefine neighborhood boundaries based on the inhabitants’ use of spaces. While this is certainly not the only way this can be done, it is a simple yet effective way of using individual-level data to map FNAs. While we employed PPGIS data, the proposed analytical approach can also be implemented using other comparable individualized geospatial data.
Our findings in the city of Espoo indicate a considerable difference between the mapped FNAs and the corresponding administrative areas. The differences are most prominent in neighborhoods with greater individual variability in activity space characteristics, particularly area and orientation. This indicates that in such areas, the travel patterns of individuals differ significantly in terms of geographic extent and direction. Notably, these areas are primarily situated in the eastern and southeastern parts of Espoo, providing convenient proximity and accessibility to the capital area of Helsinki. This observation strengthens the argument that enhanced accessibility and a wider range of destinations can heighten the contrast between administrative boundaries and FNAs.
In addition to improved accessibility and proximity to the central areas of the capital region, several other factors appear to correlate with these disparities. These factors include higher population density, a lower percentage of households with children, and a more favorable economic status. This suggests that elements such as socioeconomic conditions, household demographics, and urban structure may contribute to the amplification of differences between the FNAs and administrative units in urban areas. Nevertheless, further empirical research is necessary to validate these findings and gain a more comprehensive understanding of the underlying mechanisms.
Viewing FNAs through the Lens of Soft Spaces
FNAs represent an example of new spatial delineations created through the aggregation of spatially referenced data. It is debatable, of course, to what extent spatial delineations modeled in this manner can be conceptualized as soft spaces. Table 1 compares the properties of soft spaces, as presented in the literature (Cavaco et al. 2022; Purkarthofer and Granqvist 2021), with the properties of FNAs, as presented in this article, in order to test whether the understanding of FNAs as soft spaces is justifiable.
Comparing the Properties of Soft Spaces and FNAs.
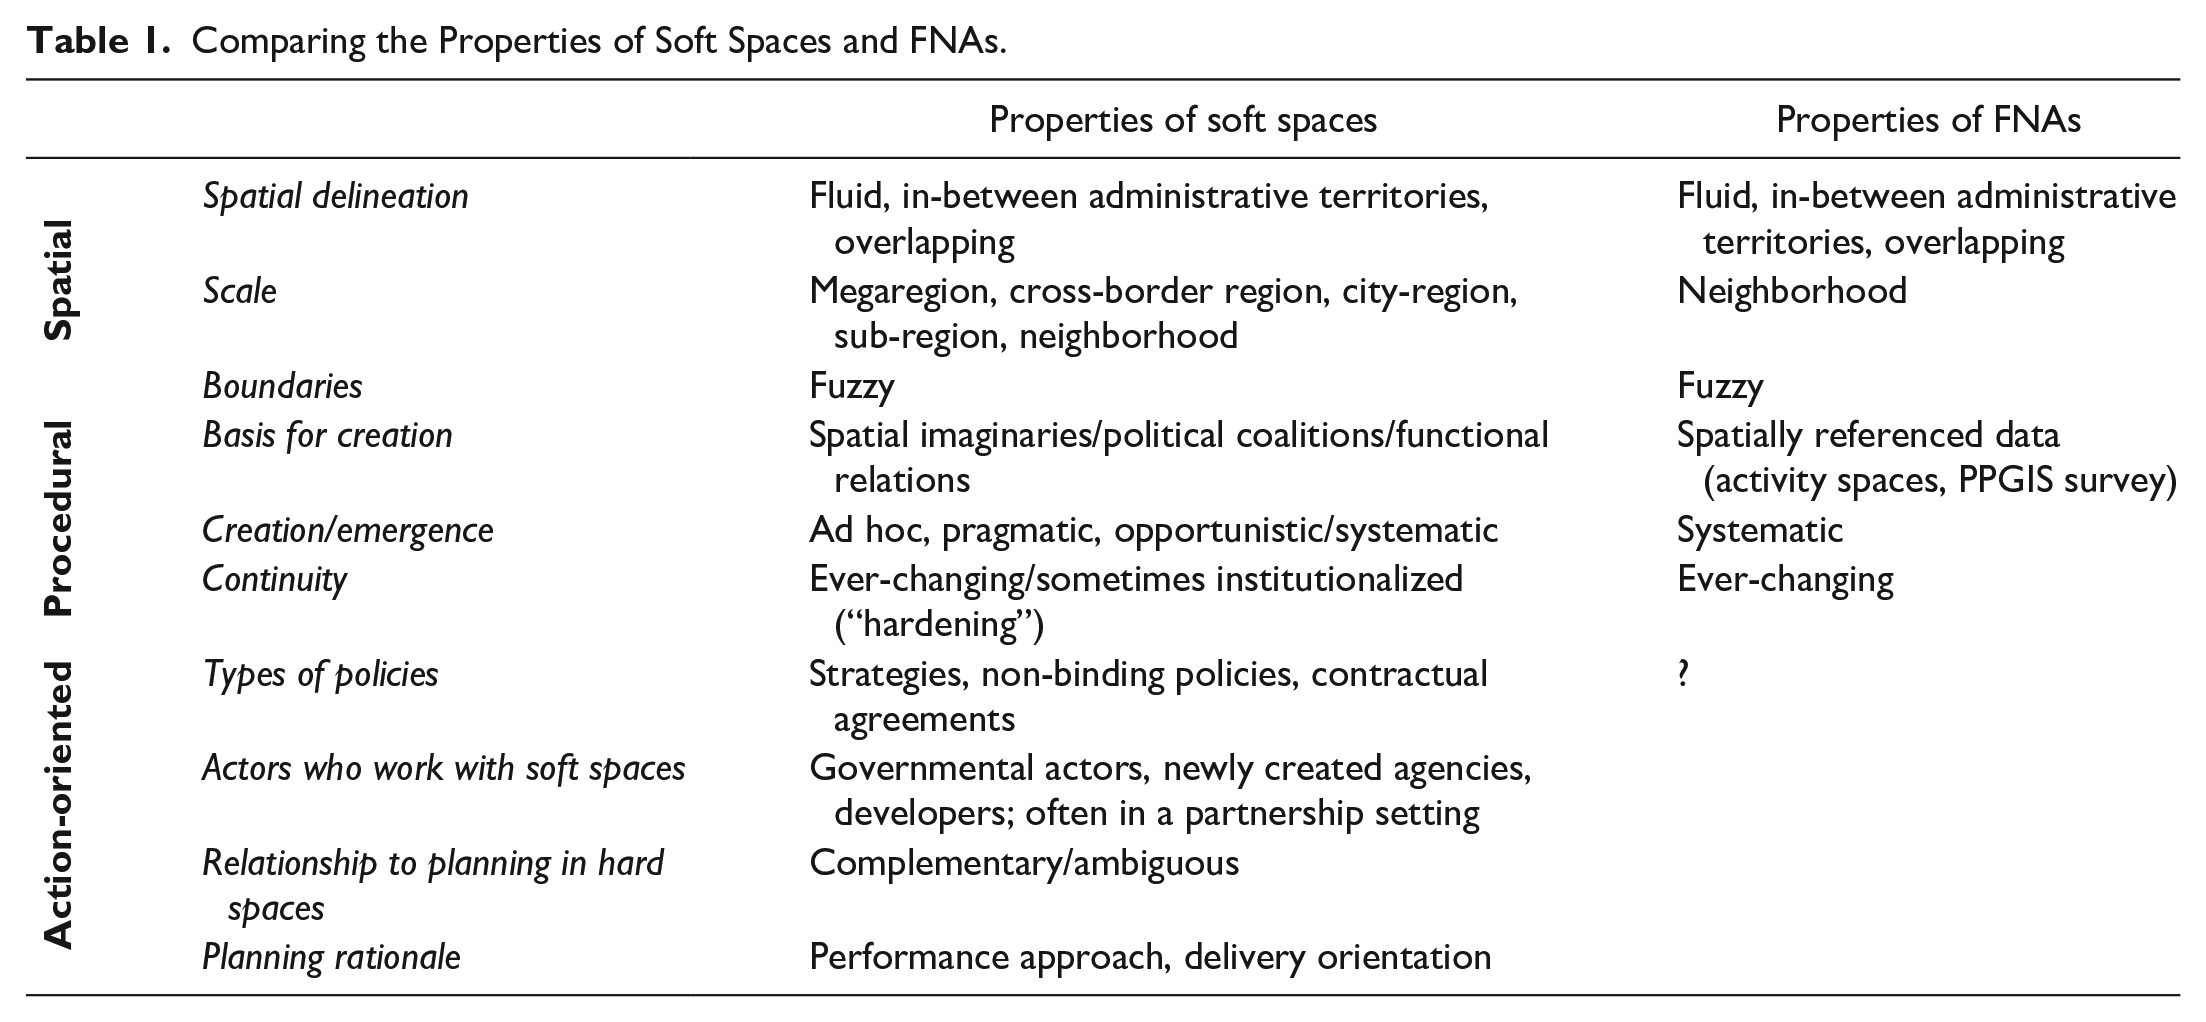
When comparing the spatial properties of FNAs with the understanding of soft spaces in the literature, FNAs seem to fit the brief in some respects: FNAs do not adhere to administrative boundaries but represent new delineations that overlap and are characterized by fuzzy boundaries. In addition to being fuzzy, their boundaries differ depending on the codified level of exposure, leading to our distinction between FNAs with different levels of sensitivity. FNAs, like soft spaces, can also be understood as flexible and changing over time. Their spatial delineation is based on a specific dataset, and if a similar data collection were conducted again, we can expect to see similar spatial patterns, yet no exact matches.
Looking at the procedural properties, referring to the emergence and continuity of soft spaces, FNAs partly overlap with the conceptualization of soft spaces. Soft spaces have been identified to emerge from political considerations, potentially supported by spatial imaginaries (Mäntysalo, Olesen, and Granqvist 2020; Olesen 2017), or functional relations, although it is not always clear which data or claims such functional relationships are based on. In the case of the EU macro-regional strategies, for instance, functional relationships are just assumed due to a shared topographical space (Purkarthofer, Sielker, and Stead 2022). FNAs, in turn, are based on spatially referenced data, collected in a PPGIS survey, and created in a comprehensive, systematic, and empirical approach.
With a view to continuity, both soft spaces and FNAs are characterized by their ever-changing nature: They are not intended to represent a final spatial frame, but rather to be adaptable and flexible according to needs and realities. However, soft spaces have been known to occasionally “harden” (Metzger and Schmitt 2012; Zimmerbauer and Paasi 2020), that is, become institutionalized through narratives, spatial practices, or the establishment of organizations. Soft spaces often emerge in an ad-hoc manner, as pragmatic and opportunistic spaces of delivery (Cavaco et al. 2022), although in some contexts, their creation is more systematic, for instance, in EU cross-border regions (Purkarthofer and Schmitt 2021) or Italian metropolitan regions (Servillo and Lingua 2012). FNAs in turn represent a systematic and data-based attempt at creating soft spaces that cover the municipal territory in its entirety.
The biggest incongruences exist related to the action-oriented properties of soft spaces. Soft spaces as characterized in the literature often lead to the creation of strategies or non-binding policies, and occasionally to contractual agreements. Their planning rationale corresponds with the performance approach (Faludi 2000): Rather than through conformance with a specific plan, these planning policies can be influential through their performative power, that is, by being the subject of debates, by influencing other planning decisions and by being interpreted by various actors. The policies relating to soft spaces are mostly enacted by governmental actors—either in a top-down or bottom-up fashion—and often in partnership with developers or agencies (Allmendinger and Haughton 2010). Due to their largely informal character, soft spaces, while being claimed to be complementary to hard spaces, have in practice often an ambiguous relationship to planning in hard spaces (Purkarthofer and Granqvist 2021). It thus remains unclear who has to abide such planning policies and how they affect plans and policies at other spatial scales (Purkarthofer 2016). Since FNAs at this stage are only mapped spaces created through geospatial modeling, no statements can be made about their action-oriented properties and their (potential) importance for policy making remains unknown.
In summary, it can be stated that FNAs—and other spatial delineations modeled in the same manner—share many properties with soft spaces and can thus be understood as a potential example of soft spaces at the neighborhood scale. The emphasis on potential reflects the fact that action orientation is a core element inherent in the concept of soft spaces on which FNAs do not yet deliver. However, as outlined in the following section, FNAs could hold some implications for planning practice.
Potential Implications for Planning Practice
FNAs, as presented in this article, clearly represent analytical spaces rather than planning scales. Nonetheless, this section concludes by deliberating on the potential implications of FNAs for planning practice concerning three aspects of planning: knowledge, actor involvement, and planning policies. It has to be emphasized that these considerations are speculative at this stage and do not refer specifically to the city of Espoo which served as a case city for data collection and modeling.
First, the knowledge dimension is the most obvious use of FNAs: Spatially referenced data already now serve as important knowledge for planning decisions and policies. However, conceptualizations of complex spatial relations such as physical activity behavior are often simplistic and thus limited in their accuracy and application (Rinne et al. 2022). Using modeled spatial delineations based on the self-reported mobility patterns of residents can provide planners with new insights into residents’ behavior that go beyond individual data points.
In the case of Espoo, for example, the overlap of activity spaces (shown in Figure 3) highlights the most important nodes for Espoo residents. Interestingly, these do not exactly correspond to the five centers that the city of Espoo usually refers to: While the Espoonlahti area does not appear in as many FNAs as other centers, the Viherlaakso area appears to be a crucial node, despite not being recognized as a center by the city. Planning issues such as providing infrastructure for sustainable travel and services could be guided by these findings in order to respond to citizens’ needs while transcending administrative divisions.
The characteristics of FNAs (area, orientation, and elongation) can give insights into service provision. For instance, a large FNA area might hint toward a lack of services in a certain area, while a specific orientation or elongation can help to identify which services outside their own neighborhood residents frequently use. FNAs could help to establish a more dynamic take on service provision, which offers new perspectives. Such models could be especially beneficial in the context of urban infill and regeneration when assessing the importance of neighborhood services vis-à-vis services in city centers.
With the rapid increase of individual-level (mobility) data and user-generated data (Shelton, Poorthuis, and Zook 2015), new opportunities arise to better incorporate knowledge of urban dwellers’ spatial behavior into planning practice. At the simplest, such approaches can provide planners and decision makers with a better understanding of the spatial realities of the urban area. At best, data may be directly integrated into planning support systems to undergird planning decisions in a more systematic manner (Geertman and Stillwell 2003). Planning education has a crucial role in challenging which data and analyses are used to inform and motivate planning and can contribute to enhancing the systematic use of citizen knowledge into planning practice alongside institutional data and expert knowledge (Geertman and Stillwell 2003).
Second, from the viewpoint of actor involvement, our conceptualization of FNAs highlights the fact that residents might not only have an interest in the development of their immediate living environment but also in the wider activity spaces they frequent. While in the Finnish context, participation processes are typically open to all interested parties, the FNAs presented in this article could serve as the basis for specifically targeting invitations about participation events to people who use these parts of the city, even if they are not neighborhood dwellers.
The idea of bringing together various actors who would otherwise not have a forum for cooperation is a core element of soft spaces. Such a collaborative view could also be extended to the administrative actors working with planning. Administrative boundaries are sometimes mirrored in administrative siloes within which planning actors work. New types of collaboration which focus on issues rather than on formal processes can help to overcome such divisions. Such ideas of issue-based region building and participation have been voiced, for example, in the context of (city-) regional planning (Häkli, Kallio, and Ruokolainen 2020).
Third, since action orientation is a crucial characteristic of soft spaces, the aspect of planning policies is a deciding factor in whether FNAs qualify as soft spaces. We have shown that soft spaces can be created based on spatially referenced data and that in principle these spaces could be used as new frames for plans as well. In our example FNAs, the use in the context of transport planning suggests itself, as the spaces are based on mobility patterns. Planning could pay special attention to ensuring the availability of active and public transport infrastructure within the newly drawn FNAs, or in the corridors where they overlap, in order to facilitate sustainable transport choices for residents. As the goal of reducing the need to travel is sometimes overlooked in the context of sustainable mobility, large FNAs could also highlight the potential for targeted interventions aimed at reducing travel emissions. Generally, repeated modeling of FNAs, including their characteristics, could also be used to monitor planning interventions, in order to observe whether residents’ activity and mobility were impacted by certain policies.
While the identified FNAs might not be immediately relevant for spatial planning, the idea of spatially referenced data could be taken to various scales, depending on the data underlying these soft spaces. Equivalent to the presented FNAs, functional regional areas could for example refer to the aggregated activity spaces of all residents in a municipality or several municipalities. Such spatial delineations could reveal interesting regional linkages and relationships and could frame strategic planning policies at newly established regional scales.
However, since local planning is highly influential on spatial development in Finland (Mattila 2018), considering functional relationships at the neighborhood scale might be especially crucial. While functional relations are often acknowledged at the city-regional scale, such an integrative perspective acknowledging the “bigger picture” is often lost in detailed planning. Conceptualizations of soft spaces at the neighborhood scale, such as the FNAs introduced in this article, could highlight functional relations at the neighborhood scale and stimulate discussion about policy integration across administrative boundaries.
With all these considerations of using soft spaces as new frames for planning policies, it has to be kept in mind that the goal is not to find the one perfect boundary but to tackle specific issues within an adequate spatial context while acknowledging spatial relationships in an accurate and constructive manner. This aligns well with the idea of continuous planning, which has gained popularity in the context of strategic spatial planning in Finland and other countries: Instead of viewing master plans as final products ready for implementation, the focus lies on the process of master planning with its various stages (Mäntysalo et al. 2019). In this approach, master plans are renewed every four years, to be aligned with the term in office of political decision makers and to be able to refine decisions as the future unfolds. In such an understanding of planning, spatial frames could correspondingly be adjusted and incrementally changed with each iteration of the process, to capture the issues at hand.
Conclusion
Theoretical contributions in the planning literature have made the claim that functional relationships crossing administrative boundaries need to be considered in planning. The spatial analytical approach presented in this article has highlighted that there are tools to suggest new spatial delineations based on spatially referenced data. While the notion of aggregated activity spaces is a useful base for understanding travel behaviors and important places for residents, different data could be used to create other kinds of neighborhood definitions. With new ways of collecting data and an abundance of user-generated geographic information, the biggest challenge lies in identifying meaningful ways of analysis that can contribute to improvements in policy making.
In this article, we have addressed three research gaps around the concept of soft spaces: (1) applying soft spaces to the neighborhood scale; (2) creating soft spaces based on spatially referenced data; and (3) applying the soft spaces approach systematically in an administrative territory and identifying multiple, overlapping spatial delineations. We do not want to claim that we have fully addressed these gaps in this article, but we understand our approach as a way of opening up the debate about these issues. Future research could explore these aspects further and propose new data upon which soft spaces can be based, or empirically investigate how such functional definitions can be used in planning practice.
By marrying the theoretical concept of soft spaces with GIS modeling, we have aimed to integrate different kinds of knowledge from the broad field of the spatial sciences. While students in planning programs are frequently expected to master spatial analysis as well as planning theory, researchers often specialize in one without having much expertise in the other. This article has attempted to bridge the gap between theory-oriented and GIS-oriented research by jointly addressing the challenge of identifying and working with functional regions. A division—between spatial analysis and policy making—also prevails in public administration. Only if planning education offers more integrated conceptualizations of planning, there might be a long-term change in how different types of knowledge can inform and enhance each other.
Despite this persisting divide, in Finland as well as in many other countries, planning departments have started to see the value of PPGIS and other innovative GIS-based data-gathering methods (Kahila-Tani, Kyttä, and Geertman 2019). While data collected through such methods in some cases feed into the knowledge base guiding planning decision (e.g., planning support systems), we are unaware of similar modeling approaches that create new spatial delineations which could serve as spatial frames for policy making. The FNAs introduced in this article represent an experimental example of what such “data-based soft spaces” could look like.
FNAs meet the criteria of soft spaces when it comes to their spatial properties, and—to a degree—their procedural properties. While we have highlighted how soft spaces hold the potential to serve as analytical frames, it remains unclear how to move from analysis to action. In other words, the question remains whether such systematically created soft spaces can turn into meaningful spatial frames for policy making and planning.
Footnotes
Appendix
Declaration of Conflicting Interests
The author(s) declared no potential conflicts of interest with respect to the research, authorship, and/or publication of this article.
Funding
The author(s) disclosed receipt of the following financial support for the research, authorship, and/or publication of this article: The work by EP was funded by the Academy of Finland with project number 338335. A.K. and M.K. received funding from Nordforsk (NORDGREEN-Smart Planning for Healthy and Green Nordic Cities, project number 95322). The work of M.K. contributes to the FinEst Twins project funded by EU H2020 grant 856602.