
Abstract
This commentary argues that current practice modalities are inadequate to meet the planning challenges of the day and that planners should seek out more entrepreneurial approaches. I offer three additional observations to support this argument: (1) the choice of local planning practice modality is too often determined by convention and familiarity; (2) local planners have become too reliant on regulation as their primary implementation tool; and (3) the recent performance record of counties in states with strong planning and regulatory regimes is underwhelming when compared with their counterparts in states with weaker planning regimes.
The American Heritage Dictionary defines modality as “a tendency to conform to a general pattern or belong to a particular group or category.” A practice modality is a common set of purposive practices. By my count, U.S. planners currently use six practice modalities when undertaking areawide plans, 1 each with advantages and disadvantages: comprehensive planning, strategic planning, equity and advocacy planning, consensus-building and collaborative planning, participatory master planning, and illustrative scenario-building.
Practice modalities differ from theories and paradigms in several ways (Allmendinger 2017; Brooks 2002; Fainstein and DeFilippis 2015). Theories posit testable relationships between causes, effects, and context and may or may not imply particular actions. Paradigms are collections of theories and assumptions that provide a logically consistent framework for undertaking action. Practice modalities are procedures for connecting present-day actions and activities to future outcomes. Practice modalities are informed by theories and paradigms, but they are also influenced by tradition, institutional and individual preferences, and suitability to the task at hand.
This commentary observes that current community planning modalities are inadequate to meet the many challenges now facing American cities and towns—challenges that include lagging infrastructure investment and performance; persistent racialized wealth, health, and housing outcome disparities; gross inequities in public school spending and quality, especially between cities and suburbs; a worsening shortage of affordable housing; discordant neighborhood change (i.e., gentrification); and uneven responses to the threats posed by climate change—and that planners should actively seek out new practice modalities better suited to meeting these challenges. I offer four specific observations:
The choice of which local planning practice modality to employ is too often determined by convention and familiarity rather than by carefully evaluating each modality’s strengths and weaknesses in relation to the planning challenges at hand.
Regardless of which practice modality is employed, recent trends have pushed local planners to become too reliant on regulation as their primary implementation tool, even when it is poorly suited to the job.
Compared with their counterparts in states with less extensive planning and regulatory requirements, the recent record of counties in states with strong planning and regulatory regimes is hit-and-miss when it comes to containing sprawl, building needed housing, keeping rising housing costs in check, reducing trip lengths and promoting transit use, reducing residential segregation, and narrowing black-white income, poverty, homeownership and health gaps.
In addition to current planning practice modalities, planners should apply more entrepreneurial approaches, in particular, a practice modality I call place-and-policy entrepreneurship.
The game plan for this essay is as follows. The next section briefly reviews the six areawide planning practice modalities presently in use throughout the United States. 2 The following section, “Comprehensive Planning and Its Discontents,” takes a deeper dive into the limitations of the comprehensive planning modality, currently the most popular planning practice modality. A third section, “Regulation Ascendant,” looks at why regulation has become the dominant mode of plan implementation, as well as its problems. A fourth section, “An Underwhelming Performance Record,” builds on the prior two sections to compare recent sprawl, economic development, housing, travel behavior, and equity outcomes between large urban counties in states with strong planning and regulatory regimes and their counterparts in states with weak planning and regulatory regimes. Based on the underwhelming performance of current planning modalities, the next section, “Learning from Transformational Success Stories,” draws on a recent series of transformation success stories to present an alternative planning modality, Place-and-Policy-Entrepreneurship, or PPE. A follow-up section, “Institutionalizing the PPE Model,” explores how the PPE model might be institutionalized, and a final section, “Choosing among Practice Modalities,” compares the PPE model’s pros and cons to those of the six planning practice modalities currently in use.
Six Contemporary Planning Practice Modalities
Each of the six community planning practice modalities identified above functions in its own way and has distinct advantages and disadvantages. Comprehensive planning tries to align a community’s aspirations into a common set of goals and objectives, which are then used to mobilize implementation resources and collective action (Baum 1996; Dalton 1986; Godschalk and Rouse 2015; Haar 1955; Kelly and Becker 1999; Rothblatt 1971; Rouse and Piro 2021). Originally drawn from the private sector, strategic planning is more directed in scope: it works by identifying strategic responses to a specific set of problems or challenges (Bryson and Roering 1987; Cohen 2006; Kaufman and Jacobs 1987). Comprehensive and strategic planning both conform to what Brooks (2002) calls the centralized rationality planning model, meaning that they are typically undertaken in a hierarchical or top-down fashion by trained professionals rather than through a bottom-up identification of grassroots preferences. Because it proceeds from a common set of stakeholder goals, comprehensive planning works best in situations where goals and aspirations are widely shared. By contrast, strategic planning works best in circumstances where stakeholders can focus their efforts on a common mission or problem. It works less well when problems or issues are amorphous or implementation roles are unclear.
Advocacy and equity planning are more concerned with disadvantaged or marginalized community members than with the community as a whole. Compared with comprehensive and strategic planning, advocacy and equity planning are more bottom-up in their approach to goal specification and problem-solving. Advocacy planning works by mobilizing smaller communities of place or interest to identify preferred responses to particular problems or challenges (Checkoway 1994; Clavel 1994; Davidoff 1965; Marris 1994). Equity planning gives marginalized groups—typically members of racial or ethnic minorities—first call on community resources (Krumholz 1982; Metzger 1996; Zapata and Bates 2015, 2017). Neither makes any claim to being comprehensive in the sense of being best for the entire community or strategic in the manner of identifying the most logically consistent approach to a given challenge. Advocacy and equity planning function as necessary counterpoints to comprehensive planning efforts in situations where dominant majorities or pluralities refuse to pay attention to the needs of community members less economically or politically privileged than they are.
Falling under the rhetorical umbrella known as communicative rationality, consensus-based and collaborative planning are less about managing change or responding to problems and more about resolving present-day land use and resource allocation conflicts. Consensus-based planning presumes that the dimensions of a conflict are well understood and that differences between parties can be resolved through negotiations led by an independent mediator (Fisher, et al., 2011; Innes 1996; Susskind, McKearnen, and Thomas-Lamar 1999). Collaborative planning is based on the idea that cooperatively undertaken fact-finding efforts will lead diverse stakeholders to identify win-win outcomes and compensation practices (Healey 1998; Innes and Booher 2010; Margerum 2002). Consensus-based and collaborative planning work best when they focus on resolving a single issue or conflict.
Participatory master planning is based on the idea that areawide design processes can be organized to identify place-specific physical outcomes characterized by order, inclusion, meaning, ecological balance, and aesthetic harmony (Carmona 2014; Hester 1989; Sternberg 2000). Exactly what these concepts mean and how they are to be applied locally is determined through an interactive process involving designers, landowners, end-users, and community stakeholders (Hester 2010; Hou and Rios 2003). As long as questions of jurisdiction and site control are worked out beforehand, participatory master planning can work at scales ranging from the individual block to the neighborhood to the town.
A final planning practice modality, illustrative scenario-building, 3 uses scenario-creation techniques and spatial simulation methods to explore the projected impacts of alternative spatial development policies and infrastructure investments (Abou Jaoude, Mumm, and Carlow 2022; Avin 2007; Chakraborty and McMillan 2015; Chermack, Lynham, and Ruona 2001; Goodspeed 2019). First applied in its contemporary form in Portland as LUTRAQ (Bartholomew 2007; 1000 Friends of Oregon 1992) and in Salt Lake City as Envision Utah (Scheer 2012), and also known as “blueprint” planning, this approach has been widely used at the metropolitan level to explore municipal land use, transportation and environmental interdependencies, and cumulative impacts (Association of Bay Area Governments and Metropolitan Transportation Commission 2021; Barbour and Teitz 2006; Ewing 2007; Knaap et al. 2020).
Comprehensive Planning and Its Discontents
Of the six practice modalities identified above, comprehensive planning is the most widely applied. In some places, this is a matter of law; elsewhere, it is a matter of tradition and familiarity. 4 According to the American Planning Association, as of 2022, thirty-two states required some or all of their municipal governments to prepare comprehensive community plans. 5 These requirements range from mandating that some forward-looking planning document be periodically prepared, to specifying the precise number and content of required plan elements (Meck 2002, 7–283). 6 Some states also recommend that local comprehensive plans be prepared using a specified process. In California, for example, which has more extensive comprehensive planning requirements than any other state, communities preparing comprehensive plans are encouraged to follow a specific seven-step planning process that begins with civic engagement and concludes with implementation (Governor’s Office of Planning and Research 2017). Two of these steps are considered especially important: formulating community-wide goals and evaluating the ability of different plan alternatives or strategies to meet those goals.
Regardless of their particulars, most comprehensive plan-making efforts suffer from four problems. The first centers around the belief that place-level futures are predictable and will necessarily conform to accepted narratives or trends (Batty and Marshall 2012; Christensen 1985; Hopkins 2001). This is no longer true, assuming it ever was. As America’s cities and suburbs have become increasingly diverse and combinatorial (Frey 2018; Lucy and Phillips 2006; Sandercock and Lyssiotis 2003), planners’ ability to rely on past trends and narratives as a basis for projecting community-wide aspirations and priorities has steadily declined. At the same time that places are becoming more diverse internally, they are becoming more interconnected externally as trip lengths lengthen and an increasing share of daily transactions occur virtually. Try as they might, individual municipalities will be less able to control their futures. Greater external connectivity also means that unexpected, disruptive, or emergent effects in one part of a metropolitan area quickly make their effects known regionwide (Batty 2013; Batty, Barros, and Junior 2006; Hill, Wolman, and Ford 1995). This combination of changes is making community-level futures less knowable and less controllable.
A second problem with many comprehensive plans centers on the mistaken assumption that their goals and objectives are indeed representative of local change priorities (Altshuler 1965; Innes 1996; Vogel and Swanson 1988). The civic engagement processes most communities use to determine their comprehensive planning goals may work to identify consensus priorities—the priorities most participants agree to—but they rarely account for how intensely those priorities are expressed, especially by minority participants. 7 Instead of adopting a narrower set of objectives intended to intensely benefit a smaller cross-section of the population, many comprehensive plans adopt goals whose prospective benefits are more widespread but also more diffuse. 8
A third problem with comprehensive plans is that they do not require their authors to identify robust logic models connecting the choice of intervention strategies to preferred outcomes. Logic models have hypothesized descriptions of the chain of causes and effects leading to programmatic outcomes of interest (McLaughlin and Jordan 2004). Unlike statistical models, which identify relationships between dependent and independent variables but not the mechanisms of those relationships, logic models also explicitly identify the processes and underlying assumptions connecting input resources and activities to outcomes. This allows them to serve as a robust basis for identifying prospective interventions. Say, for example, that a community identifies reducing racial segregation as its top planning goal, and to achieve that goal, it creates a fair housing ombudsman located in the city manager’s office. This is certainly a reasonable thing to do, but is it likely to affect housing outcomes? If the community’s housing stock is too expensive for many would-be black and Latino homebuyers or renters, probably not. What the community might have done, had they first developed a robust logic model, would have been to incentivize the construction of additional affordable housing in white as well as minority neighborhoods. More and better data can help communities to better identify serious problems, but without creating and testing robust logic models, there is a constant danger of confusing correlation with causation, which, as in the example above, may lead to well-meaning but less effective interventions (Ewing et al. 2022).
A final problem with many comprehensive plans is that they all too often lack learning and feedback mechanisms connecting outcomes back to interventions. This makes it difficult to determine whether the selected interventions proceed to work as intended. Comprehensive plan monitoring and evaluation practices are improving (Brown et al. 2022; Laurian et al. 2010; Mueller and Hersperger 2015; Talen 1996), but they still have a long way to go.
Despite these well-known problems, comprehensive planning continues to be popular. This is because comprehensive planning is flexible enough to allow for the incorporation of additional concerns or planning goals, such as those related to sustainability, resilience, climate change, and equity (Berke and Conroy 2000; Berke et al. 2014; Berke et al. 2019; Rouse and Piro 2021).
Other planning modalities also have characteristics that may limit their use for areawide planning purposes. Strategic planning is intentionally limited to pursuing narrow, usually agency-based missions. Like comprehensive planning, advocacy/equity planning and consensus-building/collaborative planning typically lack coherent logic models and feedback mechanisms. Physical master planning is rarely concerned with social outcomes and includes no mechanisms for weighing relative costs and benefits. Illustrative scenario planning can easily conflate scenarios built for predictive or forecasting purposes with those built for speculative and exploratory purposes or normative and advocacy purposes. As with comprehensive planning, none of these limitations is necessarily disqualifying, but they suggest taking appropriate care when considering alternative planning practice modalities.
Regulation Ascendant
In the opening pages of his classic 1996 planning text, The American City: What Works, What Doesn’t, American city planning guru Alexander Garvin identified the three toolsets planners rely on to implement their plans: strategic investments, regulations, and incentives. 9 I would add public–private partnerships to the mix, recognizing that most such partnerships rely on structured combinations of Garvin’s original three. As there is no central repository of community plans, it is impossible to know which of these toolsets are gaining or losing popularity, but casual observation suggests a tilt toward regulation. I say this for three reasons, the first being a matter of simple subtraction: as indicated in Figure 1, which is reprinted from Kane and Tomer (2019), until the Biden infrastructure package was approved by Congress in 2021, federal funding support for capital infrastructure projects was in a long-term state of decline. This had the effect of shifting more of the implementation burden to regulations members. At the local level, it is generally easier to garner community support for additional piecemeal regulation than to convince a majority of voters or city council members to raise taxes to support new infrastructure spending. Second, as housing prices began rising nationwide in the 1980s, suburban homeowners increasingly turned to zoning and other supply-limiting regulations to maintain and enhance their residential asset values (Fischel 2005; J.Levine 2010). Third, with urban cores having recently attracted heightened shares of metropolitan housing and office construction activity (Ehrenhalt 2012; Glaeser and Gottlieb 2006; Thomas 2009; Urban Land Institute 2022), a higher proportion of development proposals have come under the more intense community and regulatory scrutiny typically applied in established urban neighborhoods (Been 2018; Whittemore and BenDor 2019).
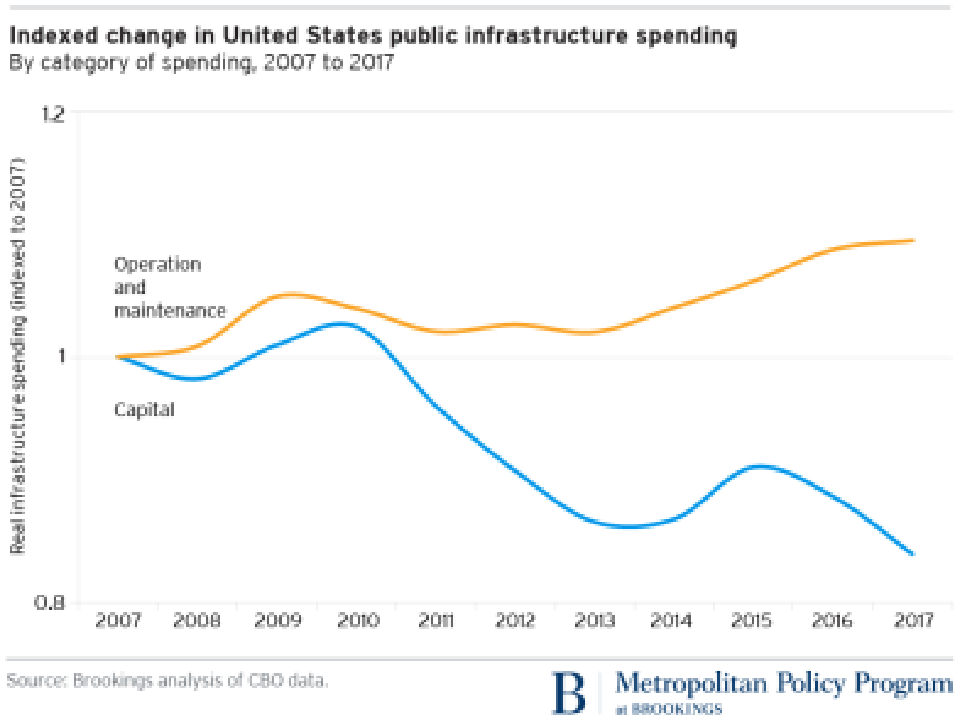
Indexed change in U.S. public infrastructure spending, 2007 to 2017.
Notwithstanding their easy imposition and low up-front costs, regulations suffer from five fundamental problems. The first is regulatory creep, the well-known tendency for regulators to continually expand the coverage and stringency of regulatory requirements with only minimal regard to their cumulative costs and benefits (Eagle 2017). As the old saying goes, “If all you have is a hammer, everything starts to look like a nail.” In terms of plan implementation, local zoning, and environmental regulations have become the hammer that makes every land use, housing, transportation, and community development issue into something to be allowed or prohibited. 10 Regulations also provide administrators with additional decision-making authority that is only infrequently subject to political or judicial review.
A second problem with regulations is that they are subject to regulatory capture, which happens when regulated parties successfully turn regulations to their advantage (Gurran and Phibbs 2015; M.E. Levine and Forrence 1990). There is a good reason why many large homebuilders and developers prefer the standard single-use zoning and variance-granting process to more complicated and less transparent approaches like mixed-use zoning, form-based zoning, and areawide master planning (P.Brown 2015; Moravec 2009). It is because they have mastered zoning’s many intricacies and know how to use them to their benefit.
Third, regulations stifle creativity, innovation, and productivity growth, 11 especially in markets characterized by chronic uncertainty (Blind, Petersen, and Riillo 2017). Unless they specifically mandate adopting new practices or technologies, regulations function to regularize a particular way of doing things (Gann, Wang, and Hawkins 1998). Instead of competing by innovating, those in regulated industries learn to use regulations to create barriers to entry, cementing their positions as incumbents while stifling innovation and progress (Ennis 2010; Schill 2005). 12 Planners often complain how zoning and subdivision codes have stifled the emergence of new land use and residential forms, but then, like the New Urbanists—a group of urban designers and planners who have made commendable attempts to make suburbs more pedestrian-oriented and less physically homogeneous—they go on to suggest swapping out old regulations and codes for newer and more restrictive ones (Duany and Talen 2001).
Fourth, regulations are poorly suited to expanding opportunity and promoting increased equity. Land use and zoning regulations in particular have been widely used throughout metropolitan America to limit apartment and affordable housing construction and, in some instances, to exclude them entirely (Manville, Lens, and Monkkonen 2022; Pendall 2000; Rothstein 2017). This lack of new apartment units disproportionately affects black and Latino households, the majority of whom are renters. 13
Finally, once in place, regulations are rarely removed or modified to become less restrictive. In a longitudinal study comparing changes in residential zoning between 2003 and 2019 among 833 jurisdictions across the country, Pendall, Lo, and Wegmann (2022, 64) found that suburban and county governments were more likely than cities to have adopted or retained anti-density regulations and less likely to have adopted or retained pro-density measures. A comparison of the nearly 2,500 communities that participated in the 2006 and 2018 Wharton Residential Land Use Restrictiveness Index surveys found that one-half increased their overall regulatory restrictiveness between 2006 and 2018, one-third decreased it, and the balance (18%) left it mostly unchanged (Gyourko, Hartley, and Krimmel 2021). The communities that tightened their residential land use regulations were located in every region of the country, while those that loosened them were concentrated in inland rather than coastal regions (Gyourko, Hartley, and Krimmel 2021, 11). Even when a community does loosen its regulations, the results can be underwhelming in terms of stimulating additional supply or causing housing and real estate prices to moderate (Freemark 2020, 2023; Murray and Limb 2023). Although it is still early days, recent efforts by both Minneapolis and Portland to allow by-right construction of small multi-family projects in single-family zoning districts have yet to achieve significant results (Bipartisan Policy Center 2023; Kuhlmann 2021).
To be clear, regulations can be effective community improvement tools if used proactively. Inclusionary housing requirements, for example, have been found to be effective at moderately increasing the supply of affordable housing in growing communities (Anacker 2020). Likewise, environmental regulations that target air and water pollution in and around low-income and minority communities can be an essential part of a broader social justice and climate change agenda (Boyce and Pastor 2013; Bullard 2001). The key is to see regulations as part of a portfolio of purposive and outcome-oriented implementation approaches and not as an end in and of themselves.
An Underwhelming Performance Record
This discussion of different planning modalities’ pros and cons is well and good, but it begs the more important question of which, if any planning modality has a better real-world record. With the exceptions of a limited number of empirical studies of sprawl (Anthony 2004; Burchfield et al. 2006; Fulton et al. 2001; Irwin and Bockstael 2004; Landis 2017; Wassmer and Edwards 2005), land and housing prices (Eicher 2008; Glaeser, Gyourko, and Saks 2005; Gyourko and Krimmel 2021; Gyourko and Molloy 2015; Ihlanfeldt 2009; Kok, Monkkonen, and Quigley 2014; Landis and Reina 2021; Pollakowski and Wachter 1990), and segregation and income inequality (Lens and Monkkonen 2016; Pendall 2000; Watson 2009); and other than a 2009 Lincoln Institute study assessing the efficacy of state growth management programs (Ingram et al. 2009), the empirical literature connecting planning and regulatory activities to place-specific outcomes is surprisingly thin.
This is because, until recently, there was no standard scheme for categorizing or comparing state and local planning and regulatory systems. That finally changed in 2008 with the creation of the Wharton Residential Land Use Index (WRLURI), which combined local survey results in eleven regulatory categories to create a single measure of the strength of residential land use regulations covering fifty states and forty-seven metro areas (Gyourko, Saiz, and Summers 2008). 14 Studies making use of the WRLURI index have since been published connecting stringent residential land use regulations to higher land and housing prices (Eicher 2008; Fratantoni, Seiler, and Woodwell 2021; Gyourko and Krimmel 2021; Landis and Reina 2021; Wassmer and Williams 2021) and increased income segregation (Lens and Monkkonen 2016). A second planning and regulation index, the Beyond Zoning Planning and Regulatory Intensity Index (BZPRII) was used by Landis and Reina (2021) to connect state-level planning requirements to recent increases in local home values. Whereas the survey-based WRLURI is limited to regulations and procedures affecting residential development, especially zoning, the BZPRII was developed from a roster of state planning laws and covers comprehensive planning requirements, environmental impact assessment requirements, and redevelopment practices. Appendix A explains the WRLURI and BZPRII indices in greater detail.
After converting state BZPRII values from their native scale to z-scores, I averaged them with state WRLURI values already in a normalized format. The result is a single index that distinguishes between states with extensive planning requirements and more restrictive residential development regulations (i.e., states with combined WRLURI and BZPRII z-score values greater than 0.5), states with lesser planning requirements and lighter regulations (i.e., states with combined z-score values less than −0.5), and everything in between (i.e., states with combined z-score values between −0.5 and 0.5). Among the states with strong planning and regulatory regimes are Hawaii, California, Rhode Island, Washington, Delaware, Massachusetts, Maine, and Florida. Those in the weak planning and regulatory regime category include Kansas, Arkansas, Texas, Iowa, Alabama, Illinois, West Virginia, Mississippi, South Carolina, Oklahoma, Tennessee, Nebraska, North Dakota, and Wyoming.
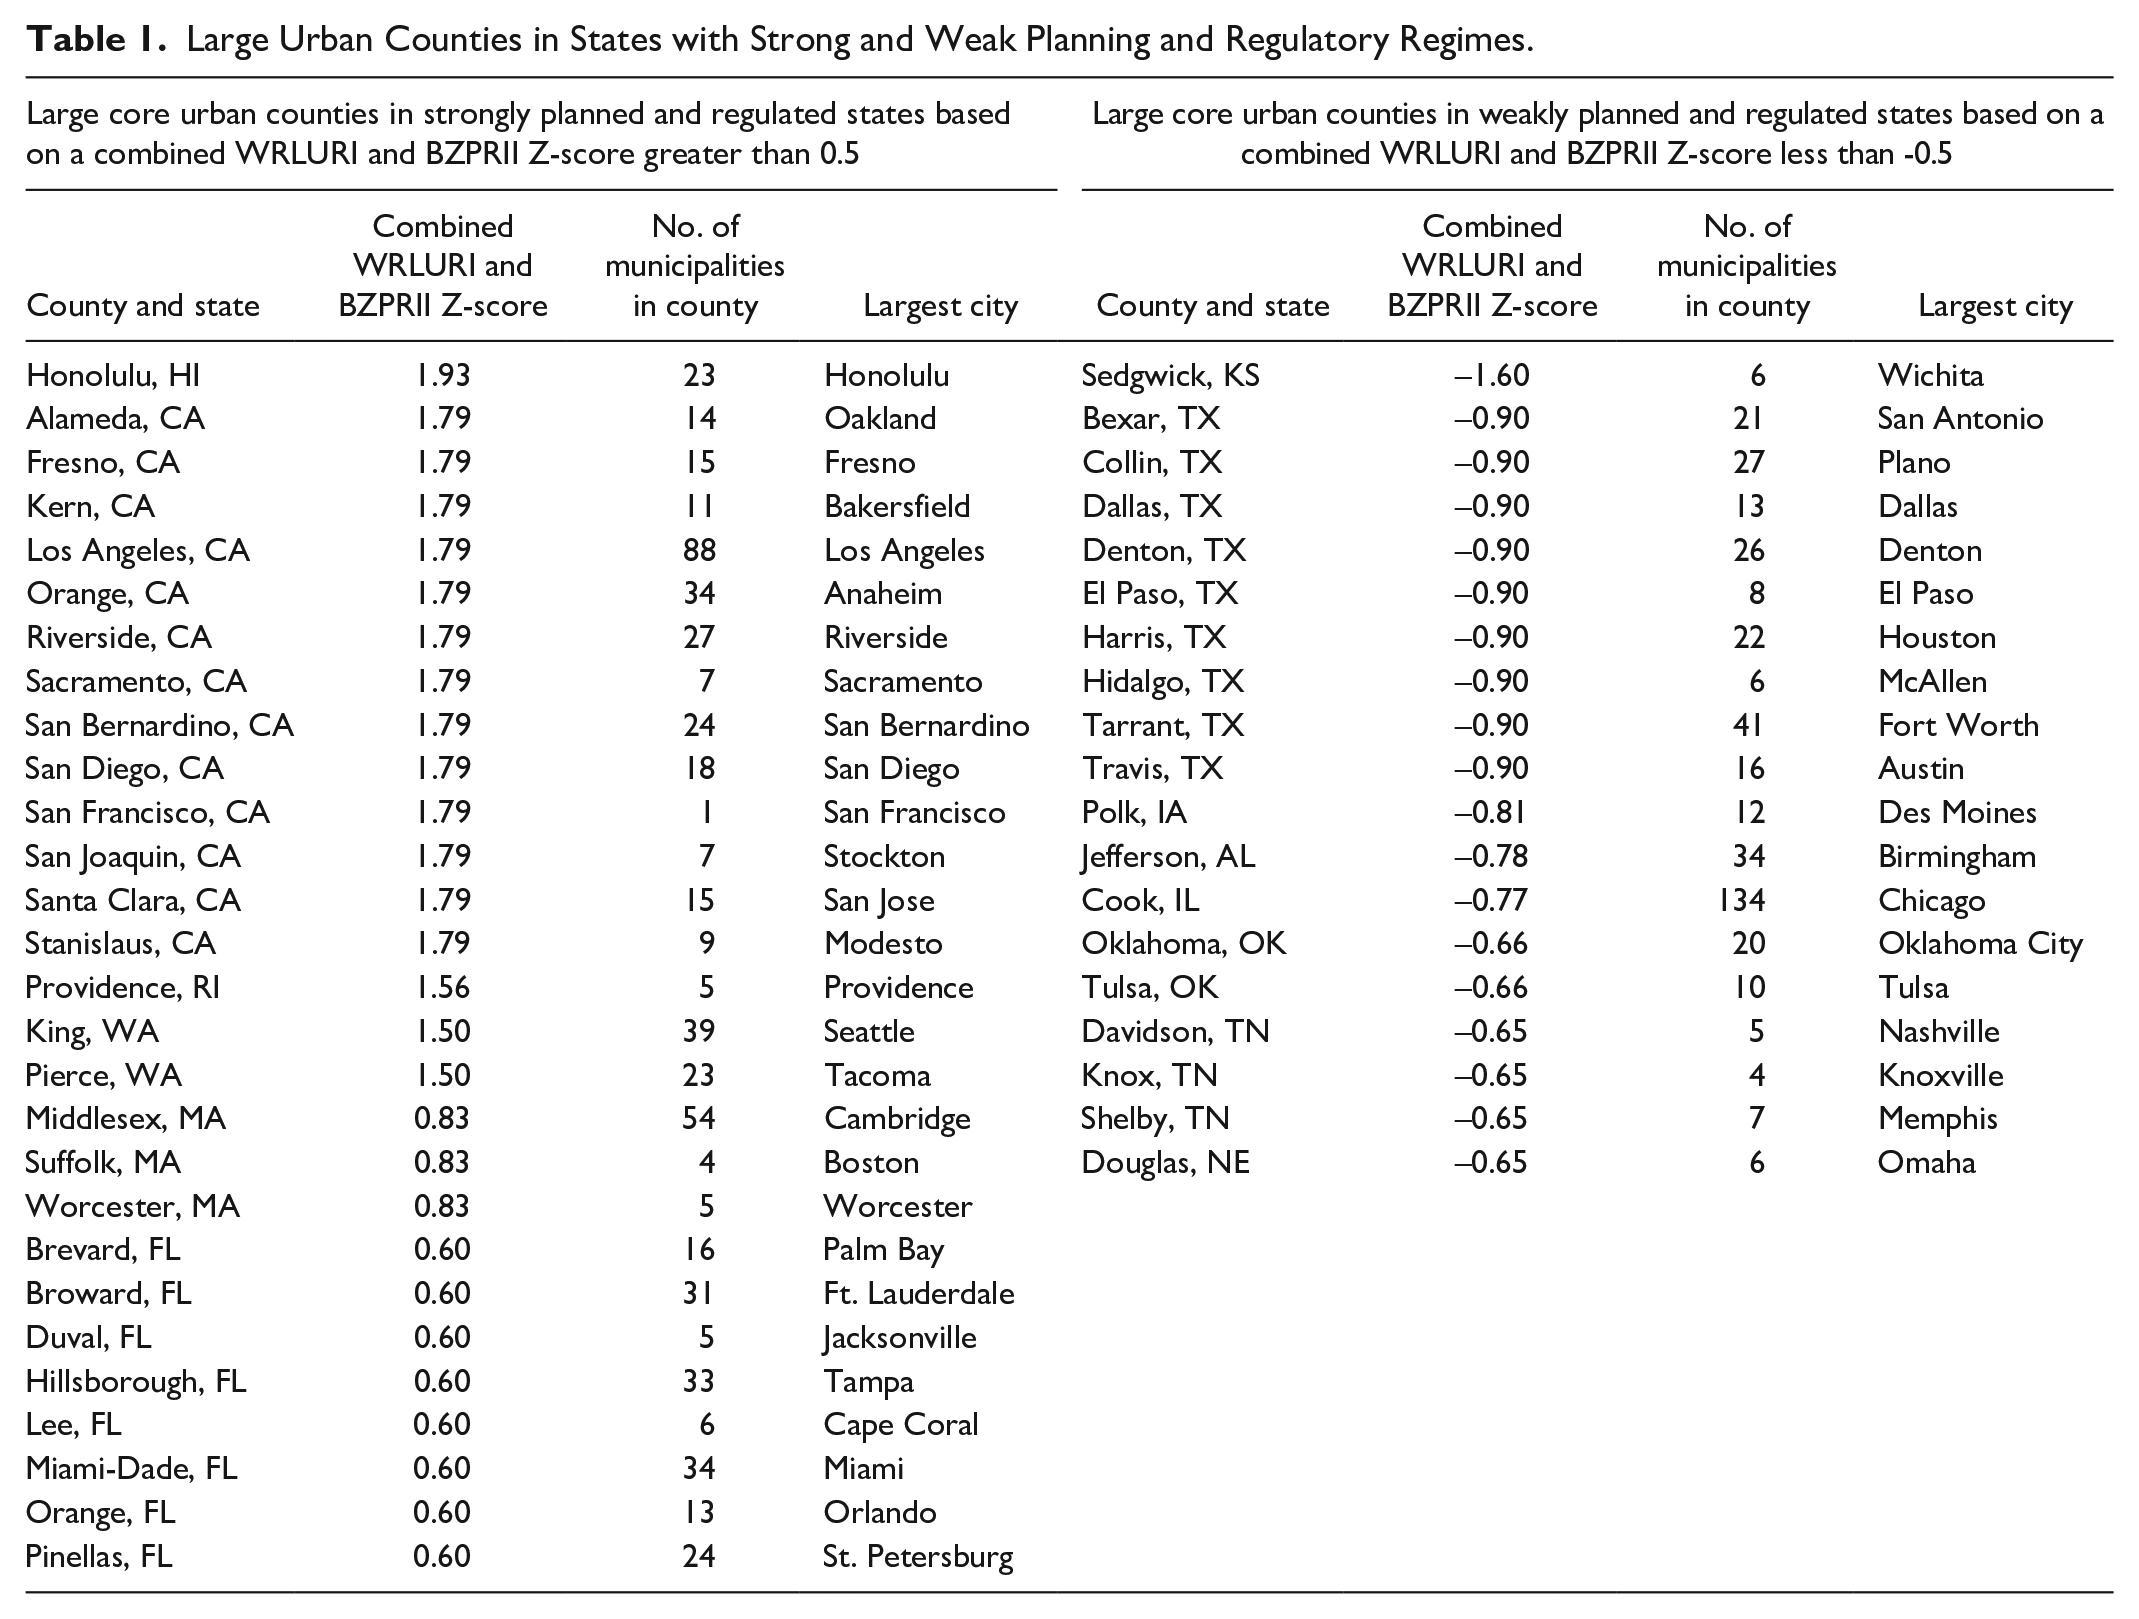
To observe whether there is any association between local planning and regulatory stringency and local outcomes, I compared recent changes in various population growth, economic, housing market, travel behavior, and equity performance measures between twenty-eight large urban counties in states with strong planning and regulatory regimes (henceforth identified as Strong Regime counties) and twenty-one counties in states with much weaker regimes (henceforth identified as Weak Regime counties). A list of the counties falling in each category is included in Table 1, and the various performance comparisons are presented in Table 2. The list of Strong Regime counties is dominated by counties in California and Florida. The list of Weak Regime counties is weighted toward Texas, Tennessee, Oklahoma, and Missouri. Most counties listed in Table 1 include multiple municipalities, many of which, depending on the state, are free to implement their planning and regulatory policies without consulting their neighbors.
Large Urban Counties in States with Strong and Weak Planning and Regulatory Regimes.
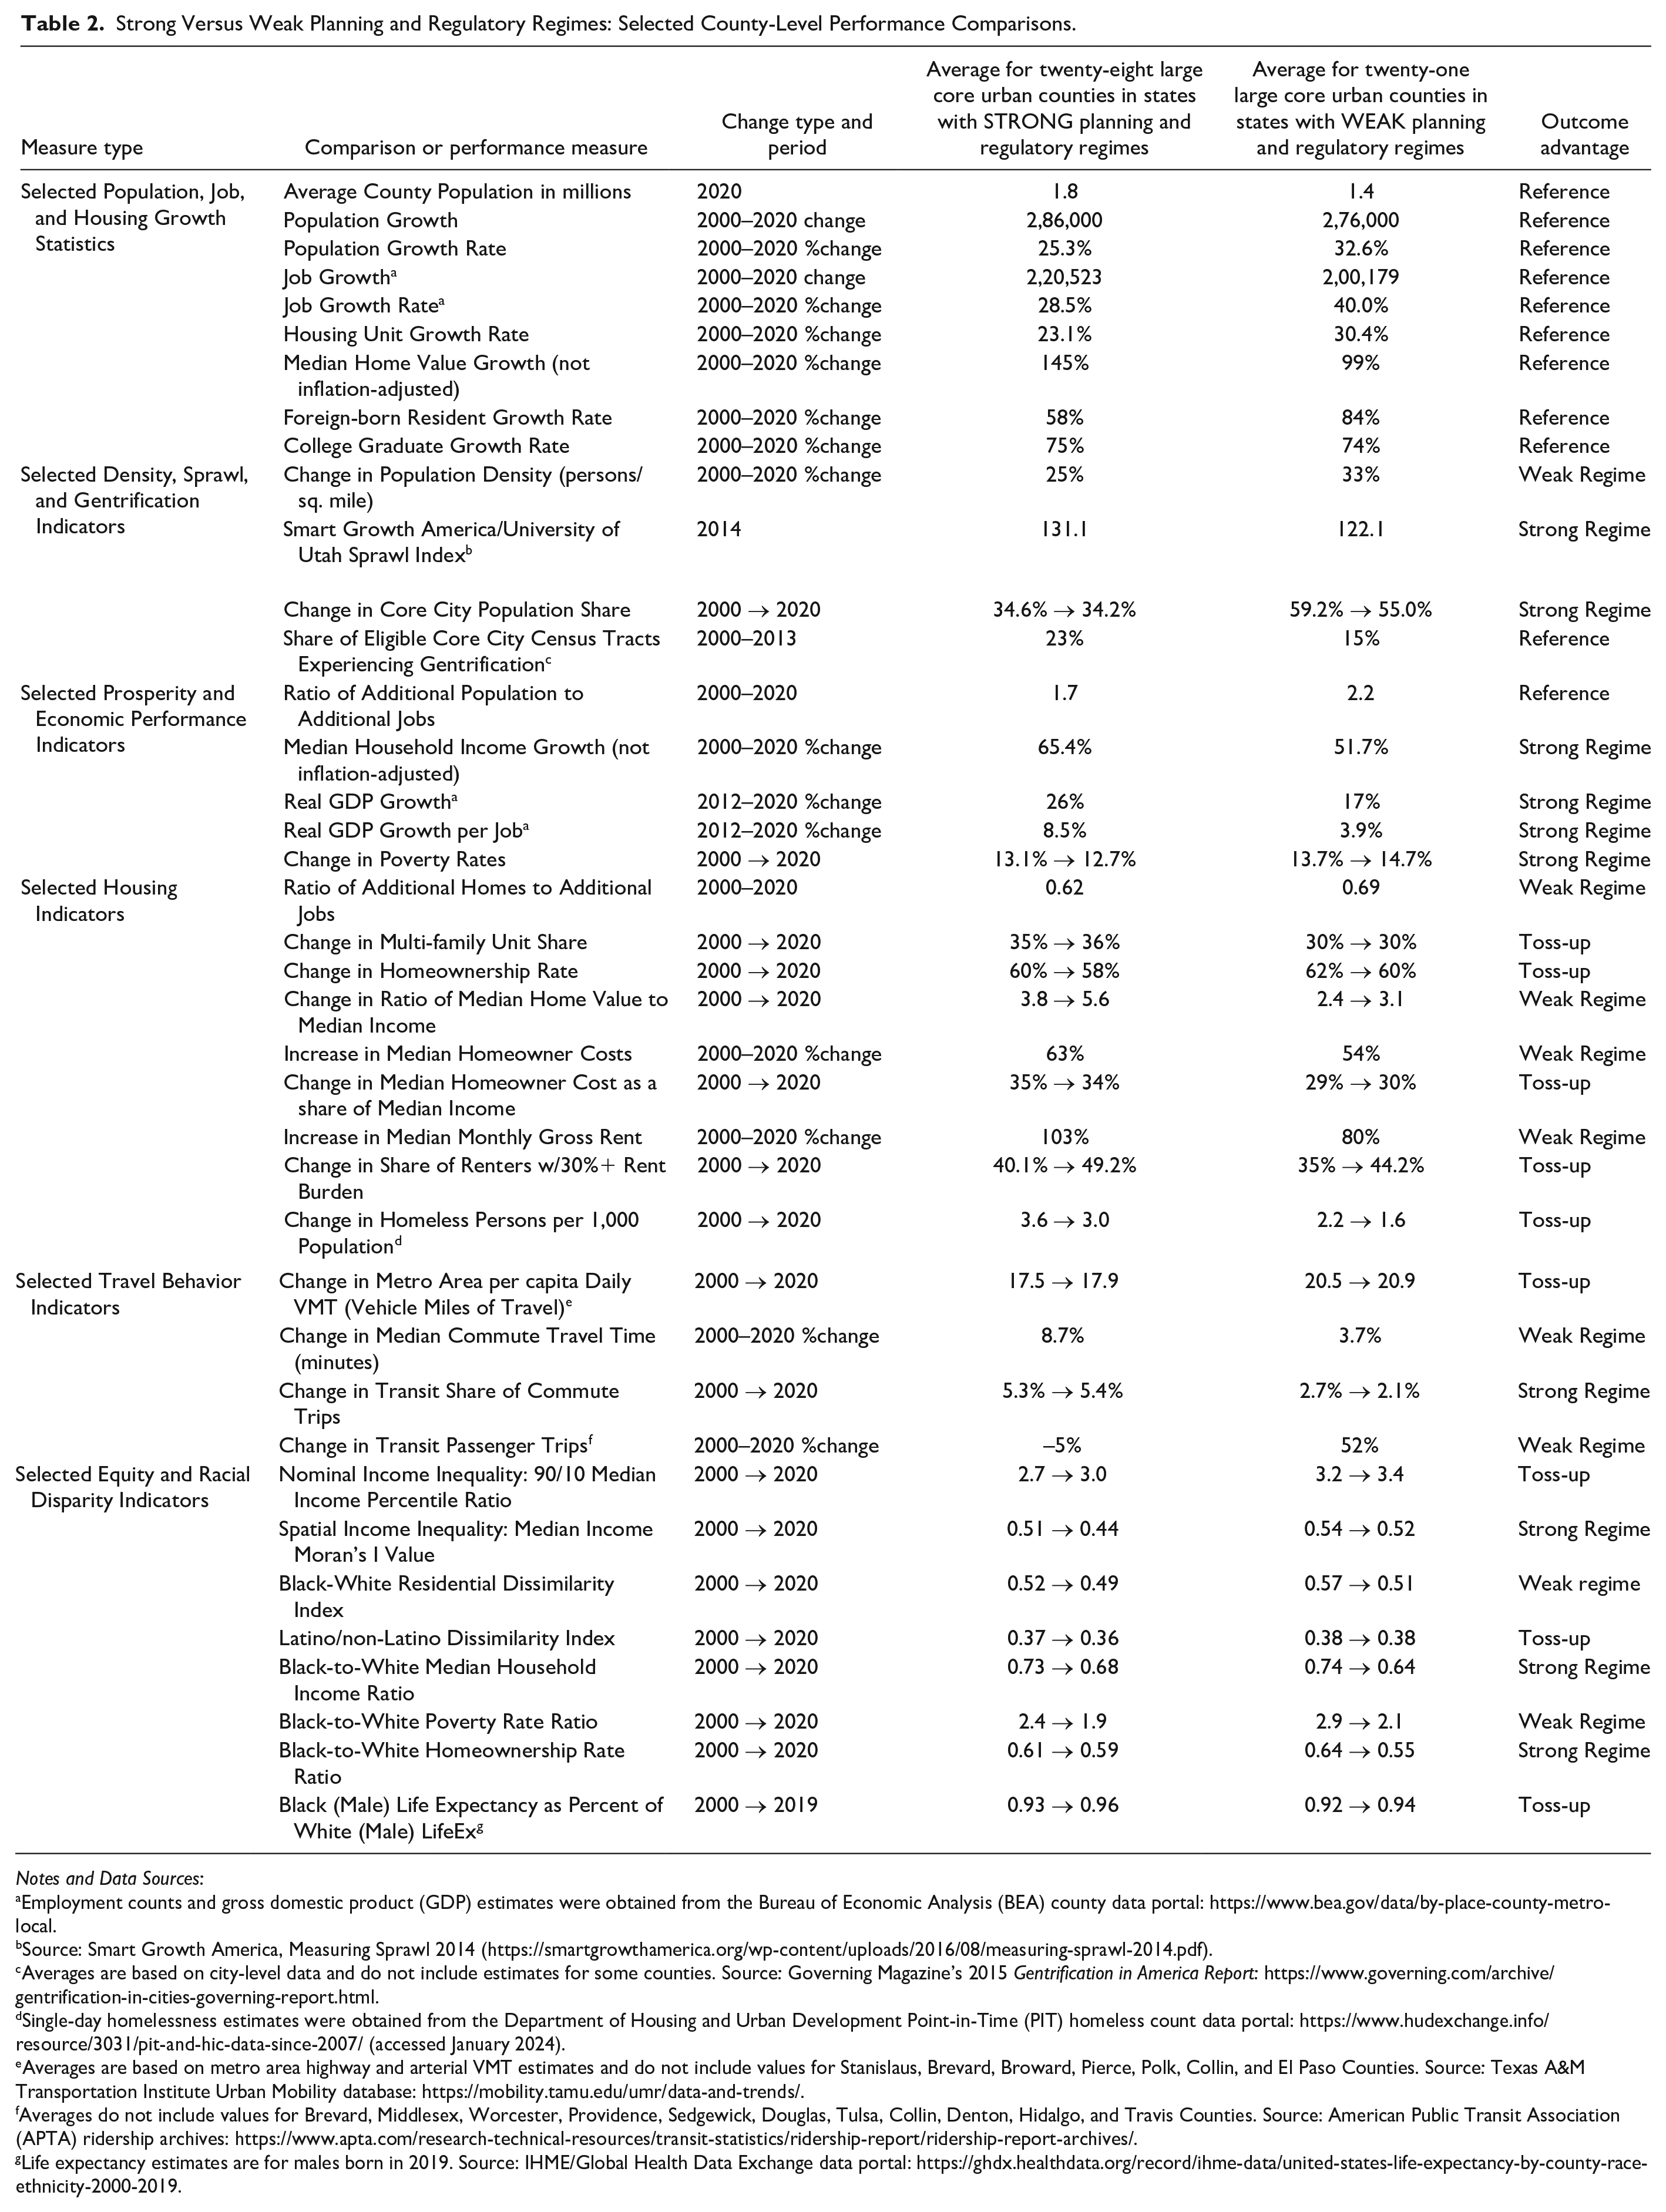
Strong Versus Weak Planning and Regulatory Regimes: Selected County-Level Performance Comparisons.
Notes and Data Sources:
Employment counts and gross domestic product (GDP) estimates were obtained from the Bureau of Economic Analysis (BEA) county data portal: https://www.bea.gov/data/by-place-county-metro-local.
Source: Smart Growth America, Measuring Sprawl 2014 (https://smartgrowthamerica.org/wp-content/uploads/2016/08/measuring-sprawl-2014.pdf).
Averages are based on city-level data and do not include estimates for some counties. Source: Governing Magazine’s 2015 Gentrification in America Report: https://www.governing.com/archive/gentrification-in-cities-governing-report.html.
Single-day homelessness estimates were obtained from the Department of Housing and Urban Development Point-in-Time (PIT) homeless count data portal: https://www.hudexchange.info/resource/3031/pit-and-hic-data-since-2007/ (accessed January 2024).
Averages are based on metro area highway and arterial VMT estimates and do not include values for Stanislaus, Brevard, Broward, Pierce, Polk, Collin, and El Paso Counties. Source: Texas A&M Transportation Institute Urban Mobility database: https://mobility.tamu.edu/umr/data-and-trends/.
Averages do not include values for Brevard, Middlesex, Worcester, Providence, Sedgewick, Douglas, Tulsa, Collin, Denton, Hidalgo, and Travis Counties. Source: American Public Transit Association (APTA) ridership archives: https://www.apta.com/research-technical-resources/transit-statistics/ridership-report/ridership-report-archives/.
Life expectancy estimates are for males born in 2019. Source: IHME/Global Health Data Exchange data portal: https://ghdx.healthdata.org/record/ihme-data/united-states-life-expectancy-by-county-race-ethnicity-2000-2019.
Among the various performance indicators included in Table 2 are measures of population growth and composition; population density, sprawl, infill activity, and gentrification; job, income, and gross domestic product (GDP) growth; poverty reduction; housing construction activity, housing values and rents, housing affordability, and homelessness; measures of nominal and spatial income inequality and residential segregation; and measures of racialized income, poverty, homeownership, and life expectancy disparities. Except where noted, all of the indicators measure change between 2000 and 2020 and are drawn from American Community Survey results (The details of how each indicator is constructed are presented in Appendix B).
Assuming planning to be a force for beneficial change, we should expect to see improved economic, housing market, sprawl, and travel behavior performance, as well as greater equity improvements among counties in states with additional planning requirements and stronger regulatory regimes. To the extent that planning is ineffective, or worse, counterproductive, we should expect better performance from counties in states with fewer planning requirements and weaker development regulations.
Of the three density and sprawl performance categories, the Strong Regime counties performed better in two (index of compactness and connectedness, and core city population growth share) while the Weak Regime counties did better accommodating additional density. Neighborhoods in Strong Regime counties were also more likely to have gentrified.
Of the five economic growth and prosperity categories, the Strong Regime counties performed better in four categories (household income growth, overall GDP growth, GDP growth per worker, and poverty rate reductions), while the Weak Regime counties added new jobs at a faster rate.
Of the nine housing choice, cost, and affordability categories, the Weak Regime counties outperformed the Strong Regime counties in four categories (balance of housing and job growth, ratio of housing value-to-income, yearly homeownership cost, and rental cost increases), while the other five categories—the multi-family share of new housing construction, change in homeownership rates, annual homeownership cost as a share of income, excess rental cost burden, and changes in homelessness rates—were rated a toss-up. In none of the housing categories did counties in states with stronger planning and regulatory regimes perform better.
Of the four travel behavior categories, the Weak Regime counties performed better in two categories (holding the line on average commute times and boosting public transit ridership), the Strong Regime counties performed better in one category (increasing transit’s commute mode share), and one category was rated a toss-up (holding the line on per capita VMT).
Of the eight equity and racial disparity categories, the Strong Regime counties performed better in three categories (improvements in spatial income equality, and reductions in black-white income and homeownership disparities), while the Weak Regime counties performed better in two categories (reductions in black-white residential segregation and reductions in black-white poverty gaps). Two equity categories were a toss-up: changes in nominal income inequality and reductions in black-white life expectancy gaps.
The unavoidable takeaway from Table 2 is that recent community planning efforts have hardly been a force for positive community change. Instead, they have mostly served the built environment status quo. Of the twenty-eight performance categories listed in Table 2, counties in strong planning regime states did unambiguously better in ten categories, while counties in weak planning regime states did better in nine categories. The other nine categories were rated a toss-up. Looking across categories, counties in states with strong planning and regulatory regimes did consistently better at boosting incomes and reducing spatial income inequality and poverty rates than counties in weak regime states but consistently worse at building needed housing or keeping rising housing costs in check. Counties in states with weaker planning regimes also did better in holding the line on rising commute times and increasing overall transit ridership. Planning also comes up short in terms of being a consistent force for reducing residential segregation or for narrowing racialized economic, homeownership, and health disparities.
These findings are subject to a multitude of caveats. They are biased toward readily available economic, housing, transportation, and equity data at the expense of harder-to-get environmental or quality-of-life data. They assume that local planning requirements and regulations are applied exactly as specified in state legislation and are implemented similarly within each county. They are drawn from a limited sample of large urban counties deliberately chosen to represent the extremes of planning practice/regulation instead of the more moderate middle ground. They do not explicitly account for the fact that depending on the particular performance measure, the level of within-category variation may be larger than the between-category variation. Nor do they account for the possibility that the observed relationships might run in the opposite direction: instead of more rigorous planning generating more (or less) beneficial outcomes, places that were initially better off might elect to undertake stronger planning and regulatory efforts. Most crucially, they are purely indicative and should not be interpreted as being causal in the sense that increasing (or decreasing) the stringency of local planning requirements will necessarily lead to changes in local economic, housing market, and equity outcomes.
Caveats aside, these findings suggest that when considered in terms of outcomes instead of activity levels, recent local planning efforts in the United States have had a very mixed record in terms of delivering areawide benefits. On the positive side, counties in states with stronger planning and regulatory regimes have experienced higher household income and business productivity growth rates, made additional progress in ameliorating poverty, and experienced notable reductions in spatial income inequality. These gains have been offset by lower rates of new home construction, higher housing costs, and reduced housing affordability. Equally discouraging, compared with their counterparts in states with weaker planning systems, counties in states with strong planning and regulatory regimes appear to have made less progress encouraging higher population densities, increasing public transit use, or reducing average commute times.
Learning from Transformational Success Stories
The intent of the prior discussion is not to gratuitously pick on local planning efforts or well-meaning planners. Rather, it points out that if planning wishes to live up to its oft-stated aspiration to be a force for positive community change, it must expand its regular practice modalities to include ones that more consistently achieve successful outcomes. Where might such practices be found? In 2016, I began research for an intended book on how planner-led efforts were positively transforming global cities. While I found situations where this was indeed the case—prominent examples include Singapore and Shenzhen’s linking of economic development strategies to citywide quality-of-life improvements, Copenhagen’s successful efforts to expand citywide bicycle use, and New York City’s PlaNYC initiative, which weaved sustainability into every aspect of city policy—I found many more cases in which those spearheading successful community transformations were not traditional planners. Instead, they were pragmatic problem solvers unbeholden to established conventions and practices and open to any approach that promised to produce positive results. Among the many examples I found of where this place-and-policy entrepreneurship approach succeeded are five whose stories can be summed up in a paragraph. In each case, the central role of one or more place-and-policy entrepreneurs is apparent:
A Rebuilt-from-Rubble Church Revives a Formerly Downtrodden East German City. Of the many German cities leveled by Allied bombers during the closing months of World War II, none suffered more damage than Dresden. Among the one-third of Dresden buildings reduced to rubble by Allied bombs was the Frauenkirche, Europe’s finest Baroque church, completed in 1743. Until the fall of the Berlin Wall in 1989 and German reunification a year later, what remained of the Frauenkirche sat in a pile of debris. Armed with detailed architectural drawings and photographs from a nineteenth-century building survey, a group of twenty-two Dresdeners led by renowned trumpeter and composer Ludwig Guttler launched a grassroots campaign to rebuild the historic masterpiece (Joel 2012). Their efforts attracted global attention, and after eleven years of careful reconstruction, a rebuilt Frauenkirche finally opened its doors to the public in October 2005. With the Frauenkirche as its touchstone, Dresden’s historic rebuilding efforts soon spread citywide. While the former East Germany’s other major cities have struggled to attract new investment, Dresden has thrived.
A New Type of Urban Park. Now one of York City’s top tourist and resident attractions, in 2005, the High Line was still an abandoned rail spur that had once served Lower Manhattan’s meatpacking district. After attending a 1999 community meeting 15 to discuss demolishing the High Line, neighborhood activists Joshua David and Robert Hammond resolved to preserve and repurpose it as an elevated public park (David and Hammond 2011). Working through their non-profit group, Friends of the High Line, David and Hammond, along with New York City Planning Commission Director Amanda Burden, put together a $150 million package of municipal and philanthropic funding to realize their vision. Among the keys to the High Line’s success was the creation of the West Chelsea Special District, which raised the zoning potential (and soon after that, the land values) of surrounding properties (Lang and Rothenberg 2017).
Three Million-plus New Affordable Housing Units. Not every urban success story involves physical improvements. Some also involve creative policies and programs. In 1986, Barry Zigas, the executive director of the National Low Income Housing Coalition (NLIHC), muscled his way into tax reform negotiations between Congress and the Reagan Administration to push for creating the Low Income Housing Tax Credit (LIHTC) program. Unlike existing affordable housing programs, which either had the federal government subsidize new construction or else pay private landlords to accept low-income tenants, the LIHTC program offered tax credits to private investors to fund the construction of new and rehabilitated affordable units earmarked for low and very low-income renters (Zigas 2013). By limiting the yearly supply of tax credits and requiring developers to compete for them based on targeting and ready-to-proceed criteria, the LIHTC program prioritized quality and production. Zigas and the NLIHC’s innovative approach to funding affordable housing construction was included in the 1986 Tax Reform Act, and over the next thirty-five years, the LIHTC would fund the successful construction or rehabilitation of three million high-quality rental units for low-income families. 16
A Smaller but Better Pittsburgh and a Revitalized Downtown Philadelphia. With nearly 700,000 residents, Pittsburg was America’s twelfth largest city in 1950. Because air and water pollution from Pittsburgh’s many steel mills went largely unregulated, it was also America’s dirtiest and most polluted city. By 1990, almost all of Pittsburgh’s steel mills had closed, leaving the city with just 370,000 residents. Realizing that Pittsburgh would need a new economic base if it was to survive, community leaders affiliated with the Pittsburgh Downtown Partnership, the Allegheny Conference on Community Development, and the University of Pittsburgh and Carnegie Mellon University came together to begin a process of re-orienting Pittsburgh’s regional economy away from heavy manufacturing industries and toward information technology, robotics, higher education and advanced health services (Dieterich-Ward 2015). Today, Pittsburgh is a much smaller place than it was forty years ago, but it is also a more prosperous one, possessing a modern and diversified economy and a much-improved quality of life. Three hundred miles to the east, while Pittsburgh was reimagining its regional economy, Philadelphia business leaders were re-engineering the business improvement district (BID) model to save that city’s rapidly declining downtown core (Morcol 2010). The results of their efforts, the Philadelphia Center City District, led until 2023 by public policy entrepreneur Paul Levy, would also prove successful and make BIDs an essential part of today’s urban management toolbox (Mitchell 2009).
Mild Deregulation Provides Los Angeles with a Real Downtown. Los Angeles has been trying without success to create a real downtown for itself since the 1940s (Marks 2004). The thing that finally did the trick was the adoption in 2000 of the Los Angeles Adaptive Reuse Ordinance (ARO), which permitted the owners of vacant downtown office and industrial buildings to convert them to residential use without obtaining a zoning change or variance and without having to provide additional parking. A form of mild deregulation, the ARO was the brainchild of Tony Gilmour and a group of preservation-oriented real estate developers and commercial property owners. After a slow start, ARO conversion quickly picked up steam, ultimately adding more than 14,000 residential units (Chamberlain 2015; Manville 2013) and giving Los Angeles the vibrant downtown it had long craved.
Three things set these examples apart. First, although each would eventually involve public sector planners as key participants, none were initiated by planners or undertaken as part of a regular government-sponsored planning process. Instead, they were each initiated by entrepreneurial individuals or stakeholder groups willing to go out on a limb to take on a pressing community or public policy challenge. Second, none was a sure thing. Quite the opposite: history and prior experience suggested each could fail. Third, all five generated large and positive spillover benefits far above their original costs. To the degree that these stories all followed a common narrative, it is one in which their protagonists first immersed themselves in the details and politics of an issue, then identified a desirable and imageable result, then sought out key allies and partners (especially ones with money and political power), then formulated a plan of action to achieve a particular outcome, and then pursued that plan while also signaling their willingness to modify it as necessary.
These place-and-policy entrepreneurs, or PPEs as I call them, have many characteristics associated with business entrepreneurs. These include an orientation toward thinking in terms of users and markets rather than interests and stakeholders, a comfort level with taking risks, a familiarity with alternative financing mechanisms, a preference for specific expertise over general knowledge, and a predilection for contingent rather than deterministic or trend-based thinking. Among the other attributes common to successful PPEs are:
An ability to visualize a positive outcome without prematurely committing to a particular delivery model or technology. Successful PPEs are not overly concerned with problem definition or precisely matching problems and solutions. Instead, they focus on visualizing and communicating desired outcomes while remaining open to experimenting with different implementation and delivery models.
A focus on outcomes, not capacity-building. Good PPEs view their task as achieving a successful outcome and not building longer-term organizational or institutional capacity. That can potentially come later.
A preference for scalable pilot projects. Given that they are typically sailing in uncharted waters, PPEs favor using small-scale proof-of-concept pilot projects to test out their ideas. At the same time, they are attentive to the importance of scaling up approaches found to be successful.
A lack of turf consciousness and a preference for finding allies and partners. Successful PPEs are less concerned with owning something or claiming credit than finding capable allies committed to a common end. This is because they do not want to worry that adhering to traditional idea ownership conventions will prevent them from finding partners whose energy and financial resources will be necessary to succeed.
A basic understanding of project finance. PPEs understand that initial grants, debt, or seed capital will not last forever and that viable initiatives must eventually be able to successfully cover their ongoing operating costs.
Institutionalizing the PPE Model
How might the PPE model be institutionalized within existing local governments? One way would be to return to the early twentieth-century role of city planning departments as municipal research bureaus as well as plan producers and implementers of zoning regulations. Every few years, these reconstituted planning/research departments would issue PPE challenge statements identifying two or three community problems they were seeking solutions to. These might include increasing the supply of affordable housing to repurposing vacant commercial properties, proactively identifying historic preservation opportunities, improving public school test scores, reducing residential segregation, and increasing the availability of preventive health services in poor neighborhoods. Entrepreneurs and stakeholder groups would be invited to respond to these PPE challenge statements with proposals for proof-of-concept pilot projects. Projects could include physical projects, programs, or new institutional arrangements. Proposals would be required to include a clear statement of the extent and severity of the problem, a logic model linking the problem to the proposed projects, a thorough description of the proposed project, a summary of the stakeholder’s qualifications; a specific funding request to undertake a pilot version of the proposed project; and an indication of how the proposed pilot version, if successful, might later be scaled up.
In form and function, these PPE challenge proposals would look a lot like the business funding proposals that would-be entrepreneurs regularly submit to investors and venture capital funders. The main difference would be that whereas business funding proposals include an identification of market gaps and opportunities, PPE challenge proposals would be concerned with responding to place-based issues. Those submitting proposals would have to identify some current link to the community. National urban policy and consulting groups could partner with local proposers but could not apply independently. So as not to get distracted administering multiple projects, no more than one or two projects or programs would be awarded per proposal cycle. Initial funding would be for no more than two years, with no possibility for renewal. Once the pilot project was completed, the proposer could apply for additional funding from conventional public or private funding sources. Proposers could legally incorporate, but their projects could not be patented or trademarked, as one of the purposes of the PPE model is to encourage the frictionless diffusion of worthwhile ideas. 17
For the PPE model to take root, planning schools would have to teach courses in public entrepreneurship. Following the successful business school model, these courses should use the case study method highlighting the analytical skills required for proper problem identification, creating appropriate logic models for identifying intervention strategies, approaches to managing risk and uncertainty, team-based project management skills, and something about project financing. These skills are not limited to future PPE practitioners and would also benefit students with interests in other planning areas.
Some will argue that these ideas are the same old Bill Clinton-Tony Blair neoliberal planning wine repoured into a new bottle (Brenner and Theodore 2005). There is some truth to this, as many of the skills and perspectives required of successful PPEs—a belief in the innovation and choice power of markets, a focus on competitive efficiency rather than guaranteed outcome equality, and a familiarity with private financing—also characterize neoliberal planning practice (Joy and Vogel 2021; Weber 2002). Where the PPE model differs from the neoliberal one is in its more entrepreneurial and experimental orientation and its public benefits focus. Instead of substituting utilitarianism for collective decision-making and rather than committing whole hog to the privatization of public goods and services, the PPE model expands on the creative thinking processes common to entrepreneurs to respond to place-specific problems and challenges.
The PPE model also overlaps with a diverse set of practices known as tactical urbanism, do-it-yourself (DIY) urbanism, urban acupuncture, and urban prototyping. As defined by its popularizers, Lydon and Garcia (2015), tactical urbanism is “an approach to neighborhood building and activation using short-term, low-cost and scalable interventions and policies.” Tactical urbanism eschews formal plans and citywide programs in favor of grassroots, place-specific, improvisational, and low-cost interventions. Examples of tactical urbanism interventions include reclaiming street spaces previously reserved for the automobile, inserting small social housing projects into larger residential blocks, turning unused lots into community parks and gardens, and substituting vegetation and greenery for concrete and asphalt (Lydon and Garcia 2015). Like the PPE model, tactical urbanism elevates solving specific problems, often in a single location, over undertaking community-wide studies and programs. Another similarity to the PPE model is that tactical urbanism views its clients not as generalized constituencies but as immediate beneficiaries. Lastly, as with the PPE model, tactical urbanism takes an experimental and adaptive approach to promoting change. 18 Where the PPE model differs most from tactical urbanism is in its bias toward taking on bigger and more systematic challenges and in its interest in mobilizing large-scale financial and personnel resources, often from the private sector. The PPE model is also meant to be strategic, meaning that its interventions are meant to serve long-term aims.
Choosing among Practice Modalities
My enthusiasm for the PPE model notwithstanding, I do not advocate substituting it for comprehensive planning or any other current community planning practice modality. What I do advocate is that planning departments and agencies include the PPE model in their practice toolkits and that planners do a more mindful job matching particular practice modalities to the circumstances and tasks at hand.
At the top of the practice modality list, if only because of its popularity and longevity, is the comprehensive planning model (see Table 3). In these politically fragmented times, the practice of aligning community aspirations to mobilize collective actions can be especially worthwhile. Leaving aside questions of intent and focusing instead on results, the comprehensive planning model works best in communities where past trends offer useful predictive value, where there is already a culture of inter-agency or inter-departmental problem-solving, and in small- and mid-sized localities with homogeneous populations where there is some community-level agreement about what constitutes a desirable collective future. In communities where change is unrelenting and controversial, where public actors see each other as competing for resources and influence, and where there are fundamental disagreements about priorities for the future, the traditional comprehensive planning modality is a poor choice. Even in communities where the comprehensive planning model is a good situational match, it is likely to be a poor strategic one if the municipality’s implementation tools are limited to imposing additional regulations.
Strengths and Weaknesses of Alternative Planning Practice Modalities.
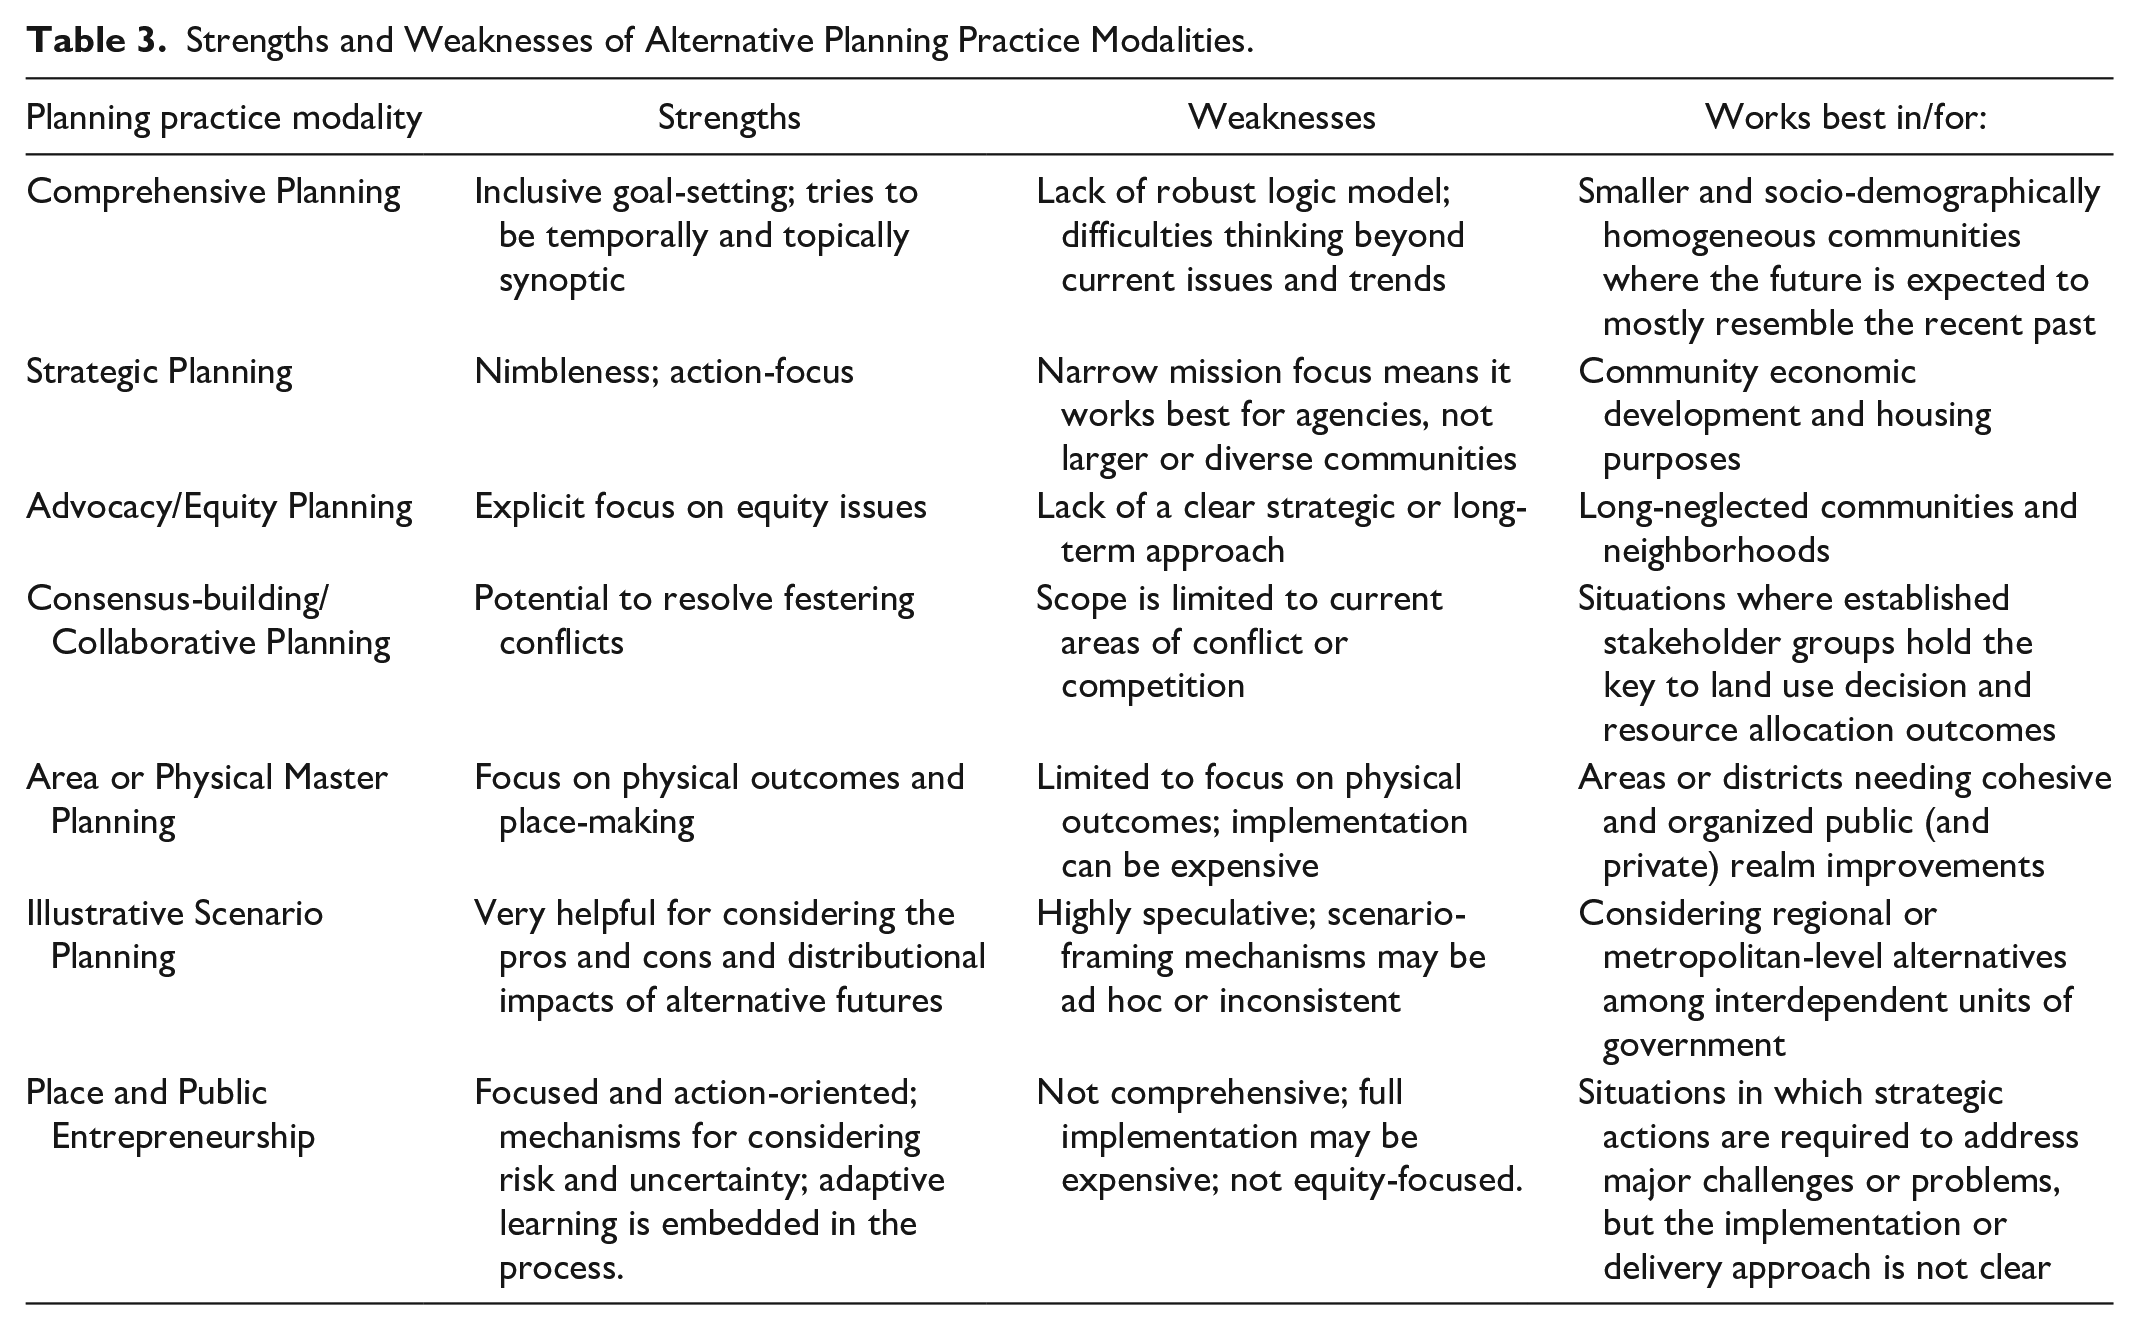
Nor is the strategic planning model necessarily a good choice for many community-level planning efforts. Strategic planning has the advantage of being nimble and results-oriented, but it starts from the assumption that all participants share a common sense of mission or purpose. Procedurally, the strategic planning model rests on carefully identifying community strengths, weaknesses, opportunities, and threats as determined in what is commonly known as a strengths-weaknesses-opportunities-and threats, or SWOT analysis. Community-level strengths and weaknesses may be easily identified, but opportunities and threats are not, particularly in diverse and resource-poor communities. These characteristics make the strategic planning modality a good potential choice for public agencies like local economic development departments and housing departments where long-established metrics (e.g., jobs created, additional affordable housing units funded) provide a useful measure of agency performance, but a poor choice in situations that involve tradeoffs between outcomes, neighborhoods, or stakeholder groups.
Much narrower in purpose and design than the comprehensive planning or strategic planning modalities, the advocacy and equity planning models should be the modality of choice in localities where the needs and priorities of the poor and racial minorities have been systematically ignored or where there are longstanding housing, health, wealth, and educational outcome disparities between demographic and income groups. No other planning modality makes reducing those disparities a fundamental priority. At the same time, goodness of intention alone is not a sufficient criterion for choosing a planning approach. Those undertaking an equity or advocacy planning effort must do so based on a robust logic model that tightly connects proposed interventions to beneficial outcomes and functions at scale. Otherwise, little will change.
Focused on resolving land use, environmental, or resource allocation conflicts among stakeholder groups, the consensus-building and collaborative planning modalities are still narrower. Whereas the consensus-building approach works best when mediating disputes among distinct interests, the collaborative planning model uses shared fact-finding to uncover common perspectives, interests, and trust among diverse stakeholder groups. Both approaches are transactive rather than normative, meaning that a desirable result is one in which agreement is reached rather than a specific outcome. Unlike any of the prior modalities, consensus-building and collaborative planning approaches can function across municipal boundaries and are not necessarily bound by local funding or administrative constraints. This makes them a good choice for dealing with environmental issues and conflicts or resolving disagreements over how funds should be spent. A limitation of both approaches is that they may be subject to strategic behavior, meaning that stakeholders may have incentives to try to manipulate any negotiation or collaborative process for their own purposes. This puts much pressure on the parties administering the process to ensure all participants always act in good faith.
The participatory master planning modality is best used when the planning process’s desired outcome includes a physical plan for an area or neighborhood. It uses some of the same community-based fact-finding approaches as the equity, advocacy, and collaborative planning models but does so in a manner intended to identify physical and public realm interventions rather than programmatic or regulatory ones. Unlike the other planning modalities discussed so far, participatory master planning relies on professional expertise and everyday lived experiences rather than a formal logic model to identify inclusive design solutions. Topically and instrumentally, participatory master planning is wide-open, enabling it to deal with both public and private spaces (as appropriate); with land, buildings, open and natural spaces, and public facilities; and to propose project-based, programmatic, and regulatory interventions.
The illustrative scenario-building model works well as a vehicle for bringing divergent stakeholders together around a common future (or futures), but it is less useful as a guide to action. This is because its embedded logic model is based on a series of contingent narratives (e.g., if we take this action now, it should have that effect in the future) rather than a careful enumeration of alternative projects, programs, or regulations. It also lacks geographical specificity, meaning its ability to identify future states at the neighborhood or community level is fairly limited. This makes it a good choice for regional or metropolitan-level visioning exercises but less useful as a full-on community planning model.
The PPE model is best suited to situations where there are difficult but clearly defined problems to solve, yet the appropriate solution is unknown and/or will require some real-world testing that involves building stakeholder coalitions and finding needed funds.
These are my inclinations, and not every reader may agree with them. What everyone should be able to agree upon is that every planner should include multiple planning practice modalities in their toolkits and that one of the jobs of planning schools and professional groups like the American Planning Association should be to accumulate evidence demonstrating which approaches work best in which circumstances. This requires a healthy ex-ante agnosticism about the superiority of any single model and a strong ex-post commitment to undertaking robust evaluations. Finally, as long as they do so deliberately and with an eye toward improved outcomes, there should be nothing to stop thoughtful practitioners from creating their contextually appropriate planning practice modalities, perhaps by combining elements from those discussed above.
Footnotes
Appendix A
Appendix B
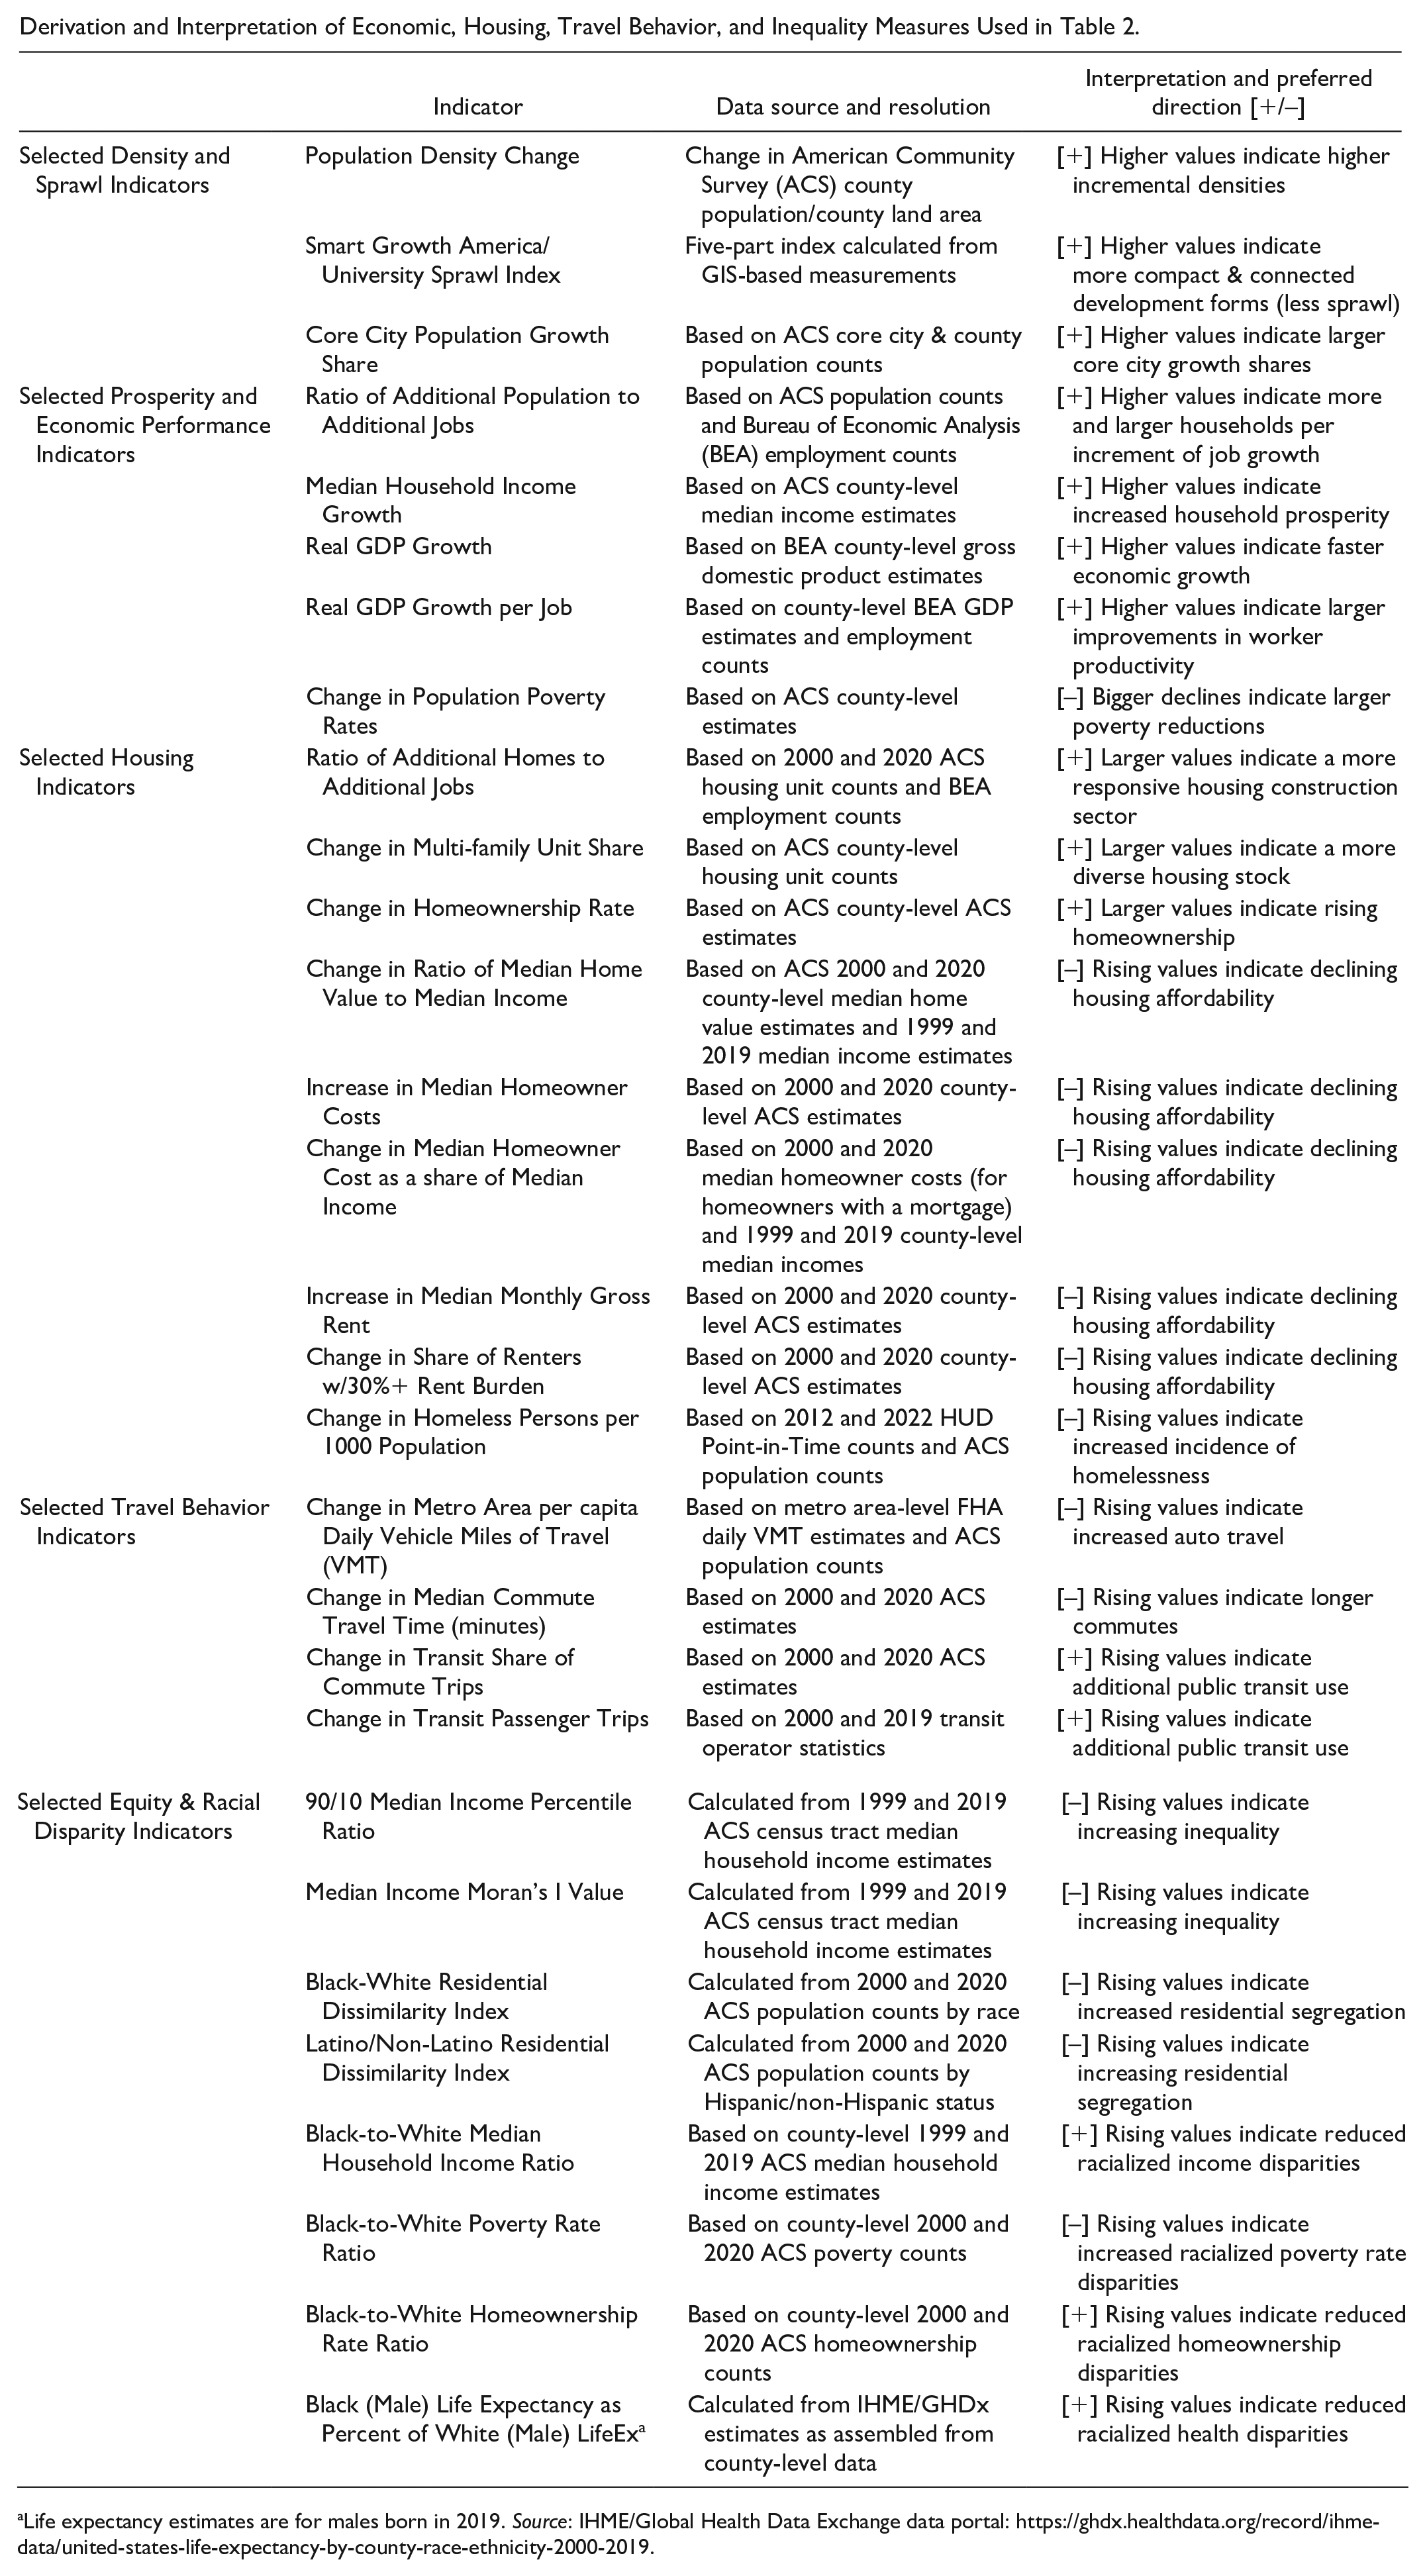
Derivation and Interpretation of Economic, Housing, Travel Behavior, and Inequality Measures Used in Table 2.
| Indicator | Data source and resolution | Interpretation and preferred direction [+/–] | |
|---|---|---|---|
| Selected Density and Sprawl Indicators | Population Density Change | Change in American Community Survey (ACS) county population/county land area | [+] Higher values indicate higher incremental densities |
| Smart Growth America/University Sprawl Index | Five-part index calculated from GIS-based measurements | [+] Higher values indicate more compact & connected development forms (less sprawl) | |
| Core City Population Growth Share | Based on ACS core city & county population counts | [+] Higher values indicate larger core city growth shares | |
| Selected Prosperity and Economic Performance Indicators | Ratio of Additional Population to Additional Jobs | Based on ACS population counts and Bureau of Economic Analysis (BEA) employment counts | [+] Higher values indicate more and larger households per increment of job growth |
| Median Household Income Growth | Based on ACS county-level median income estimates | [+] Higher values indicate increased household prosperity | |
| Real GDP Growth | Based on BEA county-level gross domestic product estimates | [+] Higher values indicate faster economic growth | |
| Real GDP Growth per Job | Based on county-level BEA GDP estimates and employment counts | [+] Higher values indicate larger improvements in worker productivity | |
| Change in Population Poverty Rates | Based on ACS county-level estimates | [–] Bigger declines indicate larger poverty reductions | |
| Selected Housing Indicators | Ratio of Additional Homes to Additional Jobs | Based on 2000 and 2020 ACS housing unit counts and BEA employment counts | [+] Larger values indicate a more responsive housing construction sector |
| Change in Multi-family Unit Share | Based on ACS county-level housing unit counts | [+] Larger values indicate a more diverse housing stock | |
| Change in Homeownership Rate | Based on ACS county-level ACS estimates | [+] Larger values indicate rising homeownership | |
| Change in Ratio of Median Home Value to Median Income | Based on ACS 2000 and 2020 county-level median home value estimates and 1999 and 2019 median income estimates | [–] Rising values indicate declining housing affordability | |
| Increase in Median Homeowner Costs | Based on 2000 and 2020 county-level ACS estimates | [–] Rising values indicate declining housing affordability | |
| Change in Median Homeowner Cost as a share of Median Income | Based on 2000 and 2020 median homeowner costs (for homeowners with a mortgage) and 1999 and 2019 county-level median incomes | [–] Rising values indicate declining housing affordability | |
| Increase in Median Monthly Gross Rent | Based on 2000 and 2020 county-level ACS estimates | [–] Rising values indicate declining housing affordability | |
| Change in Share of Renters w/30%+ Rent Burden | Based on 2000 and 2020 county-level ACS estimates | [–] Rising values indicate declining housing affordability | |
| Change in Homeless Persons per 1000 Population | Based on 2012 and 2022 HUD Point-in-Time counts and ACS population counts | [–] Rising values indicate increased incidence of homelessness | |
| Selected Travel Behavior Indicators | Change in Metro Area per capita Daily Vehicle Miles of Travel (VMT) | Based on metro area-level FHA daily VMT estimates and ACS population counts | [–] Rising values indicate increased auto travel |
| Change in Median Commute Travel Time (minutes) | Based on 2000 and 2020 ACS estimates | [–] Rising values indicate longer commutes | |
| Change in Transit Share of Commute Trips | Based on 2000 and 2020 ACS estimates | [+] Rising values indicate additional public transit use | |
| Change in Transit Passenger Trips | Based on 2000 and 2019 transit operator statistics | [+] Rising values indicate additional public transit use | |
| Selected Equity & Racial Disparity Indicators | 90/10 Median Income Percentile Ratio | Calculated from 1999 and 2019 ACS census tract median household income estimates | [–] Rising values indicate increasing inequality |
| Median Income Moran’s I Value | Calculated from 1999 and 2019 ACS census tract median household income estimates | [–] Rising values indicate increasing inequality | |
| Black-White Residential Dissimilarity Index | Calculated from 2000 and 2020 ACS population counts by race | [–] Rising values indicate increased residential segregation | |
| Latino/Non-Latino Residential Dissimilarity Index | Calculated from 2000 and 2020 ACS population counts by Hispanic/non-Hispanic status | [–] Rising values indicate increasing residential segregation | |
| Black-to-White Median Household Income Ratio | Based on county-level 1999 and 2019 ACS median household income estimates | [+] Rising values indicate reduced racialized income disparities | |
| Black-to-White Poverty Rate Ratio | Based on county-level 2000 and 2020 ACS poverty counts | [–] Rising values indicate increased racialized poverty rate disparities | |
| Black-to-White Homeownership Rate Ratio | Based on county-level 2000 and 2020 ACS homeownership counts | [+] Rising values indicate reduced racialized homeownership disparities | |
| Black (Male) Life Expectancy as Percent of White (Male) LifeEx a | Calculated from IHME/GHDx estimates as assembled from county-level data | [+] Rising values indicate reduced racialized health disparities |
Life expectancy estimates are for males born in 2019. Source: IHME/Global Health Data Exchange data portal: https://ghdx.healthdata.org/record/ihme-data/united-states-life-expectancy-by-county-race-ethnicity-2000-2019.
Declaration of Conflicting Interests
The author(s) declared no potential conflicts of interest with respect to the research, authorship, and/or publication of this article.
Funding
The author(s) received no financial support for the research, authorship, and/or publication of this article.