
Abstract
Urban flood resilience is a function of the collective intent of all planning efforts or network of plans. Yet, most studies focus on single plan types; it is unclear whether plans work cohesively. We asked to what extent do networks of plans uniformly foster resilience to flooding. We adapted plan quality evaluation methodology to evaluate four cities’ networks of plans. All four networks uniformly state goals, including flood resilience and sustainability goals, but exclude details on flood exposure and vulnerability. Moreover, all four networks lack implementation guidelines. We identify opportunities for more integrated planning to tackle flooding and climate change.
Introduction
Flooding is one of the costliest natural hazards (Davenport, Burke, and Diffenbaugh 2021). Flood-related monetary losses in coastal communities across the United States are projected to increase 26 percent by 2050, with unregulated development being four times more influential than climate change in rising costs (Wing et al. 2022). Proactive planning of current assets, future development, and community capacities in areas at risk of flooding is therefore pivotal to minimizing flood losses (Burby et al. 2000). Flood resilience benefits from planning processes that analyze and communicate risks and vulnerability to the public, understand public needs and values, and design and implement policies to protect and regulate development in current and future flood-prone areas (Burby et al. 2000; Godschalk et al. 2009). Flood resilience also demands that planning processes across sectors and scales support hazard mitigation goals (Berke et al. 2015; United Nations 2015, 17). This means that it is not just the hazard mitigation plan that needs to regulate development in flood-prone areas, so too does a neighborhood master plan or a city’s highway plan. Because development patterns are so critical in shaping flood risks, the reality is that all plans that guide development—what Berke and colleagues (2015) call the “network of plans”—affect a city’s flood resilience. Concurrence among the network of plans is needed to limit losses (Berke et al. 2021; Meerow et al. 2023).
Recent research shows that land use policies in citi-es’ networks of plans inconsistently address hazard risks (Berke et al. 2021; Woodruff et al. 2021). We know very little, however, about the extent to which flood risk and resilience are integrated into the planning process for each plan in the network. Plans are “signals” (Hopkins and Knaap 2018) of the planning process. This includes signals of a city’s long-term development goals, assessment of risks and vulnerability, stakeholders who assist with plan development, and the process for implementing policies. The network of plans can foster flood resilience by articulating flood resilience goals, communicating information on flood risks, and building relationships with vulnerable stakeholders (Burby et al. 2000; Masterson et al. 2014; Sharifi and Yamagata 2018). Integrating flood risk considerations into all planning efforts could also encourage collaboration across previously siloed planning departments (Berke et al. 2021; Malecha, Woodruff, and Berke 2021), help policy makers prioritize policies that provide multiple flood resilience benefits (Wamsler, Lu-ederitz, and Brink 2014), and further implementation (Mogelgaard et al. 2018). Planners have also reported the process of diagnosing inconsistencies across plans as beneficial and insightful (Berke et al. 2021; Guyadeen 2018; Rudolf and Grădinaru 2019).
Yet, these critical process signals in networks of plans have been underexamined. This study addresses this gap, asking two research questions. In the face of rising flood resilience issues:
We use plan quality evaluation (Berke and Godschalk 2009; Lyles and Stevens 2014) to measure the degree to which issues of flood resilience are integrated into the goals, information, participation, strategies, and implementation process reported in plans (Godschalk et al. 1999; Kim and Marcouiller 2018). A network of plans that uniformly fulfill these criteria is considered higher quality and reflect a concerted effort across different plan-making bodies to enhance flood resilience, which we believe is necessary, albeit a preliminary step, to achieve resilient outcomes (Godschalk et al. 1999; Guyadeen 2018).
The contribution of this study is twofold. First, the study is an early attempt to analyze the quality of networks of plans in the context of flood resilience. We merge two growing perspectives in planning research—plan quality evaluations and analysis of network of plans (Masterson et al. 2023; Woodruff et al. 2024). Plan quality evaluation has been used extensively to identify strengths and weaknesses of hazards-related plans, and occasionally comprehensive plans (Berke and Godschalk 2009; Lyles and Stevens 2014; Masterson et al. 2023), but rarely other types of plans that may also shape resilience. Moreover, to date, studies that do analyze the community’s full network of plans have focused exclusively on land-use policies in plans (Berke et al. 2015; Malecha, Woodruff, and Berke 2021). This research expands the analysis to the process of plan making as reported in plans and the degree to which the processes collectively address issues of flood resilience.
Second, we adapt existing plan quality evaluation metrics (Berke and Godschalk 2009; Lyles and Stevens 2014; Norton 2008; Woodruff et al. 2018) to develop a coding protocol for analyzing networks of plans. We apply it in four flood-prone cities in the United States that have been recognized as leaders in resilience and hazards planning: Boston, MA; Baltimore, MD; Fort Lauderdale, FL; and Seattle, WA (100 Resilient Cities 2019; Woodruff and Stults 2016). Our analysis helps to identify plan types and components that, even in leading cities, fail to address issues of flood resilience, providing practical suggestions for flood-prone communities across the United States. In doing so, we contribute to larger debates on how to best operationalize cross-sectoral and multi-scalar integration to effectively manage flooding, climate change, and the many other cross-cutting issues cities face (Berke et al. 2015; Uittenbroek, Janssen-Jansen, and Runhaar 2013).
Flood Resilience and Plans
Urban resilience is the ability of an urban system and all its constituent socio-ecological and socio-technical networks across temporal and spatial scales to maintain or rapidly return to desired functions in the face of a disturbance, to adapt to change, and to quickly transform systems that limit current or future adaptive capacity. (Meerow, Newell, and Stults 2016, 45)
Planning can improve urban resilience to flooding by designing policies that help the city’s socio-ecological and socio-technical systems continue to function, adapt, or recover rapidly in the face of flooding, for example, by reducing physical vulnerability (Burby et al. 2000; Davoudi and Porter 2012; Masterson et al. 2014).
City plans are important instruments that assist in fostering urban resilience (Davoudi and Porter 2012). Plans “signal” (Hopkins and Knaap 2018) the long-term vision agreed upon by a city’s decision-making bodies. By extension, plans also indicate whether the vision includes anticipating and avoiding disasters across temporal scales (Meerow, Newell, and Stults 2016; Sellberg, Wilkinson, and Peterson 2015). Most plans specify the information used in designing policies, the processes undertaken, and the people involved in the making of the plan. The quality of the plan-making process, that is, who participates and how they participate, what information on flood risks are gathered, and whether goals address flood risks are likely to shape policies and investments, which ultimately help shape who and what is resilient to flooding (Sharifi and Yamagata 2018).
Framing flood resilience as the integrated effort of socio-ecological and socio-technical networks expands the scope of planning from purely emergency management and hazard mitigation to a city’s network of plans (Berke et al. 2015). Cities prepare numerous plans to reflect the values of different socio-economic groups and address multiple urban issues (Hopkins and Knaap 2018). All plans may not intend to address flooding. But by guiding where, how, and when development and infrastructure investments occur, and who has a say in these decisions, different plans can foster or hinder resilience efforts (Berke et al. 2015; Burby et al. 2000; Kashem, Wilson, and Van Zandt 2016). Integrating flooding into the plan-making process can also avoid conflicts with flood resilience goals (Birchall and Bonnett 2021; Peters 2018). For example, an economic development plan that lacks detailed flood maps can inadvertently encourage new commercial development in hazardous areas. A network of plans approach argues that flood resilience needs to be the collective pursuit of the different types and scales of plans that affects how communities grow and build capacity. Likewise, scholars have called for the evaluation of different types and scales of plans and the extent to which their planning processes integrate flooding issues (Berke et al. 2021; Woodruff et al. 2018).
Plan Quality Evaluation and Flood Resilience
Plan quality evaluation is widely used to evaluate plan content against standard principles that are theorized to further goals like flood resilience (Berke and Godschalk 2009; Lyles and Stevens 2014; Norton 2008). While standards of quality vary slightly across different goals, plan types, and contexts, scholars generally agree that high-quality plans communicate community goals on important issues, incorporate citizen input into policy priorities, and outline a line of action to achieve goals (Berke and Godschalk 2009). Studies that specifically analyze flood recovery and resilience or climate change adaptation add that high-quality plans should include specific flood resilience goals, information, meaningfully engage vulnerable community stakeholders, and outline implementable pathways (Berke, Smith, and Lyles 2012; Godschalk et al. 1999; Kim and Marcouiller 2018; Woodruff et al. 2018). A growing number of studies and practitioners also argue that it is critical that all plans be aligned, or coordinated, when it comes to important issues like flood hazards in order to avoid contradictory goals and actions (Berke et al. 2021).
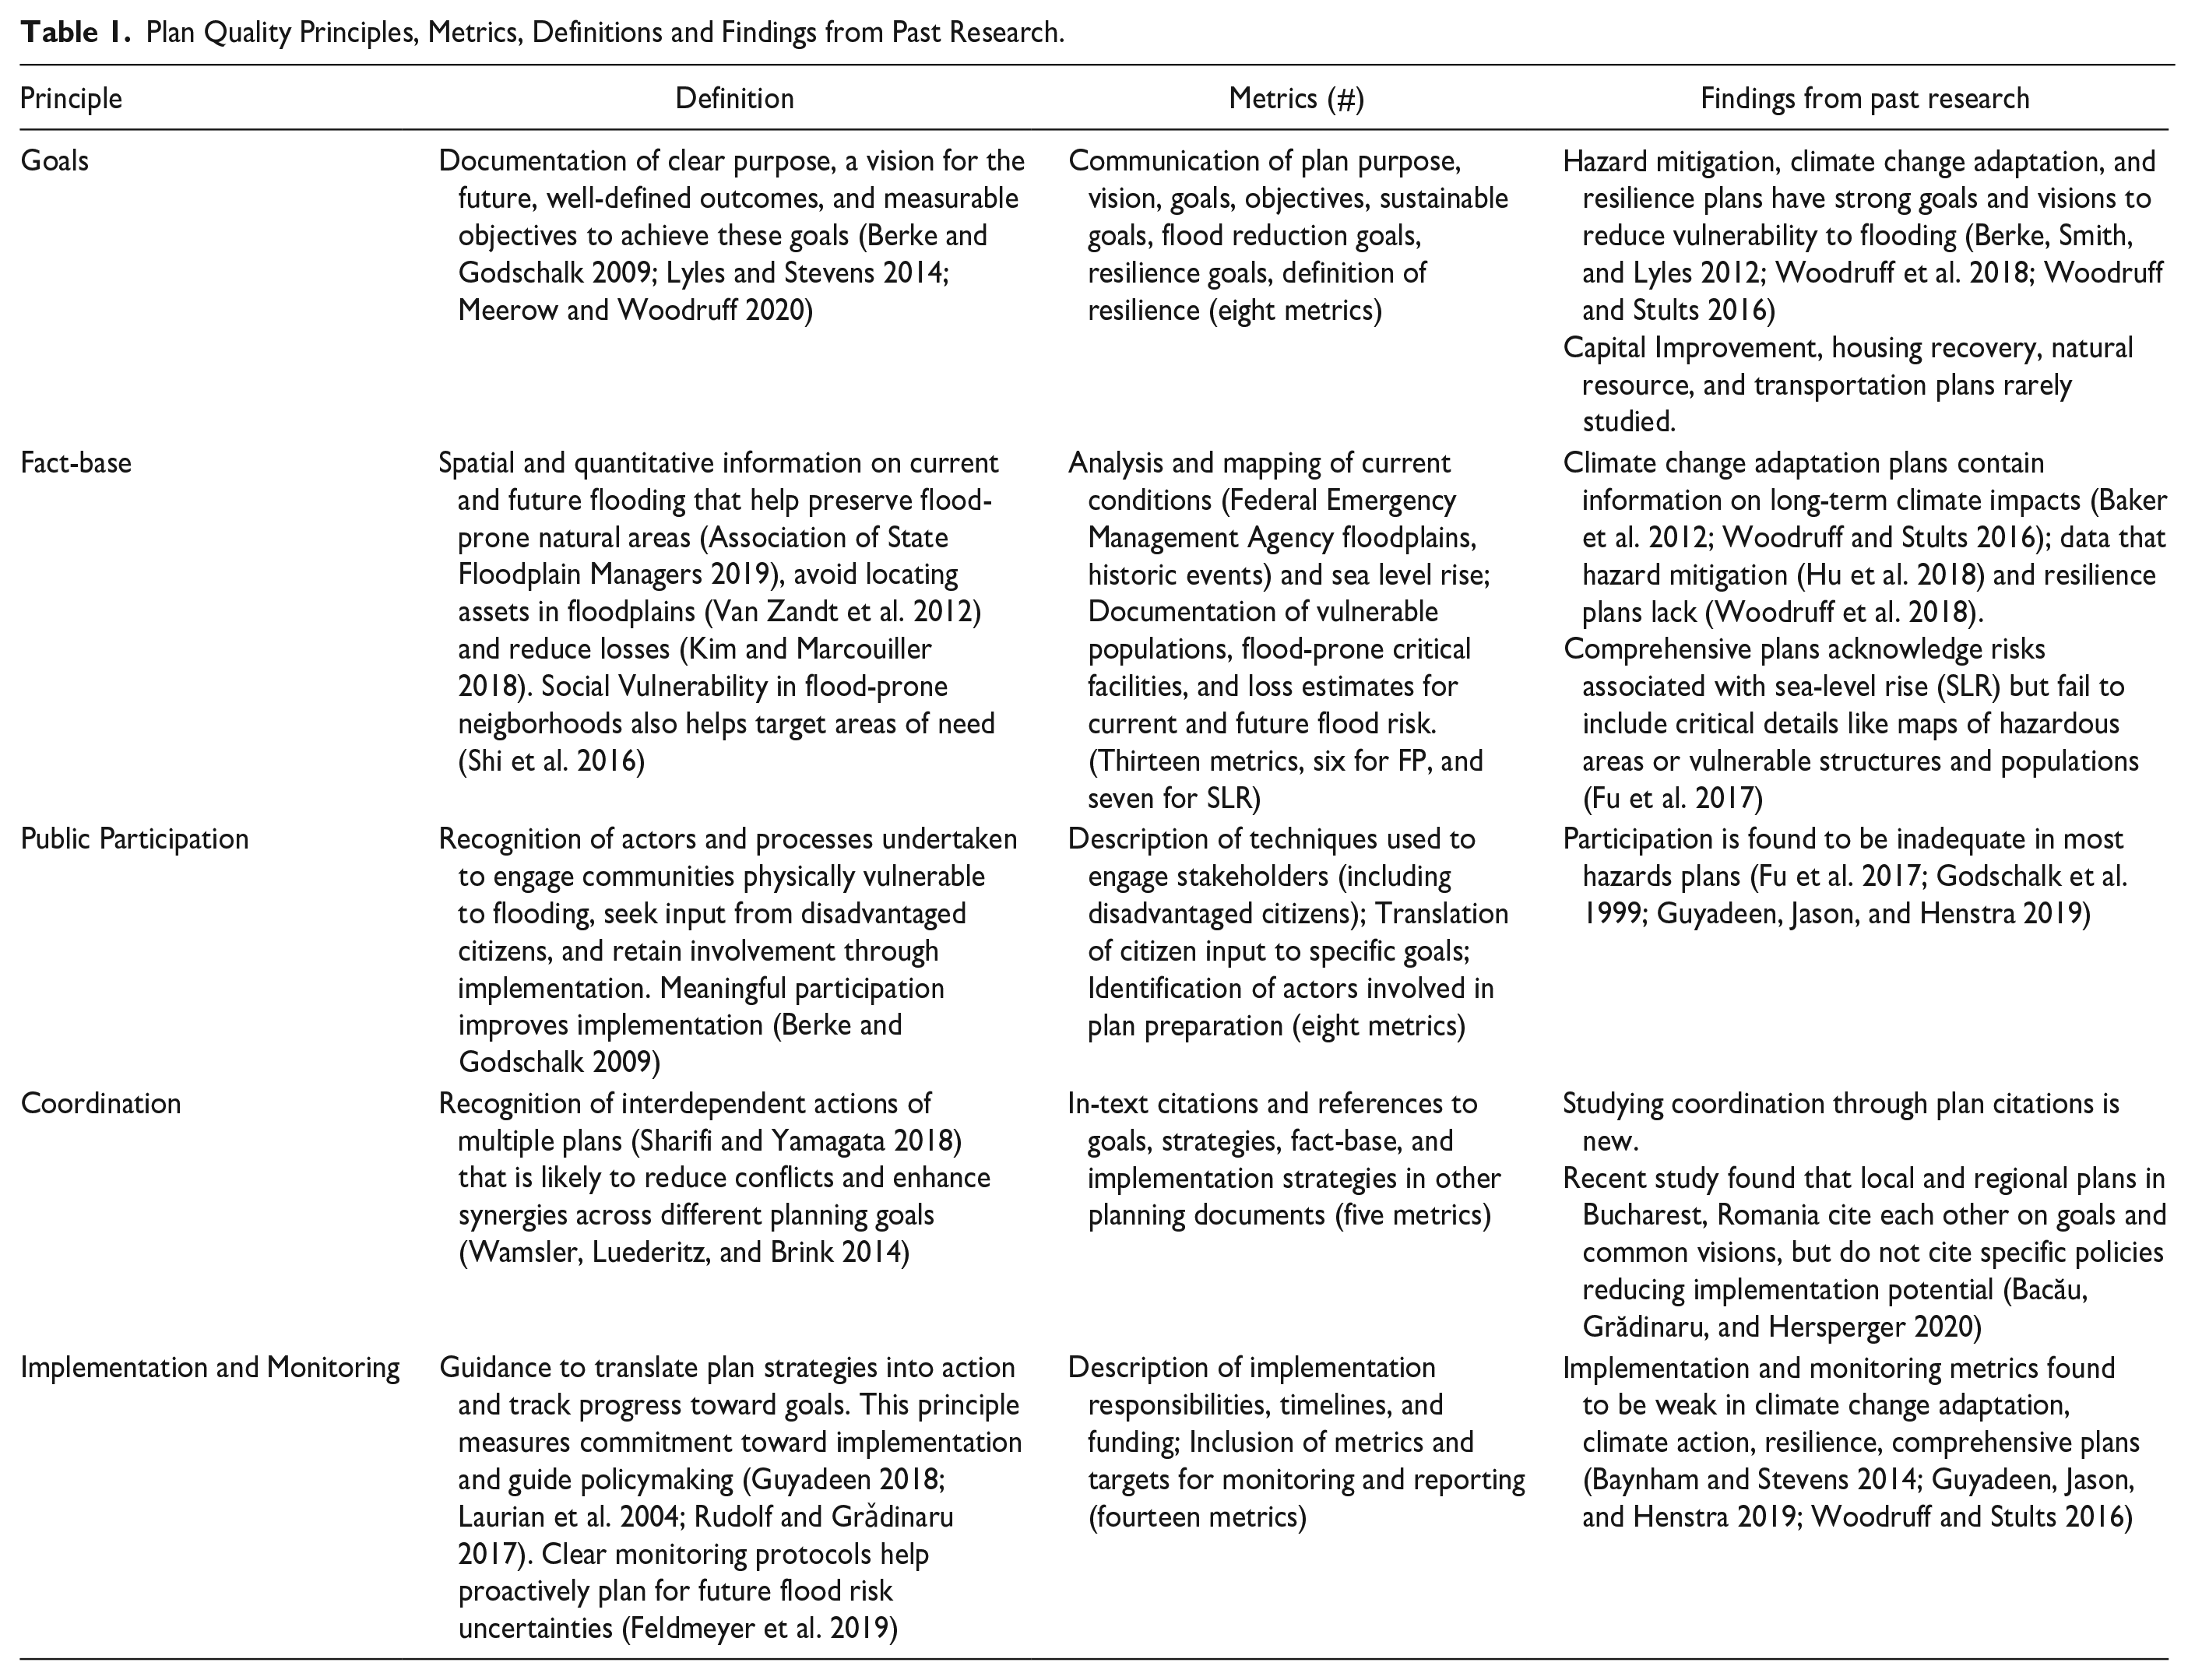
Berke and Godschalk (2009) emphasize five principles for flood resilience—goals, fact base on flood risks and vulnerability, public participation in the planning process, details concerning implementation and monitoring, and coordination. Clarity and detail on these aspects contribute to the overall quality of plans, which legitimizes the planning process, furthers implementation (Guyadeen 2018), and has been associated with lower disaster losses (Kim and Marcouiller 2018). Table 1 outline these principles, and summarizes findings from past studies of different plan types (e.g., hazard mitigation, recovery, comprehensive plans). Notably while scholars have used plan evaluation methods to assess different types of plans (comprehensive (Brody 2003; Fu et al. 2017), hazard mitigation (Horney et al. 2017; Hu et al. 2018; Kim and Marcouiller 2018), sustainability; Ericksen et al. 2017), adaptation (Baker et al. 2012; Woodruff and Stults 2016), and resilience (Woodruff et al. 2018), they have not compared quality across plan types and scales.
Plan Quality Principles, Metrics, Definitions and Findings from Past Research.
Studying Networks of Plans and Flooding
Expanding the scope of plan quality evaluation to network of plans offers two benefits—it can increase implementation potential and encourage cross-sectoral collaboration (Berke et al. 2021; Woodruff and Stults 2016). Single-plan studies have enabled the analysis of large samples of hazards plans and offer generalizable findings on the state of planning against floods (Table 1). Most of these single-plan studies agree that hazards plans tend to have policies that could effectively reduce risk, but they have weak implementation potential. While it is important to develop hazards plans that are more likely to be implemented, it is also important that other plans with more regulatory teeth that more directly steer development align with goals included in hazards plans (Berke et al. 2015; Burby et al. 2000; Kashem, Wilson, and Van Zandt 2016).
In response, scholars call for integrating flood resilience goals into plans that are directly tied to capital investments, namely comprehensive plans in most U.S. cities (Fu et al. 2017).
Building on early works by Berke and Kaiser (2006), recent literature on networks of plans argues that conflicts in how plans manage hazardous land are a barrier to resilience (Berke et al. 2015; Woodruff et al. 2021). Evaluating networks of plans provides an insight into coordination and interdependencies among different planning domains and sectors on flood risk management and helps tease out conflicts in planning directions and processes (Bacău, Grădinaru, and Hersperger 2020; Berke et al. 2021; Peters 2018). Network of plans also enables the study of planning decisions at multiple scales and the degree to which regional, city, and neighborhood plans consider flood risk.
In this study we evaluate four cities’ networks of plans to provide new evidence on the relative quality of different types and geographic scales of plans within a city’s network of plans and their role in fostering flood resilience. We identify opportunities to further flood resilience in the planning process. Our examination focuses on variations in the degree to which different (1) city networks, (2) plan types, and (3) plan scales incorporate and communicate flood resilience.
We acknowledge that this research design has its limitations in understanding resilience planning as conceptualized in Table 2. First, given the intensity of data collection, studying networks of plans limits the number of case cities one can study, and therefore how generalizable the results are. Second, plan quality evaluation focuses on the planning process and plan intent as reported in plans. Thus, a uniformly high-quality network of plans reflects a consolidated intent by a variety of formerly siloed plan-making bodies (Berke et al. 2021; Malecha, Woodruff, and Berke 2021) to collectively work toward goals like flood resilience. However, analyzing whether plan coordination manifests in resilient outcomes is beyond the scope of this study (Table 2).
Measuring Resilience in Urban Planning Systems.
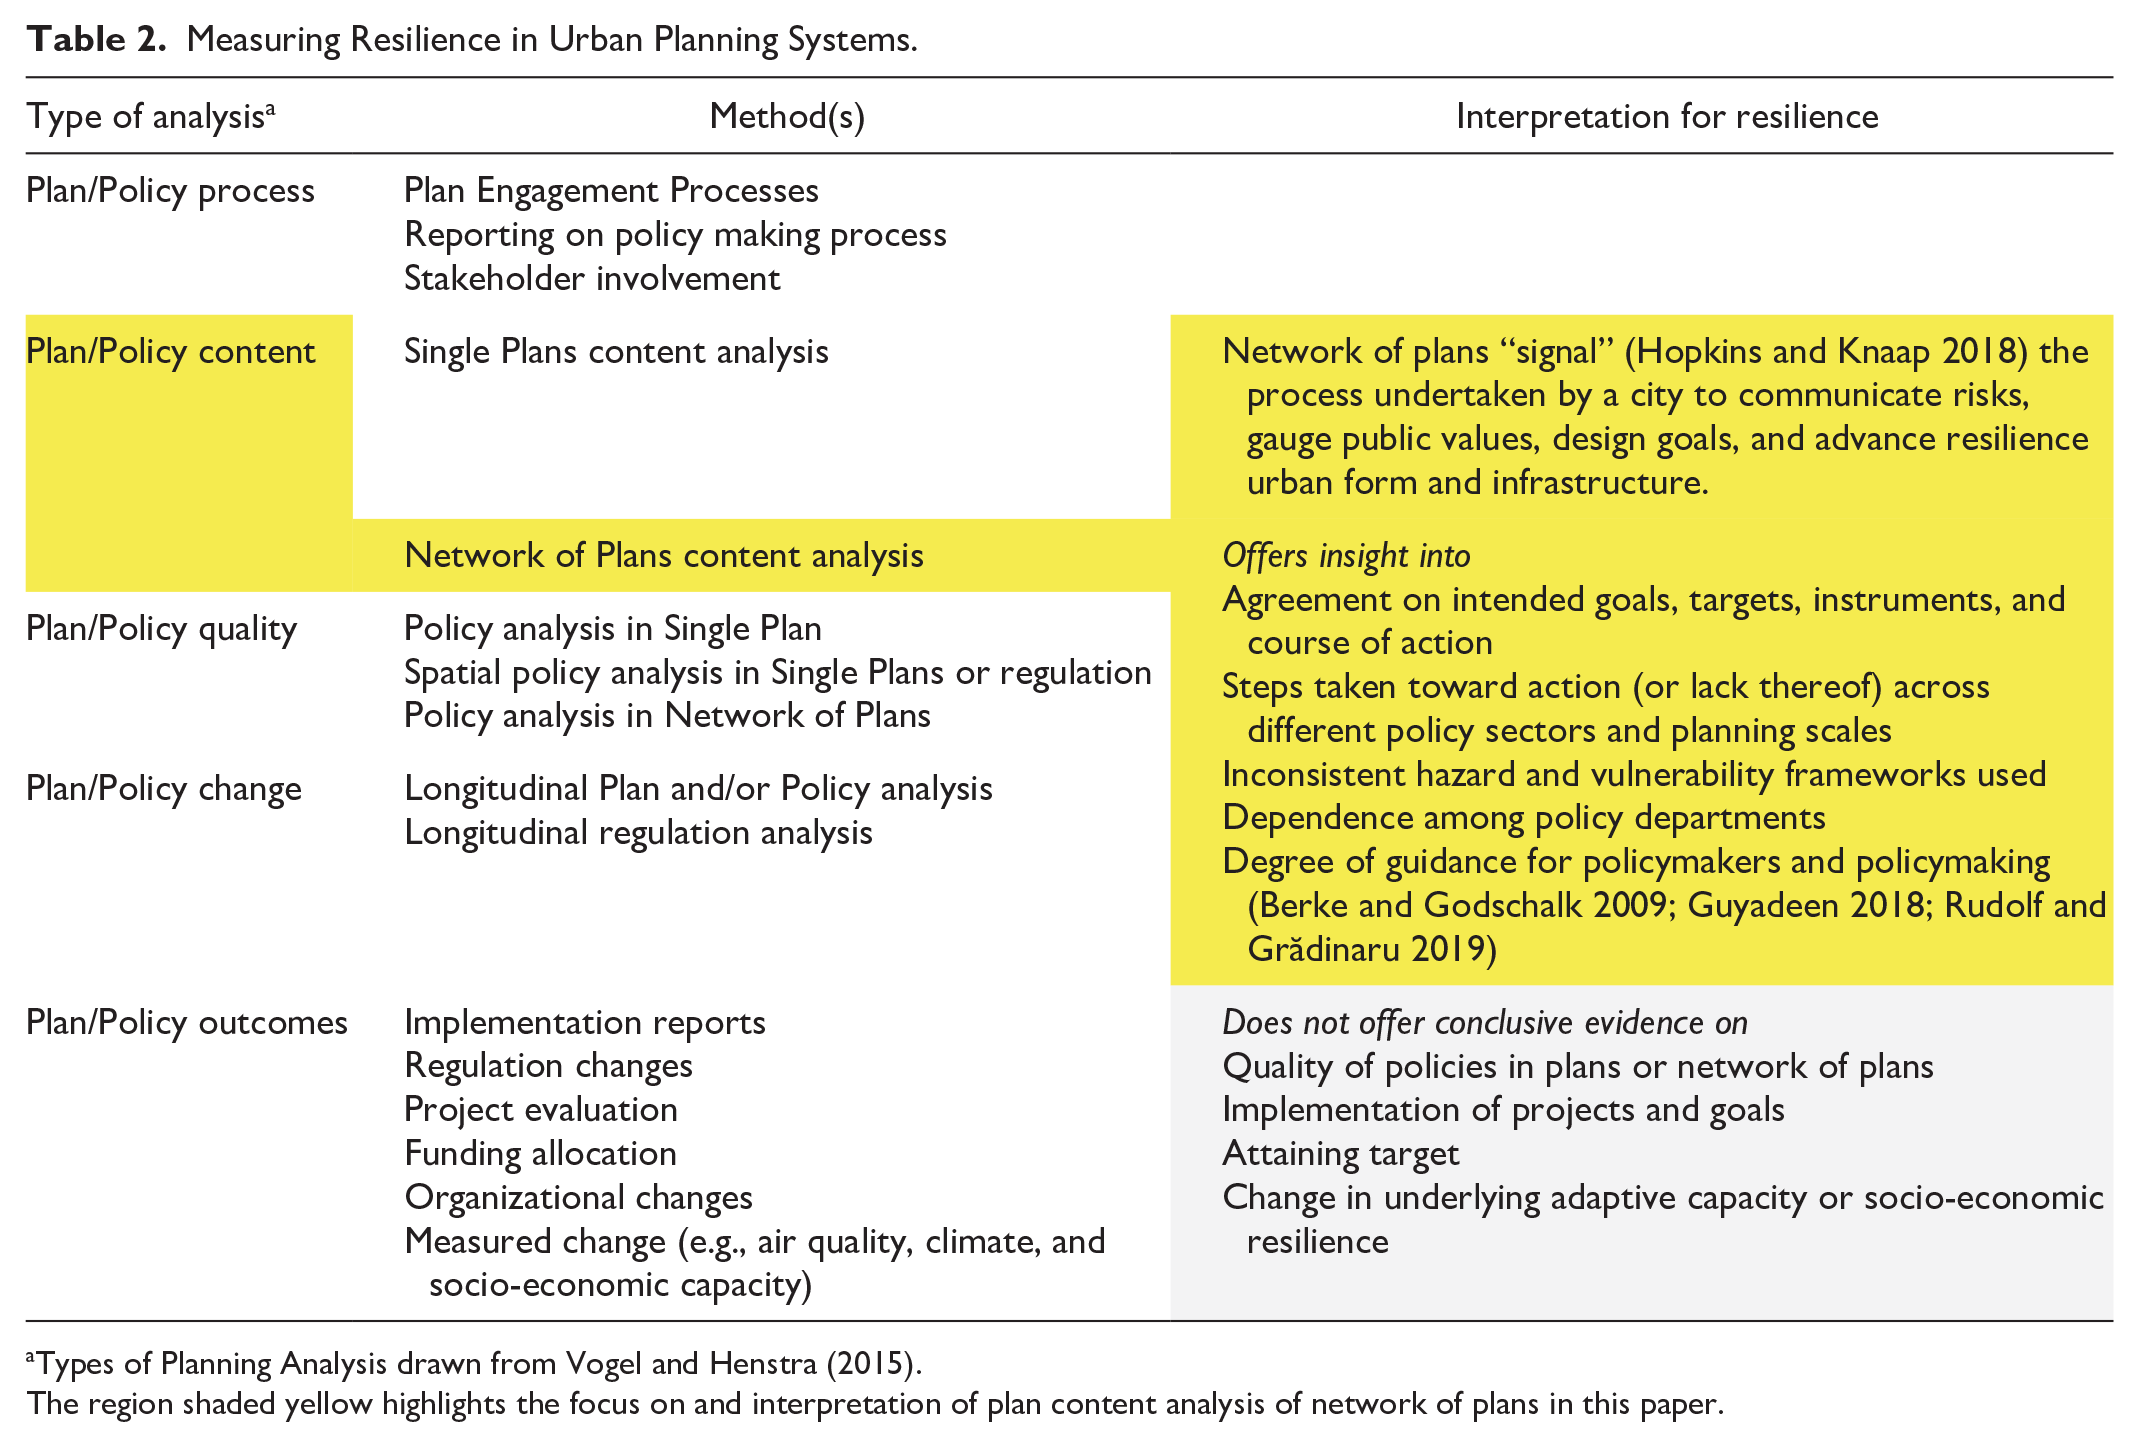
Types of Planning Analysis drawn from Vogel and Henstra (2015).
The region shaded yellow highlights the focus on and interpretation of plan content analysis of network of plans in this paper.
Adapting Plan Quality to Network of Plans
We build on well-established plan quality evaluation methods (Berke and Godschalk 2009; Lyles, Berke, and Smith 2014; Woodruff et al. 2018) to create a generalizable coding protocol for quantitatively assessing the quality of a network of plans for enhancing flood resilience. This protocol, which we term Plan Quality for Integrated Flood Resilience (PQIFR), includes forty-eight metrics corresponding to five plan quality principles: (1) goals, (2) fact base, (3) public participation in the planning process, (4) implementation and monitoring, and (5) coordination across plans (see Table 1). Supplementary Table 2 enlists all forty-eight metrics and their sources.
We systematically read plans and assessed the presence/absence of metrics, which converts text into a quantitative measurement of plan quality, facilitating comparisons between plans and statistical analyses.
Goals and fact base are direction-setting principles and consistently included in most plan quality evaluation studies (Berke and Godschalk 2009; Lyles, Berke, and Smith 2014). While every plan should include these principles, they will look different across planning domains and plan types. Given the range of types of plans, PQIFR includes metrics that focus specifically on flooding and are flexible enough to be applied across domains. For example, PQIFR includes metrics “flood reduction goals” likely to be included in hazards-plan, as well as “resilience goals” and “sustainability goals” likely to be included in natural resources or comprehensive plans. Similarly, to examine how cities are planning for current and future flood risks, we divide the fact base principle into metrics related to exposure and vulnerability to current annual 1 percent chance flooding (or 100-year floodplains) (FP) and 2100 SLR projections and discuss the two separately. We excluded metrics that are specific to certain planning domains. For example, evaluations of climate change plans include a “climate change uncertainty” metric (Woodruff and Stults 2016), which we excluded. We posit that to advance flood resilience every plan should include flood reduction goals and fact base.
Public participation, coordination, and implementation and monitoring (henceforth shortened to implementation) do not differ significantly between plan types. Whether a transportation or adaptation plan is being evaluated, the plan should provide a description of how the public was engaged in the planning process (public participation), how the plan relates to other planning efforts (coordination), and how the plan will be implemented and monitored. PQIFR uses these metrics from Woodruff et al. (2018) and Lyles, Berke, and Smith (2014).
Case Study Cities
This study focuses on Boston, Massachusetts; Baltimore, Maryland; Fort Lauderdale, Florida and Seattle, Washington. The four coastal cities are prone to flooding and SLR (Federal Emergency Management Agency [FEMA] 2015; Sweet et al. 2017), although to varying degrees. Fort Lauderdale 1 has a larger percentage area in 100-year floodplain (50% area) compared with Boston, 2 Baltimore, 3 and Seattle 4 (1% area). Although, the percentage areas in Boston, Baltimore, and Seattle likely to flood area are projected to increase by 2100 (see Notes 1–4). These differences in flood risks are likely to affect how attention to flooding compares across the four cities as well as between current and future flood risks. All four cities are key economic, social, and cultural centers. Multiple agencies at different scales, within and outside government, have created plans to drive growth in each city. Thus, to foster flood resilience, planning decisions must negotiate trade-offs between sustaining growth and mitigating flood risk. One important step in this direction is to integrate flood risk in the planning process of different types and scales of plans that guide growth.
All four cities have predominantly 5 been lauded for their resilience efforts. (100 Resilient Cities 2019; Woodruff and Stults 2016) and recognize the critical need to integrate flood risks across different planning efforts through their resilience and sustainability efforts (Baltimore City Department of Planning 2017; City of Fort Lauderdale 2018; 100 Resilient Cities and City of Seattle 2019, 85; Resilient Cities Network, n.d.). Stated intent in each city provides an opportunity to examine whether flood resilience has indeed been integrated across different types and scales of plans. We expect that any common areas of weakness in these cities’ networks of plans are very likely to apply to other communities that are less proactive in resilience planning.
Identifying the Network of Plans
For each city, we collected all publicly available plans that could potentially affect land use decisions in flood-prone areas. The sample includes plans that aim to reduce flood vulnerability like hazard mitigation and climate change adaptation plans. We also included comprehensive, small area, parks and recreation, infrastructure, and capital improvement plans that do not focus on flooding but affect vulnerability to floods by guiding land use and public investments. We included plans adopted or updated in the last ten years. The sample of plans was approved by city contacts.
To better understand how different types of plans address flooding, we divided plans into four categories: comprehensive, environmental, hazard, and infrastructure. The categories were adapted from the American Planning Association’s (n.d.) Planning Specializations.
Coding and Reconciling
Following standard content analysis procedures outlined by Stevens, Lyles, and Berke (2014), each plan was read and independently coded by two researchers. Coders determined whether all forty-eight metrics were reflected in the plan documents (e.g., Did the plan map the FP?). If a plan contained the specific metric, the plan was scored 1. Otherwise, it was scored 0. Coders then compared scores and identified disagreements. Each disagreement was discussed and reconciled, with the full research team mediating as needed. To ensure reliability, we calculated percentage agreement and Krippendorff’s alpha for each plan (Stevens, Lyles, and Berke 2014). Across all seventy-nine plans, coders had an average percentage agreement of 83 percent (range: 67.1 to 97.8%). This is higher than the recommended percentage agreement of 80 percent for plan quality analysis (Berke and Godschalk 2009). Our Krippendorff’s alpha for plans ranged from 0.14 to 0.95 (see Supplementary Table 1). The Krippendorff’s alpha scores for each metric ranged from 0.24 to 1 (see Supplementary Table 2). Given our focus on the network of plans, we retained all plans regardless of inter-coder reliability scores.
Analyzing Plan Quality Scores
To compare quality of plans within networks of plans, we first compare principle scores or the proportion of metrics that a plan includes for each principle (Godschalk et al. 1999). For example, if Fort Lauderdale’s Parks Plan includes ten out of thirteen (score = 0.76) fact base metrics while the Seawall Plan includes all thirteen (score=1), we would interpret the Seawall Plan as having a stronger fact base. Plans with relatively higher principle scores across the five principles are considered high-quality plans that will likely advance flood resilience. Second, we average scores by city to compare overall network plan quality between the four cities. Finally, we also averaged scores for plan type and scale.
To understand specific strengths and weaknesses within principles, we also report the percentage of plans in a city that addressed a specific metric. This helps identify metrics that are uniformly included or excluded.
Findings
Plan Quality Across Cities’ Networks of Plans
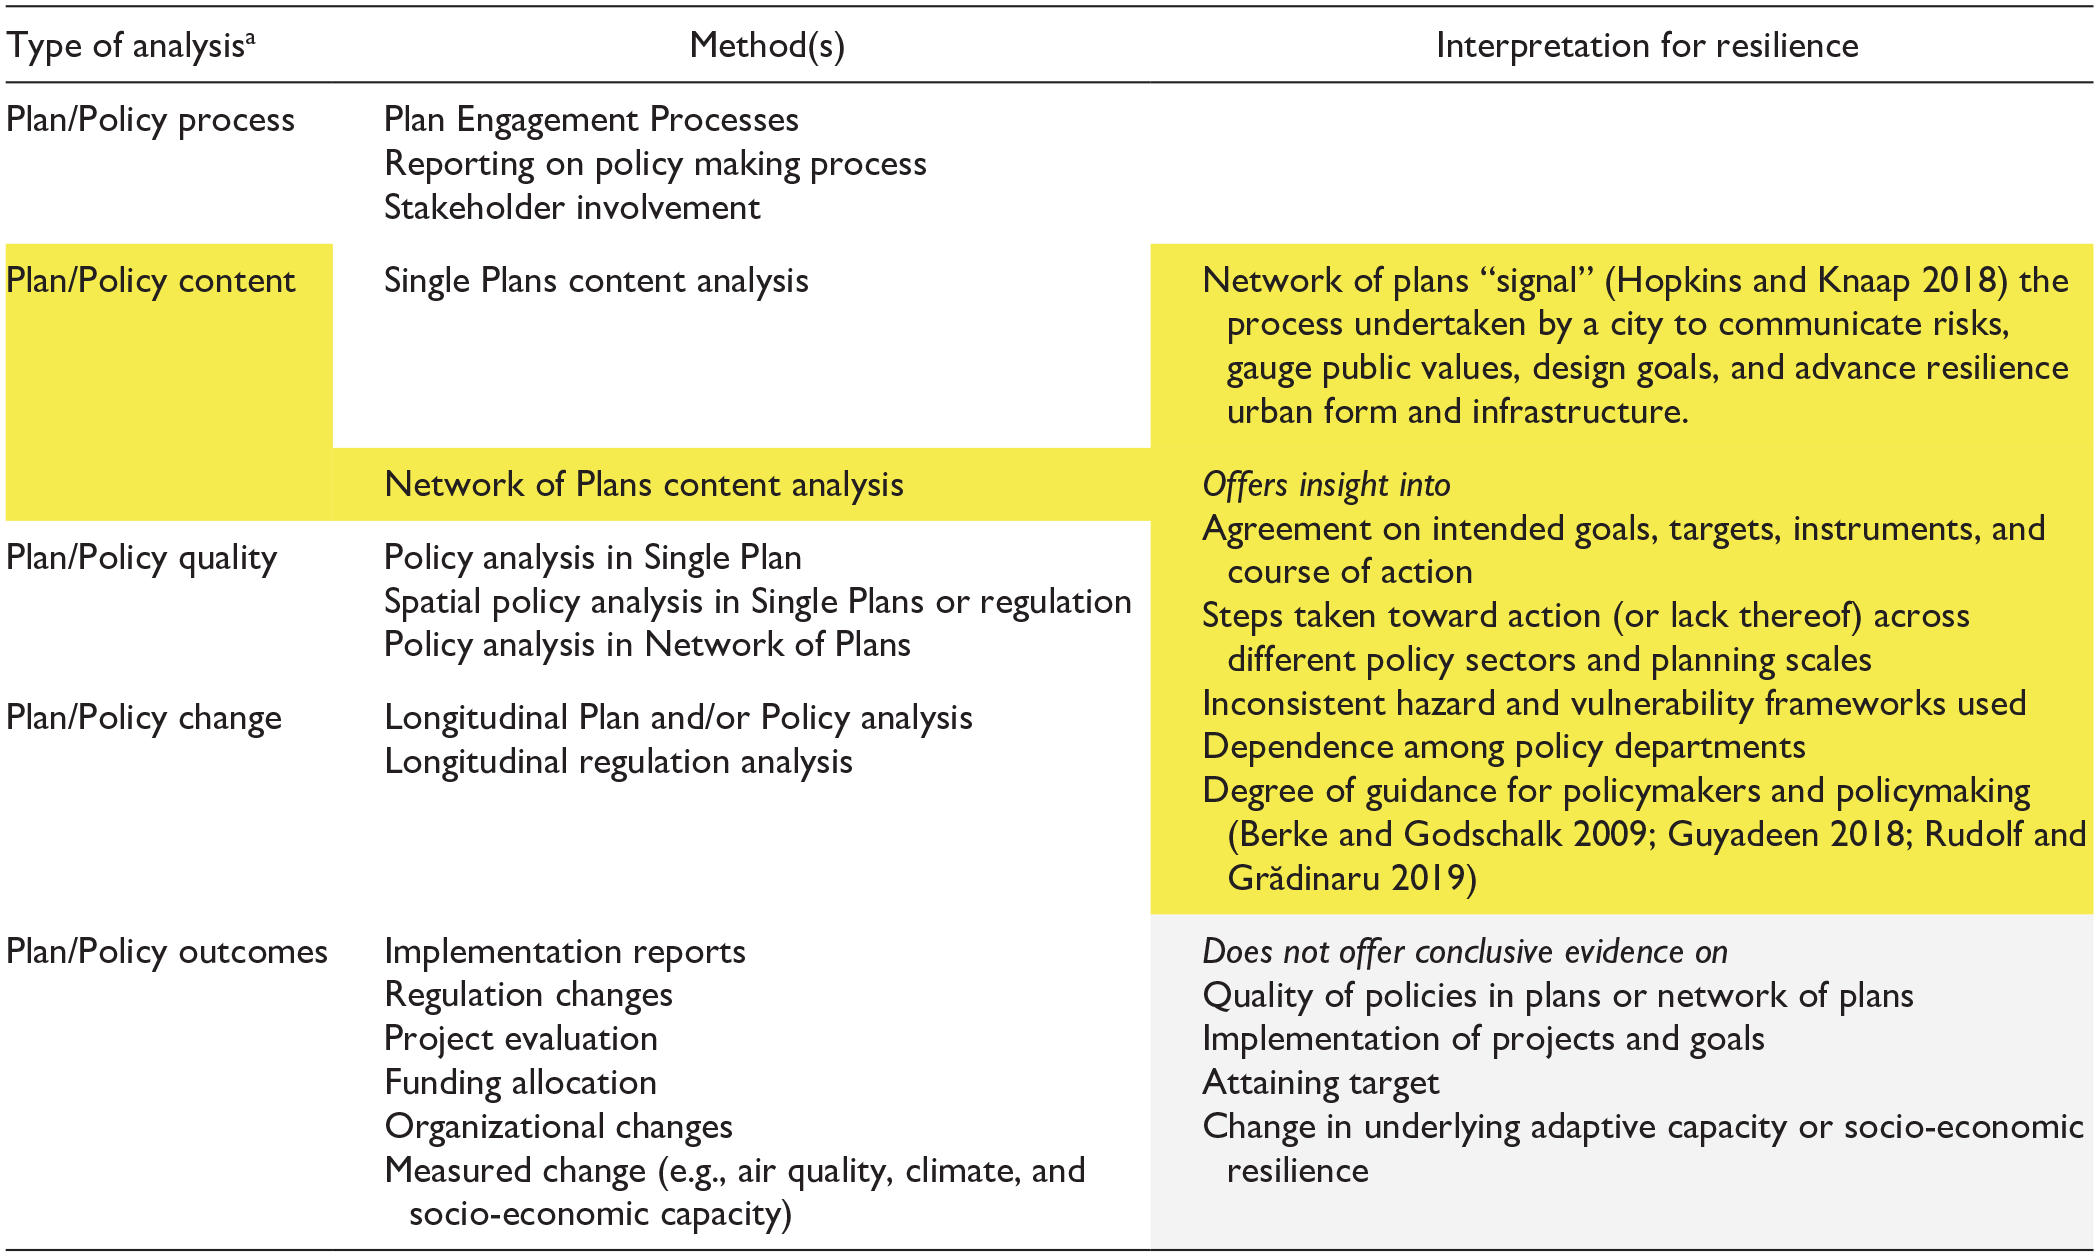
Across the four cities’ networks of plans, Boston has the highest average principle score (average = 0.538; max = 0.75; min = 0.292) closely followed by Seattle (average = 0.485; max = 0.75; min = 0.27) and Fort Lauderdale (average = 0.42; max = 0.79; min = 0.19). Baltimore has the lowest average principle score (average = 0.385). Figure 1 shows the range and median principle scores in each city and identifies the plans with highest and lowest scores for each principle. For more detail on each metric, and a comparison of scores across the four cities’ networks of plans please refer to Table 3 in Supplementary Materials.
Distribution of PQIFR scores in four cities’ networks of plans: The six box-whiskers represent the principles. (A) Boston (n = 17). (B) Fort Lauderdale (n = 17). (C) Seattle (n = 17). (D) Baltimore (n = 28).
In all four cities’ networks of plans,
Cities place different emphasis on current flooding and future SLR. We expected that plans would include more information related to current flooding, but Boston, Fort Lauderdale, and Seattle score higher on SLR. Higher fact base on long-term flood risk contradicts past research on network of plans where policies prioritized short-time flood risks (Malecha, Woodruff, and Berke 2021; Woodruff et al. 2021). This suggests that while Boston, Fort Lauderdale, and Seattle have incorporated long-term flood risks into the information base of plans, policies and action items are yet to reflect the same information.
All four cities have relatively high scores on the goals principle (Figure 1). Most plans include fundamental goal-setting components such as plan purpose, vision statement, goals, and objectives. A smaller proportion of plans contain visions or goals that are specific to flood reduction, sustainability, and resilience.
Among plans that do define resilience, they operationalize resilience differently. For example, Boston’s Hazard Mitigation Plan focuses on physical resilience “by protecting and enhancing natural resources” (City of Boston 2014, 91). A different set of plans including Imagine Boston 2030 follow Boston Resilience Strategy’s definition of resilience: “the capacity of individuals, communities, institutions, businesses, and systems within a city to survive, adapt, and thrive.” (Mayor’s Office of Resilience & Racial Equity 2016, 9). This definition alludes to not just surviving physical disturbances but learning from them and addressing underlying socio-political barriers (Meerow and Newell 2019). Multiple definitions are not necessarily counterproductive to resilience outcomes, and may reflect the term functioning as a “boundary object” (Meerow, Newell, and Stults 2016). However, the absence of flooding and resilience goals and scarcity of definitions suggests a need to further integrate flood resilience across the network of plans. Baltimore stands out with only 14 percent of plans containing resilien-ce goals, and even fewer (7%) actually defining resilience. Sustainability is a much more commonly used frame in Baltimore, with 43 percent of plans having sustainability goals. This may reflect Baltimore not being a member of 100 Resilient Cities and the prominent role of the sustainability department in city planning.
All cities are
Finally, the
Figure 1 also highlights variation in principle scores among plans. All four cities have plans that include every metric for a principle and plans that include none. Baltimore has the largest range in overall flood resilience plan quality, with aggregate principle scores ranging from 0.13 to 0.94. The Baltimore Disaster Preparedness and Planning Project 2018 (Hazard Mitigation Plan in Figure 1D) has the highest aggregate score in the study of 0.94, indicating it advances flood resilience in every principle. However, very few plans consistently score high in all principles. This demands the question, are there patterns in these inconsistencies? In the following sections, we further explore how plan quality scores vary by plan type and scale.
Plan Quality by Plan Type and Plan Scale
Figure 2 shows average principle scores by plan type (2a) and scale (2b). Of the four plan types, hazard plans have the highest average principle scores on goals (0.74), fact base (0.76), implementation (0.70), and coordination (0.84). Given their primary focus on flooding and other disturbances, hazard mitigation and adaptation plans most consistently advance flood resilience compared with other plan categories.
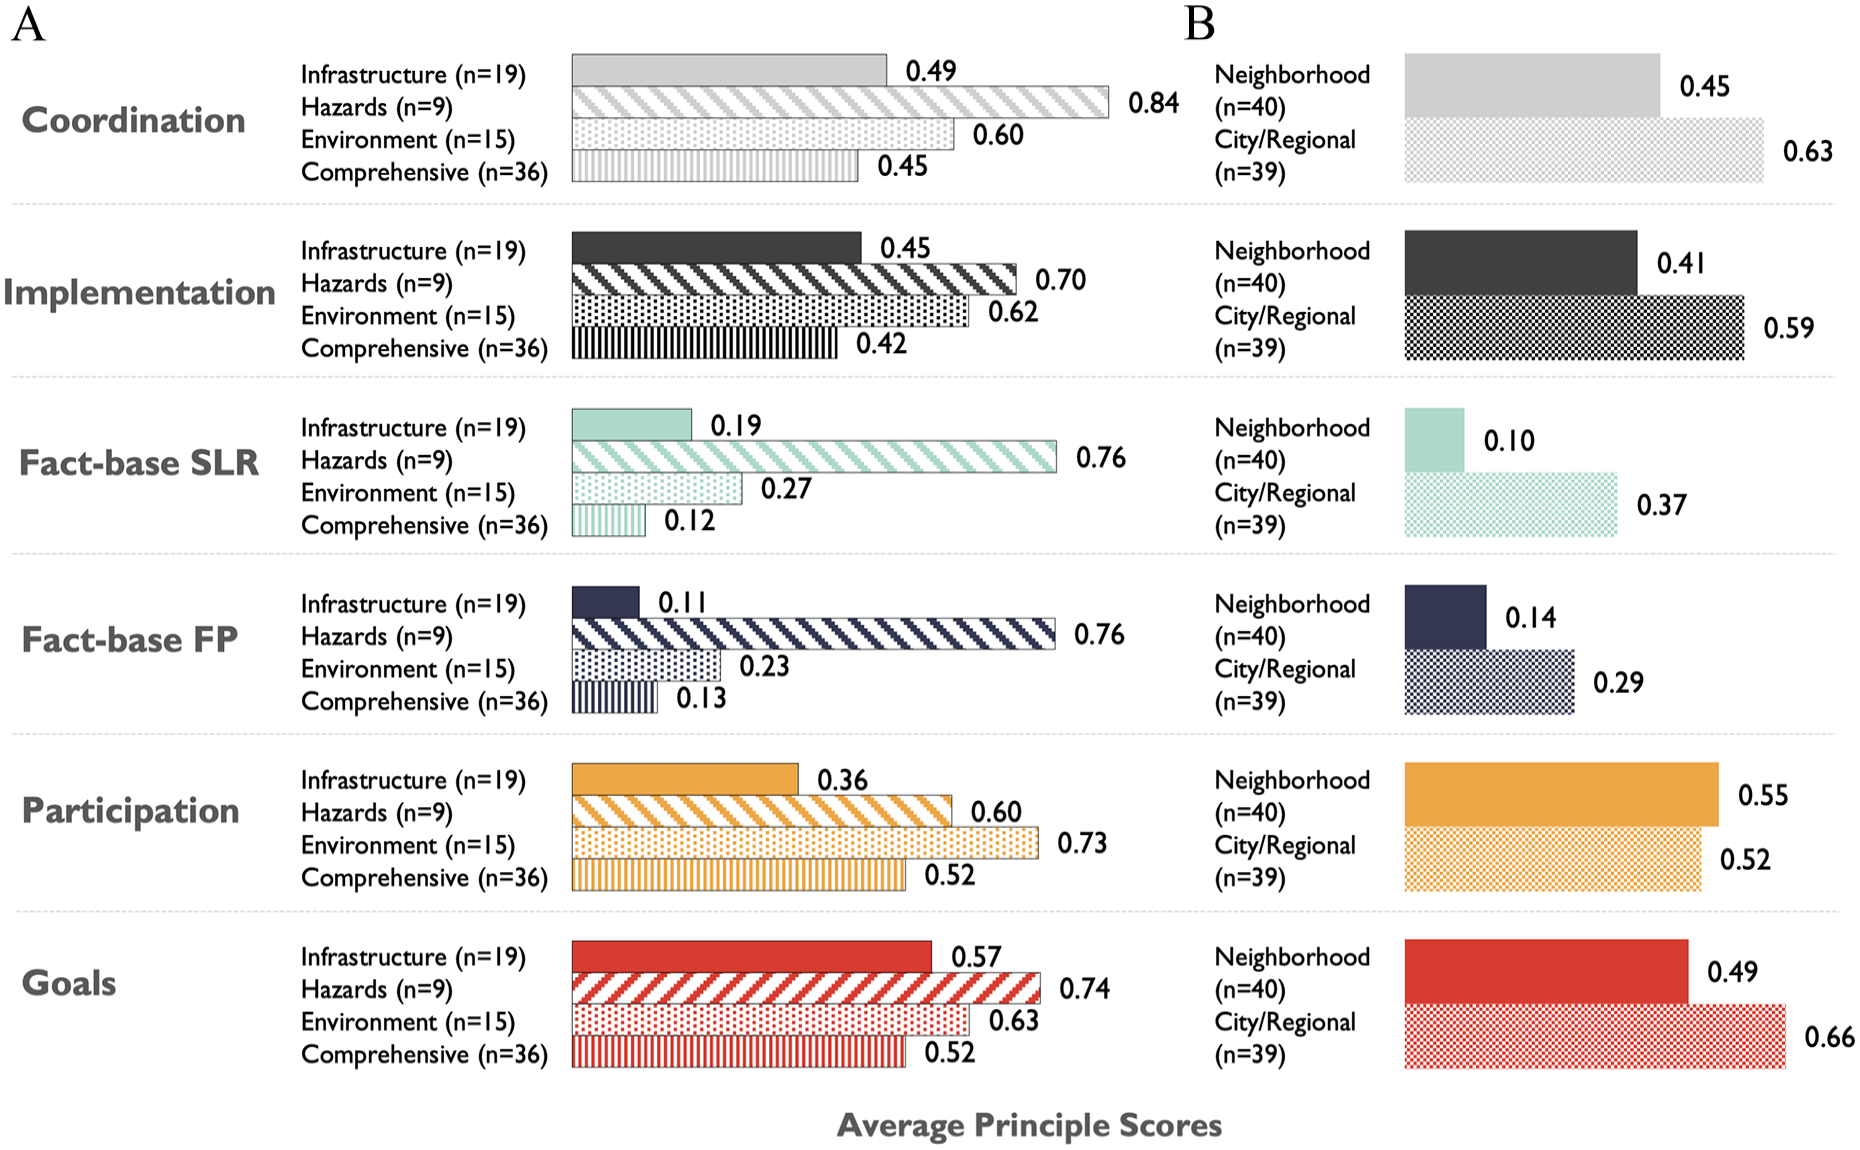
Quality of types of plans: Each box compares average principle scores (average proportion of metrics within each principle plan type/scale contains) by types of plans (A) and scale of plan (B).
To successfully foster resilience, however, flood risks must be considered in planning efforts that are not explicitly about flooding. In our four case study cities—all leaders in resilience planning—we see little evidence of this integration. While all plan categories score relatively well on generic goals metrics, focusing on metrics related to flooding reveals meaningful differences across plan categories. The vast majority (89%) of hazard plans have a vision or goal focused on flood reduction. In comparison, only 33% of comprehensive plans, 27% of environmental plans, and 32% of infrastructure plans have flood reduction visions or goals.
The framing used to reduce flood vulnerability varies by plan type. Every hazard plan includes resilience visions or goals, while 40 percent or less of plans in other categories use the term “resilience” in their visions or goals. There are also stark differences in defining resilience, 44 percent of hazard plans define resilience compared with 6 percent of comprehensive, 7 percent of environmental, and 5 percent of infrastructure plans. Sustainability is a much more prevalent framing in nonhazard plans. Only 33 percent of hazard plans include “sustainability” vision or goal, but 46 percent of comprehensive, 80 percent of environmental, and 45 percent of infrastructure plans do. This suggests that while “resilience” has become a key concept in hazard mitigation and climate change adaptation it has not been widely adopted in other sectors.
The most troubling finding is the large difference in fact base scores between hazard and other plan categories. On average, hazard plans have principle score of 0.76 on the FP and SLR fact base. Comprehensive (FP: 0.14, SLR: 0.12), environmental (FP: 0.23, SLR: 0.27), and infrastructure plans (FP: 0.10, SLR: 0.18) are much weaker. These types of plans rarely include flood loss estimates, critical facilities, and socially vulnerable populations. Incorporating flood loss estimates can provide convincing arguments for proactive resilience investments and help direct services and infrastructure to areas of greatest risk. Similarly, knowledge of social vulnerability can help develop planning processes that target areas of greatest need and builds adaptive capacity (Kashem, Wilson, and Van Zandt 2016).
Hazard plans also have high coordination scores (0.84). Every hazard plan supports its goals (1.0), fact base (1.0), and strategies (1.0) with references to other plans. This suggests that hazards plans are trying to build legitimacy and connect with existing city efforts. Comprehensive and infrastructure plans have the lowest scores on coordination (Comprehensive: 0.45; Infrastructure: 0.49).
Environmental plans have the highest average participation score (0.73), followed by hazards (0.60), comprehensive (0.53), and infrastructure plans (0.36). Given that hazard mitigation planning has been critiqued for being policy without a public (Godschalk et al. 1999; Horney et al. 2017), it is notable that the hazard plan category scores relatively high. The resilience frame and new types of hazards planning (e.g., resilience and climate change adaptation plans) may be better at engaging the public than traditional hazard mitigation plans. Even hazard plans have room to improve. Only 22 percent of hazard plans discuss how they engaged marginalized stakeholders and will maintain public participation, consistent with arguments posed by Kashem, Wilson, and Van Zandt (2016) and Shi et al. (2016). Infrastructure plans are particularly poor on this principle, they rarely discuss how the public was engaged in the planning process (15%), how public feedback contributed to the plan (15%), how they engaged marginalized stakeholders (5%), or how they will maintain public participation (15%).
Finally, city plans have higher average principle scores than neighborhood plans in goals, fact base, implementation, and coordination (Figure 2B). Far fewer neighborhood plans include resilience goals and visions (20%) and flood reduction goals (23%) compared with city plans (resilience goals: 69%, flood goals: 54%). Neighborhood plans also consistently have less detailed fact base metrics. For example, climate change and SLR are acknowledged in 79 and 74 percent of city plans respectively. Comparatively, only 28 percent neighborhood plans recognize climate change, and 18 percent plans recognize SLR. Few city plans contain past flooding data (36%), flood maps (26%), loss estimates (13%), or vulnerable populations (21%), but even fewer neighborhood plans contain these components. Gaps in fact base and goals can underpin inconsistent strategy support for hazard mitigation as found by Malecha, Woodruff, and Berke (2021). While one might dismiss these gaps to lower access to resources and information, neighborhood plans are important planning tools to integrate community values into city and regional planning goals and conversely disseminate broader planning resources into the neighborhoods. Thus, identifying these gaps is critical.
Discussion and Recommendations
A network of plans lens can help to assess flood resilience planning by looking beyond individual hazards plans and examining how flooding is addressed in all plans and plan-making processes that affect vulnerability to current and future flooding (Berke et al. 2015; Woodruff et al. 2024). Our plan quality evaluation of network of plans extends existing work that focuses on policy integration across network of plans (Berke et al. 2021; Malecha, Woodruff, and Berke 2021), to consider how different procedural elements in cities’ networks of plans consider flooding issues.
We find consistent patterns in strengths and opportunities across the four cities’ networks of plans. Most plans in all four cities do a good job of reporting plan purpose, goals, visions, and stating clear strategies. Many plans also coordinate with other plans on goals and strategies. This indicates that overall, plans in the four cities seek to function as a network as envisioned by their respective resilience and sustainability departments. However, networks of plans lack uniformity in flooding fact base, participation, and implementation guidelines. City plans and hazards plans appear better equipped to address flooding compared with other plans in the network. In the interest of advancing flood resilience planning, we focus more on these common opportunities across the cities. Given that our selected cities are leaders in resilience planning, we would expect these recommendations to be applicable to many flood-prone cities where resilience is shaped by networks of plans.
First, a lack of implementation and monitoring components appears to be a broad problem for planning, beyond just hazards plans previously studied by Guyadeen, Jason, and Henstra (2019), Baynham and Stevens (2014), Woodruff and Stults (2016) and Woodruff et al. (2018). Transparently reporting how policies will be implemented, monitored, and funded could help execute policies (Guyadeen 2018). Clear policy targets and monitoring guidelines help evaluate effectiveness of policies and improve future planning (Feldmeyer et al. 2019; Meerow and Woodruff 2020). Yet, they are included in only 20 percent of plans. Future research should examine drivers for implementation and monitoring in plans. What enabled the 20 percent plans, primarily city-scale hazards, and environment plans, to outline clear monitoring metrics. In the past, communities have perceived flood risk projection uncertainties and the nontangible long-term nature of benefits associated with strategies as barriers to action (Brink and Wamsler 2018; Few, Brown, and Tompkins 2007). Do the same barriers apply to organizations preparing plans?
Plans that do include implementation and monitoring components vary considerably in their approaches. A handful of plans, like the Seattle Climate Action Plan, contain detailed sector-specific indicators with percentage targets (e.g., the sector “GHG Emissions” has a community greenhouse gas inventory with a 58 percent reduction by 2030 target; [Seattle OSE 2013, 8]). Imagine Boston 2030 also reports past progress in meeting targets (City of Boston 2017, 422) as well as guidelines for updating targets based on progress. Other plans like the Broward County Emergency Management’s (2017, 301) Enhanced Local Mitigation Strategy mention how policies are to be monitored (e.g., inventory of high-water marks, damage figures; loss estimate tool) but do not include targets that indicate successful completion. These plans offer a variety of examples for the four cities to incorporate implementation and monitoring metrics into other types and scales of plans.
These variations also indicate a need for better guidance on effectively monitoring plans against future flood uncertainties (Feldmeyer et al. 2019). Most research on future flooding focuses on types of flood mitigation policies (Stults and Larsen 2020) and overlooks how policy effectiveness from networks of plans is to be monitored. Flood resilience scholars have called for “adaptive pathways” that identify “tipping points” through experimentation and feedback loops of strategies (Haasnoot et al. 2013), to proactively avoid policy failures against future flood risks. However, the degree to which these monitoring principles can be adopted by nonhazards plans for nonengineered infrastructure needs attention. For example, how might a housing plan accurately monitor the allocation of housing so that it does not exacerbate flooding in the future beyond a tipping point and still provide sufficient housing for population growth? How might a transportation plan and a comprehensive plan maintain an integrated approach over time so that new roads allow growth without increasing flood risks in the future? An effective monitoring plan can go a long way in shifting focus from preparing the most effective policies, to an effective process that pulls together different policy sectors and plans, builds, and communicates fact-base, and incrementally adapts community goals and improves infrastructural capacity to enhance resilience (Meerow and Woodruff 2020).
Second, network of plans needs to collectively examine and reduce physical and social vulnerability to flooding. Despite national and international guidelines on integration of flood resilience (American Planning Association 2014; United Nations 2015) flooding fact base is primarily limited to hazard plans. Very few master plans, environmental plans, or infrastructure plans map floodplains or SLR, estimate flood losses, identify flood-prone critical infrastructure, or document sources of social vulnerability. Inadequate fact base in plans that drive growth like comprehensive plans is consistent with past plan evaluations by Fu et al. (2017) and highlights the lack of regulatory teeth when it comes flood resilience planning. We further add that environment and infrastructure plans also face similar gaps. This is concerning because fact base drives policies at all geographic scales and planning domains. On one hand, flood information could influence where assets (e.g., housing, roads) are located, which assets (e.g., parks) are protected, and where more development is allocated (e.g., investment corridors). How-ever, information on socio-economic vulnerability helps target resources to individuals and communities based on needs (Shi et al. 2016). Nonhazard plans can cite elements of fact base in hazards plans in the network of plans, but including it in the plan itself seems like a stronger statement of commitment. Plans should also include deeper analysis specific to the plan goals and area of focus. For instance, a neighborhood plan may cite analysis of city-wide social vulnerability in a hazards plan, but the neighborhood plan should provide more information on localized factors underlying social vulnerability to shape local visions and goals. Similarly, economic development plan can bring in new jobs, investments, and shape new development. These can improve financial capacity of households and cities, provide better quality homes- which may be sufficient to withstand the regular nuisance flooding. But without understanding and acting on extreme events, economic development may induce “safe development paradox” (Burby 2006), inadvertently putting more people and assets in harm’s way. Thus, plans that shape development would benefit from having flood fact base that steers growth away from hazardous areas and avoids conflicts with other plans (Berke et al. 2015).
Third, high-quality public participation needs to be a validity requirement for all plans. The quality of public participation reported in plans varies considerably within cities. Both Fort Lauderdale and Seattle have plans that do not outline any participation process. Baltimore, however, has five plans that meet all metrics within the principle of participation. This might reflect Baltimore’s focus on inclusive planning and “remedying legacy of racial inequity” (Baltimore City Department of Planning 2017, 1). Moreover, few plans in all four cities document how they engage marginalized individuals and groups affected by plan policies. This is consistent with research by van den Berg and Keenan (2019) showing that outcome vulnerability, or vulnerability because of bad policy, was excluded from resilience planning in Boston. Similarly, post-disaster plan participation processes have been critiqued by vulnerable stakeholders for lacking transparency and being discriminatory (Hamideh and Ron-gerude 2018; Olshansky, Hopkins, and Johnson 2012). Hence, transparent public participation processes that are designed to be inclusive and reparative are key to addressing underlying social injustices and structural inequities that impede resilience outcomes (Shi et al. 2016; Williams 2020).
Next Steps
This study argued that nonuniform consideration of issues of flood resilience during the preparation of cities’ networks of plans impedes flood resilience. While hazards plans had high-quality flood resilience goals and strategies, these are isolated from many other city and neighborhood scale nonhazards plans. In addition to addressing policy conflicts across plans (Berke et al. 2015; Malecha, Woodruff, and Berke 2021), nonhazards plans need to create a fact-base, reduce vulnerability (both physical and social), inclusively engage the disadvantaged on the overlapping issues of growth and flood risks, assess successes, and maintain feedback loops through implementation of the plan. As one of the first studies to evaluate the quality of different types and scales of plans in cities’ networks of plans, our findings provide new insights into how plans function as a coordinated network in relation to flood resilience. Gaps and opportunities identified here can help cities prepare new plans and update existing plans to strengthen the cohesiveness of the network.
However, more empirical research is needed on how networks of plans can effectively foster flood resilience. For example, what is the relationship between a well-coordinated network of plans, collaboration across city agencies, and resilient outcomes? There is also a need to identify predictors of an effective network of plans. What governance structures and planning processes lead to more coordination across a network of plans? Longitudinal analysis of the quality of network of plans and resilience outcomes across a larger sample of cities would help understand drivers of flood resilience in action. A larger sample of networks of plans could also help validate our plan quality coding protocol.
Moreover, as a method, PQIFR reflect baseline measures of flood resilience. Future plan quality studies on flood resilience should evaluate whether plans account for context-specific social capacities (Fraser 2021; Marino and Faas 2020). This would help capture whether plans are seeking to reduce physical vulnerability while also bolstering inherent social and psychological capacities.
Finally, there are broader conceptual questions on how networks of plans can avoid the pitfalls of integration across planning domains (Pasquini, Cowling, and Ziervogel 2013). Even a well-connected network of plans will not advance resilience if it reinforces goals and policies that increase vulnerability. Evaluation of specific flood goals and policies within the network of plans can help understand the intent and potential outcomes of plans. In addition, comparing goals and policies against projected or simulated future flood risks for potential maladaptation, discrimination, perverse incentives, and short-sightedness can also be critical to avoiding loss (Haasnoot et al. 2013). Similarly, more research needs to explore trade-offs and feasibility of different implementation and monitoring frameworks adopted by cities. This might inform ongoing debates on how to develop frameworks that guide policy execution (Rudolf and Grădinaru 2019) while allowing flexibility to adapt policy scope based on needs and response capacities. Examining these questions would add depth to our understanding of how the plan-making process can leverage synergies in goals and scope of different types of plans to advance flood resilience.
Supplemental Material
sj-docx-1-jpe-10.1177_0739456X241236486 – Supplemental material for Quality of Cities’ Networks of Plans and Prospects for Flood Resilience
Supplemental material, sj-docx-1-jpe-10.1177_0739456X241236486 for Quality of Cities’ Networks of Plans and Prospects for Flood Resilience by Malini Roy, Sierra Woodruff, Sara Meerow, Bryce Hannibal, Melina Matos and Philip Gilbertson in Journal of Planning Education and Research
Footnotes
Acknowledgements
We thank Madison Moore and Elizabeth Van Horn for helping code plans in this study. We also express our gratitude to Dr. Philip Berke for his feedback on early drafts of this work.
Declaration of Conflicting Interests
The author(s) declared no potential conflicts of interest with respect to the research, authorship, and/or publication of this article.
Funding
The author(s) disclosed receipt of the following financial support for the research, authorship, and/or publication of this article: This work was supported by the National Science Foundation [grant numbers 1825123; 1825367].
Disclaimer
Any opinions and conclusions expressed herein are those of the authors and do not necessarily reflect the views of the U.S. Government or the U.S. Census Bureau. This work was mostly or entirely completed while Dr. Sierra Woodruff and Dr. Bryce Hannibal were at Texas A&M University.
Supplemental Material
Supplemental material for this article is available online.
Notes
Author Biographies
References
Supplementary Material
Please find the following supplemental material available below.
For Open Access articles published under a Creative Commons License, all supplemental material carries the same license as the article it is associated with.
For non-Open Access articles published, all supplemental material carries a non-exclusive license, and permission requests for re-use of supplemental material or any part of supplemental material shall be sent directly to the copyright owner as specified in the copyright notice associated with the article.