
Abstract
The presence of pedestrians is definitory for street vitality. This study employs statistical and geospatial analyses to explore how built environment factors explain changes in “pedestrian flows” and “stationary activities” on fifteen street segments in Shanghai, at a mesoscale. Detailed indicators were collected through field surveys, behavioral mappings, and counting. Changes in “pedestrian flows” are distinguished from those in “stationary activities”. Synergies reinforcing the latter emerged between small commerce, residential entrance gates, and buildings aligned to the street. Road widths show negative correlations with stationary activities, contradicting China’s modern street planning practice. Corresponding recommendations for design and planning are provided.
Introduction
Urban vitality has been praised in urban studies, being associated with abundant human activity and a thriving urban environment (J. Jacobs 1961; Montgomery 1998; Sung, Go, and Choi 2013; Ye, Li, and Liu 2018). On streets, vitality is encountered where pedestrian activity is intense and, ideally, continuous (J. Jacobs 1961; Montgomery 1998). Pioneering qualitative studies have focused on analyzing vitality on main commercial streets with the highest footfall (Gehl 1987; J. Jacobs 1961; Whyte 1980), while common residential streets have been less in focus. However, compared with Western residential streets that are usually monofunctional or less dynamic, traditional Chinese (or South-East Asian) residential streets commonly include small-scale services and commerce (see Istrate and Chen 2022; Istrate et al. 2021; Kim 2015), rendering them vibrant and worth analyzing in more depth.
In contrast to traditional street vitality scholarship concerned with qualitatively analyzing a small sample of streets (predominantly under the disciplines of architecture, urban design, or social science, see Gehl 1987; J. Jacobs 1961; Montgomery 1998), the latest research takes a quantitative approach of vitality by analyzing large street networks (particularly in urban geography, urban computing, engineering, and transport studies, see, for instance, Wu, Niu, and Li 2021; Yue et al. 2019). The latter is enabled by advanced technologies and multi-sourced data, but the focus is often placed on informing consumption and revenue derived from retail (e.g., Hahm, Yoon, and Choi 2019) or even house price changes around places with higher vitality (e.g., Yue et al. 2019). Furthermore, the more fine-grained dynamics of pedestrian activity informing a social perspective of vitality tend to be overlooked. In Chinese settings, this trend of macroscale analysis holds strongly (see Li, Yabuki, and Fukuda 2022; Qi et al. 2020; Wu, Niu, and Li 2021; Yue et al. 2019, among others). One reason is that collecting and analyzing pedestrian-level data is time-consuming, expensive, and labor-intensive (Fox et al. 2021; Li, Yabuki, and Fukuda 2022). However, macroscale vitality studies remain distanced from the actual pedestrian experience and are unable to inform contextual or effective interventions at the local level. A missing link overall exists between classical qualitative field-based studies and current quantitative macroscale studies, which this study aims to bridge through a (mixed) mesoscale approach to understanding what enables street vitality in a Chinese context.
During thirty years of rapid urbanization in China (since 1978), emphasis was placed on quantity rather than quality, and besides multiple environmental concerns, phenomena including monofunctional sprawls of residential towers have challenged urban vitality (Ye, Li, and Liu 2018; Yue et al. 2019). However, as median incomes increased, citizens started paying more attention to the quality of urban spaces, and the government started promoting a “people-oriented approach” to urban transformation. In this scenario, “urban vitality” was recognized as a fundamental quality in China’s National New-Type Urbanization Plan 2014–2020 (Z. Chen et al. 2022; Ye, Li, and Liu 2018). Subsequently, the Ministry of Housing and Urban-Rural Development in China (MOHURD) issued a directive to provide open access to gated communities from public throughways (see Guo 2016), meant to increase vitality, particularly on contemporary Chinese streets experienced as monotonous and dull (Istrate et al. 2021). Despite the strong and long-term traffic engineering perspective therefore, some Chinese scholars and the government started acknowledging the importance of human activities on urban streets (e.g., Cha, Jian, and Li 2014; Shanghai Street Design Guidelines 2016; Ye, Li, and Liu 2018).
Drawing inspiration from Western theories, most Chinese scholars conceptually tie vitality to the attractiveness of the built environment to pedestrians (see Qi et al. 2020; Wu, Niu, and Li 2021; Ye, Li, and Liu 2018; Yue et al. 2019). While some do refer to J. Jacobs’ (1961) principles in terms of how neighborhoods could support lively human activity (see Wu, Niu, and Li 2021; Ye, Li, and Liu 2018), others look mainly at the effects of having urban vitality, linked primarily to economic benefits (see Z. Chen et al. 2022; Wu, Niu, and Li 2021; Yue et al. 2019). Nonetheless, a theoretical basis for vitality has not been properly advanced through contextual and granular study in Chinese settings. Considering the differences in streetscapes and human activity patterns in China, classical street vitality theories originated from empirical observations in Western countries in the 1950s to the 1970s, might not identically apply (Istrate and Chen 2022; Istrate et al. 2021; Wu, Niu, and Li 2021). To date, very limited studies have penetrated deep enough at the pedestrian level on Chinese streets to assess vitality factors. This might have also happened because vitality has not been previously lacking in spontaneously/organically developed settlements, but following massive construction phases and urban expansion, many of the long-standing principles and values have been disregarded (Istrate and Chen 2022).
This study concerns street vitality on predominantly residential streets, with a focus on pedestrian activity in interaction with built environment elements composing the street. Useful work was recently conducted to define morphological, traffic-related, and functional indicators for street livability in Shanghai (Istrate 2019). As livability concerns whether the local environment is suitable for living, and street vitality concerns pedestrian activity in interaction with the local environment, certain indicators are of common relevance. Building on this previous work, this study sets out the following objectives:
To advance a fine-grained understanding of street vitality in China by explaining quantitatively correlations of pedestrian activity with different built environment factors at a mesoscale;
To explain spatially the way morphological, traffic-related, and functional variables exert their influence on pedestrian activity when combined;
To explore how “pedestrian flows” and “stationary activities” (together forming so-called “pedestrian activity”) are similarly or differently explained by different predictors.
Data were collected before the COVID-19 pandemic when street activity was unaffected. The results inform urban design practice and policymaking for street vitality.
Literature Review
More intense pedestrian activity indicates higher street vitality (Gehl 1987; J. Jacobs 1961; Montgomery 1998; Wu et al. 2022; Yue et al. 2019). Although not having an agreed-upon/standardized measurement (Montgomery 1998; Ye, Li, and Liu 2018), street vitality has been primarily estimated by how many people and what activities they conduct on streets, which can differ in number, type, or spatial distribution (Gehl 1987; Montgomery 1998; Wu et al. 2022; Ye, Li, and Liu 2018). Vitality has also been linked to the capacity of a place to induce and sustain vibrant social and economic activity, by providing multiple possibilities for socio-economic transactions (J. Jacobs 1961; Montgomery 1998). Hence, the interaction of pedestrians with the built environment becomes key in vitality studies (see also Ye, Li, and Liu 2018), but more clarity and specificity on the patterns formed are still needed, especially in the Chinese context.
Three Analytical Scales for Street Vitality
While research aiming to quantify vitality at the city level is currently prevalent, this study aims to perform a finer analysis of street vitality. Three levels of streetscape analysis are available in the literature (see Harvey and Aultman-Hall 2016; Istrate 2019; Istrate and Chen 2022), providing a structure for categorizing macroscale, mesoscale, and microscale vitality studies linked not only to different geographical extents (see Figure A1 in Supplemental Appendices) but also to how detailed the indicators assessed are.
At the macroscale, large street networks are assessed by aggregating major physical characteristics of entire districts or cities (see Li, Yabuki, and Fukuda 2022; Qi et al. 2020). Open-source imagery (e.g., Google Maps and BaiduMaps), Geographical Information Systems (GIS), machine-learning algorithms, and big data are employed to analyze large samples faster. Coarse human activity patterns are studied in relation to the land-use mix, population densities, or transport choices. This can generate macro-trends. However, macroscale studies usually lack precise spatial configurations or metrics of urban form promoting/impeding pedestrian activity, leading to broad results that are not reflecting the way pedestrians interact with the street on a daily basis (Fox et al. 2021; Harvey and Aultman-Hall 2016; Sung, Go, and Choi 2013). To shed more light on interactions, human activities need to be considered in context (Yue et al. 2019), for which finer-grained analyses informed by field studies are more suitable.
At the mesoscale, geometric and spatial configurations of several streets/blocks are analyzed comparatively. Classical studies assessing how the street environment influences pedestrian activity have predominantly been qualitative, employing methods ranging from physical surveys and audits to observations and interviews with citizens (Appleyard and Lintell 1972; J. Jacobs 1961; Montgomery 1998). Such methods, which provide rich and comprehensive content, are scarcely employed in Chinese vitality studies (see also Wu, Niu, and Li 2021), but a few related studies providing insights into street life in China exist (see Cha, Jian, and Li 2014; Istrate and Chen 2022). While virtual audits based on open-source data could capture easier some built environment features, these are not reliable for all indicators at a mesoscale level of detail/precision and cannot capture human activity and behavior (Fox et al. 2021). Observational field studies, also employed in this paper (see section “Methods”), achieve this accurately instead (Fox et al. 2021; Gehl 2010).
At the microscale, relevant studies have noted detailed pedestrian behaviors on individual streets/squares or sidewalk portions (Gehl 1987; Whyte 1980), including in Asia more recently (Kim 2015). Besides the methods listed at the mesoscale, microscale methods include behavioral mapping (indicating with symbols different types of activities happening in public spaces). In China, microscale streetscape scholarship is very scarce. Some social activities in public spaces have been observed (see, for instance, Orum et al. 2009), but without an analysis of their spatial distribution, or interaction with various built environment elements.
This research consists of a mesoscale analysis of the pedestrian activity in interaction with various built environment factors on fifteen street segments, preparing the ground for more detailed microscale analyses and theory in the Chinese context.
Factors Influencing Pedestrian Activities, Relevant for Mesoscale Street Vitality Studies
Significant qualitative literature indicates potential factors influencing pedestrian activities on streets. They can be categorized as morphological, traffic-related, and functional factors (Harvey and Aultman-Hall 2016; Istrate 2019). Those relevant at a mesoscale are extracted in Table 1.
Key Built Environment Indicators Affecting Pedestrian Activity on Streets at the Mesoscale.
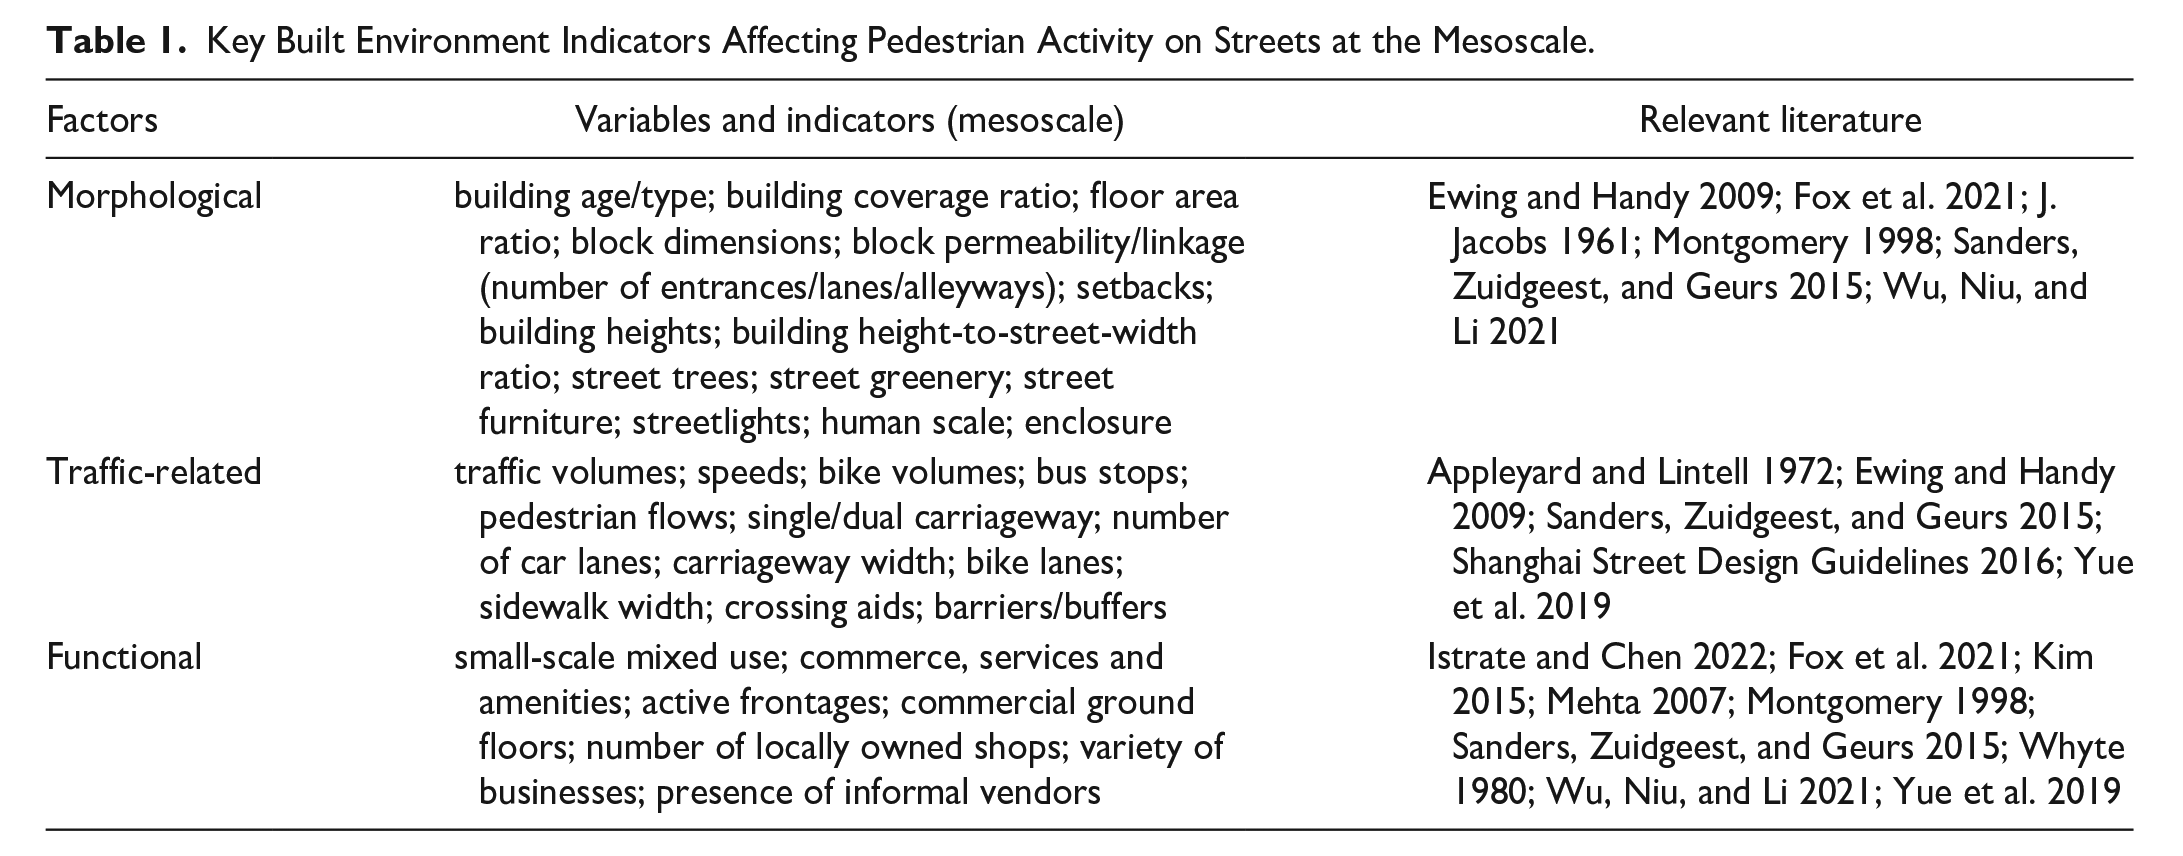
Morphological factors
Modernist city planning adopted large blocks for spatial efficiency, but shorter blocks proved more comfortable to walk (J. Jacobs 1961; Montgomery 1998). This was similarly reinforced in Chinese contexts by some studies (Cha, Jian, and Li 2014; Ye, Li, and Liu 2018), while others argue for neither too long nor too short blocks (Wu, Niu, and Li 2021). The building type, building height, setback, and other indicators such as building height-to-street-width ratio or linkage to the street also influence the pedestrian experience (Istrate et al. 2021; Wu et al. 2022). Landscaping elements (Ye, Li, and Liu 2018) and other perceptual urban design qualities, including enclosure or human scale, are also important for slow-moving pedestrians (Ewing and Handy 2009).
Traffic-related factors
Streets accommodating different transport modes and traffic-calming elements are safer compared to wide roadways with high traffic volumes (Appleyard and Lintell 1972; Gehl 2010). Traffic volumes also emerged as inversely correlated with social interaction on residential streets in Appleyard and Lintell’s (1972) iconic study. Nevertheless, some scholars consider that motorized traffic and the intensity of pedestrian activity might not always be in conflict (McAndrews and Marshall 2018). Similarly, some Chinese authors did not exclude vehicles from the concept of vitality (Qi et al. 2020), and scholars in Asia found positive correlations when pedestrians and cars coexisted (Sung, Go, and Choi 2013), or concluded that how people relate to traffic is rather subjective (Sanders, Zuidgeest, and Geurs 2015). Overall, however, balancing traffic and socially vibrant street life remains difficult. Other indicators such as street widths or traffic composition are key to concluding their influence on pedestrian activity in China (Istrate and Chen 2022).
Functional factors
Ensuring easy pedestrian access to everyday services and varied local businesses has been linked to street vitality (Mehta 2007; Whyte 1980; Wu, Niu, and Li 2021; Ye, Li, and Liu 2018). Small-scale mixed uses on streets and services, and particularly amenities such as cafés and small shops, can generate diversity and attract footfall (Ewing and Handy 2009; Istrate and Chen 2022; J. Jacobs 1961; Montgomery 1998). The mainstream Chinese scholarship attempted to encapsulate vitality into how major land uses or business destinations in cities attract users (see Wu et al. 2022; Ye, Li, and Liu 2018), using proxies such as the number of cafés, points of interest, or business destinations (see for instance Z. Chen et al. 2022; Ye, Li, and Liu 2018). However, while these represent functional attractors of pedestrian movement in cities (and can be studied easily at the macroscale using Big Data), they do not reflect the vitality concept entirely (Ye, Li, and Liu 2018), and more fine-grained indicators are needed to obtain more in-depth insights.
For a more comprehensive understanding of street vitality at a mesoscale level, this study considers the combined influence of morphological, traffic-related, and functional factors on pedestrian activity.
Methods
The Case of Shanghai
Initially a fishing village, Shanghai developed rapidly after foreign concessions (British, American, and French) were established (through the Treaty of Nanking signed in 1842), becoming a main financial hub in Asia-Pacific by the 1930s. After a heavy industrialization period started in 1949 and China’s opening up to the international market in 1978, Shanghai witnessed a booming economy and massive urban construction (K. Chen and Chen 2014).
Shanghai is currently China’s most populous city, and to support its circulation and economic functions, city authorities have prioritized an expansive road network development, ignoring the streets’ social role. Nevertheless, given its high population density and the small shops organically filling Chinese streets, human activity is still present on some otherwise unwelcoming streets for pedestrians (Istrate and Chen 2022). Shanghai was the first Chinese city to develop a street design guideline (2016); others have followed this example, but a scientific and more in-depth (mesoscale) analysis of how different street characteristics influence the dynamics of pedestrian activity is missing in China.
Sample of Streets
This study has selected fifteen street segments within Shanghai’s Inner Ring Road, an area with mature urban fabric, stretching on both sides of Pu River—the western side (Puxi) being Shanghai’s historical center, and the eastern side (Pudong) hosting Shanghai’s financial center developed after the 1990s. Differences in the urban fabric do exist between the two sides. Puxi generally consists of shorter urban blocks (i.e., the plot area in-between public streets) and is associated with higher vitality (see Yue et al. 2019), and Pudong consists of so-called “superblocks” (very large urban blocks barred to through traffic), associated with lower vitality. This study has started the selection process from the urban block size and road widths while considering historical areas of development and has selected five street sets denominated S, M, L, XL, and XXL. The general increase in the urban blocks size ranges from 150 × 200 m in the S, 200 × 250 m in M, 300 × 300 m in L, 350 × 350 m in XL, and 250 × 550 m in XXL subareas, while street widths increase from <9 m in S subarea to >24 m in XXL subarea. Within each of the S, M, L, XL, and XXL subareas, traffic-related attributes were subsequently considered to select three parallel segments with different traffic volumes (Figure A1 in Supplemental Appendices). The street segments are defined by intersections with other roads; hence, the length of these segments coincides with a street block. Functionally, all segments are bordered by over 55 percent residential land use and feature ground floor commerce to various extents.
The S, M, and L streets are in Puxi, and the XL and XXL streets are in Pudong. The S streets are very narrow and winding within Shanghai’s Old Town. M streets are narrow and located in the former French Concession. The area of the L streets was developed post-1930 with wide roads and walled work units (initially designated for factory workers but later redeveloped). The XL streets border larger work units than in the L set and feature very wide roadways. The XXL area features overly wide roadways bordered by contemporary redevelopments. The detailed measurements of morphological, traffic-related, and functional indicators on the fifteen segments are in Supplemental Appendices (Table A1).
Conceptual Framework
As street vitality is reflected in how pedestrians interact with the street environment (J. Jacobs 1961; Ye, Li, and Liu 2018), this study develops a mesoscale approach by collecting detailed field data on fifteen street segments and employing statistical and geospatial analyses to assess to what extent the built environment factors (morphological, traffic-related, and functional) explain changes in pedestrian activity, in order to provide better informed recommendations for street design and planning (Figure 1).
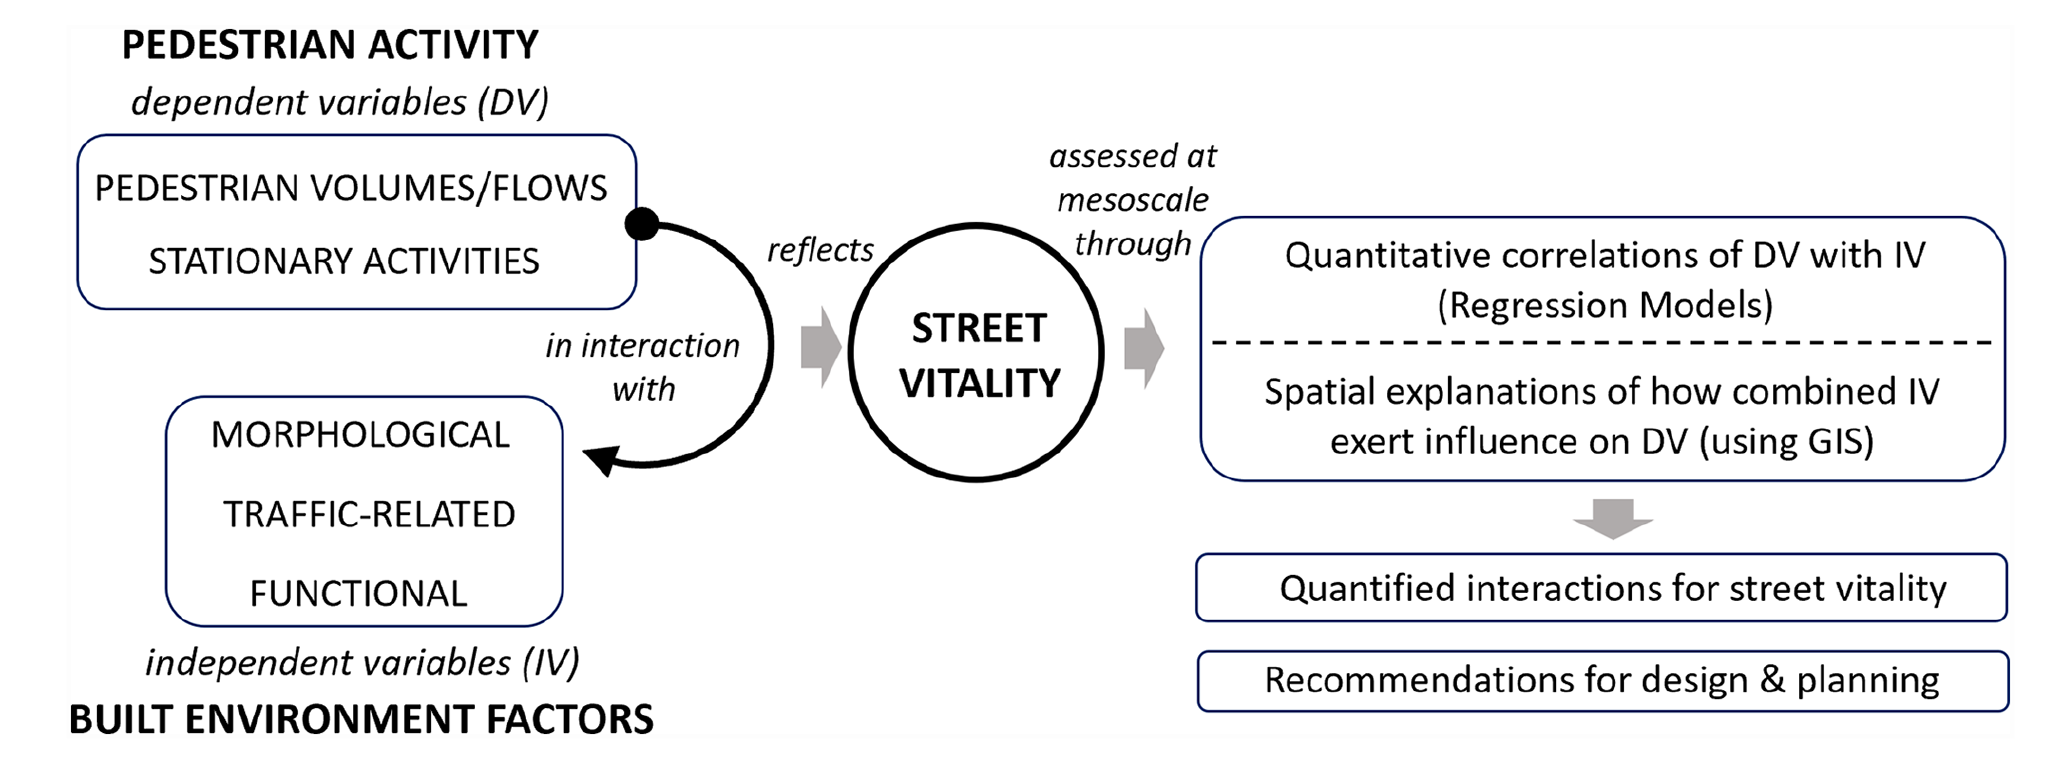
Conceptual framework for analyzing street vitality at a mesoscale.
Statistical Analysis and Model Building
Dependent variables
As street vitality results from having both stationary and moving people on the street (Gehl 1987; J. Jacobs 1961; Montgomery 1998; Wu et al. 2022), the two dependent variables in this study are “pedestrian flows” (ped/min/m) and “stationary activities” (ped/h/sqm). Data on pedestrian activity have been collected through behavioral mappings and counting performed by this paper’s author, following a structured data collection approach. Behavioral mappings were conducted within fifteen minutes of observation while walking up and down each segment at eight instances: one day during the week and another at the weekend, in each of the four seasons (2016–2017). Each person with a stationary activity longer than one minute was recorded with a specific symbol according to the activity type. After each behavioral mapping, pedestrians were counted within five-minute intervals. The data collection intervals for the dependent variables were 9:30 to 11:30 a.m. and 1:00 to 4:00 p.m., considered uneventful, avoiding morning and evening rush hours and regular lunch breaks. From these data, indicative pedestrian volumes/flows and densities of stationary activities have been averaged and extrapolated. Following the normality test (Shapiro–Wilk test for small samples), the logarithm function was still applied to dependent variables in regressions to make the data as “normal” as possible so that statistical results from these data become more valid.
Control variable
The regression models have been adjusted for the Puxi–Pudong location, given that former macroscale studies have associated Puxi with higher vitality. This dichotomous variable has been added in step 1 in hierarchical linear regressions, followed by the block of all other independent variables in step 2 in IBM SPSS 27.
Independent variables
Morphological, traffic-related, and functional indicators of the street environment are the independent variables in this study, expected to have a direct association with pedestrian activity on the street. Data on all independent variables were collected by the author through field surveys, including audits, direct observation, counting, and photographic documentation, to form a solid database (measurement details of each indicator are in Table A1 in Supplemental Appendices).
Bivariate correlations (a linear relationship, though weak for some variables, was tested and visualized through scatterplots) and multiple linear regression models (estimated using ordinary least squares) were performed in IBM SPSS 27. This exploratory study aims to reveal which of the morphological, traffic-related, and functional variables explain the variation in dependent variables. At first, larger regression models built with fourteen or more independent variables (those strongly correlated with the dependent variables in Pearson’s r, see Table A2 in Supplemental Appendices) had a high degree of multicollinearity (variance inflation factor [VIF] > 10 for over half of the variables). This especially happened when variables measuring similar or interrelated attributes were included in the same model (overall street widths and walkway widths; building heights, building setbacks, and building coverage ratios; etc.). Subsequently, all continuous independent variables have been mean-centered, but the best models obtained were still those with less than seven to eight variables. The variables were manually reduced in the order of VIF and their theoretical significance while ensuring that each model incorporated at least one or two variables from the morphological, traffic-related, and functional categories, respectively. Some of the variables were tested in different models to observe whether the coefficients remained within the same ranges, and they did (e.g., “commercial ground floors” and “linkage” in models A and B); alternative traffic-related and functional variables were also tested in various combinations, most of them showing consistency in coefficients as well, demonstrating replicability and robustness.
Geospatial Analyses
The manually collected data from behavioral mappings were cleaned and initially digitized in Adobe InDesign CS5.5 by the author of this paper. The exported .jpeg formats from Adobe InDesign with data points on the fifteen streets served as reference basemaps for undergraduate groups of students to digitize and replicate them in ArcGIS online as part of their classwork (at Chang’An Dublin International College of Transportation, 2021–2022). The emerging attribute table with 8,206-point data (compiled from the best-performing groups of students to ensure consistency with the original data given as a support base) was then exported to a CSV file. Besides using the counts of stationary activities in regressions, their spatial distribution was assessed through Cluster Mappings and Optimized Hotspot Analyses based on the Gi* statistic (see Getis and Ord 1992) to evidence identifiable spatial patterns in ArcGIS Online/Pro.
Results and Discussion
Variable Presentation and Descriptive Statistics
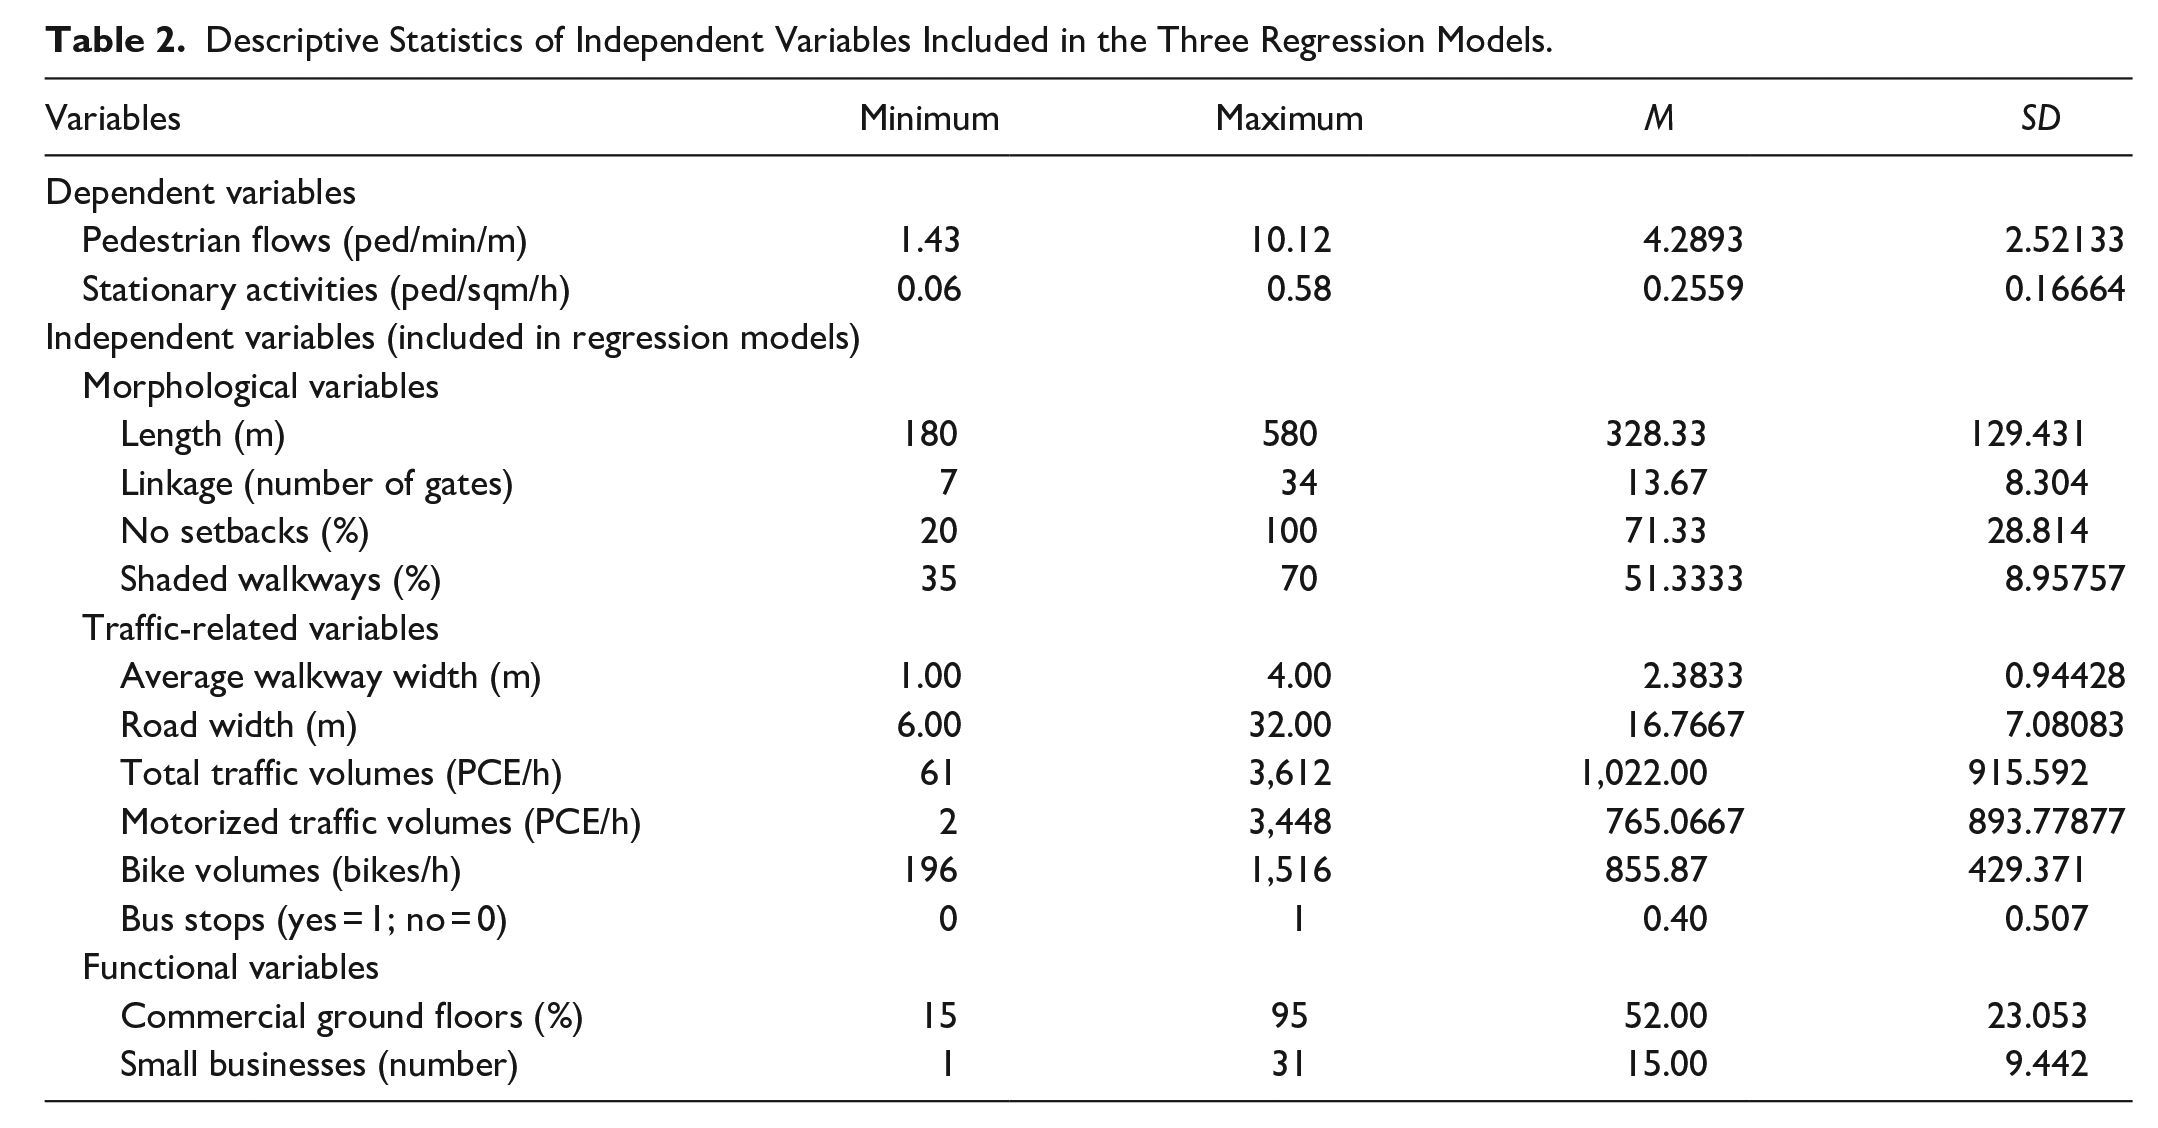
The fifteen selected streets have morphological differences (lengths of 180–580 m, average building heights of two to thirty floors, different setbacks, etc.), traffic-related differences (road widths of 6–32 m and different traffic volumes), as well as functional differences (ground floor commerce ranging from 15% to 95%, although residential land uses were dominant on all streets). Highest pedestrian volumes were recorded on streets with 65 to 95 percent commercial ground floors, despite varying traffic volumes (XL2 with 1,353 PCE/h and 18 peds/min; M2 with 1,061 PCE/h and 13 peds/min; and L2 with 681 PCE/h and 12 peds/min). Similarly, between the least versus the highest populated segments with stationary activities (XL3, XXL1, XXL2, and XXL3 with <0.11 ped/sqm/h vs. XL1 and XL2 with >0.25 ped/sqm/h), a pattern is observed: the least populated ones were slightly longer (345–580 vs. 340–345 m) and wider (17–32 vs. 14–19 m), but the major difference appears to consist in their commercial ground floors (15%–35% vs. 65%–80%). Such key independent variables have been further tested through inferential statistics.
In Pearson’s correlations, traffic-related indicators show, in general, a negative correlation with both dependent variables, while functional variables show a positive correlation (see Table A2 in Supplemental Appendices). Correlations of different morphological indicators with the dependent variables vary. Furthermore, as urban design elements tend to co-vary (see also Ewing and Handy 2009), from all the variables tested in Pearson’s correlations (Table A2 in Supplemental Appendices), the context-specific variables with higher theoretical importance were prioritized in the exploratory regression models, explained below.
Morphologically, block “lengths” showed contrasting results in Chinese scholarship. Furthermore, in classical urban design theory, “linkage” is understood as similar to connectedness, for example, also informed by short blocks (see J. Jacobs 1961; Montgomery 1998). But this study has made a distinction between segment “lengths” and “linkage”—the latter being informed only by the number of entrances to residential quarters or residential buildings from the street (called hereafter “gates”) because of their specificity and socio-cultural role in the Chinese context. “Linkage” is important to assess, also for considering the recent MOHURD directive, as it shows how permeable the fabric is in terms of enabling residents to access the streets. “Setbacks” tend to grow from traditional to contemporary developments (creating less frontage to the street), while “shaded walkways” were included in regression models to verify potential links with environmental comfort on streets. Morphological variables not prioritized in regression models include height-to-width ratios, which usually reflect street proportions in classical urban design, but in Chinese streetscapes, road widths grow at almost the same pace as building heights; therefore, streets with similar height-to-width ratios would be experienced totally different in reality. Other morphological indicators either showed multicollinearity (e.g., building heights with setbacks) or were not characteristic for only one segment, as two parallel segments share the same urban block (e.g., the building coverage ratio, floor area ratio, or green coverage).
Concerning traffic-related variables, the wider literature is not consistent regarding the effect of “traffic volumes” on pedestrian activity (see Appleyard and Lintell 1972 vs. McAndrews and Marshall 2018) or street vitality (Montgomery 1998; Qi et al. 2020). However, recent qualitative studies suggested that “traffic composition” (e.g., differentiating bikes from motorized flows) matters on Chinese streets, as do “road widths,” which appeared to impede pedestrians from easily crossing the street and forming social interactions (Istrate and Chen 2022). The presence of bus stops is also a recognized generator/attractor of (necessary) pedestrian activities (see Gehl 1987) and hence included among the traffic-related variables tested.
Functionally, although land uses and functional diversity have been taken as proxies in macroscale vitality studies (Sung, Go, and Choi 2013; Yue et al. 2019), the classical urban design and planning theory places more emphasis on functional mixed use at the street level (J. Jacobs 1961; Mehta 2007; Montgomery 1998), represented in this study through the number of “small businesses” and percentage of “commercial ground floors.” The active ground floors nearly coincide with commercial ground floors in the sampled streets, while the latter more specifically characterizes the Chinese streets (Istrate and Chen 2022). Descriptive statistics of all variables included in regression models are presented in Table 2.
Descriptive Statistics of Independent Variables Included in the Three Regression Models.
Regression Models and Interpretation of Predictors
This study presents three of the best models obtained (Table 3), selected based on adjusted
Coefficients, Standard Errors, and p-Values in Three Regression Models for Pedestrian Flows and Stationary Activities, Respectively.
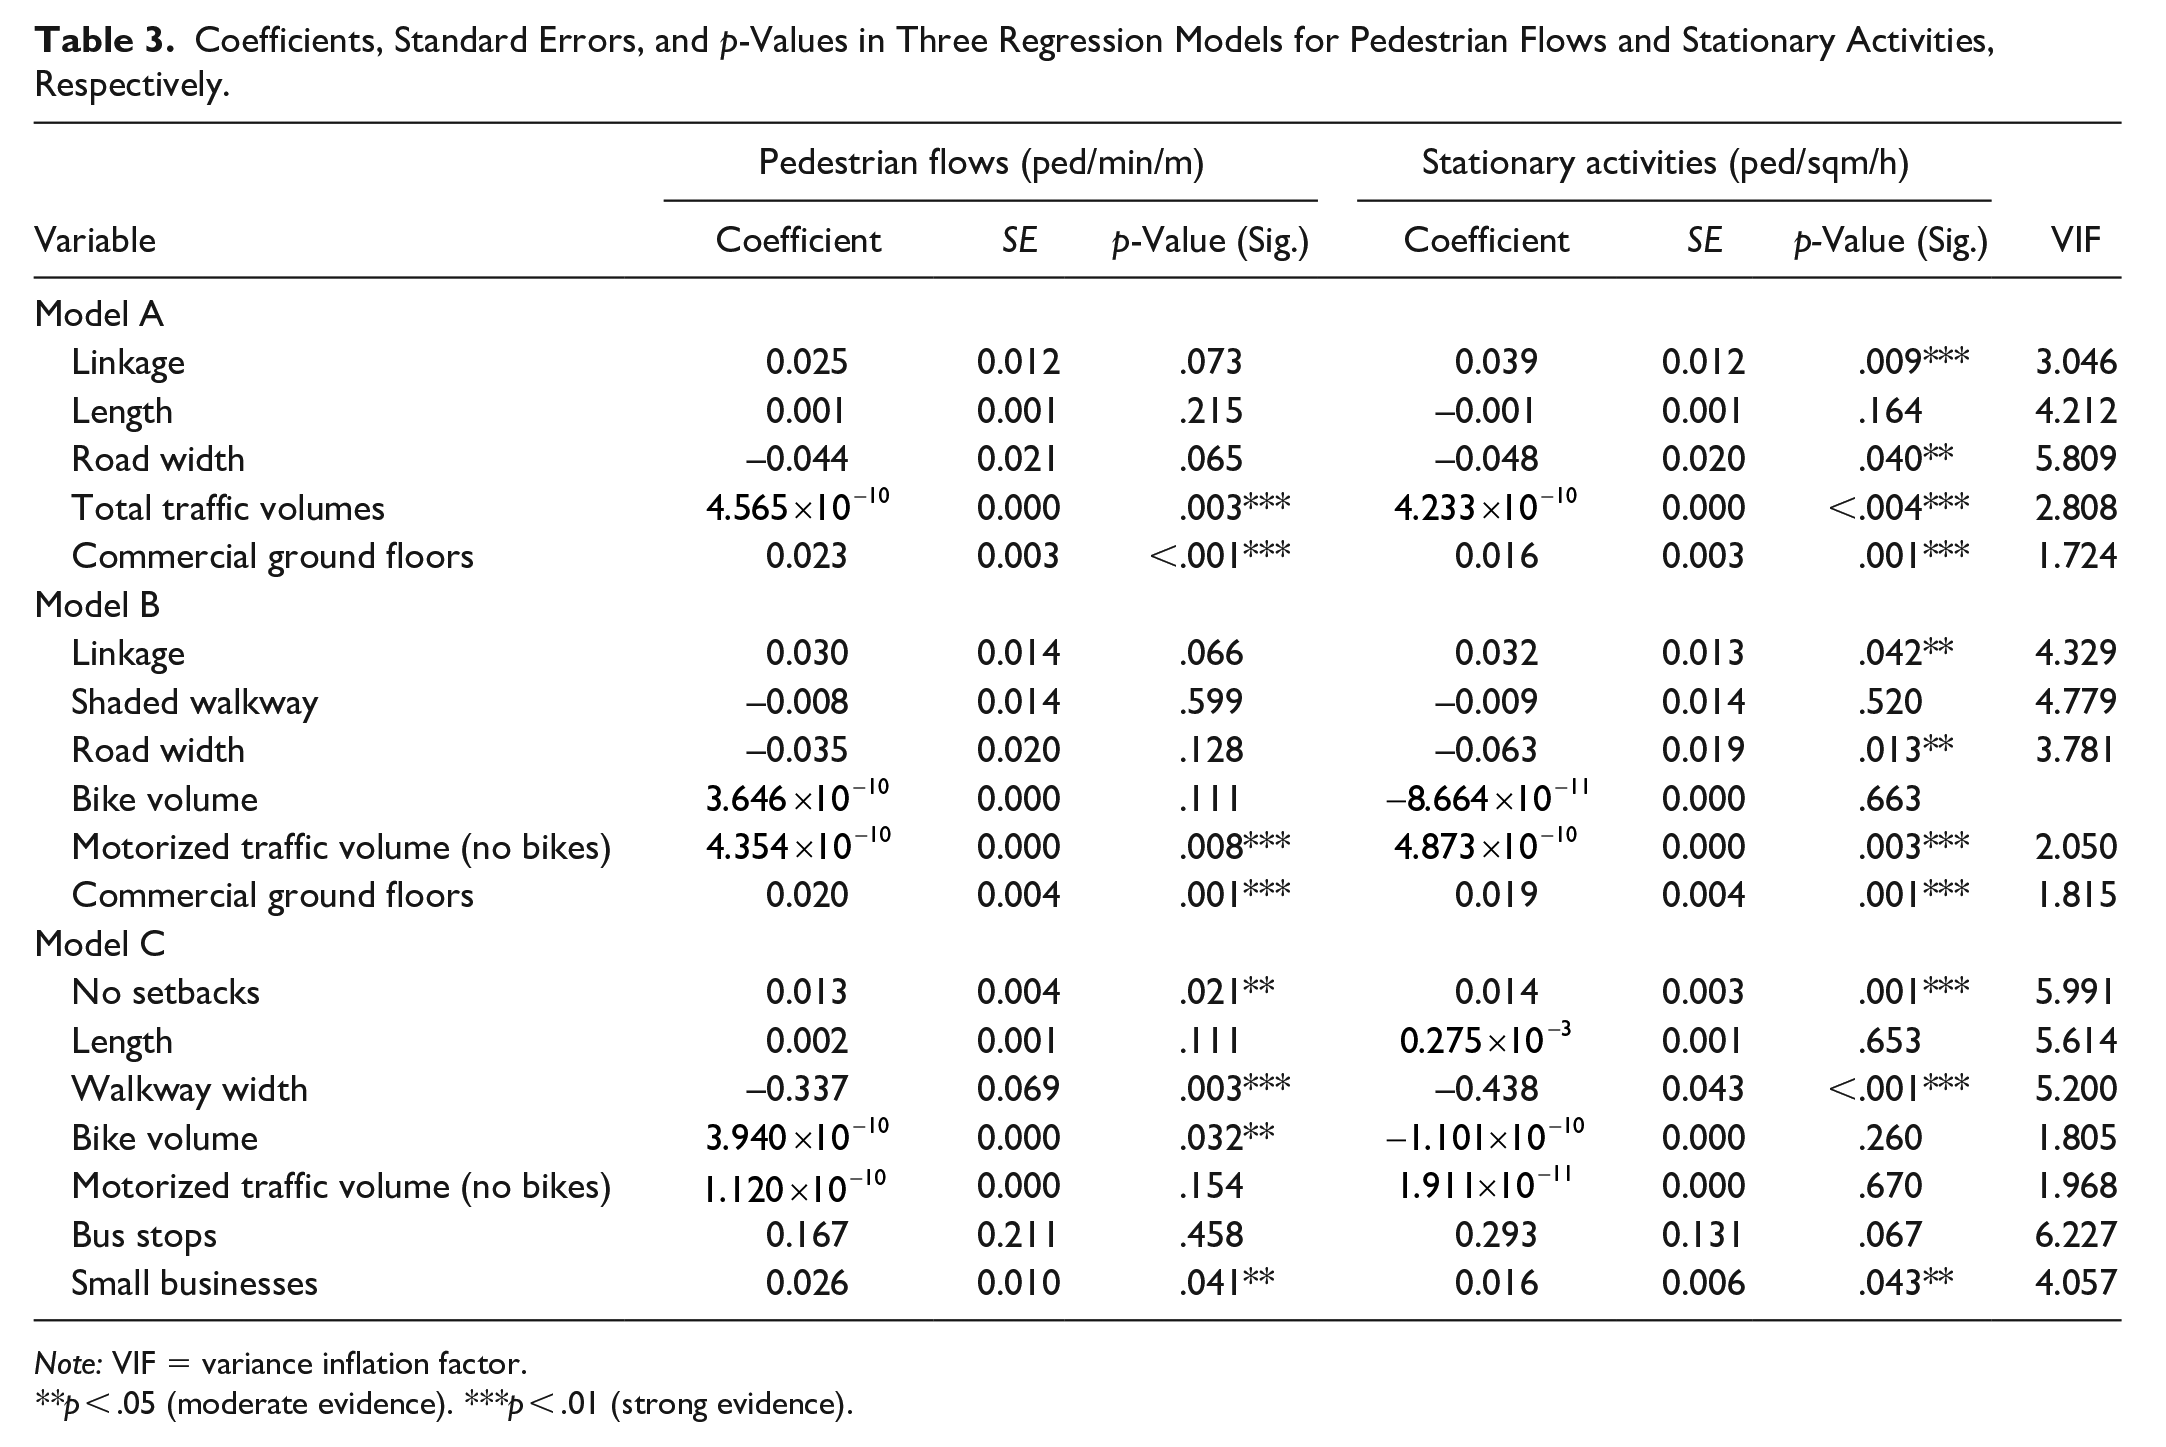
Note: VIF = variance inflation factor.
**p < .05 (moderate evidence). ***p < .01 (strong evidence).
Morphological variables
“Linkage” (the number of entrance gates per 100 m) emerged as a significant predictor of stationary activities in models A (p < .01) and B (p < .05), each extra gate explaining an increase in stationary activities of 3.2 to 3.9 percent (calculated as (exp(0.032) − 1) × 100 and (exp(0.039) − 1) × 100, respectively). This scientifically supports MOHURD’s directive of providing open access to residential quarters from the public street, although this was hindered by the recent COVID-19 pandemic and has witnessed resistance from some stakeholders when issued. Consideration should be given that in traditional Chinese fabric, urban blocks are usually permeated by multiple parallel lanes/alleyways (i.e., inner routes accessible only to pedestrians and cyclists), while in contemporary Chinese developments, larger blocks, inaccessible to non-residents, have only a few alleys and much fewer access gates, which is where linkage should be particularly increased. Lengths did not emerge as statistically significant, but they could become of secondary importance if ensuring higher linkage.
Having buildings aligned to the street (no setbacks) is also a highly significant predictor in model C, with every additional 1 percent explaining an increase of 1.3 percent in pedestrian flows (ped/min/m) and 1.4 percent in stationary activities (ped/sqm/h), elucidating why worldwide planners have commended this way of building.
Shaded walkways do not have statistically significant coefficients but show negative trends; this is not completely unexpected, as some literature shows that people prefer sitting in the sun (see Whyte 1980). Nevertheless, those streets with more shade (from taller buildings and denser tree coverage) were those with the lowest pedestrian activity recorded (see XL3, XXL1, XXL2, and XXL3) due to other morphological/traffic-related reasons as well (larger setbacks, lower linkage—mentioned above; wide roads—mentioned below). More specific seasonal analyses are needed, considering not only former observations in Shanghai that people moved their chairs and board game tables under the sun/shade according to different seasons (Istrate and Chen 2022) but also increasing global warming.
Traffic-related variables
In model C, decreases of 33 percent in pedestrian flows and 43 percent in stationary activities are explained by increases of 1 m in walkway widths; these notable reductions are partly explained by the measurement of the two dependent variables including references to walkway widths in denominators (ped/sqm/h and ped/min/m, respectively), indicating that, as walkway widths grew, the densities of pedestrian flows and stationary activities decreased when reported to the entire walkway space. Nevertheless, negative correlations of stationary activities also emerged with the total road width (carriageway + walkway) in models A and B, whose decrease of 4.8 to 6.3 percent is explained by a 1 m increase in the total road width. The models show negative correlations with pedestrian flows as well, but the coefficients are not statistically significant.
While studies considering only pedestrian flows in calculating the pedestrian level of service (PLOS) tend to generalize that the wider the sidewalks, the better they would serve the pedestrians (e.g., U.S. Transportation Research Board 2010), this study’s results bring to light more nuanced aspects for consideration. Notwithstanding, the fact that pedestrians would benefit from wider sidewalks might apply under many circumstances, including in Shanghai’s context (e.g., on its oldest streets, with very narrow and interrupted sidewalk portions). However, as sidewalk widths become overly wide (with some portions of 8–10 m along non-active frontages) associated with a road rank increase (along carriageways of up to 26 m, see XXL3), they result in distances too long to walk and lose important urban design qualities, particularly the human scale and a sense of enclosure (e.g., XXL1, XXL3, or even the widened/redeveloped L3 street, where spotting pedestrians on the other side of the road has become difficult). Hence, just planning overly wide walkways along overly wide roadways is not attracting people to spend time on the street. Additional factors, such as the detailed design configuration of wide sidewalks, could also matter. For example, in contrast to the generous sidewalks of iconic boulevards presenting street furniture and landscaping elements supportive of pedestrian activity (see, for instance, A. B. Jacobs 1995), vehicles (both cars and bikes) often occupy wider walkways in Shanghai, an issue the residents also complained about (see Istrate and Chen 2022). This study’s results overall substantiate former qualitative observations of oversized sidewalks underused by pedestrians, functioning as parking spaces (on L3 and XXL3; see Istrate and Chen 2022), and macroscale results similarly showing that too wide sidewalks reduce street vitality (Wu, Niu, and Li 2021). Such results contradict China’s current street planning practice, which has moved from impractical narrow sidewalks (where over-crowdedness and congestion create dis-amenity, lowering vitality, see Yue et al. 2019) to these overly wide sidewalks considered appropriate from a street engineering perspective (meant to compensate for the overly wide roadways); however, none of these approaches consider close enough an urban, social, or ethnographic perspective in residential street design to determine the best way to serve the pedestrians. How much the sidewalks’ configuration, including obstacles (i.e., parked vehicles) versus street furniture on urban boulevards versus common residential streets, discourages/encourages pedestrian use can be further assessed in (microscale) studies.
Traffic volume coefficients are very low, not statistically significant in model C but significant in the other two models (p < .01), showing that every additional 1 PCE/h (1 car/h) in total traffic volumes or motorized traffic volumes (without bikes) explains an increase in pedestrian flows or stationary activities of approximately
Nonetheless, traffic-related indicators are not entirely explanatory on their own. For example, XL2 and XL3 are among the widest roadways with the highest traffic volumes in the sample but experience highly contrasting amounts of pedestrian flows (8.97 and 2.12 ped/min/m, respectively); a difference in their characteristics is visible especially in ground floor commerce (80 and 15 percent, respectively), further interpreted below.
Functional variables
Small commerce emerged as a highly significant predictor of pedestrian activity in all models. A 1 percent increase in commercial ground floors (in models A and B, p < .01) or every additional small shop (in model C, p < .05) explains an increase of approximately 2 percent in pedestrian flows and a 1.6 to 1.9 percent increase in stationary activities. This association is also spatially visible, as streets with over 65 percent of commercial ground floors attracted the highest pedestrian volumes (e.g., XL2, M2, and L2, Figure 2A). This reinforcing effect of small commerce is in high contrast to large-scale commercialization that negatively impacts vitality (see the results of Wu, Niu, and Li 2021). The importance of small shops should be more widely acknowledged, especially since such residential streets are common in other Asian cities too (e.g., Sanders, Zuidgeest, and Geurs 2015). Furthermore, small shops form synergies with other built environment indicators in attracting stationary activities (see Figure 2B), explained below.
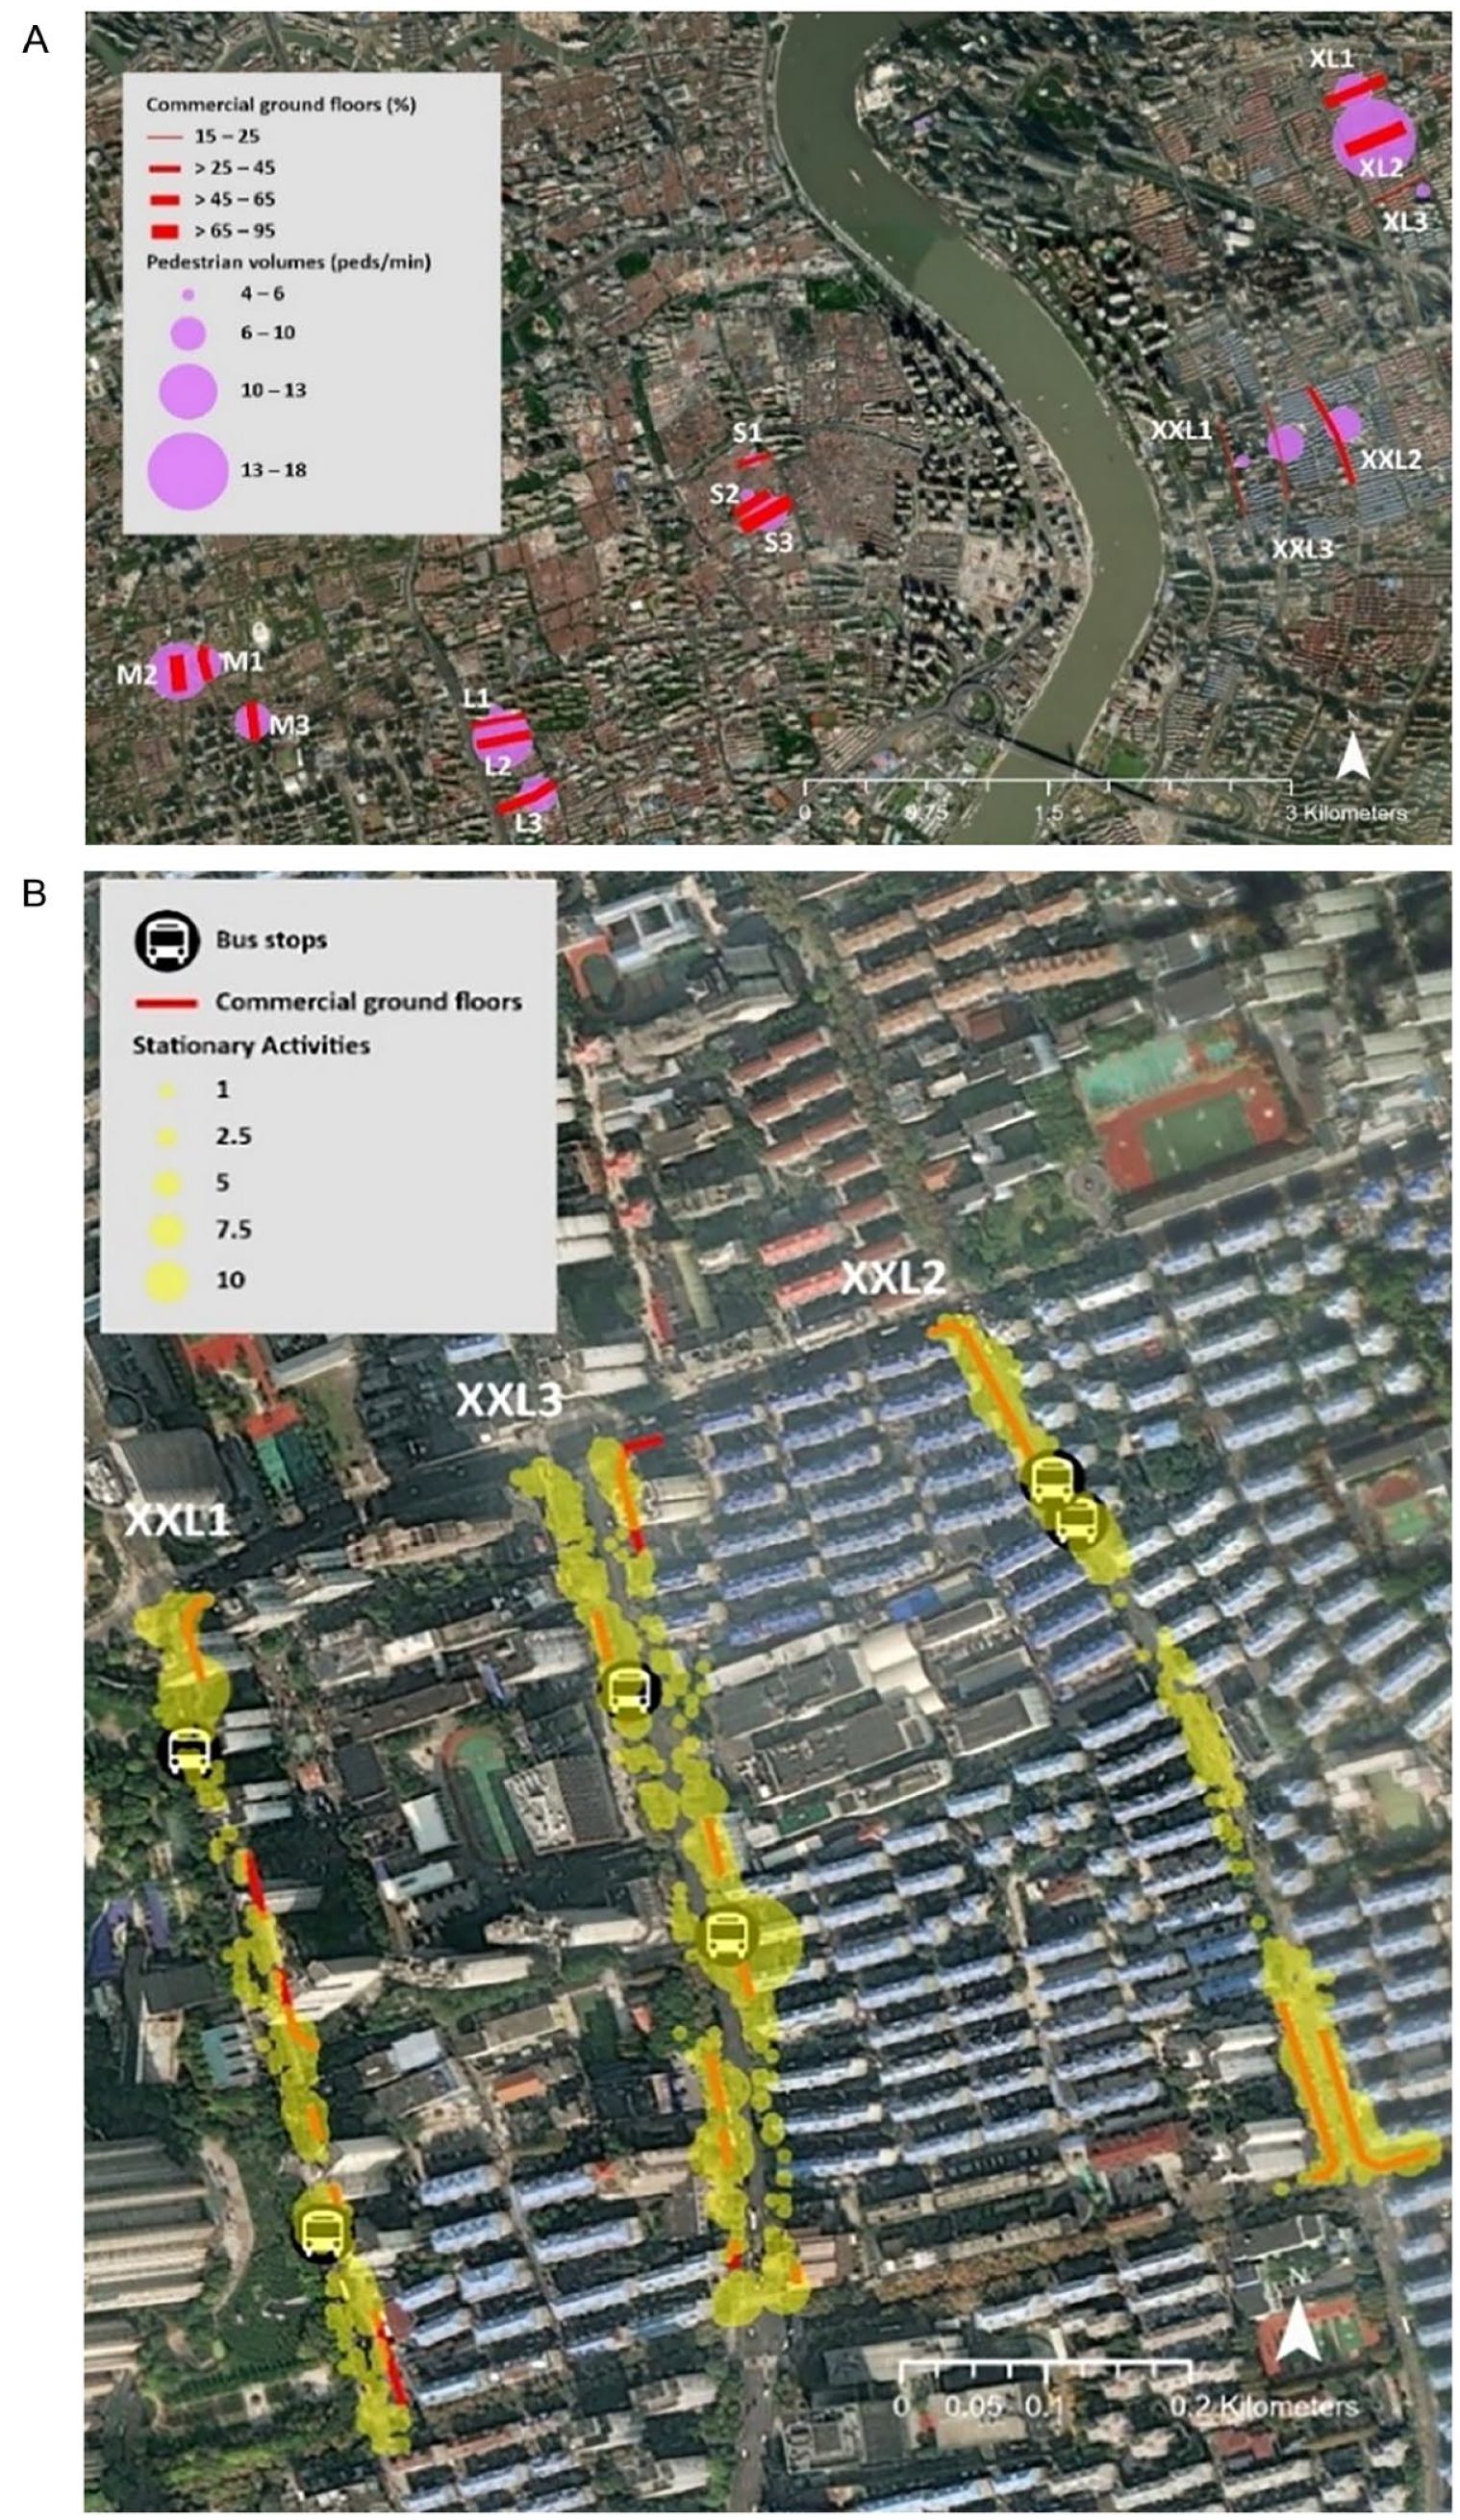
Spatial patterns of pedestrian volumes and stationary activities. (A) Association of pedestrian volumes and commercial ground floors. (B) Clusters of stationary activities on XXL streets (eight overlapped sequences of fifteen-minute observations).
Spatially Interpreted Synergies Favoring Stationary Activities
In reality, built environment attributes do not have an isolated influence on pedestrian activity, which is evident in this study, particularly for stationary activities. First, as exemplified in Figure 2A for XXL streets (similar clusters emerged across all other sampled streets), more numerous stationary activities took place around commercial ground floors (symbolized with red lines), entrance gates (e.g., middle of XXL2 where only informal vendors and residents gathered), at signalized intersections (especially on the highly trafficked XXL3), and in bus stops (coefficients not statistically significant in regressions, but showing reinforcing trends). However, the activities around these elements differ (shopping clustered around shops and sitting or chatting around entrance gates, compared to simply standing at bus stops or while waiting to cross the street), which potentially contribute differently to street vitality (worth analyzing in more depth in future studies).
Another important finding from geospatial analyses is that when conditions for multiple gates, no setbacks, and small commerce are simultaneously met, they form synergies in attracting people to linger on the streets, manifested in shopping, sitting, and chatting activities (Figure 3A); such activities represent interaction and enjoyment, contributing directly to social vitality (i.e., people not gathering only for economic transactions, but social transactions too, see Gehl 1987; Montgomery 1998). Furthermore, weighted points from aggregated stationary activities (all types) were compiled on all streets to indicate statistically significant hotspots/coldspots (within snap distances of 1.4 m, according to what the algorithm calculated as optimal considering all the 8,206 valid input features, of which less than 1.5 percent were outlier locations not used to compute the snap distance). The most eloquent examples are the M streets (Figure 3B), illustrating how statistically significant hot spots (with 99% confidence) are encountered in places where small shops and entrance gates coexist, despite narrower pavements (of approximately 2.25 m on all the M segments) or relatively high traffic volumes (e.g., M2 with 1,061 PCE/h and M3 with 1,801 PCE/h, Table A1 in Supplemental Appendices). These findings potentially indicate that such a knitted urban fabric of the M streets—with (mid-rise) buildings aligned to the street on over 95 percent of the frontage, multiple entrance gates (over 7 per 100 m in each segment) where sitting or chatting frequently occurred (over 80 people/120 min), and high amounts of commercial ground floors (50%–95%) attracting many shoppers (over 119 people/120 min)—are highly supportive of clustering stationary activities (the overall densities were of >0.28 people/sqm/h). The cold spots on the southernmost part of M3 follow logic, as fewer stationary activities were recorded, given that some cloth stores have closed on this road that has become highly trafficked in recent years, several gates were locked/inaccessible, and people only stopped occasionally. This could potentially indicate that certain types of shops might attract more shoppers than others and that locked/inaccessible gates do not contribute anything much to the street (requiring more in-depth, microscale inquiry). It could also indicate a potential threshold by which too high traffic affects the survival of shops and street vitality (worth assessing in future studies).
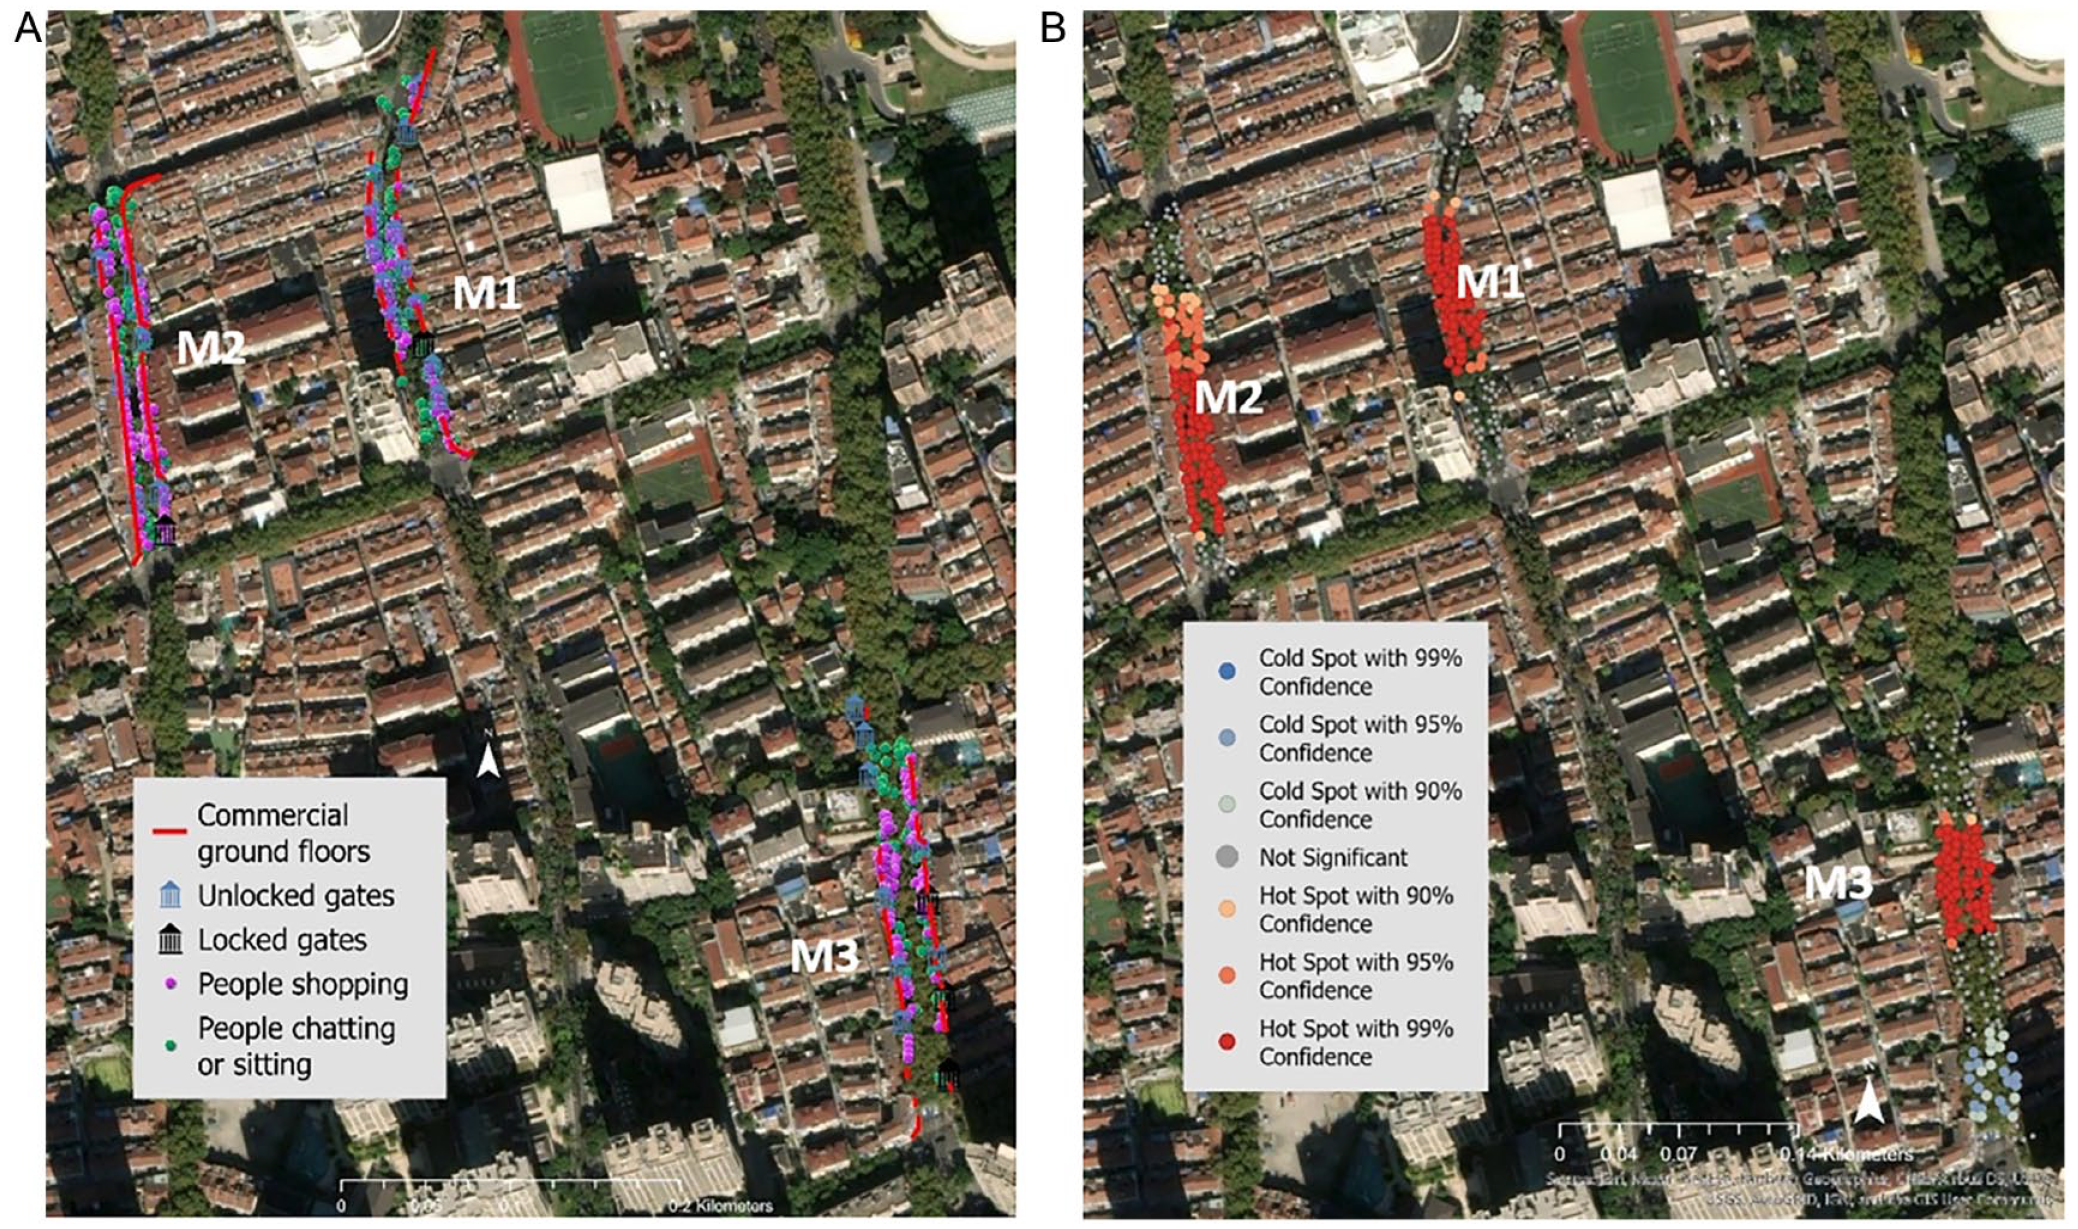
Patterns of stationary activities on M streets. (A) Spatial associations of gates and commerce with people shopping, chatting, or sitting. (B) Hot spot analyses (all stationary activities).
Conclusion
This research has informed a mesoscale understanding of street vitality in Chinese settings, addressing several gaps in the literature, as (1) street vitality studies have traditionally focused on main commercial streets, while the more common residential streets have been less in focus; (2) main vitality theories were informed by pioneering Western studies, but certain aspects might not similarly apply to China or other developing contexts; (3) multiple studies in China are addressing vitality at a macroscale, while more in-depth mesoscale and microscale studies (where fieldwork data becomes key) are very scarce.
This study has quantitatively explored to what extent morphological, traffic-related, and functional variables explain significant changes in “pedestrian flows” (ped/min/m) and “stationary activities” (ped/sqm/h) on predominantly residential streets. Three best-fitted regression models indicate reliable results, explaining over 83 percent of changes in the dependent variables. Among traffic-related variables, the role of traffic volumes for street vitality remains inconclusive, but overly wide road widths indicate decreases in stationary activities. Functionally, small commerce is highly reinforcing both pedestrian flows and stationary activities, while stationary activities are additionally reinforced by morphological variables such as high linkage and buildings aligned to the street (no setbacks).
Overall, however, the regression results show that pedestrian flows and stationary activities are not interchangeably explained by the built environment factors. The novelty of this research concerns particularly the stationary activities, which are usually not distinguished in mainstream quantitative vitality research considering only coarse pedestrian volumes as a proxy. People “lingering” on streets better illustrates the attractiveness of a street environment compared to when streets are used only for transit (see Gehl 1987). Assessing only pedestrian volumes could reflect sooner on the “economic” vitality, as pedestrians would pass by from necessity regardless of the quality of the built environment, while “stationary activities” additionally reflect on “social” vitality, where people actually enjoy spending time on the street, interacting with the environment and other people.
The three reinforcing predictors for stationary activities (emerging from regression models) and their synergy (demonstrated in geospatial analyses) contribute to the growing academic interest in quantifying urban design (Figure 4). It brings forth the ground-level perspective on improving (social) vitality and provides a recipe for creating vibrant streets, showing that having continuously aligned frontages with small shops and residential entrance gates served, when combined, as informal and culturally specific gathering spots. This synergy reflects the more traditional way of building (and living)—in more direct connection and closer to the street, providing multiple reasons for residents to use the street space, at least through small shops. If the same could be replicated in newer developments, they might also have better chances to thrive. For example, although small commerce is considered unrepresentative of modern, global Chinese cities, given its strong reinforcing significance for street vitality, it should be turned into an asset through targeted policies that set the presence of small commerce on residential streets a priority (given that population densities are favorable).
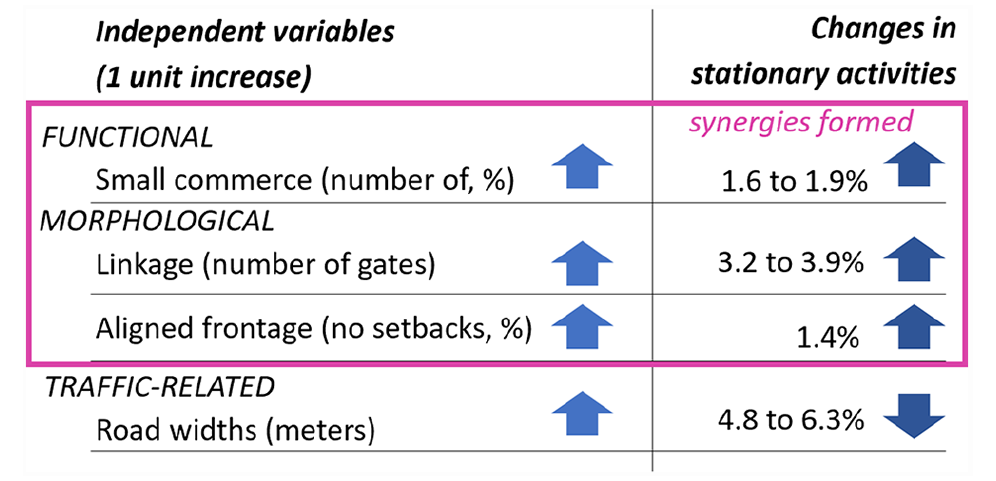
The most significant indicators explaining changes (and synergies) in stationary activities.
On the contrary, the overly wide road widths (carriageways + walkways), which emerged as inversely correlated with stationary activities, require prompt remediation in Chinese street planning, as the idea to compensate for the very wide roadways with very wide sidewalks is not working for the benefit of pedestrians, increasing distances to walk, and affecting human scale on residential arteries. As a side note, this research did not concern iconic boulevards. It is straightforward to identify those narrow/impractical sidewalks through the PLOS indicator (although focused primarily on pedestrian flows), or more recent LiDAR scans, but no clear indicators suggest how overly wide roads relate to their lowered attractiveness for pedestrians, which needs to be developed in future studies. This is especially relevant in China, where, starting with 1911 (Republican China), then strongly during the communist period 1949–1978, but also continuing after 1978, streets have been planned and designed based on an automotive or socialist scale (also aiming to eliminate overcrowding). These areas currently experience very low vitality or complete desolation, in contrast to traditional Chinese streets that naturally have a vibrancy and vitality which have been overlooked. More detailed research on determining favorable sidewalk widths and configurations for street vitality should be conducted on Chinese streets to also consider, for instance, the types and amounts of street vegetation or other indicators such as streetlights, as pedestrian-oriented ones appeared to be missing on Chinese streets (Istrate and Chen 2022), not assessed in this study given the daytime focus.
Key recommendations for policy and practice are to:
Designate space for small commerce and encourage its flourishing on residential streets (being a highly significant attractor of both pedestrian flows and stationary activities). This should be supplemented especially in contemporary-planned streets, particularly next to (newly opened) residential gates (see also below), to form synergies.
Supplement higher linkage through denser (and unlocked) entrance gates. Multiple inner lanes/alleyways for pedestrians and cyclists permeate traditional urban blocks, which have been discarded in contemporary fabric—making linkage increase by opening new residential gates slightly more difficult to implement in the latter, although the need is direr.
Build closer to the street to create frontage. Unfortunately, some Asian studies recommend setting back the buildings from the street to limit exposure to pollutants (implemented in contemporary Chinese developments), although pollutants can be reduced if permeability increases (see Ng and Chau 2014). Having buildings aligned to the street (or with low setbacks), while increasing the permeability by organizing developments around denser permeating pedestrian lanes/alleyways (see “linkage” above) and having less polluting transport would be the recommended scenario to support street vitality.
Reduce the wide carriageways of streets bordered by housing on over 55 percent of the frontage, primarily by reallocating car space, for instance, to bicycles or street greening to accommodate better the active modes and not allow vehicles to overtake the street space.
Walkway widths also need to be rethought. Particularly when they are very wide, along non-active frontages, and when paired with very wide carriageway widths, they add to unwalkable distances, and the human presence is lost/reduced. Along with redistributing carriageway space, programming socialization/gathering spaces on wide sidewalks, using, for instance, seating, street furniture, and vegetation elements could ascribe them human scale and a sense of enclosure, so they can ideally function as extensions of residential quarters.
As street design guidelines are now being developed in more Chinese cities (after Shanghai’s one in 2016), this study’s results are particularly timely and needed. The granular and contextual understanding of street vitality was enabled by robust fieldwork data (rare in China); such insights cannot be obtained merely by advanced technological means (e.g., Baidu Street Views or similar), which are still distanced from the way pedestrians experience the street space.
What makes the overall results replicable and generalizable is that the five street sets are situated in different morphological areas (in historical vs. contemporary developed city parts, see Puxi vs. Pudong), each set consisting of three parallel street segments with different traffic volumes and percentages of ground floor commerce, representing a sample of fifteen streets that can be encountered mixed and multiplied within the city. On these fifteen street segments, multiple built environment variables were combined in different regression models, which have revealed consistent interactions, while further synergies were demonstrated through geospatial analyses for stationary activities. The results of this study are also relevant for other cities in China because: S streets are similarly found in other Chinese old towns; the M streets are found in concession areas, which exist in other Chinese cities too, for example, Qingdao, Tianjin; the L and XL streets are highly representative for urban China, as work units were a dominant socialist development typology that witnessed infills or urban renovations; and the XXL segments are also very common, bordering contemporary real-estate high-rise gated communities, widespread after China’s opening to the international market (1978). The results are also relevant for other South-East Asian or developing countries undergoing rapid urbanization and transformation—particularly with regard to valuing more the traditional fabric (and ways of living in interaction with the street)—and giving more attention to stationary/lingering activities and small commerce, to inform a place-based vitality rather than hectic environments of just transiting. But more contextual and qualitative analyses are also encouraged.
This research was a step forward in obtaining a more in-depth understanding of favorable factors for vitality in Shanghai, China, to inspire a contextual theoretical basis and more effective measures at the very root level of urban vitality formation—the public street. Overall, built environment factors need to be reshaped to accommodate pedestrian activity better, some key factors and their interplay emerging through this study. Street vitality is defined by localized pedestrian activity and specific conditions for it to flourish; it cannot be entirely reduced to footfall (i.e., pedestrian volumes/flows) because the social dimension of vitality, which entails interaction, leisure, and rest along the street on an everyday basis, is better reflected in stationary activities, particularly emphasized in this study. As a final remark, while favorable built environment factors represent enablers of street vitality, the human presence remains the vitality essence, contributing the “elan vital” or “life force,” which other scholars have also recognized as paramount (see, for instance, Montgomery 1998).
Supplemental Material
sj-docx-1-jpe-10.1177_0739456X231184607 – Supplemental material for Street Vitality: What Predicts Pedestrian Flows and Stationary Activities on Predominantly Residential Chinese Streets, at the Mesoscale?
Supplemental material, sj-docx-1-jpe-10.1177_0739456X231184607 for Street Vitality: What Predicts Pedestrian Flows and Stationary Activities on Predominantly Residential Chinese Streets, at the Mesoscale? by Aura-Luciana Istrate in Journal of Planning Education and Research
Footnotes
Acknowledgements
The author would like to acknowledge UCD CSTAR Statistics’ help with verifying the explanations of some statistical results, and the work of undergraduate students in their second year at Chang’an Dublin International College (CDIC) for digitizing human activity points in ArcGIS Online by replicating data from .jpeg support basemaps as part of their GIS and Planning course, 2021–2022.
Declaration of Conflicting Interests
The author(s) declared no potential conflicts of interest with respect to the research, authorship, and/or publication of this article.
Funding
The author(s) received no financial support for the research, authorship, and/or publication of this article.
Supplemental Material
Supplemental material for this article is available online.
Author Biography
References
Supplementary Material
Please find the following supplemental material available below.
For Open Access articles published under a Creative Commons License, all supplemental material carries the same license as the article it is associated with.
For non-Open Access articles published, all supplemental material carries a non-exclusive license, and permission requests for re-use of supplemental material or any part of supplemental material shall be sent directly to the copyright owner as specified in the copyright notice associated with the article.