
Abstract
The relationship between the built environment and urban street vitality, as a key issue of contemporary urban design, has been discussed over decades. However, most existing studies relying on linear regression models do not reveal the complicated impacts of built environment features and often neglect their threshold effects. As a response, this study applies the gradient boosting decision tree (GBDT) model with a large amount of new urban data to explore the in-depth understanding of urban street vitality. Based on the street samples from 12 Chinese cities, a series of morphological, functional, and human-scale features were analyzed together with socioeconomic indicators as control variables. The street vitality is measured by street activity intensity computed from billions of location-based service records. The results show that the nonlinear model brings an overall improvement in resolution. Specifically, compared with the functional and human-scale features, the morphological characteristics, especially the street intersection density, average block size, and building density, are dominant contributors to street vitality. It is also worth noting that most built-up environment features obtain the threshold effects on street vitality, which means there is a turning point where the effect of features changes. The interaction between built environment characteristic variables is common and can be divided into two typical types. Insights achieved in this study help to indicate an effective interval of built environment characteristics on vitality, which was missed in previous studies, and thus contribute to more precise urban design practices. Moreover, by clarifying the interaction influence mechanism, this study emphasizes the need for the planner to exploit synergies between variables through optimal combinations while avoiding their antagonistic effects.
Introduction
Urban vitality is beneficial for enhancing the attractiveness, innovativeness, and competitiveness of sustainable urban development (Hasan et al., 2013). With Jacobs’s (1961) notion of urban vitality being the production of diverse urban street life, planning and designing vital cities has been widely recognized by urban planners and designers as a panacea to address the negative consequences of contemporary rapid urbanization, including urban decline, suburban sprawl, and residential and office vacancies. Thus, urban street vitality as an essential metric for the quality of urban space is always a goal of urban design.
Urbanists have long since established theories and prescribed urban design principles, for example, small blocks, concentration, mixed-use, and building coverage, to foster street vitality. Subsequently, some empirical quantitative studies have been devoted to confirming these theories and offered valuable insights into the effects of built environment factors on vitality (Long and Huang, 2017; Tu et al., 2020).
However, existing empirical evidence is mostly extracted using traditional regression models that presume linear or predefined patterns. Nonlinear (threshold) effects, which have proven pervasive among relationships between the built environment and human activities, have been neglected (Ding et al., 2018a). In addition, studies have seldom separated definite interactive effects among built environment variables from the main effects (Wang and Ozbilen, 2020). Without considering such nonlinear (threshold) and interactive effects, it would be difficult to answer the following questions: How can we determine the highest priority and most important built environment characteristics related to the improvement of street vitality? How can we find the threshold when obtaining the highest marginal benefit at the lowest cost? In response, this study first reviewed the progress of related studies focusing on the possible nonlinear and interactive effects of factors influencing vitality in literature review. Then, the case selection, relevant index calculation, and model approach were systematically introduced in methodology. The model results were presented comprehensively in analysis and results. Thereafter, the nonlinear and interaction effect of the built environment, as well as its significance to urban design practice, were further discussed in discussion. Finally, the contributions and limitations were concluded in conclusions.
Literature review
Urban vitality and its measurements: An ongoing issue
An increasing number of scholars consider urban vitality to be a socio-spatial construct that can be understood as a set of immaterial activities (Marcus, 2010; Oliveira, 2013) and can be measured from its social aspect via “recreational and social activities” (Gehl, 2013). With the emergence of travel big data, many researchers have also used indicators that can represent socio-spatial activity intensity to measure vitality (Delclòs-Alió et al., 2019), such as metro rail ridership (Sulis et al., 2018), number of mobile phone calls, and positioning records (De Nadai et al., 2016). Considering the multi-dimensions of urban vitality, some researchers integrate multiple indicators into vitality indices (Jin et al., 2017; Yue et al., 2017).
As to the built environment factors affecting vitality, there is a broad consensus on the significant impact of morphological features (i.e., street network accessibility and land-use concentration) (Boeing, 2021; Jiang et al., 2022) and functional features (i.e., land-use structure and commercial and public service availability) (Yue et al., 2017). In recent years, with the progress in computer vision technology, the human-scale features extracted from street view images have also attracted widespread attention (Ye et al., 2019; Yang et al., 2021a).
Based on the development of measurement methods for street vitality and built environment characteristics in multidimensional dimensions, since the 1990s, their relationship has generally been explored using a linear regression model (Wu et al., 2018; Tang et al., 2018). Although some researchers have used a binomial logistic model (Sung et al., 2015), it is also based on specific assumptions.
The possible nonlinear effect of the built environment on street vitality
Nonlinear relationships in communities have been widely discussed, and past studies have explored three potentially nonlinear aspects of neighborhood change: demographic, physical, and economic. Changes in the neighborhood’s characteristics are often in nonlinear and threshold-laden ways (Galster, 2018). Thus, we can speculate that street activities, as social behavior, may also be subject to a nonlinear influence from the spatial environment.
Although vitality may have an impact on social cohesion and lead to the changing of the built environment in a longer term, i.e., several decades (Mouratidis and Poortinga, 2020), the vitality on the street scale in a short term could be considered as the result of socio-economic and built environment factors. However, under the linear assumption, some variables with small effects are not discussed due to strict significance tests. In addition, the interference of co-linearities between independent variables may lead to skewed conclusions. Likewise, several built environmental characteristics have been overestimated in some related research. For example, previous studies have shown that road intersection density (Ewing and Clemente, 2013), building density (Ye et al., 2018), and richness (Guo et al., 2021) have a significant effect on street vitality. Unfortunately, if we follow the assumptions of the linear model, street vitality will increase linearly as long as these indicators increase, which means that vitality will be unrealistically high. The reality is that too high a density will lead to crowding and excessive use of space. Therefore, the effects of some features may only be positive within a certain range, that is, they have a nonlinear effect. There should be inflection points beyond which the influence will change, that is, the threshold effect.
Although it is rarely discussed, many relevant studies have noted synergistic interactions between environmental features. Yang et al. (2021a) showed that the combination of specific types of land functions and a convenient location can play a stronger role in promoting vitality. Furthermore, a study on many Chinese cities found a multiplier effect of attracting activities between commercial land use and higher network spatial accessibility (Jiang et al., 2022). Studies have also shown that network spatial accessibility has a positive effect on street vitality; however, when the functional diversity around the street is low, high accessibility may only lead to external travel (Xiao et al., 2021) rather than local social activities. The above study initially shows the possible interaction among spatial accessibility, land-use type, and richness with street vitality. Unfortunately, the interaction effects have been neglected in most studies because the measurement of interaction intensity in generalized linear hybrid models remains difficult (Johnsen et al., 2021). Meanwhile, similar studies vary considerably in different cities due to the interaction between the built environment and socioeconomic contexts. Planning practices should be circumspect about the thresholds related to local contexts (Wang and Ozbilen, 2020).
The machine learning model, as a nonlinear method, has contributed to the research in transportation, for example, the nonlinear impact of the built environment on driving distance, metro rail ridership, and commuting choice (Shao et al., 2020; Ding et al., 2018b). Recently, Yang et al. (2021b) and Xiao et al. (2021) explored the nonlinear relationship between the built environment around a subway station and urban vitality. The GBDT model, as a form of machine learning, is a tree-based integration method. The primary concept involves categorizing samples into subgroups through the use of decision trees. By constructing numerous individual decision trees and subsequently combining their results, the classification process is effectively achieved. Compared with the common generalized linear model, its advantages have been proven by sufficient theory. Recent research has demonstrated the possibility of efficiently interpreting the importance of each feature from the SHapley Additive exPlanations (SHAP) values (Lundberg et al., 2020). A SHAP value can tell us how to fairly distribute “contribution” between features (Molnar, 2019).
Research gaps and the significance of our study
The purpose of this study was to clarify whether built environment variables have any predefined relationship with street vitality, and if not, where the turning point is. We want to know if the interaction between built environment features can be strong enough to change the main effect of one of these elements on vitality. If so, we should pay attention to it and exploit synergies between elements as much as possible to achieve a more efficient design intervention.
With the combination of the SHAP value and GBDT, our study can provide a more detailed interpretation of the model results. Identifying the nonlinear effects of land-use characteristics can inform planners of the effective influence interval of certain variables, which is critical under resource-limited conditions. Exploring the synergy between environmental characteristics can inspire planners to stimulate the positive effects of some environmental characteristics by formulating policies under specific circumstances.
Methodology
Study area and sample selection
Considering that the main objective is to explore the common characteristics of the influence of the built environment on vitality in China, the streets of 12 typical cities were selected. To ensure representativeness, the dataset includes Chinese cities located in different geographical divisions and different levels of economic development. Due to the fast urbanization in China over the past decades, the social and physical environment of the “old urban areas” tends to be more stable. Therefore, based on the remote-sensing monitoring database of typical urban expansion in China (Liu et al., 2016), street segments within the urban area built between 1950 and 1970 were selected as the dataset. The details of the selected areas are shown in Figure 1. Location and details of the selected areas in 12 Chinese cities.
Data and variables
Variable descriptions and descriptive statistics.
For the independent variables, we used street activity intensity as a proxy of street vitality. Based on location-based service (LBS) data, the anonymous user geolocation data provided by TalkingData, we obtained temporal and spatial records of mobile users’ activity (Zeng et al., 2018). The LBS data collected cover a whole week (24 h × 7 days) in the second quarter of 2019.
The built environment variables are finally calculated by two ranges with strong literature support, that is, a buffer zone of 55 m (Guo et al., 2021) and the walking distance (500 m) from the street (Zhang et al., 2021).
Firstly, the “morphology” dimension herein contains four sub-dimensions, that is, scale, density and intensity of land use, and street network centrality, which are widely believed to be significant morphological characteristics of street vitality. The indicators related to land-use concentration (i.e., street density, intersection density, and building density) were calculated by the distance of 500 m around the street, which has been widely used in related studies (Tao et al., 2020). Moreover, street network walking, riding, and vehicle accessibility were measured by sDNA tools with different travel distances correspondingly, that is, 400 m, 1200 m, and n (all street segments involved). Specifically, the calculation distance of walking accessibility has been verified effective by Zhang et al. (2019).
Secondly, function includes functional density, diversity, the accessibility of public service (i.e., bus stations, primary schools, kindergartens, and open space) as well as the availability of main commercial facilities. The functional density and diversity were calculated by the number and entropy of all amenities of 12 categories within a buffer zone of 55 m along the street (Zhang et al., 2021). In terms of functional diversity, firstly, the functional entropy is calculated by 12 types of facilities. Secondly, the aggregated broad category of office services, commercial, residential, and employment services have also been involved to measure the functional composition of the street. Although these two aspects are calculated using the same source of data, they represent different environmental characteristics. The availability of commercial facilities (i.e., living, catering, shopping, and leisure amenity) was measured by the number within walking distance of the street.
Thirdly, the “human-scale” dimension herein involves two sub-dimensions, that is, visual form elements in the streetscape and spatial scale. The former includes a series of indicators of streetscape visual perception that can be used to measure the humanistic quality (i.e., visible vegetation rate, enclosure degree, and facility visibility [Ye et al., 2019]). The latter refers to the nearline rate of buildings along the street and the ratio of width to height in the street space.
Demographic and socioeconomic factors are also considered to affect daily activities (Tu et al., 2020). Therefore, the urbanization rate, per capita GDP of the city, and the average house price and population density around the street were taken as the control variables.
Finally, in response to the multicollinearity between indicators, the variables with VIF values greater than 7 and a correlation coefficient greater than 0.6 with either variable have been removed. The results of the multicollinearity test, that is, VIF values and bivariate correlation of indicators, could be found in Appendix Table S1, Figure S2. It is worth noting that the functional entropy and the proportions of dominant functions have passed the covariance test, which means that the correlation between them would not lead to biased model estimates.
Modeling approach
We employed the GBDT model to explore the associations between variables. Compared to the traditional linear regression model, the GBDT model does not require the response to follow any assumption, and it can accommodate variables with missing values and handle multicollinearity better. Thus, it offers more accurate predictions (Ding et al., 2018a).
We used the “sklearn” package in the Python programming language to estimate the GBDT models. To obtain a robust model, a five-fold cross-validation procedure was employed to address potential overfitting. Specifically, the sample was divided into five subsets. The model was fitted using four different subsets (80% of the data) and validated by the remaining subset (20% of the data), repeated five times. Besides, several key model parameters are determined, such as learning rate, n_estimators, and max_depth. The learning rate controls the step size, having a significant influence on overfitting. The max_depth decides largely the complexity of the model. The model in this study obtained an optimal parameter, that is, a learning rate of 0.02, and a max_depth of 7. As shown in Appendix Table S5, considering the small differences between the training and validation error rates, no over-fitting problem occurs. The mean square error of the final model was 1,384, and R2 was 0.76.
To examine the local effect of independent variables and the interaction effect when combined with other variables, we used the SHAP package (Python 3.7) to interpret the GBDT model. The SHAP package contains an improved tree explainer method that can effectively calculate the SHAP and SHAP interaction values. In SHAP, the contribution of each feature to the model output is allocated based on their marginal contribution. For each variable, its interaction effects with the other independent variables were computed. To create a clear clue for the following analysis, we selected pairs with higher SHAP interaction values of three types, that is, form–form, function–function, and function–form, following the analytical approach proposed by existing studies (Xiao et al., 2021b; Yang et al., 2021b).
Thereafter, we elucidate when to focus on the interaction effect by visualizing the pure interaction effect between the variables, which is calculated by subtracting the variables' respective main effects from the joint effect of the two variables.
The robustness test of the model
To improve the reliability of the analysis, three approaches have been adopted. First, robustness tests were performed on the same indicators calculated in different ranges to make the results reliable. The results shown in Appendix Tables 1–3 indicate that the correlation of each indicator with vitality increases as the calculated distance increases. Besides that, the influencing trends of dominant indicators remain highly consistent accompanied by the changing of buffer zones (Appendix Figure S3).
Second, a sub-sample model was built based on the samples of three cities, that is, Guangzhou, Wuhan, and Beijing. The three cities were randomly selected from southern, central, and northern China. As shown in the appendix Table S4, there are certain differences in socio-economic indicators and functional indicators to the results of the original model. That is mainly because the sub-samples are located in developed cities with a high development level of economy. However, the impacts of morphology and human-scale characteristics on vitality are stable in the two models. This can prove that it has practical significance to study the common characteristics of cross-cities.
Third, an advanced tree learning algorithm, XGBoost (Chen and Guestrin, 2016), has also been trained on our dataset. Both models (shown in appendix x) illustrate similar results in R2 and mean square error. Thus, the model performance of GBDT in this study is reliable.
Analysis and results
Relative importance of independent variables
Based on the feature importance measured by the mean absolute SHAP values, we calculated and ranked the relative importance of each feature, which summed up to 100% (Figure 2). Thus, the relative importance of variables implies their ability to make a successful prediction, not necessarily positively or negatively. The control variables consist of the dummy variables for the cities and the socio-economic variables, which possessed relative importance of 10% and 33.1%. It also indicates the group of built environment factors on the street level had more contributions to the successful prediction of vitality. More specifically, the urbanization rate degree and per capita GDP had higher importance than other variables, reaching 15.2% and 9.6%, respectively. As for the three dimensions of built environment characteristics, the morphological, functional, and human-scale variables had a relative importance of 25.2%, 25.6%, and 5.9%, respectively. The relative importance of variables.
Among the morphological variables, intersection density is the most dominant feature (8.6%), followed by building density, average block size, and floor area ratio (FAR). This is unsurprising, small blocks and dense intersections are essential for enhanced place contact. The results also highlight the importance of street location. For example, the relative importance of primary school, kindergarten, and bus stop accessibility is high, ranking 7th, 9th, and 11th, respectively. These variables reflect the ability to influence street public activities.
A comparison between the different variables revealed several significant results. First, the relative importance of building density was higher than that of FAR. High horizontal building coverage can create greater opportunities for street activities by providing more street-facing ground spaces, while the high concentration of vertical building space reduces pedestrian access (Gan et al., 2021). Second, functional density was more than three times as important as functional entropy, indicating that land-use concentration plays a key role in attracting street activities. It should be noted that entropy may be one-sided in terms of the measure of functional diversity. The relative importance of indicators related to functional diversity, that is, function entropy and composition can reach 0.89% and 4.03% respectively.
Nonlinear effect of built environment indicators
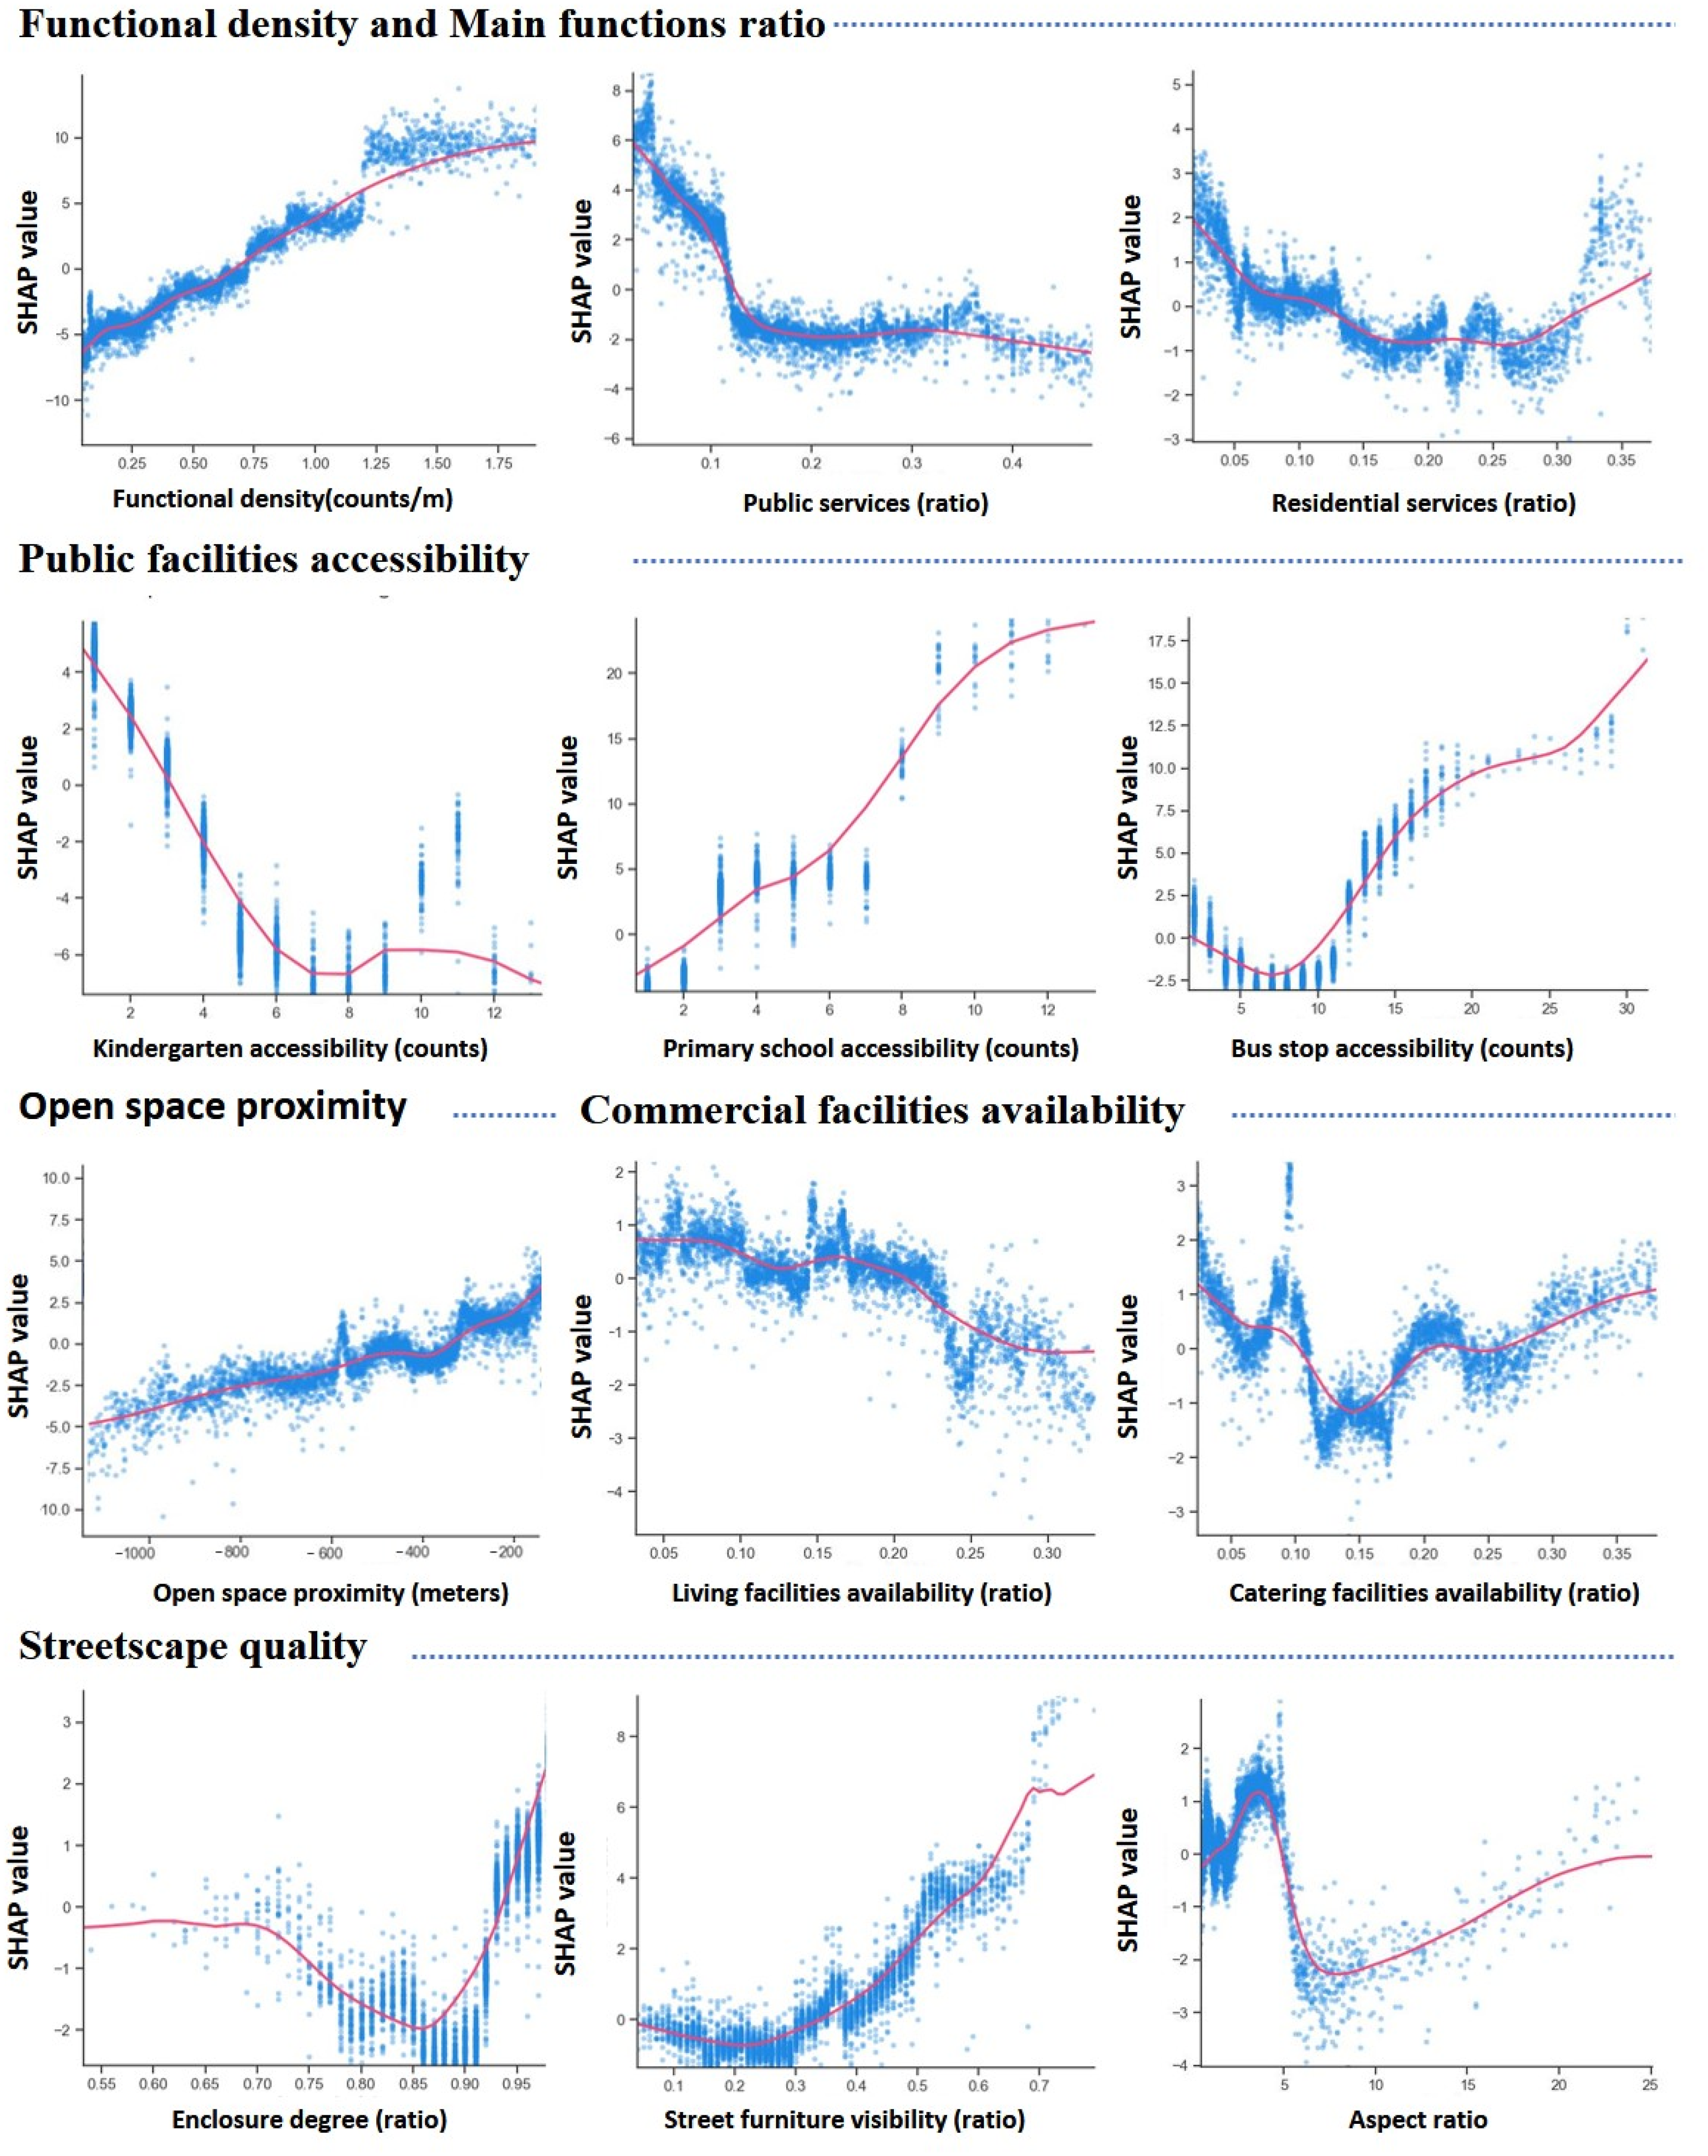
The SHAP dependence plots of key built environment variables (relative importance >1%) are shown in Figures 3 and 4. Each point corresponds to a street sample. The setting of this threshold is made according to existed studies facing similar situation (Gan et al., 2020). Positions on the x-axis represent independent variable values, and the y-axis represents SHAP values, that is, local effect. To better identify the trends and turning points of the local effects, we generated sample point-fit curves through locally weighted regression. A rise in the curve represents a positive correlation between the independent variable with the street activity intensity and vice versa. A steeper slope of the curve indicates a higher marginal benefit. Threshold effects of mesoscale morphological characteristics. Threshold effects of functional and human-scale characteristics.
Morphological variables
The street intersection density shows an upward trend in the range of 0–0.8. When it exceeds 0.4, the SHAP value has slight fluctuations. However, when it exceeds 0.6 and is lower than 0.8, the street intersection density has a positive effect on street activity intensity again. Most related studies suggest that smaller blocks are more conducive to vitality. Our analysis further indicated that the negative effect of block size on vitality is more obvious when it is less than 4 ha.
The building density has generally a positive effect on street activity intensity when less than 0.38; however, its effect has a slight fluctuation in the range of 0.24–0.26. When it exceeds 0.26, the marginal effect of building density first increases and then decreases. Then, there is a slight downward trend after 0.38. When the FAR exceeds 1, its marginal effect has a jump, and then the positive impact curve approaches linearity while the impact fluctuates in the range of 1.5–2.5. Then, when the FAR exceeds 2.5, the impact curve no longer rises. This is reasonable because excessive building density and high land-use intensity would lead to overcrowding and compression of public space (Xia et al., 2020). Vehicle accessibility shows first a downward and then an upward trend. However, it finally remains stable. The local effects of both walking accessibility and cycling accessibility increase at the beginning and then decrease slightly. However, the former shows an overall upward trend, while the latter shows a general downward trend. This is consistent with the view that community street activities are more closely related to short-distance walking or cycling activities.
Functional variables
As shown in Figure 4, function density has a positive effect and the curve is linear at the beginning, while when it exceeds 1.5, the slope of the curve eases. This confirms the mainstream view that a concentration of facilities along a street tends to increase its popularity. The ratio of public facilities represented by various kinds of sports, hospitals, and schools is negatively associated with vitality until 0.12 and then remains stable. This is mainly because public facilities often with limited numbers occupy larger sites. Therefore, they are not compatible with commercial facilities that tend to attract dense activities within limited spaces. As a result, the gathering of public facilities on both sides of the street leads to a decrease in vibrancy. It is necessary to enhance vitality through the integration of commercial and public facilities. Similarly, the ratio of residential services represented by hotels, apartments, and other residential buildings show a downward trend at the beginning, but when the ratio exceeds 0.25, the vitality has a dramatic increase. That is also reasonable because residential places are the basis for vitality. When a certain ratio of residential facilities would be reached, social activities will be triggered.
As to the specific public facilities, kindergarten accessibility shows a negative effect in general, but the negative effect disappears when exceeds 8. This may be because the streets having high access to kindergartens are often located in the gated residence in China, far from social public activities. Primary school accessibility shows a continuous positive effect, having the highest marginal effect when within 6–10. It suggests that primary schools are less likely to attract more people beyond the threshold (10). Bus station accessibility shows a tendency to decline first and then rise, with the inflection point at approximately 8, and remains steady after 18, but there is a tendency to rise again when above 27. That can be explained by the fact that locations with high bus stop accessibility are often transport hubs where people tend to gather. The open space proximity shows a positive effect on street vitality when within 1000 to 200 m of the street. That verifies its stable and effective capacity to attract social activities.
Key human-scale variables
The relative importance of human-scale features can almost be ignored, while their obvious threshold effects are also noteworthy. For example, the marginal benefit increases sharply when the enclosure degree exceeds 0.85 or the street furniture visibility exceeds 0.5. As for the street aspect ratio, the local effect shifts from increasing to decreasing when it exceeds 3. This is understandable because a high aspect ratio can be oppressive to pedestrians (Lynch, 1960). However, when it exceeds 6, the curve instead tends to rise slightly, but there are very few sample points.
The interaction effects between key built environment variables
SHAP-dependence plots visualize how the contribution of a particular feature depends on another. Each sample is marked as a point with the value of a feature given on the x-axis and the value of another feature on the y-axis.
The color of the point represents the pure SHAP corresponding interaction values. Red points indicate positive values, which means that the cooperation of two variables leads to an overall effect that is greater than the sum of their respective marginal effects, that is, a synergistic interaction effect on vitality. In contrast, blue points represent the negative value, which means that the overall effect of the cooperated two variables is lower than the sum of their respective marginal effect, that is, antagonistic effect. The darker the color, the stronger the interaction.
According to the variation of the pure interaction effects, two typical types can be identified. The synchronous synergy occurs when both interaction terms are at a low or high level, which suggests that the levels of the two features may conducive to mutual reinforcement when matched (Zhang et al., 2019). In contrast, asynchronous synergies mean the synergistic effect occurs when one of the interaction terms is high and the other is low (Johnsen et al., 2021).
Interaction effects of form–form and function–function variables
As shown in Figure 5, there is no obvious interaction effect between the floor area ratio and the walking accessibility when both are relatively low. The synergistic effects occur when the floor area ratio exceeds 2, and the walking accessibility remains lower than 200 or the walking accessibility exceeds 800 and the floor area ratio exceeds 1. However, a slight increase in the other leads to an antagonistic effect. That is because both two indicators show a long-tailed distribution, and the high levels of either indicator will bring crowded situations, which would restrict the effect of the other. The results also bring insights that improving walking accessibility in the areas with high level of floor area ratio might not be a cost-effective choice for vitality creation. The interaction between building density and floor area ratio shows opposite patterns. There is a strong synergistic interaction effect when the building density is lower than 0.35 and the floor area ratio is lower than 1. However, when either increases, a strong antagonistic effect appears. This is because it usually represents the high-rise enclosed or dense old residential area when the construction density is high at merely vertical or the horizontal level, which often lacks public activities. Conversely, the high level of both indicators usually represents high-density residential places, which would be crowded with social activities. That also brings new insights that there will be a negative marginal effect when the two indicators mismatch, resulting in a waste of building resources. Key interactions between function–function and morphology–morphology.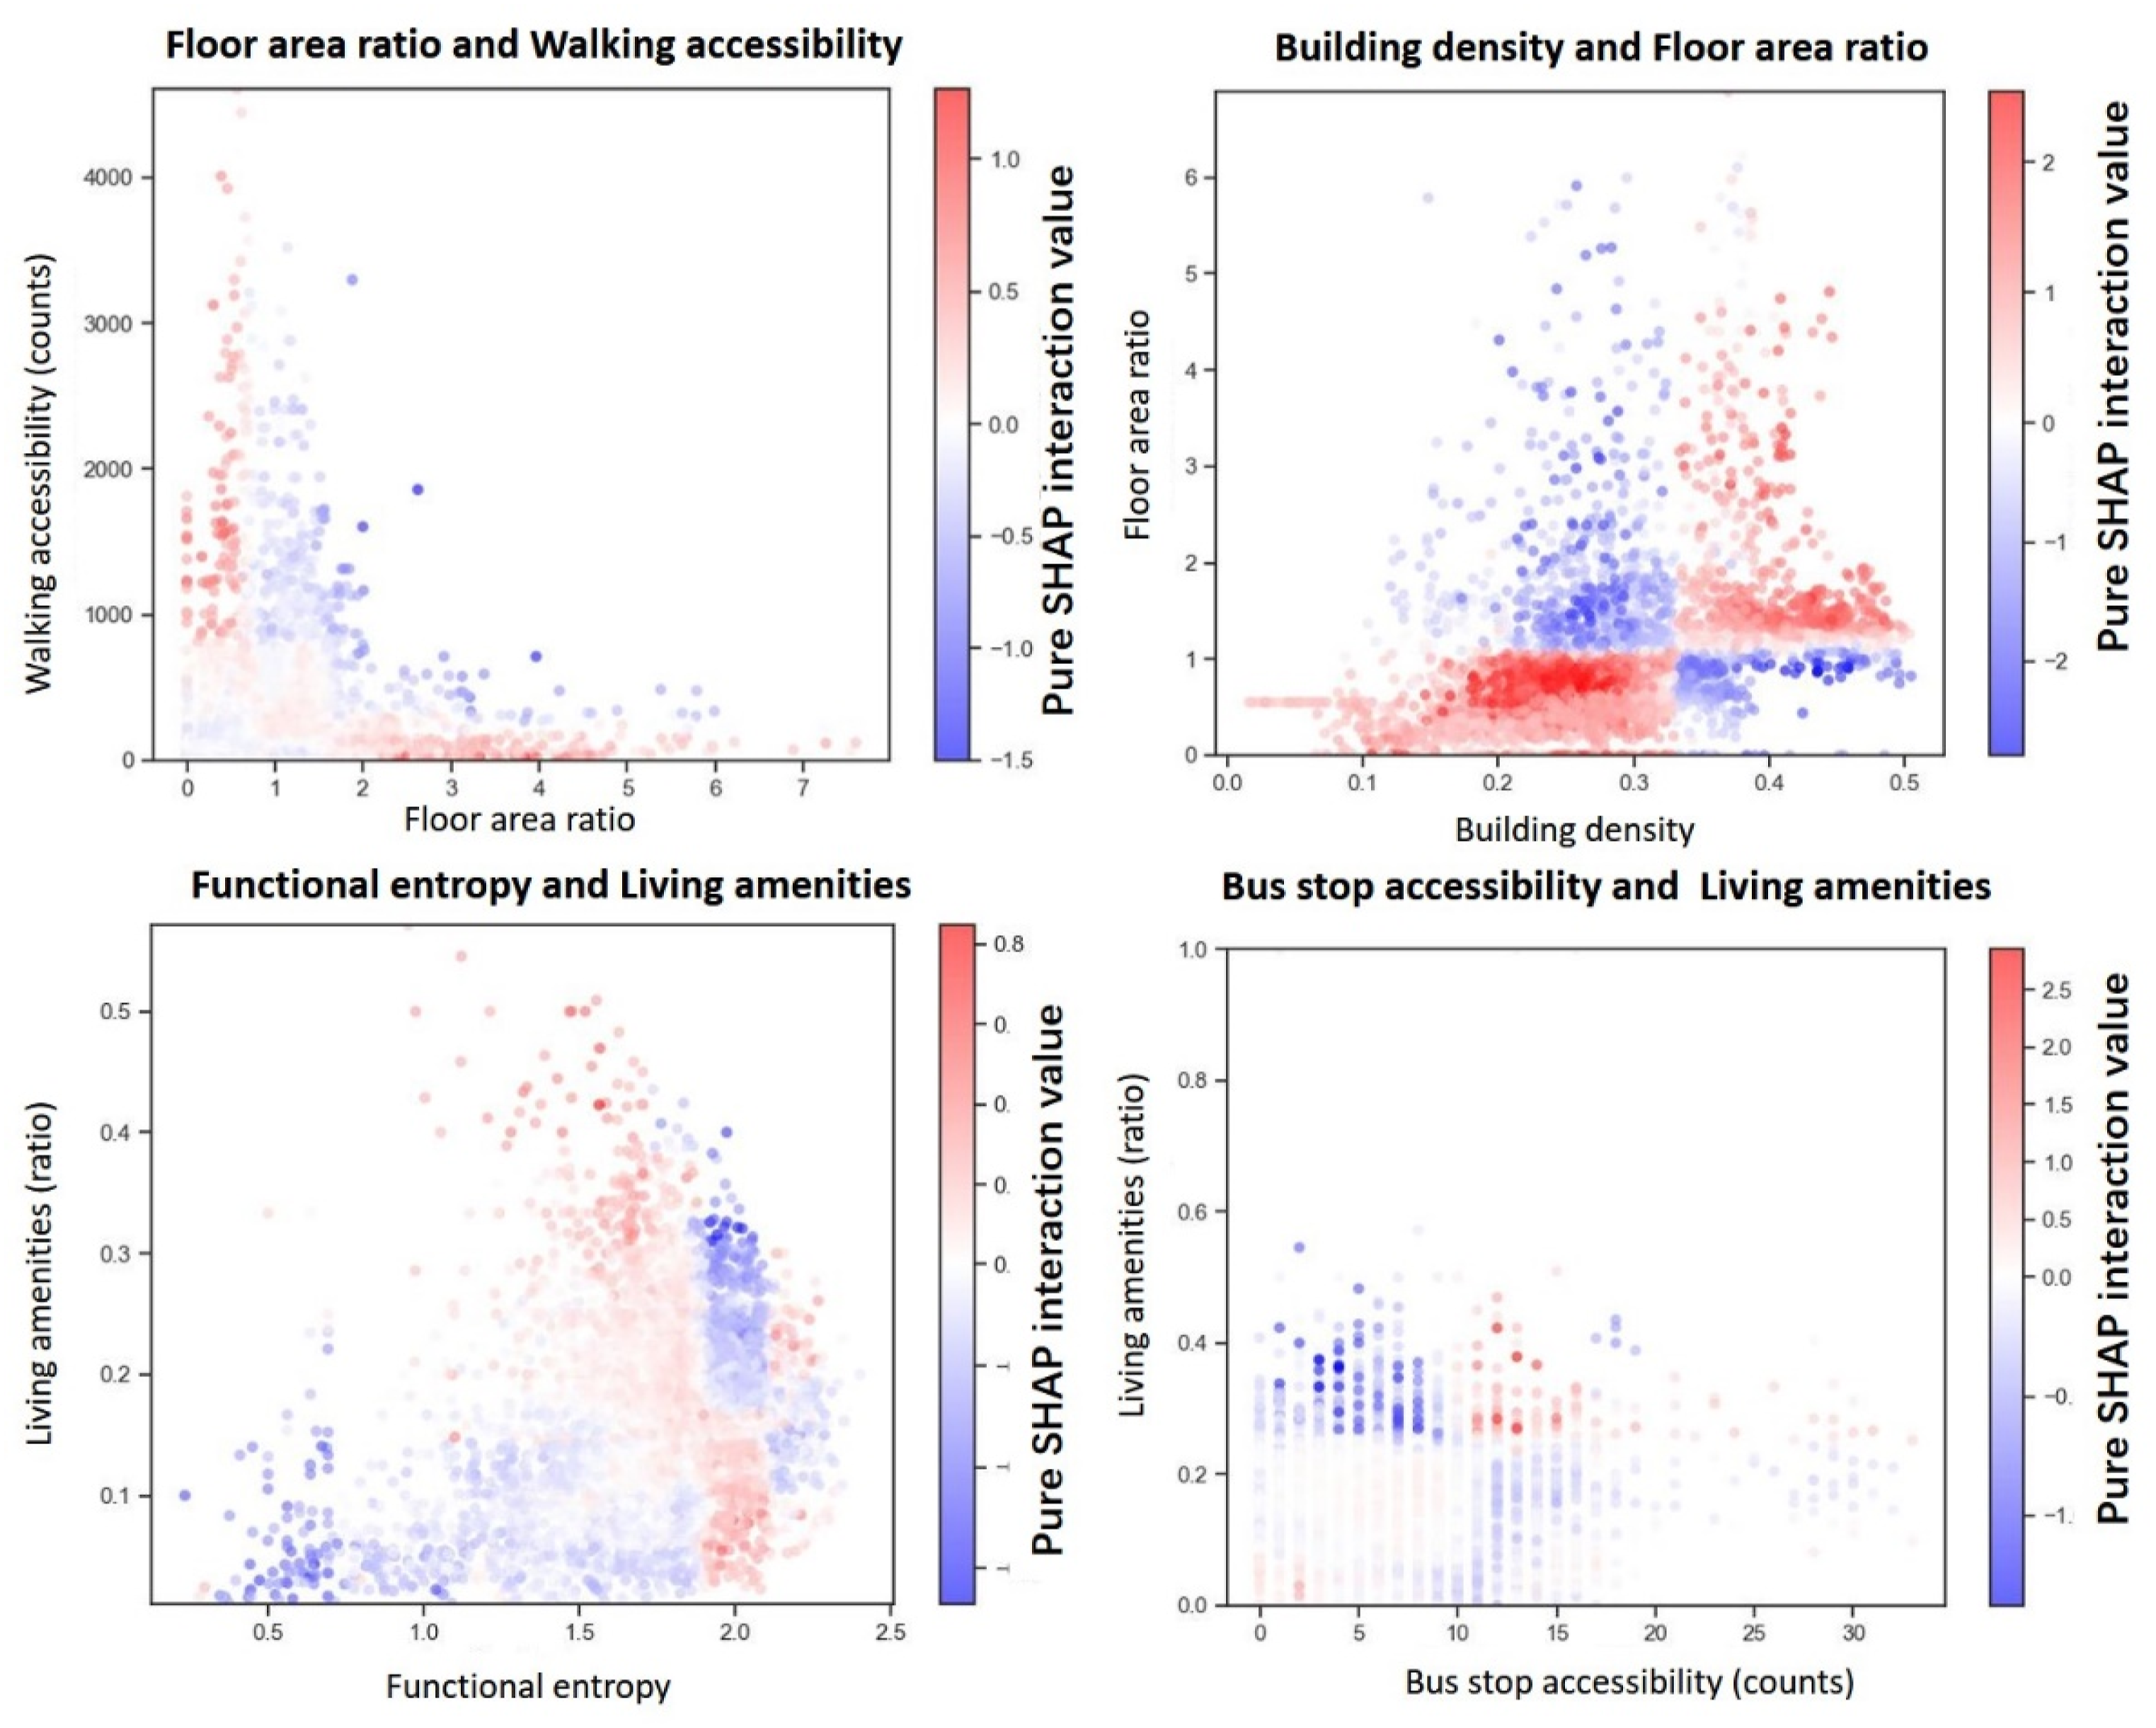
The interaction between functional entropy and living amenities shows a negative marginal effect when the former is <1.8 and the latter is <0.18. That is because places with low levels of functional entropy and living amenities usually lack attraction to residents. Moreover, the increase in living amenities leads to a synergistic effect, which can be attributed to the fact that places with high levels of living amenities are usually dominated by convenient daily services that are attractive to consumers. Then, as functional entropy increases, the antagonistic effect reappears. That is also reasonable because the streets dominated by living amenities are less attractive to social activities, compared to the ones with a high mixture of catering or shopping amenities. In short, the above results suggest that despite the same level of entropy, an appropriate configuration of dominant facilities would be more effective in promoting vitality.
As for the interaction between bus stop accessibility and living amenities, there is a significant synergistic effect when both are high. However, a negative interaction occurs when one is above average and the other is low. It is plausible because adding bus stops around streets with a concentration of living amenities would help to attract visitors and bring positive effects on vitality. However, when the number of bus stops exceeds 20, there are no obvious effects. This might be explained as high traffic flows caused by transport hubs would not encourage staying activities.
Interaction effects between functional and morphological variables
As shown in Figure 6, there is a weak antagonism between functional entropy and building density when both of them are at low or high levels. This is because it usually represents streets with discontinuous building interfaces or streets located near overcrowded neighborhoods. However, when either increases, synergistic effects occur. Although very little antagonism occurs when the building density is below 0.2 and the functional entropy is above 1.8. The main pattern of interaction between them is asynchronous synergy. That finding also indicates that functional entropy and building density not only have complementary effects but also have mutually restrictive effects at high levels. The same interrelationship can be found between building density and living amenities. When both variables are low, the sample represents a high-rise residential area with more open space, where increasing one of these indicators would be an effective way to vitality-making. Key interactions between functional and morphological features.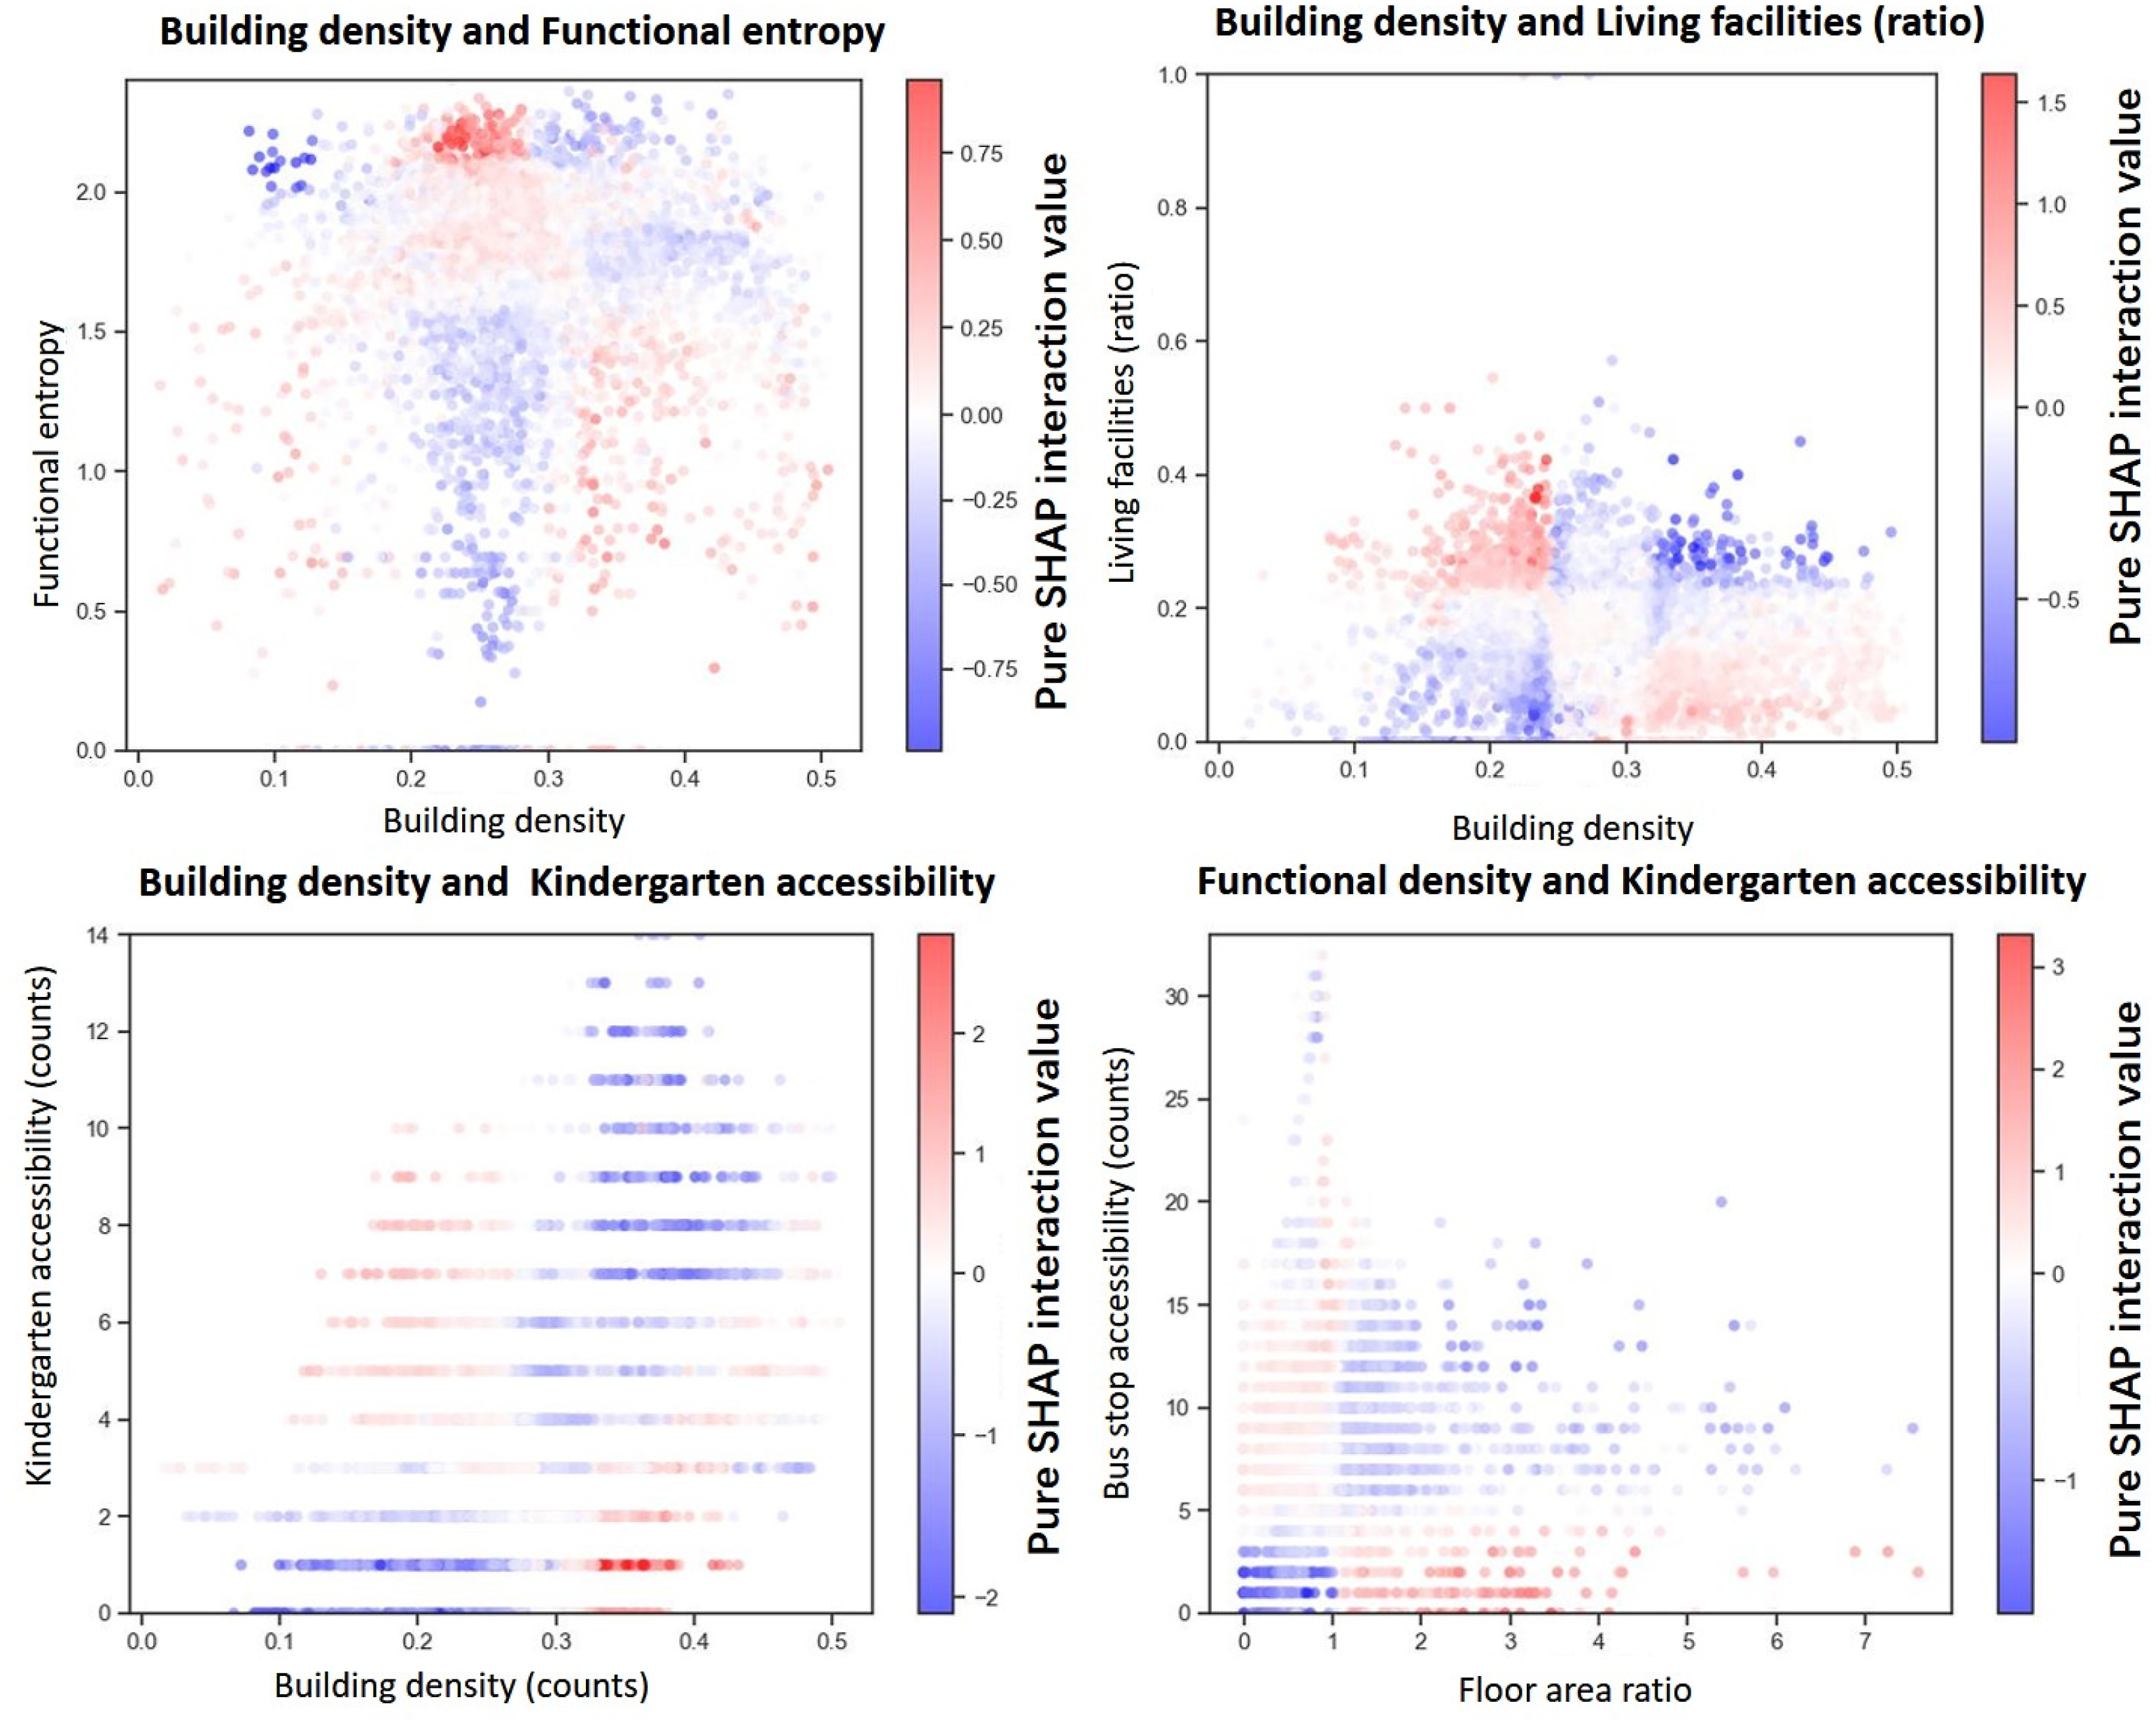
The interactions between building density and kindergarten accessibility and the interactions between floor area ratio and bus stop accessibility both show asynchronous synergies. Both groups have intra-antagonistic effects when their interaction variables are both high or low. This might be explained as the kindergartens and bus stops are important urban services attracting social activities. Thus, the high levels of kindergartens and bus stops may bring overcrowded situations and hinder the role of a densely built environment. Having too many kindergartens near dense built-up areas is not conducive to the making of vitality. Likewise, too many bus stops in areas with high floor area ratio might not contribute to attracting residents' social activities. The results also imply that in areas where both of these interactive indicators are lacking, it is more cost effective to prioritize one of them first.
Discussion
The relative importance and nonlinear effect examination of built environment features
This study brings three groundbreaking insights. First, although on average socio-economic variables are more important than built environment variables, overall the variables of the built environment at the street level have a greater impact on street vitality. Second, functional and morphological characteristics play a dominant role, and the contribution of human-scale factors is weaker but noteworthy. Third, the nonlinear and threshold effects of built environment features on street vitality are common. When most positive indicators such as intersection density, functional diversity, primary school accessibility, and bus stop accessibility exceed a certain threshold, the marginal benefits disappear. For features such as building density and FAR, the positive effects become negative when certain thresholds are exceeded. This emphasizes that urban planners need to find out the effective intervals of each index. Endeavors should be made to allocate spatial resources efficiently under resource-limited conditions.
Deeper understanding of the interactive impact of the built environment and its implications for design practice
This study provides strong evidence for the prevalence of interactions between built environment characteristics. However, it should be noted that additional attention is needed only when the interaction effect is strong. The joint effect of bivariate variables is equal to the sum of the independent main effect of each variable and their pure interaction. Thus, we take the interaction and joint effects of intersection density and functional density as an example, to analyze if their pure interaction is strong enough to cause a change in the trend of their main effect on vitality. As shown in Figure S1, both features show positive effects on street vitality. However, their joint effect shows that there is no additional effect on street vitality as the functional density increases when the intersection density is 0–0.2. The antagonistic effect between the two explains this, that is, low levels of road intersection density inhibit the effect of functional density. Therefore, whether the policy needs to pay particular attention to interaction effects depends on the proportion of the interaction effect relative to the main effect. If it is higher enough, the policy should pay additional attention.
Limitations and next steps
Some shortcomings leave room for future exploration. First, vitality is a broad concept that may not be fully expressed by social activity intensity. Second, future work should develop appropriate nonlinear methods to analyze longitudinal data to establish evidence for causal inference interpretation. Third, the different choices of specific walking distances, that is, 500 m or 400 m, may lead to nonrobust results. Although that was ruled out by robustness tests in this study (Appendix Tables 1–3, Tables 2–3), the specific distances for calculating morphological indicators are best kept consistent. Fourth, interactions not only exist between bivariate variables. The interaction between multiple built environment characteristics is expected to be revealed in the future. Fifth, it is also necessary to explore the mutual influence between urban vitality and the built environment through long-term monitoring of the two aspects.
Conclusions
This study revealed the nonlinear influence of built environment features on street vitality through the GBDT model and SHAP value interpretation method. The contribution is twofold. First, a reasonable allocation of resources should be pursued in planning practice (Xia et al., 2020). By exploring the threshold effects and effective influence range of each environmental indicator, we can provide a basis for setting spatial form indicators in design practice. Second, sustainable urban planning is not an assembly of prefabricated components like Lego blocks but rather an embryo-like growth (Alexander, 2005). Interactions between features of the built environment may change their joint effect trend, making them more effective or less useful. Thus, exploiting the synergistic effects can be more effective in shaping vitality. The findings above are applicable to Chinese cities or eastern Asia countries with similar contexts. However, the model results may be sensitive to different environmental contexts. Thus, it requires further exploration with samples from different countries.
Supplemental Material
Supplemental Material - The nonlinear relationships between built environment features and urban street vitality: A data-driven exploration
Supplemental Material for The nonlinear relationships between built environment features and urban street vitality: A data-driven exploration by Yun Han, Chunpeng Qin, Longzhu Xiao, and Yu Ye in Environment and Planning B: Urban Analytics and City Science.
Footnotes
Acknowledgments
We would like to express our appreciation for the editor and anonymous reviewers for the time and effort they have taken to provide such insightful guidance.
Declaration of conflicting interests
The author(s) declared no potential conflicts of interest with respect to the research, authorship, and/or publication of this article.
Funding
The author(s) disclosed receipt of the following financial support for the research, authorship, and/or publication of this article: This research was funded by the National Natural Science Foundation of China (52078343, 51838002), Natural Science Foundation of Shanghai (20ZR1462200), and Fundamental Research Funds for the Central Universities (22120210540).
Supplemental Material
Supplemental material for this article is available online.
References
Supplementary Material
Please find the following supplemental material available below.
For Open Access articles published under a Creative Commons License, all supplemental material carries the same license as the article it is associated with.
For non-Open Access articles published, all supplemental material carries a non-exclusive license, and permission requests for re-use of supplemental material or any part of supplemental material shall be sent directly to the copyright owner as specified in the copyright notice associated with the article.