
Abstract
This article examines how bicycle commuting is associated with bike lane access and sociodemographic advantage at the block group level in twenty-two U.S. cities. Using regression models with interaction terms, I find that associations between bike lanes and bicycle commuting are stronger among more advantaged block groups, due primarily to limited bicycle commuting in disadvantaged block groups even when bike lanes are present. This indicates the importance of considering heterogeneous effects in planning research and suggests that bike lane investment, in isolation, could widen sociodemographic disparities in cycling and its benefits if non-infrastructure barriers to cycling are not also addressed.
Introduction
Cities have increasingly invested in their bike lane networks over the past decade, given evidence that bike lanes can facilitate cycling (Buehler and Pucher 2012; Dill and Carr 2003) and that cycling, in turn, is associated with potential benefits for the environment (Chapman et al. 2018; Keall et al. 2018; Neves and Brand 2019; Zhang and Mi 2018), the economy (Ma and Ye 2019; Poirier 2018), access to opportunity (Murphy and Owen 2019; Pritchard et al. 2019), and public health (Chapman et al. 2018; Pucher et al. 2010; Singleton 2019; Wanner et al. 2012). Recently, cycling advocates and researchers have suggested that bike lane investments tend to be made in places with greater sociodemographic advantage (Flanagan, Lachapelle, and El-Geneidy 2016; Hirsch et al. 2017; League of American Bicyclists 2013; Tucker and Manaugh 2018; Wang and Lindsey 2017), leading to lower access among low-income populations and people of color who are disproportionately burdened by the very environmental, economic, and health outcomes that cycling could influence (August and Sorkin 2011; Lee, Vojnovic, and Grady 2018; Li, Konisky, and Zirogiannis 2019; Loustaunau and Chakraborty 2019). These observations have led some to argue that investing in a more equitable distribution of bike lanes could help to reduce sociodemographic disparities in cycling and its potential benefits (Rachele et al. 2015), and have subsequently led to the development of new methods for prioritizing bike lane investments in places of lower sociodemographic advantage (Grisé and El-Geneidy 2018; Kent and Karner 2019).
Despite this growing emphasis, the relationship between bike lanes and social equity is complex and important questions remain unresolved. For instance, although bike lanes tend to be positively associated with cycling, few studies have considered whether these associations vary by sociodemographic characteristics such as race, ethnicity, and socioeconomic status (SES) (Smith et al. 2017). This is an important possibility to consider, given that inadequate infrastructure access is just one among many individual, environmental, social, and institutional barriers to cycling that low-income populations and people of color face (Golub 2016). Within this context, bike lanes could have the unintended consequence of increasing sociodemographic disparities in cycling and its benefits if advantaged populations are more likely to use them. Thus, examining potential heterogeneity in associations between bike lanes and cycling is critical for more fully understanding the equity implications of bike lane investment.
I address this research gap by examining cross-sectional, area-level associations between bicycle commuting, sociodemographic advantage, and bike lane presence in twenty-two large central cities in the United States. Using census block groups as the unit of analysis, I conduct a moderation analysis to assess whether associations between bike lane presence and bicycle commuting vary by sociodemographic context. In the sections that follow, I begin by summarizing how sociodemographic characteristics are related to cycling and describe how this relationship is typically treated in cycling research, establishing the value of a moderation approach. I then explain the data and methods used in this analysis and how they are equipped to address the relationships of interest. Finally, I present the results and discuss their implications, both for the broader planning literature and for cycling research in particular. Broadly, the findings illustrate the importance of considering social heterogeneity in the study of planning phenomena. Specifically, the findings provide insight into the complex relationship between bike lanes and social equity, suggesting the potential for infrastructure investment to widen the gap in cycling and its outcomes between places of higher and lower sociodemographic advantage if non-infrastructure barriers to cycling are not also addressed.
Sociodemographic Advantage and Cycling: Connections and Methods
Measures of sociodemographic advantage have recently been used to address two questions relevant to social equity in cycling: Who cycles, and who has access to cycling infrastructure? Answers to the first question have been mixed, with some studies finding levels of cycling to be lower among those with relatively low income and educational attainment (Adams 2010; Mäkinen et al. 2008; Rachele et al. 2015) and others finding levels of cycling to be higher in the context of individual- and neighborhood-level disadvantage (Jurakić, Pedišić, and Andrijašević 2009; League of American Bicyclists 2013; Van Dyck et al. 2010). Longitudinal analyses have provided further insight into the sociodemographic composition of cycling over time, indicating that growth in cycling over the past decade has tended to be fastest among low-income populations and people of color (League of American Bicyclists 2013).
Recent research has added depth and context to this work by considering the second question—that is, by examining sociodemographic disparities in access to cycling infrastructure. This research has generally found that access to bike lanes, urban trails, and low-stress cycling routes tends to be greater among more advantaged populations, with some exceptions and variations across cities (Braun, Rodriguez, and Gordon-Larsen 2019; Tucker and Manaugh 2018; Wang and Lindsey 2017; Winters et al. 2018). Similarly, longitudinal analyses have found that investments in bike lanes and trails tend to occur disproportionately in areas that are more advantaged to begin with or increasing in advantage (e.g., gentrifying) over time (Flanagan, Lachapelle, and El-Geneidy 2016; Hirsch et al. 2017). Others have observed sociodemographic disparities in access to bicycle sharing stations (Babagoli et al. 2019; Clark and Curl 2016; Hosford and Winters 2018), corresponding with related research that has found bicycle sharing program users to be disproportionately white, wealthy, and highly educated (Gavin et al. 2016; Heinen, Kamruzzaman, and Turrell 2018).
In light of these findings, advocates and scholars alike have recently called for more equitable patterns of investment in cycling infrastructure such as bike lanes (Babagoli et al. 2019; Grisé and El-Geneidy 2018; Hosford and Winters 2018; Kent and Karner 2019; League of American Bicyclists 2013; Rachele et al. 2015; Wang and Lindsey 2017; Winters et al. 2018). These calls have been based in part upon evidence that bike lanes are positively associated with cycling (Buehler and Pucher 2012; Dill and Carr 2003) and inversely associated with the risk of bicycle crashes (Marshall and Ferenchak 2019; Park et al. 2015), suggesting that a more equitable distribution of bike lanes could facilitate higher levels of cycling among disadvantaged populations while enhancing safety for those who already cycle.
Despite this potential, limited quantitative research has critically considered whether bike lane investment can adequately support cycling in diverse sociodemographic contexts. Indeed, most quantitative research on cycling behavior has treated sociodemographic characteristics as secondary control variables, allowing for greater focus on determinants such as bike lanes that are of more primary interest (Adkins et al. 2017; Cao, Mokhtarian, and Handy 2009). Few have instead considered the potential moderating influence of sociodemographic characteristics—that is, how associations between bike lanes and cycling themselves may vary by characteristics such as race, ethnicity, and SES. Notable exceptions include Goodman, Sahlqvist and Ogilvie (2013), who found that individuals with lower educational attainment and income were less likely to use new cycling routes in three U.K. cities; Goodman, Panter, et al. (2013), who found that the impacts of cycling interventions in eighteen U.K. cities tended to be stronger in socioeconomically deprived areas; and Parker, Gustat, and Rice (2011), who found that the ridership impacts of a new bike lane in New Orleans did not vary by race or ethnicity. There is value in expanding this area of the literature by continuing to foreground sociodemographic characteristics, as understanding how the determinants of cycling vary across sociodemographic groups could inform more equitable and contextually appropriate cycling promotion strategies.
A precedent for this type of moderation analysis can be found in recent research on the built environment and walking behavior. Adkins et al. (2017) reviewed seventeen studies and found that in thirteen, associations between the built environment and walking behavior were up to two times stronger among groups that were advantaged in terms of race, ethnicity, and educational attainment, relative to disadvantaged groups. To understand these differences, the authors noted that the impacts of the built environment on walking behavior may be stronger for advantaged groups for two primary reasons: (1) disadvantaged groups may walk more than advantaged groups in unsupportive environments and (2) disadvantaged groups may walk less than advantaged groups in supportive environments. These two factors, in combination with measurement error, could make it appear as though associations between the built environment and walking behavior are weaker in the context of sociodemographic disadvantage.
Figure 1 applies this concept to the case of cycling and forms the analytical framework for the present analysis. In this figure, a theoretically positive association between bike lanes and cycling is represented by the dashed black line. This association tends to be made stronger by observations (e.g., people, places) that fall into the two white quadrants that represent “expected” behavior (i.e., low levels of cycling where access to bike lanes is low, high levels of cycling where access to bike lanes is high). The association could be made weaker, however, by observations that fall into the two shaded quadrants that represent “unexpected” behavior—that is, by high levels of cycling even in the absence of bike lanes (quadrant (a)) and low levels of cycling even when bike lanes are present (quadrant (b)). If observations characterized by sociodemographic disadvantage are disproportionately likely to fall into either of these quadrants, associations between bike lanes and cycling could appear to be weaker for these observations relative to those with greater sociodemographic advantage.
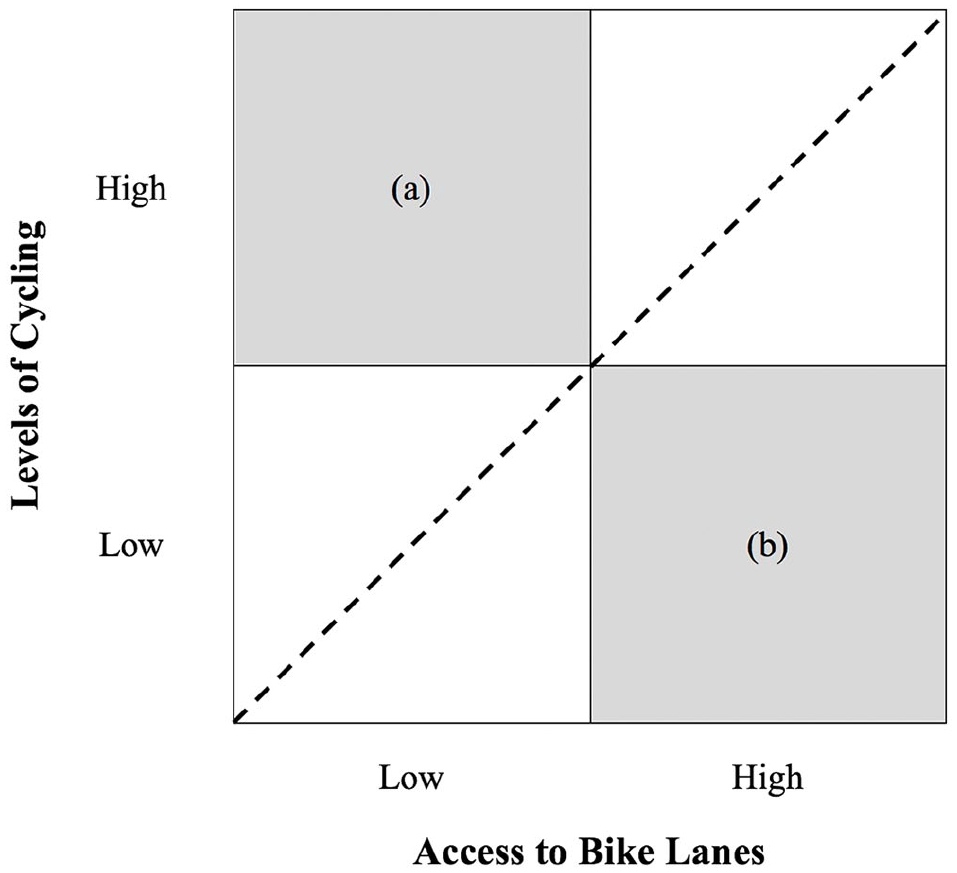
Conceptual framework for analysis.
There are several reasons to expect either of these possibilities. First, disadvantaged groups may cycle more than advantaged groups even in the absence of bike lanes (quadrant (a)) in Figure 1—due to constraints or preferences. Low-SES populations tend to have lower rates of vehicle ownership (Blumenberg and Pierce 2012) and may therefore be constrained to other travel modes such as cycling, even when bike lanes are not available. Alternatively, while cycling is not universally seen as a desired activity (Golub 2016), it is possible that disadvantaged populations prefer to cycle and will do so in the absence of environmental supports. As previously noted, some researchers have found levels of cycling to be relatively high among disadvantaged populations and communities (Jurakić, Pedišić, and Andrijašević 2009; League of American Bicyclists 2013; Van Dyck et al. 2010). These patterns, combined with evidence that bike lanes are less likely to be located in disadvantaged neighborhoods (Flanagan, Lachapelle, and El-Geneidy 2016; Hirsch et al. 2017; League of American Bicyclists 2013; Tucker and Manaugh 2018; Wang and Lindsey 2017; Winters et al. 2018), suggest that disadvantaged groups may cycle more than advantaged groups in the absence of supportive infrastructure, potentially contributing to attenuated associations between bike lanes and cycling.
Second, disadvantaged groups may cycle less than advantaged groups even in the presence of bike lanes (quadrant (b)) in Figure 1—due to non-infrastructure barriers to cycling. Adkins et al. (2017) found more empirical support for this explanation in their review of pedestrian research, attributing this finding in part to a lack of other supports for walking even in places that are objectively “walkable” according to traditional built environment measures. Applying this possibility to the present analysis, levels of cycling could be low even in the presence of bike lanes because inadequate infrastructure is just one of many barriers to cycling faced by low-income populations and people of color. Individual barriers may be financial and logistical in nature, as the costs of owning and maintaining a bicycle can be significant (Community Cycling Center 2012), disadvantaged groups may have lower access to secure bicycle parking (Lusk et al. 2017), and the suburbanization of poverty has led to longer commutes for low-income populations (Howell and Timberlake 2014). Other barriers may be environmental, as disadvantaged neighborhoods tend to experience disproportionate traffic safety risks (Ferenchak and Marshall 2019) and may lack other built environment features that support active transportation even if bike lanes are present (Kelly et al. 2007). Potential social barriers include fears of crime, discrimination, and racial profiling while cycling (Lubitow 2017), as well as social norms that often frame cycling as a predominantly white, high-SES mode of travel (Golub 2016; Sarrica et al. 2019). These barriers are related to institutional factors—such as the underrepresentation of low-income populations and people of color in decision making (Golub 2016) and the frequent framing of bike lane investment as an economic development strategy consistent with gentrification (Ibsen and Olesen 2018; Lubitow, Zinschlag, and Rochester 2016)—that lead to disadvantaged populations being excluded or disengaged from processes of bicycle planning and advocacy. Given these non-infrastructure barriers, bike lanes in isolation could appear to be a relatively weak determinant of cycling among disadvantaged groups.
To build upon this area of the literature, I ask the following primary research question:
Based on the findings of Adkins et al. (2017) with respect to the built environment and walking behavior, I expect to find that associations between bike lane presence and bicycle commuting are stronger among more advantaged block groups and correspondingly weaker among less advantaged block groups. I also use the conceptual framework presented in Figure 1 to add depth to these findings and to explore potential explanations in line with existing literature on social equity in cycling.
Data and Variables
Study Sample
I examined cross-sectional associations between bicycle commuting, sociodemographic advantage, and bike lane presence in twenty-two large central cities in the United States, with all variables aggregated to the census block group level. I began with the primary cities of the twenty-five most populous U.S. metropolitan areas (based on one-year estimates from the 2015 American Community Survey [ACS]) and excluded three cities—Baltimore, MD; St. Louis, MO; and Riverside, CA—for which current bike lane data could not be obtained. I selected all block groups whose centroids fell within the city limits of the remaining twenty-two cities (n = 23,003) and then excluded those with missing data on one or more variables of interest for this analysis, n = 1,251 (5%) excluded. The final study sample thus consisted of n = 21,752 block groups across the twenty-two cities displayed in Figure 2.
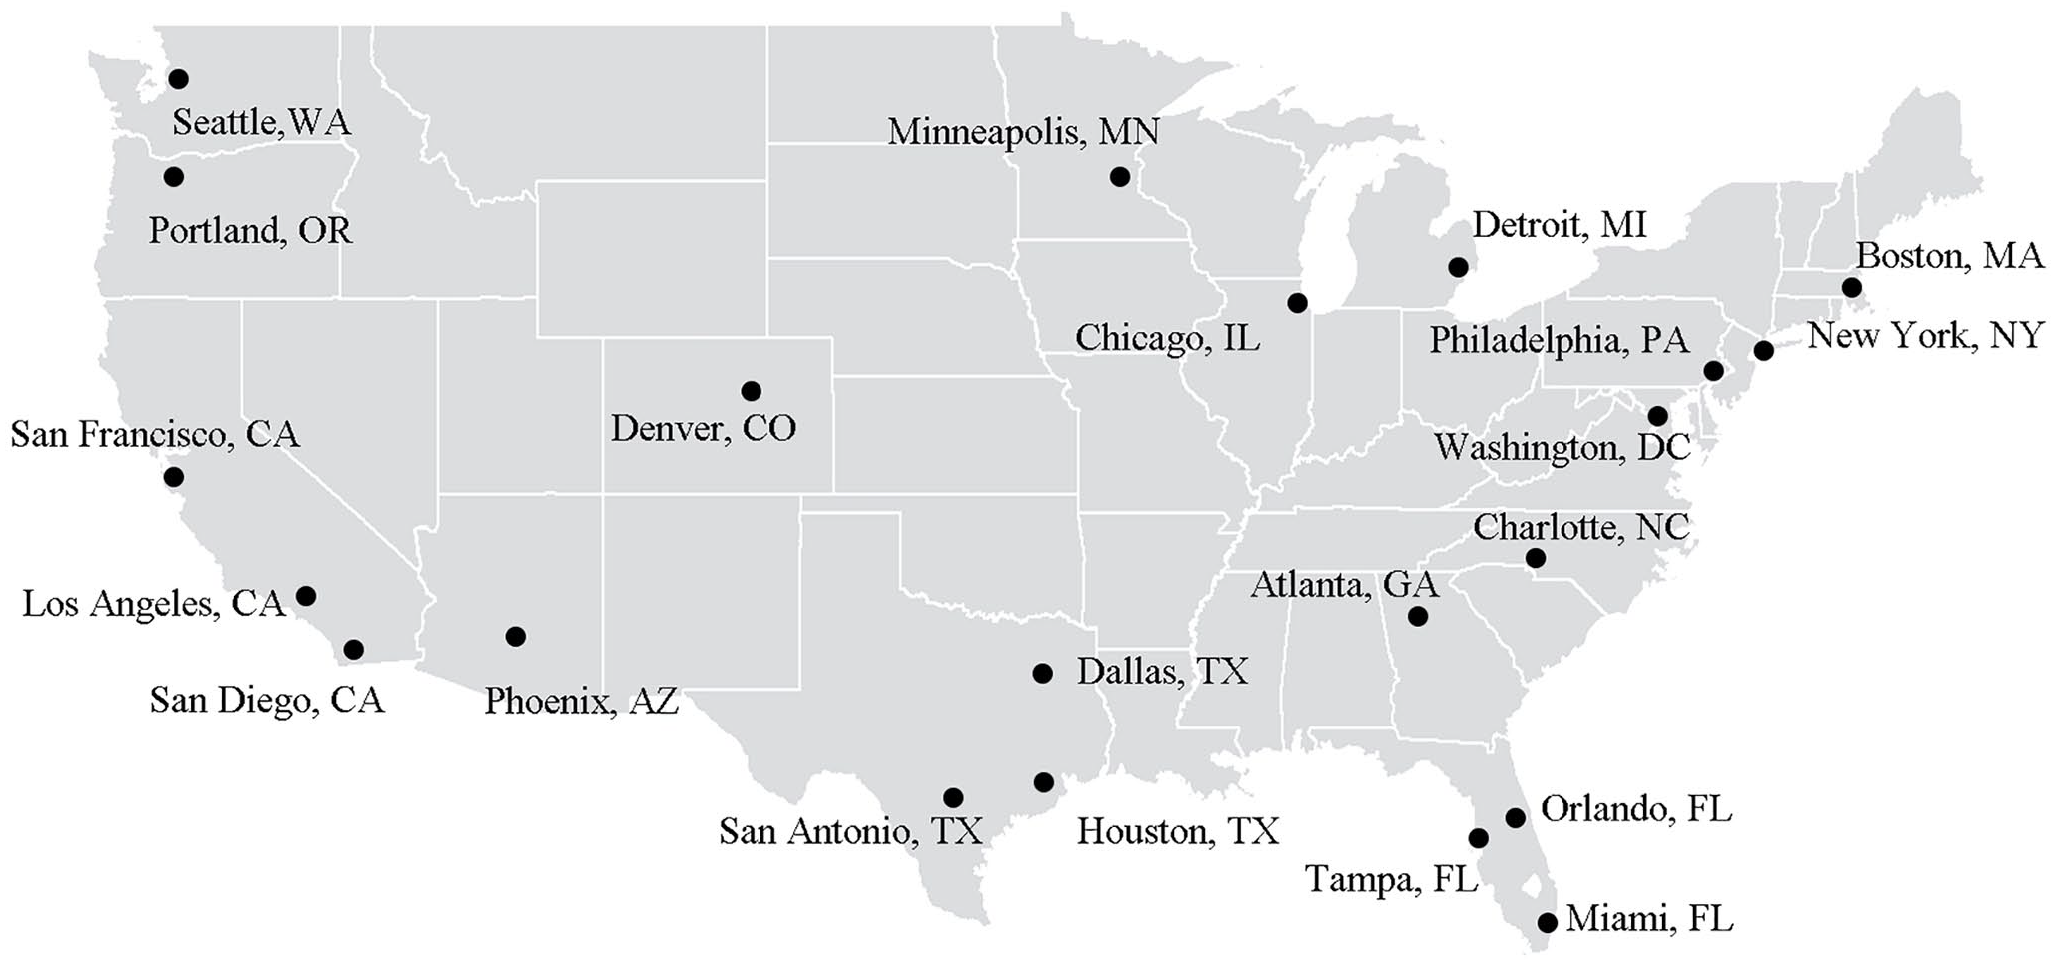
Map of cities included in analysis.
Data Sources
Block group–level data on bicycle commuting and sociodemographic advantage were collected from the 2012–2016 ACS. Block group–level data on covariates were collected from the 2012–2016 ACS and the 2014 Longitudinal Employer–Household Dynamics data. Bike infrastructure data came from city-specific GIS shapefiles, which I collected from local and regional administrative sources (e.g., open data repositories, other government websites) in each city or through email correspondence with local planners when shapefiles were not available online. The dates of the twenty-two shapefiles correspond with the date range of the ACS data used for this analysis (i.e., 2012–2016), although the majority were dated between 2014 and 2016.
As each city used a unique classification system to describe its infrastructure, I reviewed each shapefile alongside Google Earth imagery to determine how various infrastructure types (e.g., trails, lanes, sharrows, routes) and statuses (e.g., planned vs. existing) were coded in the attribute fields. I used this information to consistently classify infrastructure types across all cities and to retain only existing on-street bike lanes (unprotected, buffered, or protected) from each shapefile. I spatially joined the resulting bike lane data to the block groups in my study sample, buffering block groups by ten meters to allow bike lanes along boundaries to be joined with all block groups sharing those boundaries.
Variables
Dependent variable: Bicycle commuting
The dependent variable was a measure of bicycle commuting derived from the ACS, which asked respondents to report the travel mode they generally used for their journey to work during the previous week; respondents who used multiple modes were asked to select the single mode used for the greatest distance. I used this information to measure the percentage of workers in each block group who reported commuting to work by bicycle. Given that a substantial proportion (69%) of block groups had no bicycle commuters, I defined the dependent variable as binary (1 if any bicycle commuters, 0 if none) in the main analysis and tested a continuous definition in a sensitivity analysis.
Primary independent variables: Bike lane presence and sociodemographic advantage
The primary independent variables of interest for this analysis were block group–level measures of bike lane presence and sociodemographic advantage. To measure bike lane access, I created a binary measure of bike lane presence indicating whether a block group contained any bike lanes (1 if any, 0 if none). For descriptive purposes and in a sensitivity analysis testing an alternative definition of bike lane access, I also created a continuous measure of bike lane density in meters per square mile of land area.
I measured a variety of sociodemographic characteristics to capture multiple dimensions of (dis)advantage. First, I measured the following five characteristics as separate variables: percentage non-Hispanic Black, percentage Hispanic or Latino, percentage below the federal poverty line, median household income, and percentage with a bachelor’s degree or more. Second, I estimated a composite SES index based on the methodology of Christine et al. (2015). This process involved performing a factor analysis on seventeen ACS variables related to race, ethnicity, income, educational attainment, poverty, housing, and employment. The first factor was weighted heavily (i.e., rotated factor loading > 0.4) on the nine variables listed in Table 1. I used z-scores to standardize each of these nine variables and then combined them into a single additive index, applying the rotated factor loadings as weights. The values of the resulting index ranged from approximately −14 to +16, with higher values reflecting higher SES.
Components of Additive Socioeconomic Status Index.
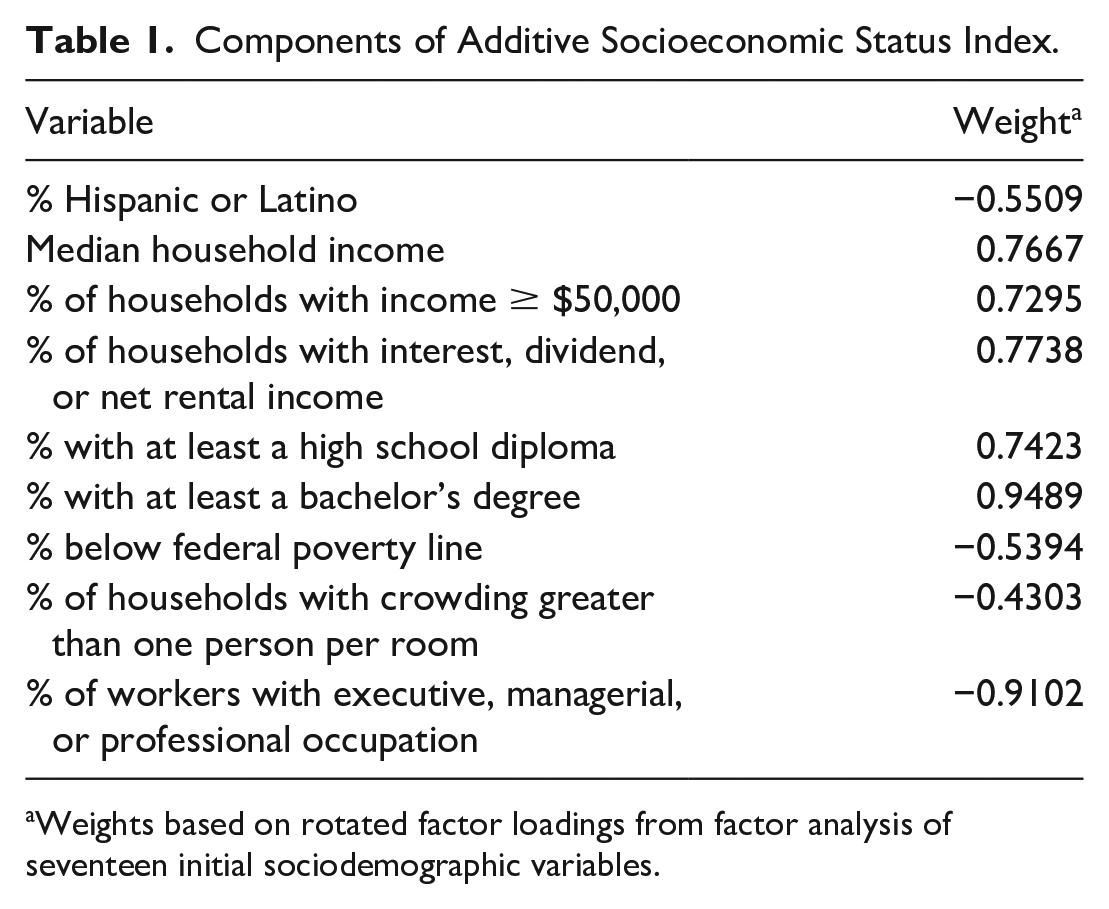
Weights based on rotated factor loadings from factor analysis of seventeen initial sociodemographic variables.
Covariates: Urban form and population age structure
To account for other factors that may influence bicycle commuting, I measured several covariates describing urban form and population age structure. Specifically, I accounted for urban form through measures of population density (persons/mile2), employment density (jobs/mile2), and distance to downtown (city hall); and for population age structure by measuring the percentage of block group residents between ages eighteen and thirty-four.
Method
Descriptive Analysis
First, I used descriptive statistics and corresponding statistical tests (analysis of variance [ANOVA], χ2) to examine the characteristics of the study sample and to identify potential differences between block groups with zero versus non-zero shares of bicycle commuting. Although this descriptive analysis did not adjust for covariates, it provided a preliminary understanding of potential disparities in bicycle commuting in the study sample.
Regression Analysis
Next, I estimated a set of logistic regression models to examine how bicycle commuting (binary dependent variable) was associated with sociodemographic advantage and bike lane presence (independent variables), adjusting for covariates. I accounted for the hierarchical structure of the data by estimating logistic multilevel mixed-effects (MLME) regression models with two levels (block groups nested within cities) and clustering all standard errors at the city level. This approach helped to account for the potential similarity, and thus spatial dependence, between block groups located within the same city.
The regression models included a categorical-by-continuous interaction term between bike lane presence (binary) and the sociodemographic characteristic of interest (continuous), which allowed for a moderation analysis—that is, the coefficients from these models could be used to assess whether associations between bike lane presence and bicycle commuting varied by level of sociodemographic advantage. I estimated a separate logistic regression model for each sociodemographic characteristic using the specification in equation (1):
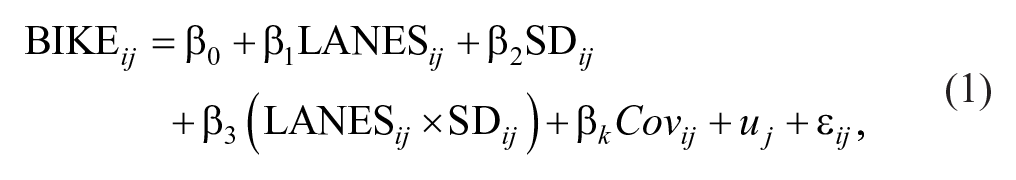
where i indexes block groups, j indexes cities, and
Due to the interaction term, the primary coefficients of interest from these models—
Additional and Sensitivity Analyses
I conducted two additional analyses to further examine the regression results. First, to test alternative explanations for the observed regression results, I calculated the percentage of disadvantaged block groups that fell within the (a) and (b) quadrants of Figure 1 (i.e., block groups that had bicycle commuters but no bike lanes, and block groups that had bike lanes but no bicycle commuters). In this process, I defined disadvantaged block groups as those that fell below the median values of all six sociodemographic characteristics considered in this analysis, although I also tested alternative definitions framed around the median value of each separate sociodemographic characteristic. Second, I examined the random effects parameters and intraclass correlation coefficients (ICCs) from each regression model to more fully consider city-level variations in bicycle commuting.
I also conducted three sensitivity analyses to test the robustness of the results. To assess whether the findings were primarily applicable to cities with high levels of bicycle commuting, I tested an alternative version of the study sample restricted to seven cities in the data that were among the “top 10” cities with the highest bicycle commuting mode shares in 2016 (Alliance for Biking & Walking 2016). Next, I re-estimated the regressions using bike lane density as an alternative measure of bike lane access. Given that 57 percent of block groups had no bike lanes, I estimated these models for the full sample (predicting bicycle commuting as a function of binary bike lane presence [any vs. none]) and then for the subsample of block groups that contained any bike lanes (predicting bicycle commuting as a function of continuous bike lane density). Third, to incorporate information about the level (rather than the presence or absence) of bicycle commuting, I re-estimated equation (1) using two-part models, including (1) a logistic MLME regression modeling the likelihood of having any bicycle commuting (identical to the main models used in this analysis) and (2) a linear MLME regression modeling the amount of bicycle commuting among block groups that had any.
Results
Descriptive Analysis
On average, 1.4 percent of workers across all block groups commuted to work by bicycle (Table 2). This mode share is greater than the national average of 0.6 percent (U.S. Census Bureau 2016), reflecting higher levels of cycling in the large cities that were the focus of this analysis. Approximately 70 percent of block groups had no bicycle commuters; among the remaining block groups with any bicycle commuters, the average bicycle commuting mode share was 4.51 percent.
Descriptive Statistics, Total and by Bicycle Commuting Mode Share, 21,752 Block Groups in Twenty-Two U.S. Cities.
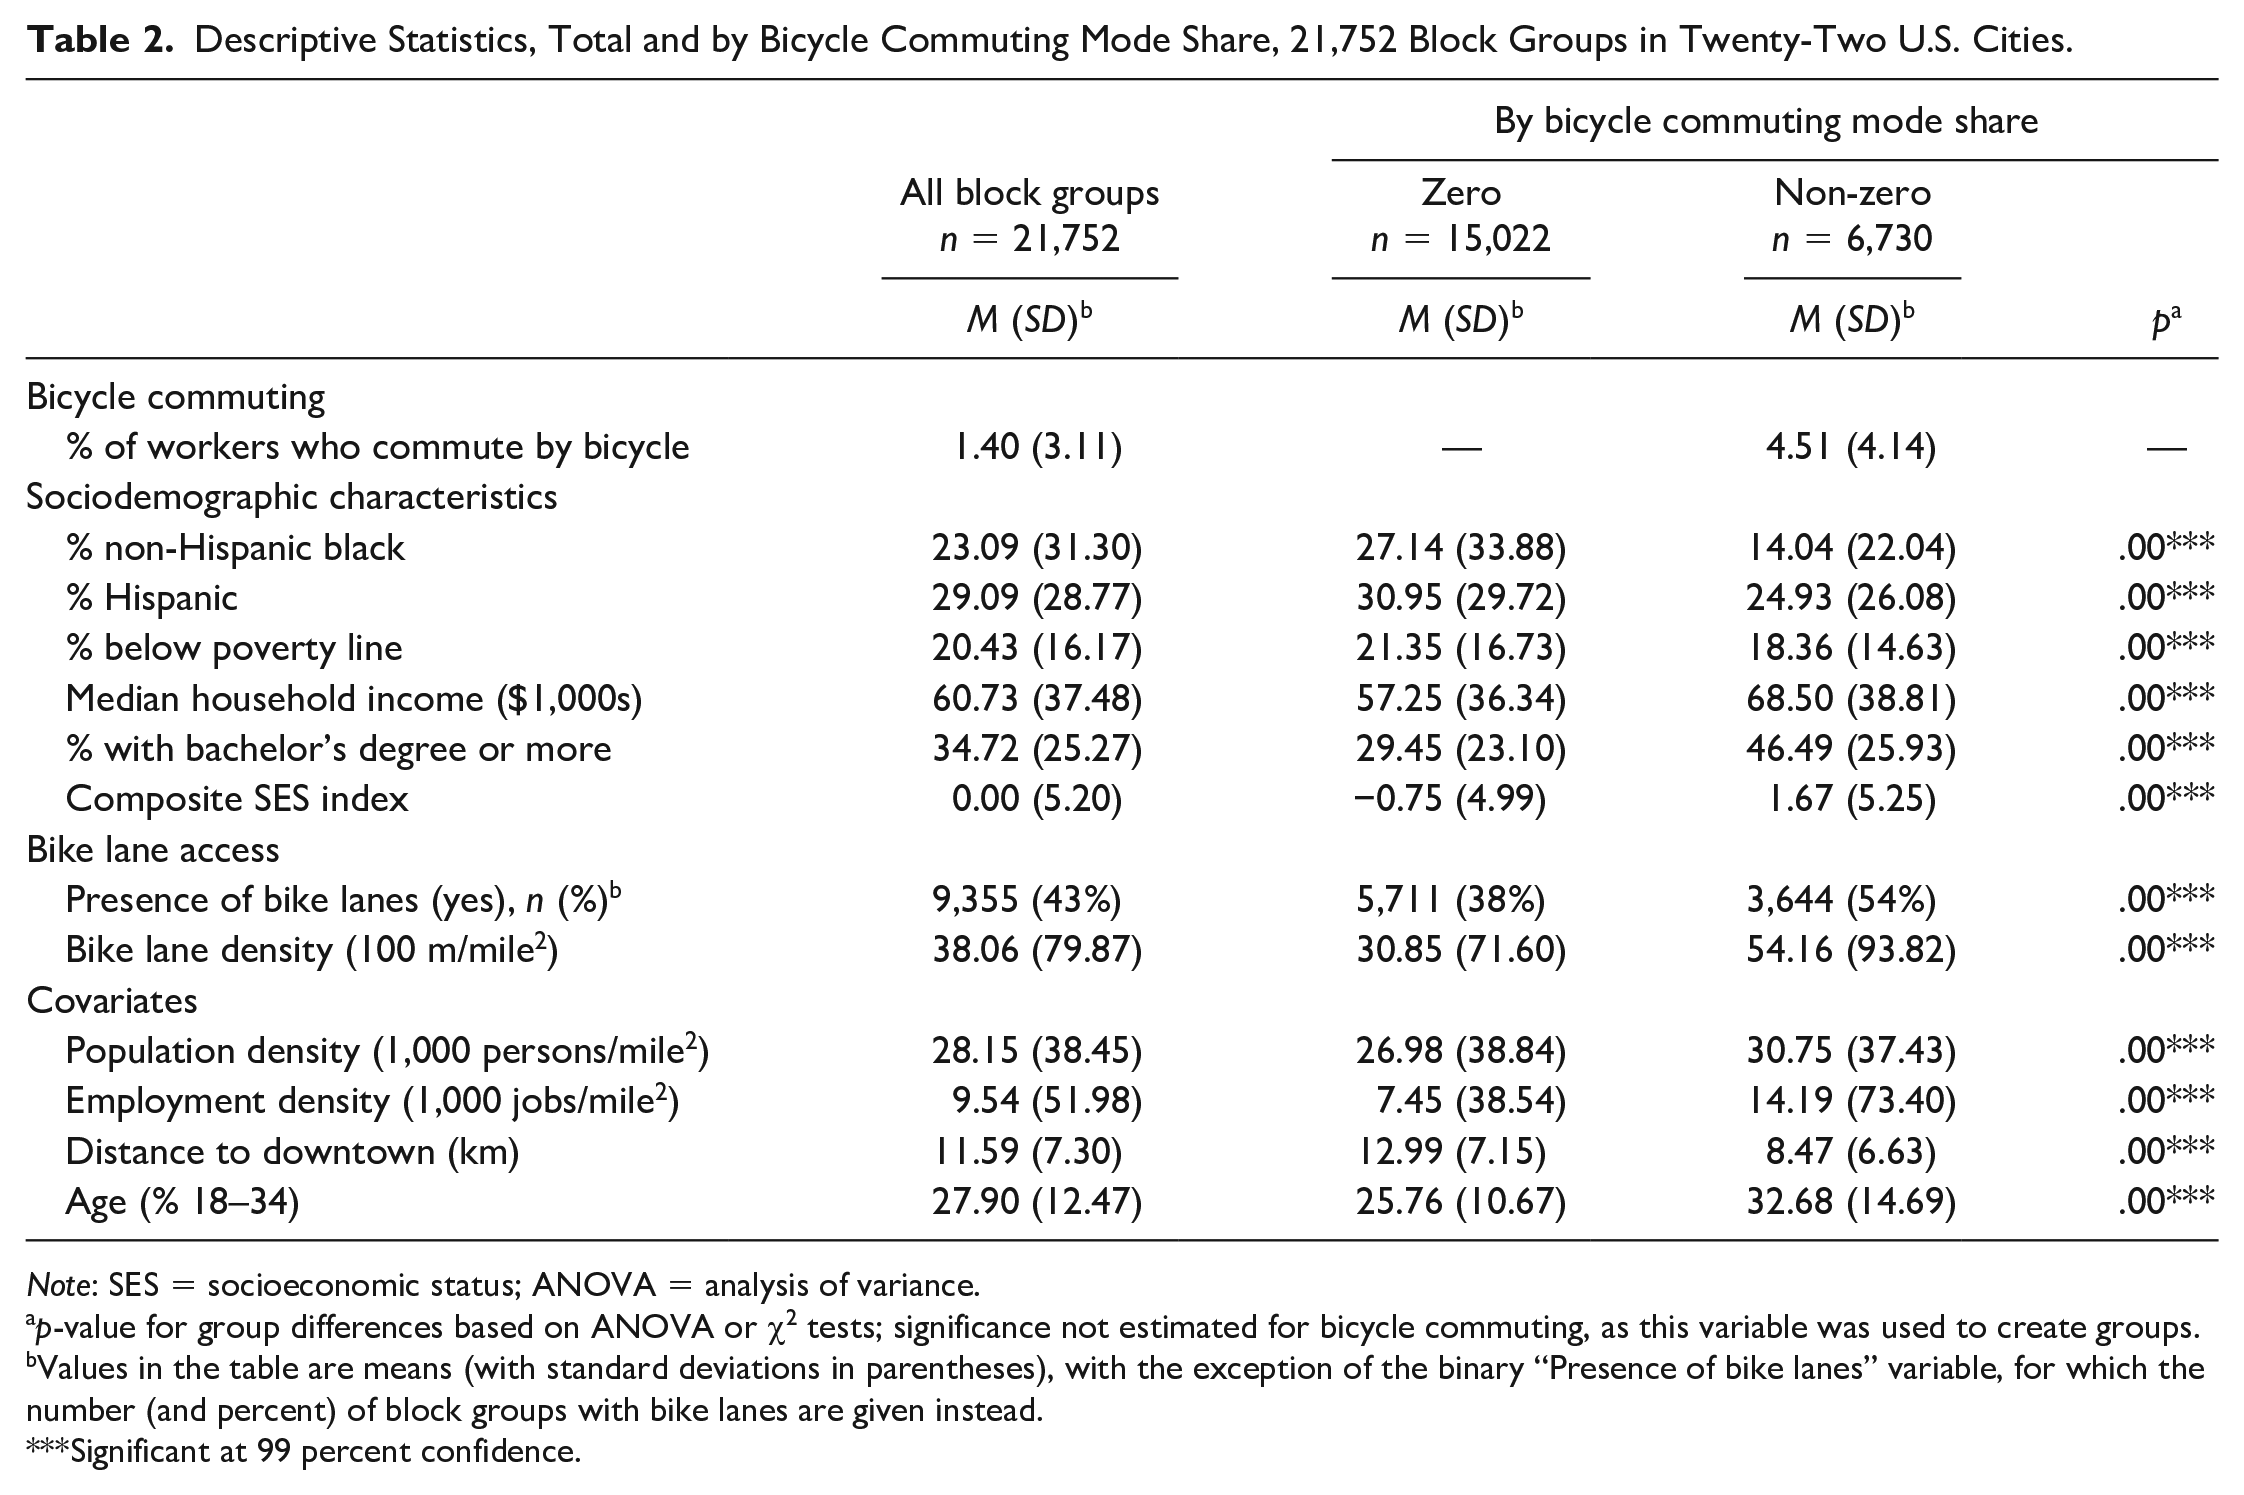
Note: SES = socioeconomic status; ANOVA = analysis of variance.
p-value for group differences based on ANOVA or χ2 tests; significance not estimated for bicycle commuting, as this variable was used to create groups.
Values in the table are means (with standard deviations in parentheses), with the exception of the binary “Presence of bike lanes” variable, for which the number (and percent) of block groups with bike lanes are given instead.
Significant at 99 percent confidence.
Block groups with any bicycle commuting were significantly different from block groups with no bicycle commuting on all independent variables considered in this analysis. Compared to block groups with no bicycle commuting, those with any bicycle commuting had lower percentages of non-Hispanic Black and Hispanic residents; lower poverty levels; and higher median household income, educational attainment, and composite SES. Block groups with bicycle commuting were also more likely to have bike lanes; had a higher density of bike lanes; had higher population and employment densities and percentages of young residents; and were closer to downtown.
Regression Analysis
In adjusted regression models (Table 3), the coefficient on bike lane presence
Adjusted Associations of Any Bicycle Commuting (Yes/No) with Sociodemographic (SD) Characteristics and Bike Lane Access (LANES), 21,752 Block Groups in Twenty-Two U.S. Cities.
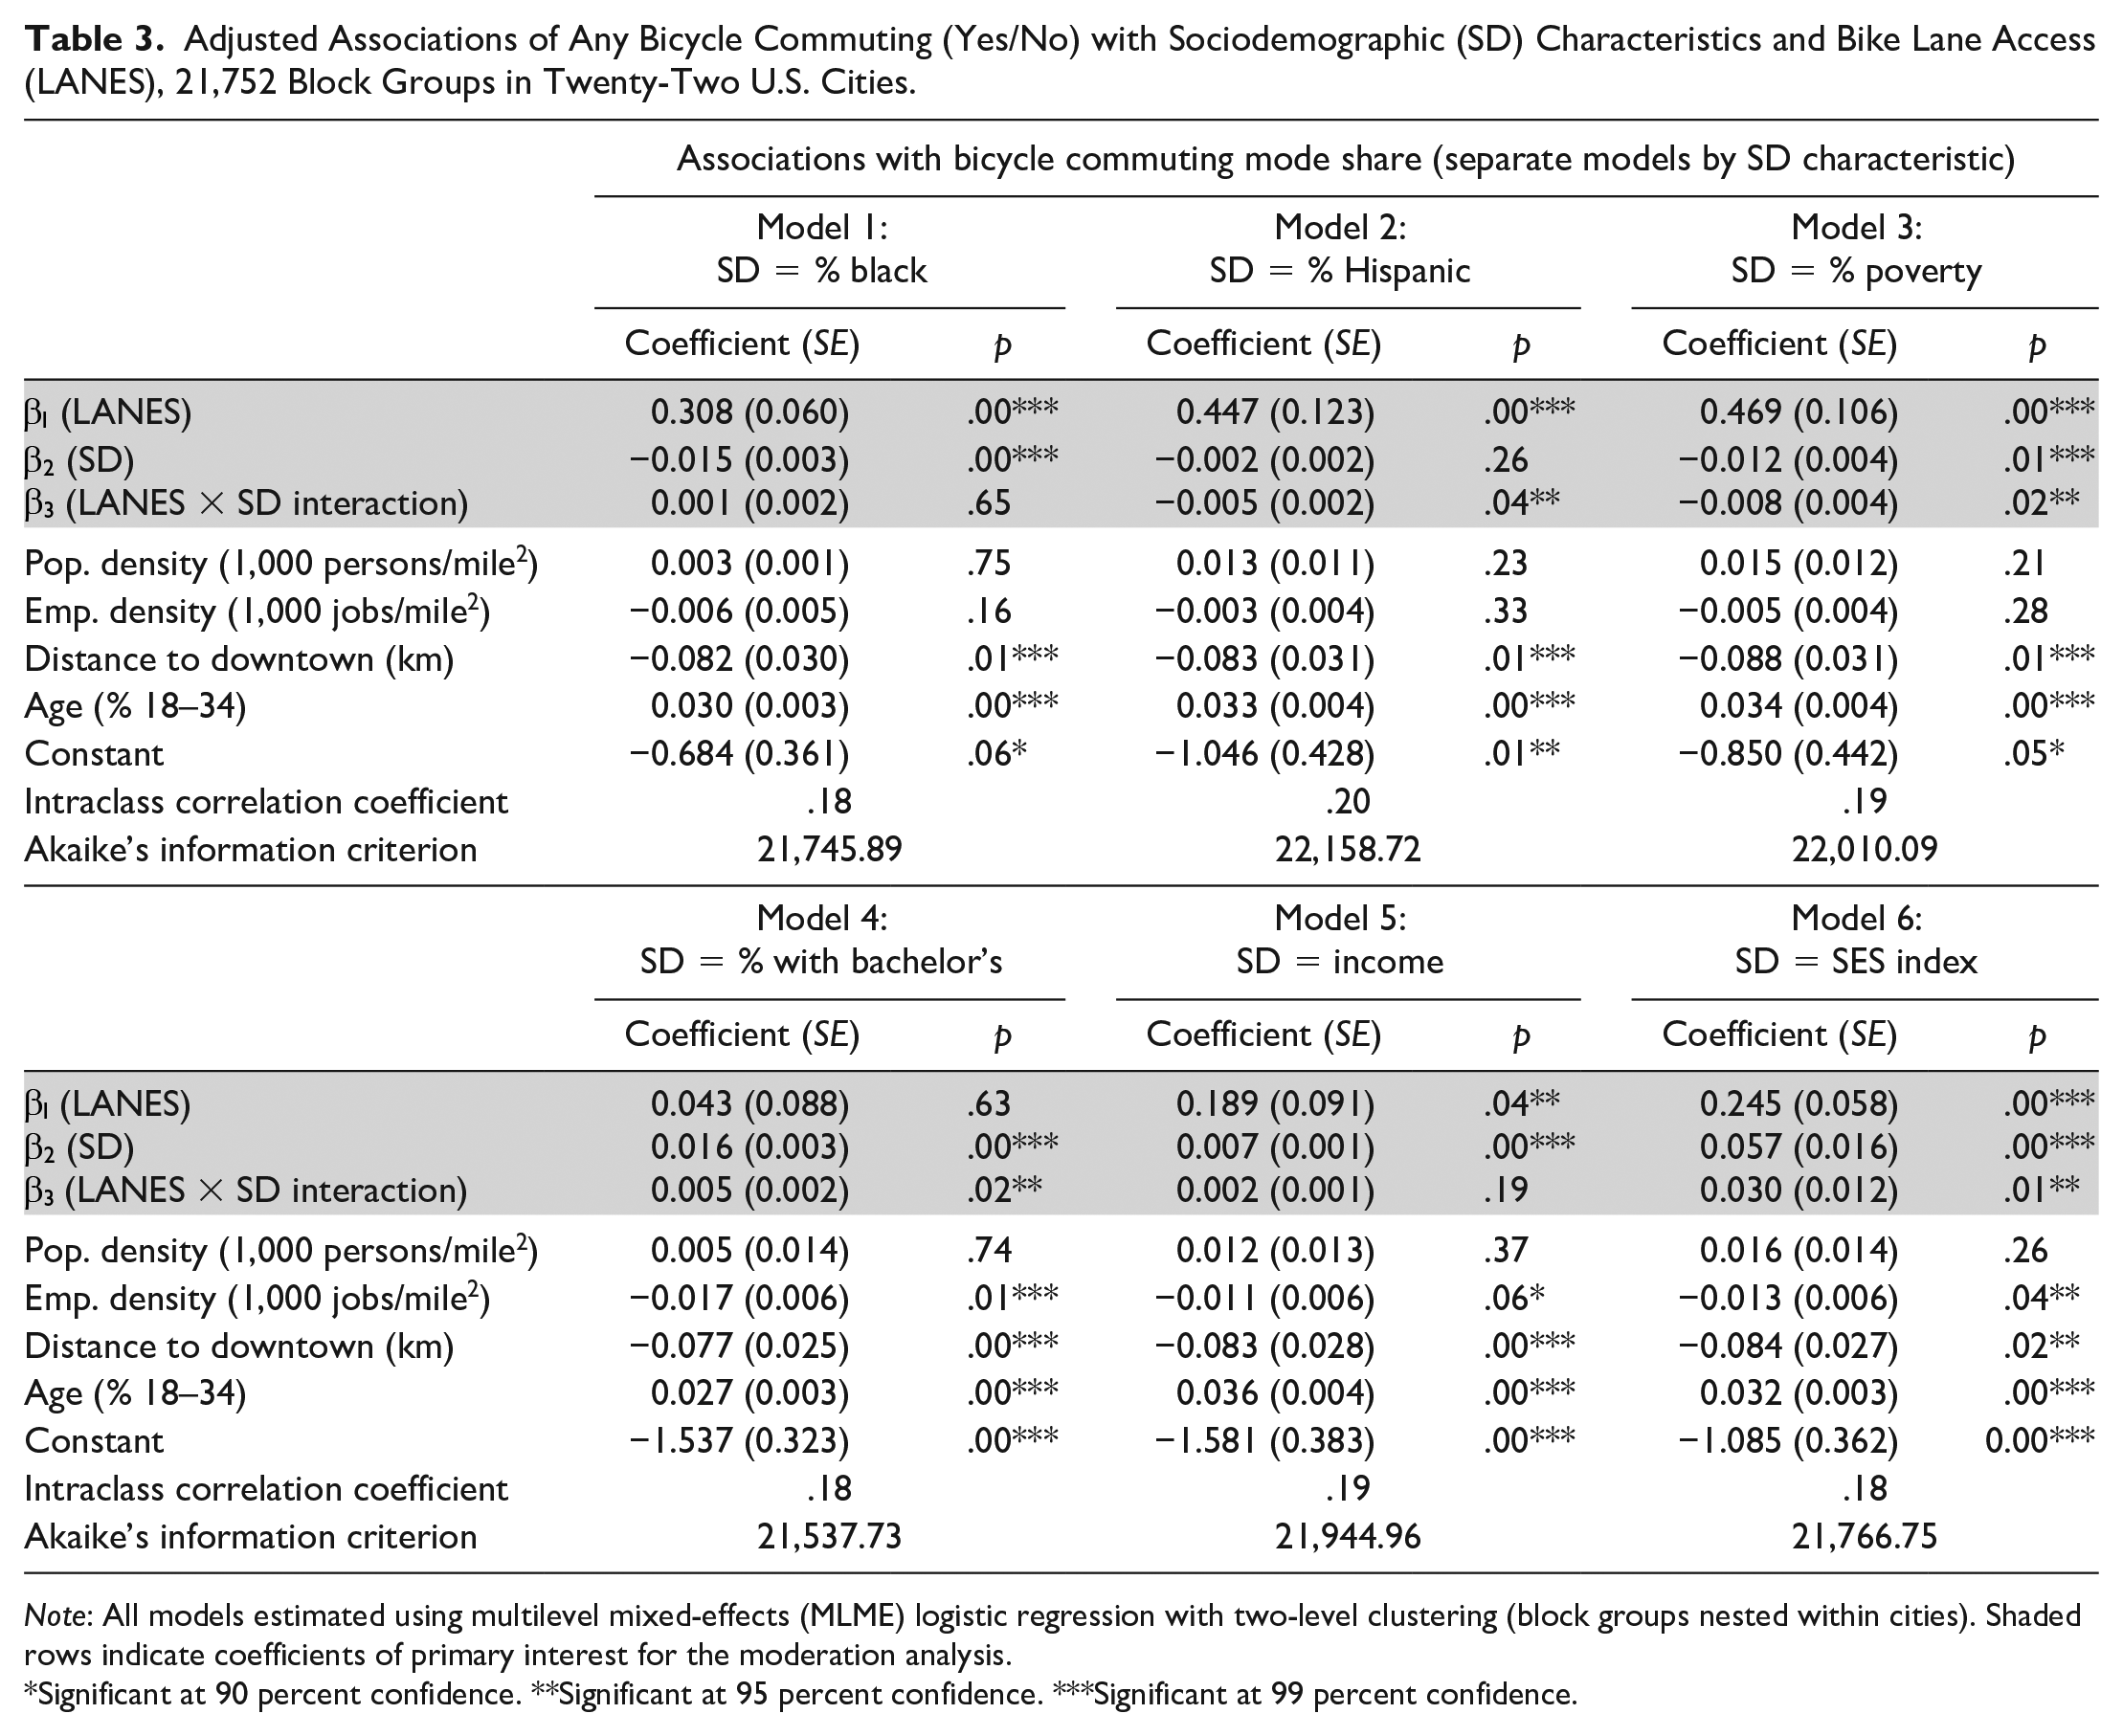
Note: All models estimated using multilevel mixed-effects (MLME) logistic regression with two-level clustering (block groups nested within cities). Shaded rows indicate coefficients of primary interest for the moderation analysis.
Significant at 90 percent confidence. **Significant at 95 percent confidence. ***Significant at 99 percent confidence.
These associations can be seen more clearly in Figure 3, which translates the coefficients from Table 3 into predicted probabilities of bicycle commuting. This exercise is important not only for understanding the nature of the significant interactions but also for more fully understanding the other regression coefficients; indeed, due to the interaction term,
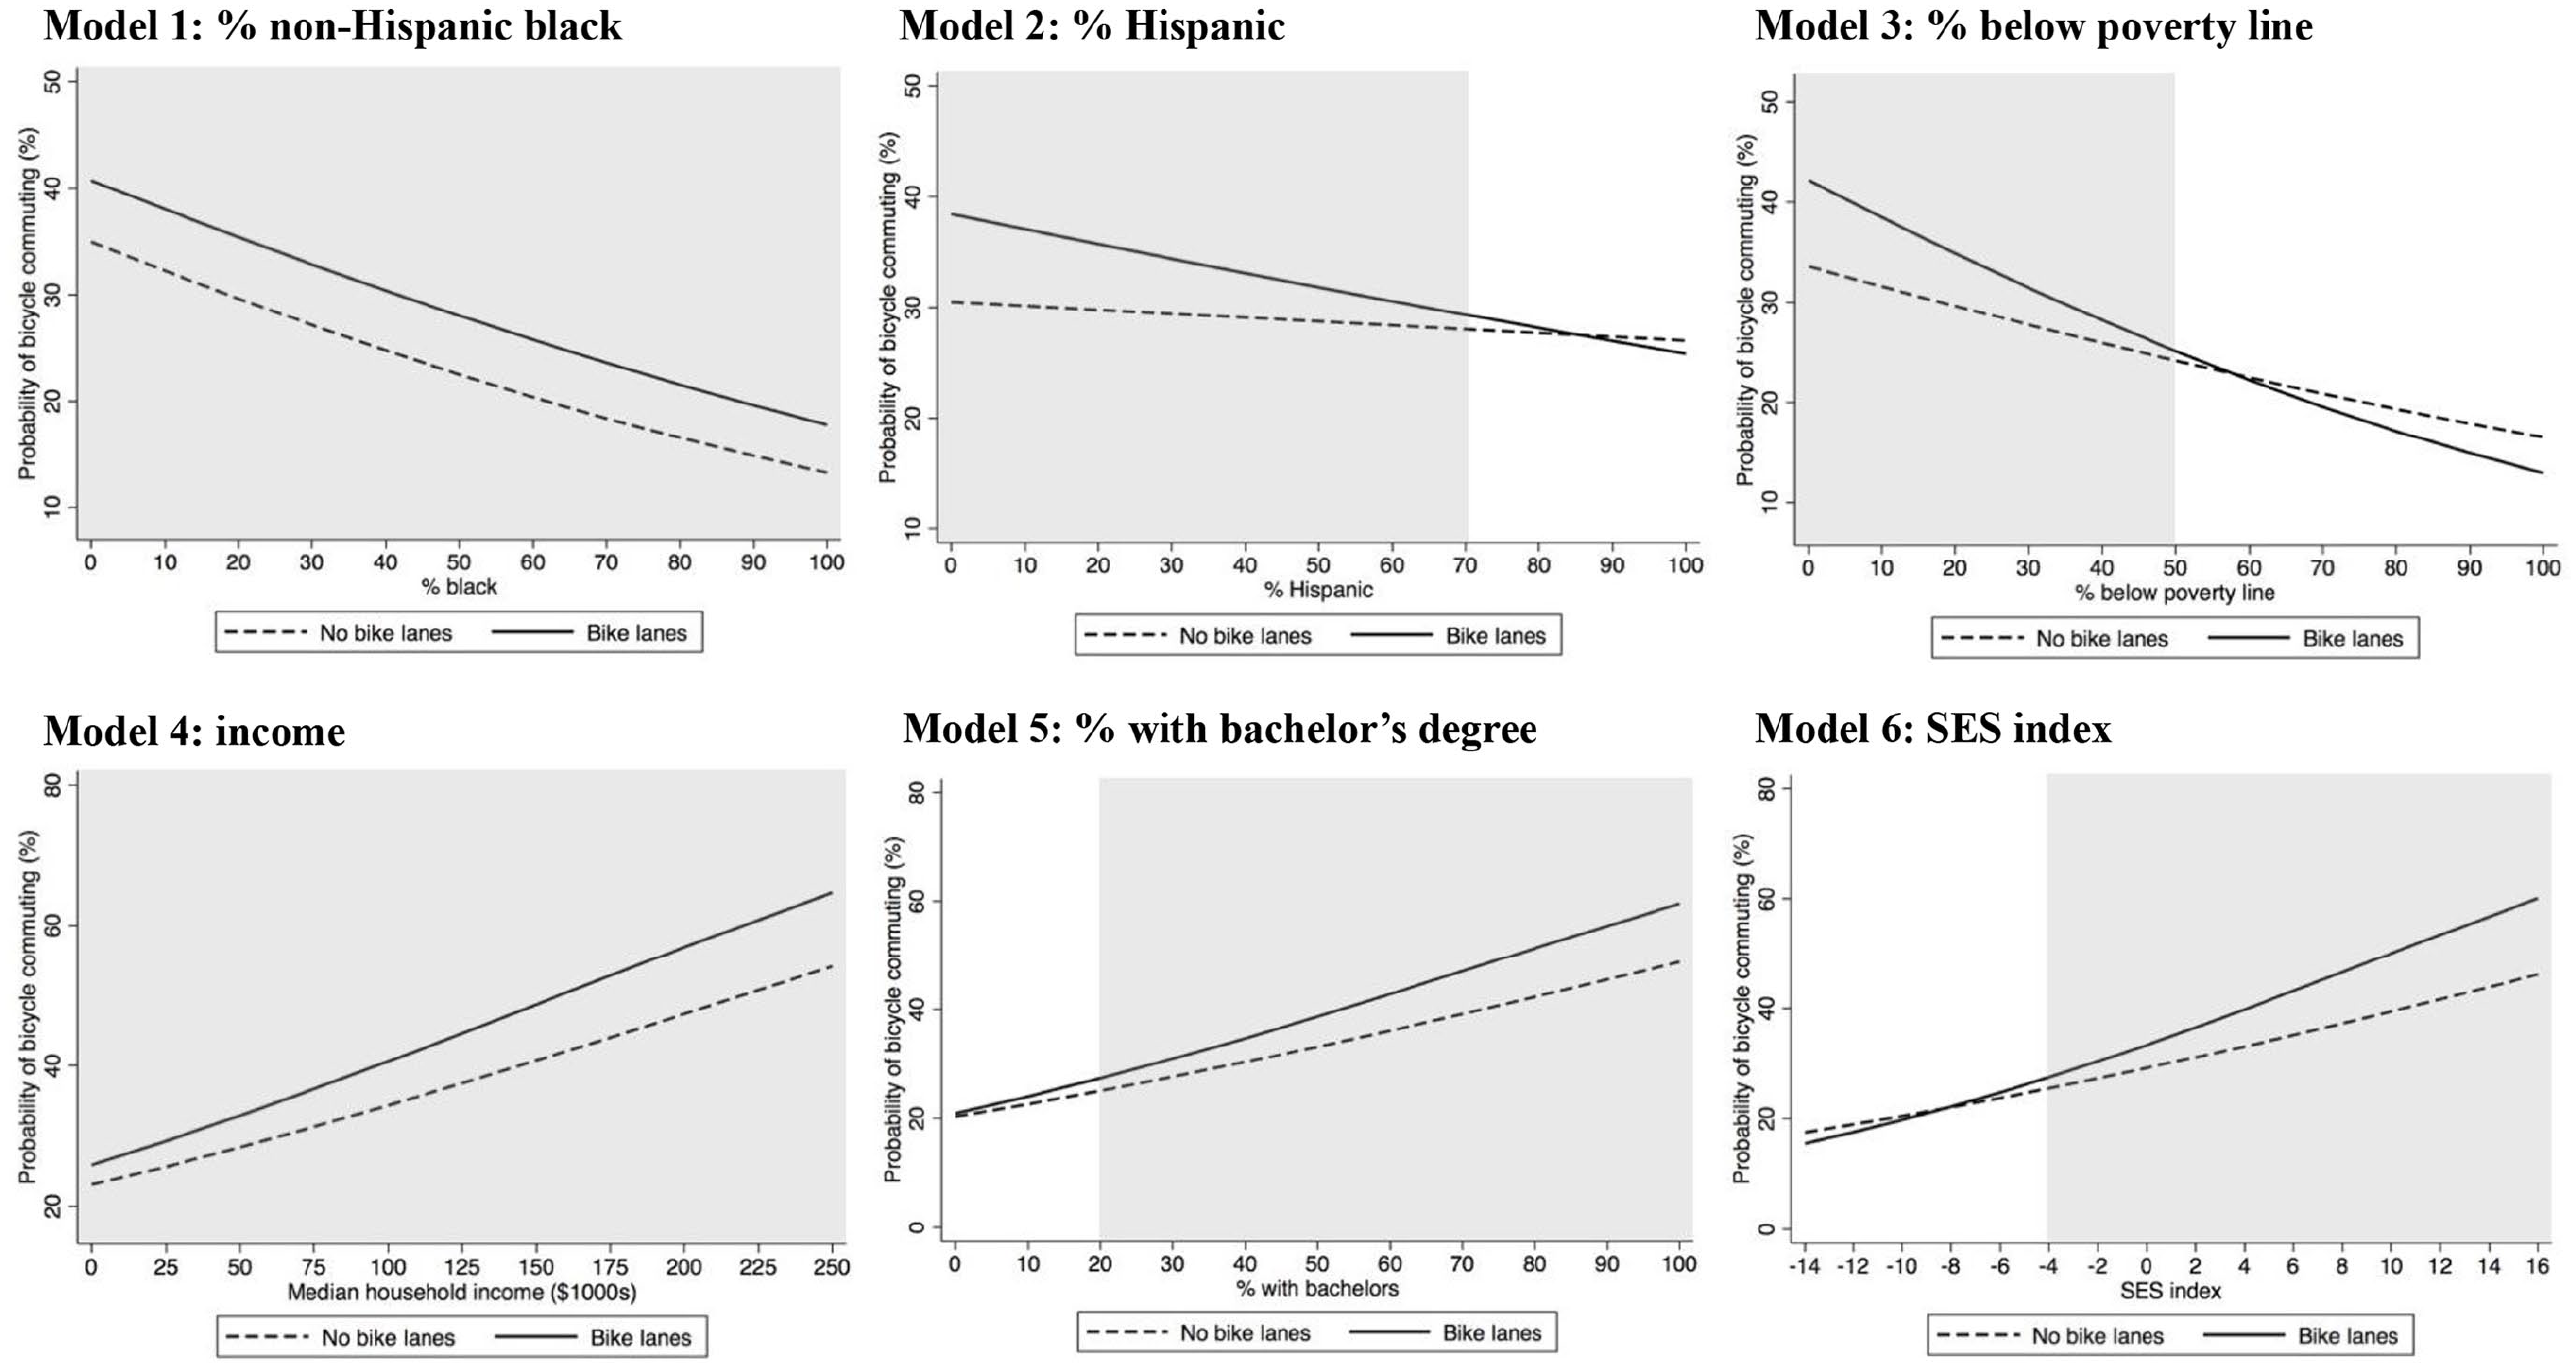
Predicted probability of having a non-zero bicycle commuting mode share, by block group–level sociodemographic characteristics and bike lane presence, 21,752 block groups in twenty-two U.S. cities.
An interpretation of one panel of Figure 3 is as follows. In Model 1, the negative slopes of both lines indicate that higher percentages of non-Hispanic Black residents are associated with lower predicted probabilities of bicycle commuting, regardless of bike lane presence; this reflects the negative
Interpreting all panels of Figure 3 in this way suggests that, in general, a block group’s probability of having bicycle commuters is positively associated both with sociodemographic advantage (shown by the negative slopes in Models 1–3 and the positive slopes in Models 4–6) and with bike lane presence (shown by the vertical gap between the dashed and solid lines). Moreover, the association between bike lane presence and bicycle commuting varies significantly across the range of four sociodemographic characteristics. For Models 2 and 3, the association between bike lane presence and bicycle commuting becomes smaller with increasing percentages of Hispanic residents and residents below the poverty line. As a result, associations between bike lane presence and bicycle commuting are only significant when the percentage of Hispanic residents is less than seventy (Model 2) and when the percentage of residents below the poverty line is less than fifty (Model 3). Beyond these thresholds of sociodemographic disadvantage, bike lane presence is not significantly associated with bicycle commuting.
For Models 5 and 6, the association between bike lane presence and bicycle commuting becomes larger with increasing educational attainment and composite SES. As a result, associations between bike lane presence and bicycle commuting are only significant when the percentage of residents with a bachelor’s degree is greater than twenty (Model 5) and when the value of the composite SES index is greater than −4 (roughly equivalent to the 25th percentile in the SES index distribution; Model 6). Below these thresholds of sociodemographic advantage, bike lane presence is not significantly associated with bicycle commuting.
Additional and Sensitivity Analyses
The results of the main analysis thus suggest that associations between bike lane presence and bicycle commuting are generally weaker in the context of sociodemographic disadvantage. As noted by Adkins et al. (2017) and illustrated in Figure 1, such an attenuation could arise from cycling in the absence of bike lanes (quadrant (a)), potentially reflecting cycling preferences or lack of alternative transportation options; or from a lack of cycling in the presence of bike lanes (quadrant (b)), potentially reflecting individual, environmental, social, and institutional barriers that keep people from cycling even when bike lanes are available. To test these alternative explanations for the regression results, I calculated the percentage of “disadvantaged” block groups that fell within each quadrant of this conceptual framework, defining “disadvantaged” as falling below the median value of all six sociodemographic characteristics considered in this analysis (n = 3,032, or 14% of the study sample). As shown in Figure 4, block groups meeting this definition of disadvantage were nearly three times as likely to fall in quadrant (b) (no bicycle commuting even in the presence of bike lanes) than in quadrant (a) (bicycle commuting even in the absence of bike lanes). Although this tendency was also observed for the full sample, it was weaker for the full sample—less than twice as likely to fall in (b) than in (a)—than for disadvantaged block groups. A similar pattern of results was found for all alternative definitions of disadvantaged block groups tested (data not shown). Thus, this additional analysis indicates greater support for the explanation represented by quadrant (b)—that is, that associations between bike lane presence and bicycle commuting tend to be lower in disadvantaged block groups due to a stronger lack of observed cycling even in the presence of bike lanes.
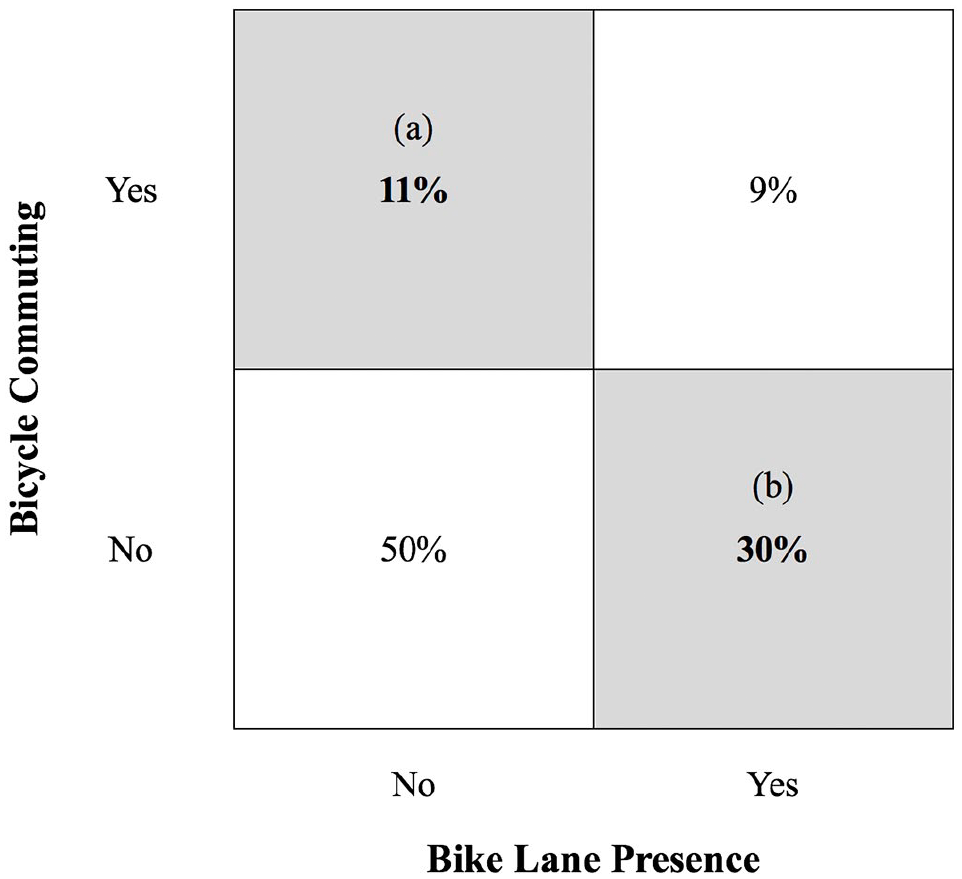
Results of quadrant analysis examining potential explanations for attenuated associations between bike lane presence and bicycle commuting among disadvantaged block groups.
The estimated random effects parameters from Model 1 (percentage non-Hispanic Black) are summarized in Table 4; a similar pattern of results was found for the remaining five regression models, so for simplicity, only the parameters for Model 1 are shown. This table displays the overall constant for the model as well as the city-specific parameters that shift the regression line up (higher likelihood of bicycle commuting) or down (lower likelihood of bicycle commuting) for each city; the sum of the overall constant and city-level shift indicates each city’s random intercept. The cities are arranged in descending order from the highest to lowest random intercept. The results indicate that some cities tend to have higher levels of bicycle commuting regardless of sociodemographic characteristics, bike lane presence, and covariates (Portland, Washington, Seattle, Minneapolis), while others tend to have lower levels of bicycle commuting (San Antonio, Dallas, Charlotte); this ordering generally corresponds with city-level measures of bicycle commuting and bicycle-supportive policies (Alliance for Biking & Walking 2016). Such city-level differences can also be seen in the ICCs for the six regression models (Table 3). While the ICC values are somewhat low (ranging from .18 to .20), they indicate the presence of city-level variation, and likelihood ratio tests (data not shown) consistently suggested the appropriateness of the MLME regression structure.
Estimates of City-Level Random Effects Parameters From Multilevel Mixed-Effects Regression (Model 1), n = 21,752 Block Groups in Twenty-Two Large U.S. Cities.
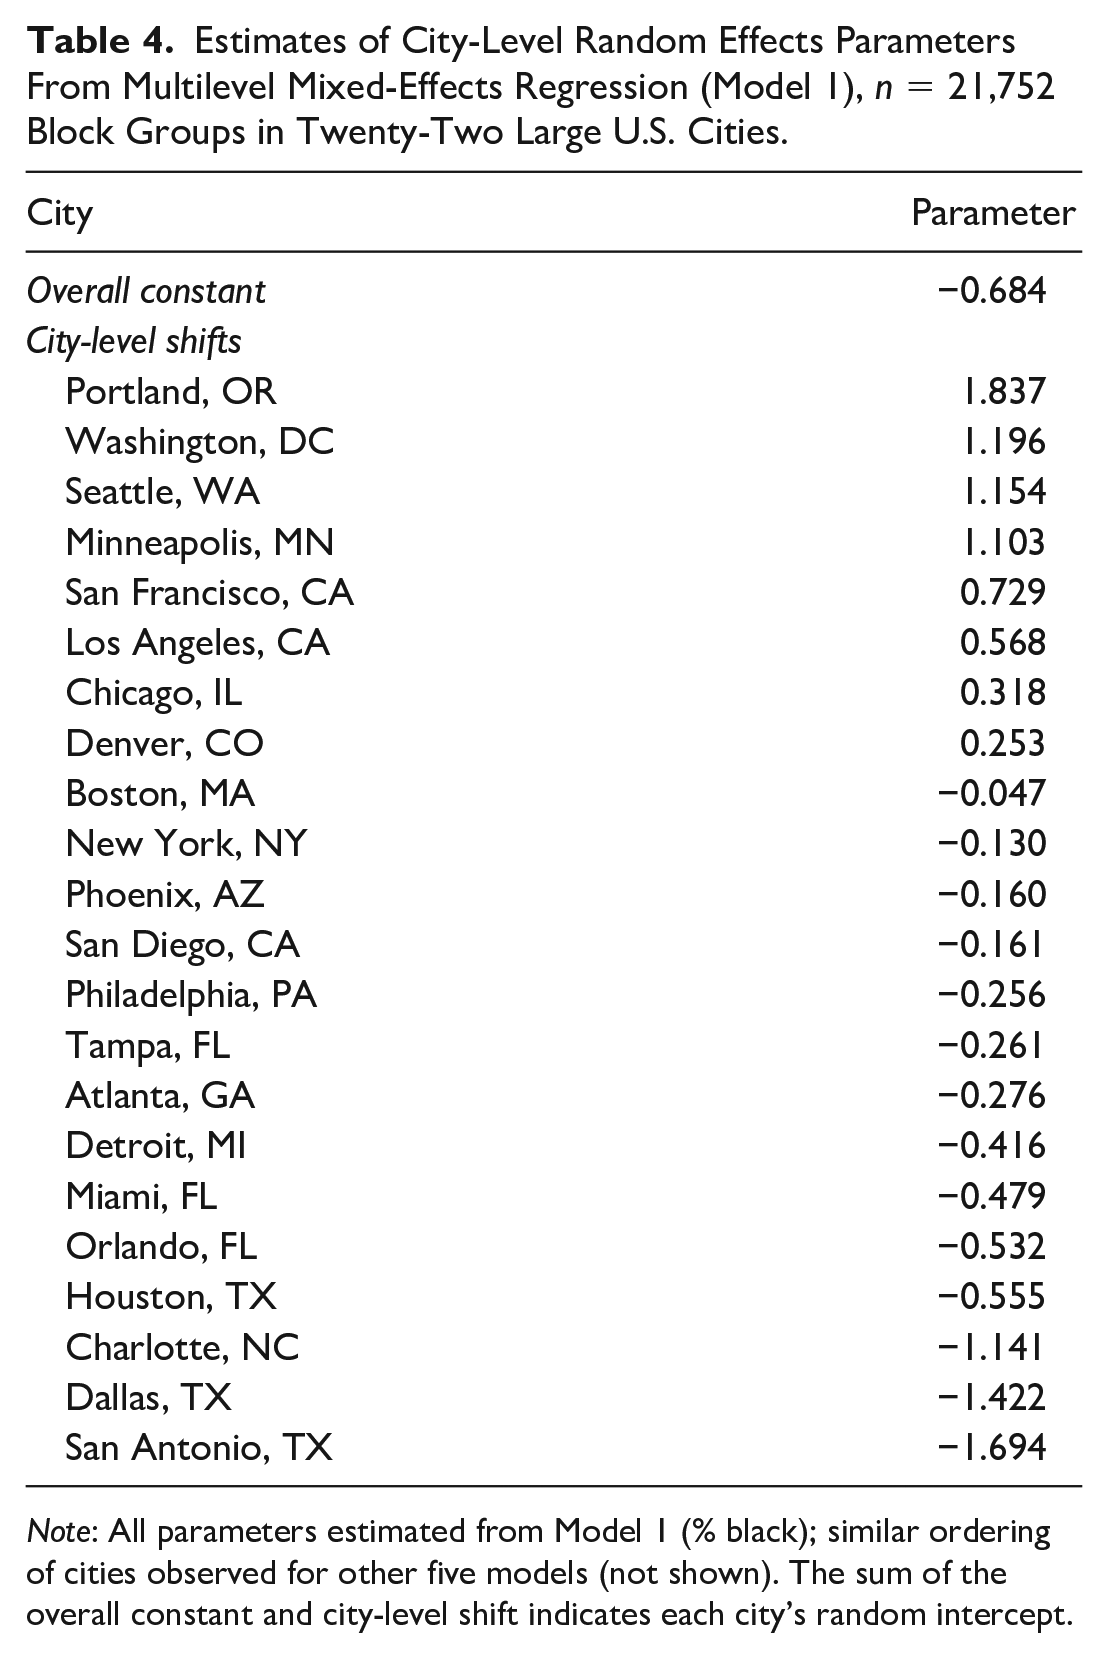
Note: All parameters estimated from Model 1 (% black); similar ordering of cities observed for other five models (not shown). The sum of the overall constant and city-level shift indicates each city’s random intercept.
When the sample was restricted to block groups in seven cities with high shares of bicycle commuting, the coefficients for bike lane presence
Discussion
I observed significant associations between bicycle commuting, sociodemographic advantage, and bike lane presence at the block group level across twenty-two large U.S. cities. Although associations between bike lane presence and bicycle commuting were most commonly positive, the magnitude of these associations tended to increase with increasing levels of sociodemographic advantage; specifically, associations between bike lane presence and bicycle commuting tended to be stronger in places with lower percentages of Hispanic residents and residents below the poverty line, and with higher educational attainment and composite SES. Moreover, these associations were only statistically significant past a certain threshold of sociodemographic advantage. These results, which correspond with the findings of Adkins et al. (2017) with respect to the built environment and walking behavior, suggest that associations between bike lane presence and bicycle commuting could be higher in places characterized by greater sociodemographic advantage, and correspondingly lower in disadvantaged areas.
As previously described, there are several potential explanations for this finding. Associations between bike lane presence and bicycle commuting may be lower in disadvantaged block groups if the residents of those block groups tend to cycle even in the absence of supportive infrastructure (quadrant (a) of Figure 1), due to underlying preferences for cycling or to economic constraints such as low vehicle ownership. In this context, bike lane interventions could effectively serve an existing need for safe, convenient infrastructure, even if these interventions do not have a substantial impact on current cycling behavior.
While this explanation is plausible, an alternative explanation is that weaker associations between bike lane presence and bicycle commuting occur because residents of disadvantaged block groups tend to cycle less than those in advantaged block groups, even when bike lanes are present (quadrant (b) of Figure 1). As previously described, low-income populations and people of color may face disproportionate barriers to cycling that are individual (costs, commute distances), environmental (lack of other supportive built environment features), social (crime, discrimination, social norms), and institutional (inadequate representation, gentrification) in nature (Community Cycling Center 2012; Ferenchak and Marshall 2019; Golub 2016; Howell and Timberlake 2014; Ibsen and Olesen 2018; Kelly et al. 2007; Lubitow 2017; Lubitow, Zinschlag, and Rochester 2016; Lusk et al. 2017; Sarrica et al. 2019). Due to these non-infrastructure barriers, low-income populations and people of color may be less likely than more advantaged populations to use bike lanes when they are available, potentially contributing to increased disparities in cycling.
Similar to Adkins et al. (2017), I found evidence of both explanations but stronger support for the second—that associations between bike lane presence and bicycle commuting are weaker in disadvantaged block groups due to a lack of cycling even when bike lanes are present. This possibility is illustrated in Figure 4, which shows that disadvantaged block groups (i.e., those that fell below the median value of all sociodemographic characteristics considered in this analysis) were nearly three times as likely to fall in quadrant (b) (no bicycle commuting even in the presence of bike lanes) than in quadrant (a) (bicycle commuting even in the absence of bike lanes). The results therefore suggest that weaker associations between bike lane presence and bicycle commuting in disadvantaged places could stem largely from the multifaceted non-infrastructure barriers to cycling documented in past research.
These findings raise important questions about bike lane investment as an equitable tool for cycling promotion. If disadvantaged populations tend to cycle less than their more advantaged counterparts even when bike lanes are available, bike lane investment, in isolation, could lead to counterintuitive outcomes. Indeed, if advantaged populations face fewer non-infrastructure barriers to cycling and are thus more likely to use bike lanes when they are provided, investing in bike lanes could unintentionally widen sociodemographic disparities in cycling and its potential benefits. This possibility points to the value of complementary approaches to cycling promotion that address non-infrastructure barriers, particularly in low-income communities of color.
Several recent studies provide a precedent for this approach, underscoring the value of complementing cycling infrastructure investments with other types of supportive interventions. Some of this work has suggested that investments in infrastructure such as bike lanes and bicycle sharing stations, in isolation, are insufficient to encourage notable shifts to cycling, particularly when these investments are made in the otherwise unsuitable or unsupportive environments that tend to be disproportionately faced in low-income communities of color (Dill et al. 2014; Wang and Lindsey 2019). Other research has focused on the role of perceptions and attitudes, finding these and other forms of social support to be important determinants of cycling—particularly among low-income populations and people of color—that warrant consideration alongside infrastructure investments (Barajas 2019; Biehl et al. 2019; Dill et al. 2014). Pritchard et al. (2019) note that some structural barriers to cycling, such as the socio-spatial distribution of employment opportunities and corresponding commute distances, may be challenging to overcome. However, the findings of a randomized controlled trial conducted by Schneider et al. (2018) in low-income communities of color suggest that other common barriers, such as perceived traffic stress and limited cycling experience, may be effectively addressed through education and encouragement programs. These studies fit within a larger body of research emphasizing the need for complementary individual, social, and spatial interventions to adequately support active transportation (Gotschi et al. 2017). Moreover, they reinforce the findings of the present analysis, suggesting that a more comprehensive definition of “access” to bike lanes—one that incorporates both infrastructure and non-infrastructure barriers to cycling—is needed if cycling is to be equitably promoted among diverse populations, and if the potential benefits of bike lane investment are to be adequately realized in disadvantaged communities.
Strengths and Limitations
This study is among the first to examine how associations between bike lanes and cycling are moderated by sociodemographic advantage. The findings are based on a geographically extensive sample of block groups across twenty-two large U.S. cities, allowing for interpretation beyond the context of a single geographic setting.
Several caveats should be considered when interpreting the results. The data are cross-sectional and thus do not indicate causality, nor do they provide information about changes in cycling or in cycling disparities when bike lanes are introduced. Rather, they apply to differences between places with different sociodemographic and infrastructure characteristics at the same point in time. Further longitudinal work on behavioral responses to bike lane interventions could add depth to the conclusions of this study. Similarly, the results do not indicate which types of barriers (e.g., individual, environmental, social, institutional) are the most influential; qualitative work on the barriers to cycling faced by marginalized groups would be a valuable extension to this cross-sectional, quantitative analysis. Due to the aggregate unit of analysis (i.e., block groups), the findings apply to places rather than to people. Indeed, it is impossible to tell from the data used who cycles, but rather the types of places where commuters cycle. While individual-level analyses are needed, research showing that neighborhood-level disadvantage is an important determinant of travel behavior (Turrell et al. 2010) suggests that this aggregate analysis is a valuable first step in understanding the contextual influences of cycling disparities. In addition, it is important to keep in mind that the results of this analysis apply specifically to bicycle commuting and to the physical presence of bike lanes; different findings may be observed for other trip purposes and infrastructure characteristics (e.g., bike lane quality, trails). The journey-to-work data collected by the U.S. Census Bureau via the ACS are also subject to relatively large margins of error, which could partially explain the attenuated associations between bike lane presence and bicycle commuting observed in this analysis; this limitation attests to the value of conducting similar analyses with alternative sources of cycling data, including those that incorporate non-commuting trip purposes. Finally, as previously noted, the findings may be primarily applicable to the distinction between block groups with versus without bicycle commuting rather than to the level of bicycle commuting among those with any, and may be less prominent in large cities with very high shares of bicycle commuting.
Conclusion: Widening the Gap?
This study provides evidence that associations between bike lane presence and bicycle commuting, while generally positive, tend to be stronger in more advantaged block groups and correspondingly weaker in less advantaged block groups. This finding could reflect the influence of non-infrastructure barriers to cycling among low-income populations and people of color, creating a situation in which advantaged populations are better positioned to make use of cycling infrastructure when it is available. Thus, bike lane investment could have the unintended consequence of widening the gap in cycling—and potentially in related environmental, economic, access, and health outcomes—between places of high versus low sociodemographic advantage if non-infrastructure barriers to cycling are not also addressed.
The implications of these results for planning practice and research are twofold. First, in designing interventions and studying their outcomes, planners and researchers should recognize that the potential impacts of infrastructure such as bike lanes are likely to vary across different population subgroups. This recognition is an important starting point for ensuring that sociodemographic differences are brought to the foreground of both plans and studies, allowing for a more careful consideration of who stands to benefit from infrastructure investments. This lesson, which Biehl et al. (2019) describe as the identification of distinct “subcommunities” within a broad population of interest, can be extended to other areas of travel behavior research and to planning research more broadly. Planners should critically consider research that presents single estimates of an “effect” or relationship of interest, keeping in mind that such relationships may be nuanced—and potentially even counterintuitive—for different population subgroups. Foregrounding sociodemographic characteristics to consider this possibility is an important direction for more equitable, inclusive planning research and practice.
Second, a more comprehensive definition of bike lane “access” should be consistently sought and emphasized in planning research and practice, building upon the past work reviewed in this analysis. This work suggests that the physical availability of bike lanes may not capture all elements of access that are needed to support cycling among diverse populations. Importantly, cycling interventions and studies should be designed around this comprehensive definition, ensuring that bike lane investments are complemented by other strategies that address the non-infrastructure barriers to cycling that low-income populations and people of color disproportionately face. These strategies might include bicycle ownership and maintenance programs; partnerships with groups addressing crime, gentrification, and inequitable policing; broader efforts to promote traffic safety; education and outreach programs designed to influence attitudes, preferences, and cycling skills; and inclusive, grassroots planning and advocacy processes that seek to fully engage traditionally marginalized and underrepresented populations. Through these multifaceted approaches, bike lane investments could have a greater potential to address cycling disparities and thus to advance social equity goals.
Footnotes
Acknowledgements
I would like to sincerely thank Dr. Daniel A. Rodriguez and Dr. Penny Gordon-Larsen for their mentorship and guidance during the data collection process.
Declaration of Conflicting Interests
The author(s) declared no potential conflicts of interest with respect to the research, authorship, and/or publication of this article.
Funding
The author(s) received no financial support for the research, authorship, and/or publication of this article.