
Abstract
This study examines the relationship of blight reduction with violent crime in Baton Rouge, Louisiana. We examine whether an initiative to paint murals in high-crime areas was associated with declines in calls for service for violent crime. This relationship was assessed by analyzing variation in calls for service in the areas within 500 feet of mural installations and at the block group level over a nine-year period. Our findings suggest the influence of blight reduction strategies for violence can vary by unit of analysis and that such strategies by themselves are unlikely to be strongly associated with reductions in violence.
Introduction
The association of urban blight with increased levels of neighborhood violence is often considered common sense among academic and the general populace, but this relationship also has empirical support (Taylor 2001; Wilcox, Cullen, and Feldmeyer 2018). Researchers have defined blight in many ways, but blight generally referred to “both a cause of physical deterioration and a state of being in which the built environment is deteriorated or physically impaired beyond normal use” (Weber 2002, 526). Residents of blighted neighborhoods were more likely to report health problems or be victimized by violent crime (Kirk, Hardy, and Timberlake 2013). Efforts to reduce neighborhood violence through blight remediation flourished after Wilson and Kelling’s (1982) seminal publication on The Broken Windows Thesis. As such, much of the research that followed was guided by The Broken Windows Thesis (Kelling and Coles 1996; Kondo et al. 2018a; Skogan 2015; Taylor 2001) in addition to criminological frameworks including social disorganization (Sampson 2012; Shaw and McKay [1942] 1969) and Geometry of Crime/Routine Activity frameworks (Brantingham and Brantingham 1981; Cohen and Felson 1979). These frameworks suggest several reasons why neighborhood violence would be higher in blighted neighborhoods, but the common thread was that social control, particularly informal control, tended to be weaker in blighted neighborhoods (Taylor 2001; Wilcox, Cullen, and Feldmeyer 2018).
While efforts to address neighborhood violence through blight remediation remain popular, empirical assessments reported mixed results (Kondo, Morrison, and Jacoby (2018); MacDonald and Stokes 2020). For example, Branas et al. (2016) found abandoned building and vacant lot remediation were significantly associated with declines in firearm violence, but neither form of remediation was significantly associated with nonfirearm violence. In contrast, Kondo et al. (2018b) found levels of violent, property, and domestic crimes were not significantly different in vacant lots that were remediated than in vacant lots that were not remediated. Many reasons were suggested for these divergent findings, but a key reason appears to be whether remediation initiatives incorporated partnerships among municipalities, local nonprofit organization, academic institutions, and funders (Kondo et al. 2018a). Renewal efforts led by city administrators were more likely to lead to gentrification, while community-based efforts more often led to revitalization due the greater interest in serving local audiences (Grodach, Foster, and Murdoch 2014; Murdoch, Grodach, and Foster 2016). The divergent findings may also be a function of city size as most of the research on the relationship of blight remediation with violence used samples of neighborhoods from larger cities (see Kondo et al. 2018a; MacDonald and Stokes 2020; Skogan 2015). It is possible that blight remediation efforts may operate differently in smaller cities where blight may be less common or constrained to smaller areas. Further, the inconsistent findings may be a product of different units of analysis because recent research suggests relationships may operate differently depending on the size of the unit of analysis (Kim and Hipp 2019; Vogel 2016). This phenomenon has been termed the modifiable areal unit problem (MAUP).
The current study engages with research on the relationship of neighborhood revitalization with violence by examining how the installations of art murals by The Walls Project (2019) in disadvantaged neighborhoods in Baton Rouge, Louisiana, was associated with changes in calls for service for violent crimes. Findings indicate areas immediately surrounding mural installations experienced small, but nonsignificant, declines in calls for service. In comparison, neighborhood-level analyses report a statistically significant decline in calls for service. The implications of these findings for similar initiatives are discussed in the conclusion.
Literature Review
Neighborhood Revitalization and Community Art
There is a long history of efforts to revitalize disadvantaged areas, but such efforts picked up speed in the United States during the 1960s (Carmon 1997; Grodach and Loukaitou-Sideris 2007; Murdoch, Grodach, and Foster 2016; Rizzi et al. 2017). These efforts ranged from smaller scale gentrification efforts funded by private individuals to larger scale public–private redevelopment efforts initiated by city governments (Carmon 1997; Hackworth 2007). A full review of the research on neighborhood revitalization initiatives is beyond the scope of the current study due to the enormity of the literature which has used terms including revitalization and gentrification to describe similar phenomenon. Revitalization generally refers to process that improves the “physical, commercial, and social components of neighborhoods” (Bahchieva et al. 2008, 6). In comparison, gentrification refers to “the process by which higher income households displace lower income [households] of a neighborhood, changing the essential character and flavor of that neighborhood” (Kennedy and Leonard 2001, 5). Gentrification was often associated with private individuals or businesses, while revitalization efforts were orchestrated by local governments. The current study uses the term revitalization because that was the terminology used by The Walls Project (2019). Due in large part to the breadth of this literature, revitalization efforts were found to be associated with positive and negative outcomes. For example, revitalization was found to be associated with improvements in quality of life such as reductions in crime in addition to concerns about residential or cultural displacement (Barton and Gruner 2016; Grodach, Foster, and Murdoch 2014; Kirk 2010; Kirk, Hardy, and Timberlake 2013; Kreager, Lyons, and Hays 2011; Murdoch, Grodach, and Foster 2016; Weber 2002).
Many revitalization efforts undertaken since the 1960s were associated with artist communities or incorporated community art (Grodach and Loukaitou-Sideris 2007; Murdoch, Grodach, and Foster 2016; Rizzi et al. 2017; Zukin 2010). Municipalities have increasingly looked to community art to revitalize neighborhoods because of the potential for community and economic development (Grodach 2011; Grodach and Loukaitou-Sideris 2007). Grodach and Loukaitou-Sideris (2007) describe three ways municipalities engaged in cultural development to encourage economic growth. Entrepreneurial strategies typically involve larger scale cultural activities or projects in downtown areas of cities most often frequented by tourists or affluent residents. Creative class strategies often involved the development of arts and entertainment districts designed to attract current and prospective residents in addition to young urban professionals. Progressive strategies used cultural development as a means of addressing the needs of local communities and arts organizations in underserved neighborhoods. The Walls Project is an example of a progressive strategy because organizers sought artists who lived in underserved neighborhoods to paint murals that would inspire local residents.
Community art revitalization efforts were found to be associated with a variety of neighborhood changes (Grodach 2011; Grodach, Foster, and Murdoch 2014; Murdoch, Grodach, and Foster 2016; Woronkowicz 2016). Grodach (2011) reported community art was associated with neighborhood revitalization, tourism, community outreach, and arts education. Similarly, Woronkowicz (2016) found block groups with open-air community arts venues were more likely to experience growth in population, income, and property values. Grodach, Foster, and Murdoch (2014) reported a similar positive impact of community arts, but only for arts projects focused on fine arts such as performing arts companies, museums, and art schools. In comparison, commercial art initiatives such as arts galleries were more likely to be associated with gentrification and potentially with residential displacement (Grodach, Foster, and Murdoch 2014).
The divergent findings about the influence of community art on neighborhood revitalization were a product of several factors, including the type of art investment and whether the assessment was of a single project or multiple projects (Grodach 2018; Grodach, Foster, and Murdoch 2014; Woronkowicz 2016). Regarding the type of project, Grodach, Foster, and Murdoch (2014) reported fine arts and commercial arts were associated with different types and pace of neighborhood change. Fine arts projects were more likely to develop in slow-growth neighborhoods, while commercial arts were more likely to develop in rapid-growth neighborhoods experiencing gentrification (Grodach, Foster, and Murdoch 2014). Grodach, Foster, and Murdoch (2014) were unable to assess why fine arts and commercial arts were associated with revitalization and gentrification, respectively, but they speculate property values in gentrifying neighborhoods were too high for groups associated with fine arts. Murdoch, Grodach, and Foster (2016) suggest an alternative explanation as their results indicated arts organizations that located outside of creative class zones were more likely to work with local populations on community development projects. The conflicting findings might have also been a function of sample size and selection as recent studies called for more quantitative assessments of the relationship of community arts with revitalization so that the generalizability of the findings can be better assessed (Grodach, Foster, and Murdoch 2014; Woronkowicz 2016).
Neighborhood Revitalization and Violence
A substantial body of research found disadvantaged households, urban blight, and violent crime were spatially concentrated together in certain areas of cities (Kondo et al. 2018a; MacDonald and Stokes 2020; Sampson 2012; Skogan 2015; Valasik, Brault, and Martinez 2019; Wilcox, Cullen, and Feldmeyer 2018). The most commonly used theoretical frameworks to explain this relationship were the social disorganization framework (Sampson 2012; Shaw and McKay [1942] 1969), Geometry of Crime/Routine Activities perspective (Brantingham and Brantingham 1981; Cohen and Felson 1979), and The Broken Windows Thesis (Kelling and Coles 1996; Skogan 2015; Taylor 2001; Wilson and Kelling 1982). In addition to helping to explain the spatial concentration of violence in disadvantaged neighborhoods, these theories also help to explain how neighborhood changes correlate with changes in levels of neighborhood violence (Barton and Gruner 2016; Kirk 2010).
Social disorganization
The social disorganization framework was the most often used theoretical framework in research on neighborhood correlates of violence (Barton and Gruner 2016; Kirk 2010; Sampson 2012). This framework predicts violence will be higher in neighborhoods that feature higher levels of concentrated disadvantage, residential instability, and racial and ethnic heterogeneity (Kubrin and Weitzer 2003; Sampson 2012; Shaw and McKay [1942] 1969). These neighborhood characteristics correlate with higher violence because they lead to the formation of tenuous social networks and in turn decreased the potential effectiveness of informal social control (Kubrin and Weitzer 2003; Sampson 2012). A substantial body of research supports the logic of this framework, but most of these studies only assessed the relationship of neighborhood structural characteristics with violence. The most reported finding was that violence was higher in disadvantaged areas (Hipp and Boessen 2013; Sampson 2012; Zahnow 2018). For example, Hipp and Boessen’s (2013) analysis of violent crime among egohoods in nine U.S. cities found average household income was negatively associated with aggravated assault, robbery, and homicide. Similarly, Zahnow’s (2018) analysis of the spatial patterning of crime among block groups in Brisbane, Australia, found neighborhood disadvantage was positively associated with aggregate violent crime.
Findings of research on the importance of community found neighborhood violence was associated with the strength of local community characteristics such as trust in one’s neighbors, but not always in the anticipated fashion (Barton, Weil, et al. 2020; Sampson 2012; Sampson, Raudenbush, and Earls 1997; Taylor 2001). For example, analysis of Chicago neighborhoods by Sampson, Raudenbush, and Earls (1997) found collective efficacy mediated a substantial portion of the association of residential stability and disadvantage with self-reported violent victimization and homicide events. Barton, Weil, et al.’s (2020) tract-level analysis of crime in New Orleans reported social trust and bridging social networks were negatively associated with homicide, aggravated assault, and robbery, but a measure of bonding social networks was positively associated with homicide and assault and not significantly associated with robbery.
Most of the assessments of the disorganization framework used cross-sectional research designs, so it is unclear whether neighborhood revitalization efforts aimed at reducing blight led to reductions in crime (Kirk 2010; Wilcox, Cullen, and Feldmeyer 2018). From the standpoint of social disorganization, revitalization efforts should be negatively associated with violence. For one, such efforts frequently help to deconcentrate disadvantage by encouraging middle-class households to move into the area (Barton 2016; Barton and Gruner 2016; Kreager, Lyons, and Hays 2011; Papachristos et al. 2011). The in-migration of middle-class residents is important because middle-class households have greater access to social and economic capital necessary for the improvement or maintenance of neighborhoods. Further, revitalization efforts were found to encourage longer term residents to invest in their local community (McKinnish, Walsh, and White 2010).
Longitudinal studies suggest the relationship of revitalization with violence may be nonlinear (Barton and Gruner 2016; Kreager, Lyons, and Hays 2011; Lee 2010). Revitalization efforts may be associated with increased guardianship and formal surveillance and in turn more criminal activities reported to the police (Cozens and Love 2015; Kreager, Lyons, and Hays 2011; Newman 1992). Over time, however, crime may decline as an area gains a reputation for being more surveilled or controlled (Kondo et al. 2018a; Kreager, Lyons, and Hays 2011; Newman 1992). Tract-level analysis of neighborhood crime in Seattle between 1982 and 2000 by Kreager, Lyons, and Hays (2011) reported a curvilinear relationship for total crime and property crime, but not for violent crime. Lee’s (2010) tract-level analysis of crime levels before and after the 1994 Northridge earthquake in Los Angeles also reported short-term increases in assault and robbery, but not for homicide or sexual assault. Overall, this suggests inconclusive evidence that the relationship of revitalization with violent crime is nonlinear.
Geometry of Crime and Routine Activity Theory
In addition to the social disorganization framework, research on the relationship of blight and violence drew heavily on Brantingham and Brantingham’s (1981) Geometry of Crime and Felson and Cohen’s (1979) related Routine Activity Theory. Brantingham and Brantingham’s (1981) Geometry of Crime argues offenders and targets intersect through overlapping daily movements, providing opportunities for criminal acts to transpire. These overlapping movements create pathways and relatively consistent schedules for offenders to exploit. The primary locations where individuals spend their time such as work, school, home, and recreation spaces are termed “nodes.” The combination of pathways and nodes makes up an individual’s activity space (Brantingham and Brantingham 1993). An offender’s most frequently traveled pathways and most frequently visited nodes make up their awareness space. Brantingham and Brantingham (1993, 1995) propose that these awareness spaces and individuals’ paths and nodes with the greatest amount of traffic have the highest likelihood of criminal offending. The area immediately surrounding an offender’s activity node—usually their primary residence—serves as their buffer zone, a space in which they do not offend for fear of being recognized by their neighbors (Brantingham and Brantingham 1984, 1993).
Geometry of crime features substantial conceptual overlap with Routine Activity Theory (Cohen and Felson 1979) which stipulates that crime occurrences require the intersection of a motivated offender, a suitable target, and an absence of capable guardianship in space and time. Each of these elements is a necessary but not sufficient condition for crime to occur. Focusing on the physical context in which such interactions occur, some areas have characteristics that encourage offenders to believe criminal activity will be more successful, known as crime generators (Brantingham and Brantingham 1995). For example, some areas provide venues with intersecting paths of offenders and targets at suitable concentrations at certain times of the day (Brantingham and Brantingham 1995). Other spaces have characteristics which attract outsiders to travel to these criminogenic areas to participate in a criminal act, known as crime attractors (Brantingham and Brantingham 1995). Such characteristics could include blighted properties (Kondo et al. 2018b; MacDonald and Stokes 2020; Valasik, Brault, and Martinez 2019) and public transit stops (Kondo et al. 2018a; Loukaitou-Sideris, Liggett, and Iseki 2002; Valasik 2018). Crime generators and attractors tend to occupy areas designed for public or commercial use such as the locations of mural installations painted by The Walls Project in Baton Rouge.
Crime prevention through environmental design (CPTED) initiatives remain the best example of crime control efforts guided by this framework (Cozens and Love 2015; Kondo et al. 2018a). Such initiatives seek to address local crime problems by altering the prevalence of crime generators and attractors. Longitudinal studies highlighted the importance of changing crime generators and attractors, but such studies also suggest changing local conditions may be associated with declines or increases in violent crime (Barton, Valasik, et al. 2020; Kondo et al. 2018a; Papachristos et al. 2011; Smith 2014). For example, research on violent crime in Chicago between 1991 and 2005 found neighborhood clusters where the number of coffee shops increased were more likely to experience declines in homicide (Papachristos et al. 2011; Smith 2014) and increased levels of robbery (Papachristos et al. 2011). In comparison, Barton, Valasik et al.’s (2020) tract-level analysis of gang and nongang homicide in the Hollenbeck area of Los Angeles showed gentrification was not significantly associated with levels of overall homicide or with gang homicide, but it was positively associated with nongang homicide.
A second generation of CPTED designs argued for the importance of local community participation during the implementation of interventions (Cozens and Love 2015). While these second-generation CPTED studies have not been as rigorously assessed (Cozens and Love 2015), a substantial amount of research found violence was lower in neighborhoods that featured strong local communities (Sampson 2012; Sampson, Raudenbush, and Earls 1997; Taylor 2001; Wilcox, Cullen, and Feldmeyer 2018). As discussed earlier, recent research suggests different measures of community may be positively or negatively associated with violent crime (Barton, Weil, et al. 2020).
The Broken Windows/Incivilities Thesis
The Broken Windows/Incivilities Thesis argues that fear of crime and occurrences of crime are more common in neighborhoods characterized by signs of social disorder (e.g., public arguments, public drunkenness) and physical disorder (e.g., graffiti, blight, vandalism; Kelling and Coles 1996; Skogan 2015; Taylor 2001; Wilson and Kelling 1982). Borrowing from the language of the Geometry of Crime, these signs of disorder act as crime generators because they discourage local residents from spending time in their neighborhood or engaging with other proximate neighborhood residents (Skogan 2015; Wilcox, Cullen, and Feldmeyer 2018). The decreased time spent in public spaces or engaging with neighbors allows low-level criminal activities to flourish, which further encourages neighborhood residents to feel unsafe in their neighborhood (Kelling and Coles 1996; Taylor 2001).
While conceptually appealing, empirical assessments of the relationship of neighborhood disorder with violent crime yielded mixed findings (Skogan 2015). Skogan’s (1990) research on violent crime across forty community areas in Chicago reported a strong positive correlation between disorder and robbery. More sophisticated multilevel analyses conducted by Rountree, Land, and Miethe (1994) found rates of violent victimization were higher in Seattle neighborhoods where incivilities were common. Valasik et al. (2017) recently identified a positive relationship between neighborhood blight and homicide in Baton Rouge. Furthermore, a recent meta-analysis by Braga, Welsh, and Schnell (2015) found policing disorder strategies were associated with moderate declines in overall violent crime.
Not all assessments of the relationship of disorder with violence supported The Broken Windows Thesis. Sampson and Raudenbush’s (1999) research on crime in Chicago found the association of disorder with self-reported violent victimizations was spurious because collective efficacy mediated much of the relation. Gault and Silver (2008) challenged Sampson and Raudenbush’s (1999) interpretation and argued these results were consistent with Wilson and Kelling’s (1982) original statement. Overall, this suggests disorder was associated with violence, but the influence of disorder may be mediated by characteristics of local communities.
Summarizing Research on Neighborhood Revitalization and Violence
Research on neighborhood revitalization and on neighborhood correlates of violence suggested a complex relationship of revitalization with violence. Part of the complexity of this relationship was a function of the MAUP as previous research analyzed variation in units as small as block groups (Zahnow 2018) and as large as neighborhood clusters (Papachristos et al. 2011; Sampson 2012). The overarching research on revitalization suggests efforts located in disadvantaged areas were more likely to engage with local community issues and therefore more likely to be associated with revitalization rather than gentrification. A great deal of criminological research found violence was spatially concentrated on disadvantaged neighborhoods, but whether revitalization efforts helped to reduce violence continues to be debated.
Current Study
The current study examines the relationship of a blight reduction initiative, The Walls Project, with calls for service for violent crime in Baton Rouge, Louisiana. The analyses were guided by the social disorganization, Geometry of Crime/Routine Activity, and Broken Windows Thesis frameworks, but it is not our intention to test any of these theories. This study contributes to research on the relationship of blight reduction with violence in two ways. First, we engage with the MAUP by examining the association of mural installations with changes in calls for service for violent crime within 500 feet of mural installations and for the broader neighborhood areas. This is important because research on the relationship of blight and crime used a wide variety of types of units of analysis used (Kondo et al. 2018a; Kreager, Lyons, and Hays 2011; MacDonald and Stokes 2020; Skogan 2015; Wilcox, Cullen, and Feldmeyer 2018). Second, most of the research about the relationship of blight reduction with violence sampled areas from larger cities such as Baltimore, Chicago, Los Angeles, New York City, or Philadelphia (Kondo et al. 2018a; MacDonald and Stokes 2020; Skogan 2015). This raises questions about whether the findings were generalizable to medium-sized cities where blight reduction efforts may have been less common. Baton Rouge makes for an interesting case study because it is a medium-sized city in the Southern United States with a high prevalence of violence which city administrators have relatively recently begun to try to combat through revitalization efforts (Karlin 2018).
The City of Baton Rouge and The Walls Project
Baton Rouge is the second largest city in Louisiana with an approximate population of 228,694 (U.S. Census Bureau 2017). Slightly more than half of Baton Rouge’s residents were black (54.9%), about one-third were white (36.6%), about 3.5 percent were Latino, and approximately 3.5 percent were of Asian descent. A little more than a quarter (26%) of residents lived under the poverty line, and the unemployment rate (8.8%) was almost double the national average (4.9%). City officials have sought to address the problem of violence in the city for at least thirty years, but arrest statistics reported by the Federal Bureau of Investigation (FBI) continue to identify it as one of the most violent cities in the United States (Johnson 2013; Thomas 2017). City officials have administered several violence reduction strategies, including the Partnership to Reduce Juvenile Gun Violence Program between 1997 and 1999 (Sheppard et al. 2000) and the Baton Rouge Area Violence Elimination (BRAVE) project, a local version of Operation Ceasefire aimed at reducing group-based violence between 2012 and 2015 (Barthelemy et al. 2016; Guin et al. 2017). These initiatives experienced limited successes and ultimately were unable to be maintained (Mustain, Gallo, and Toohey 2017).
Other examples by local nonprofits to address the root causes of violence in Baton Rouge include The Walls Project, the focus of the current study (The Walls Project 2019). The Walls Project was a collaboration between local business leaders, entrepreneurial real estate developers, and the residents of disadvantaged neighborhoods in Baton Rouge that began in 2012. This collaboration sought to reactivate community and economic activity in disadvantaged areas of Baton Rouge. According to their mission statement, The Walls Project seeks to “create and paint murals in underinvested schools and neighborhoods, cultivate, educate and inspire youth to attain the-demand jobs of the future and reactivate communities by remediating blight and making them safer” (The Walls Project 2019). This initiative was funded through the sponsorship of local businesses, charitable organizations, and residents of Baton Rouge. The Walls Project included several forms of community reactivation, including technology industry training programs and seasonal cleanup events, but the current study only assesses the relationship of the Arts Program because of the availability of data and the semipermanence of mural installations.
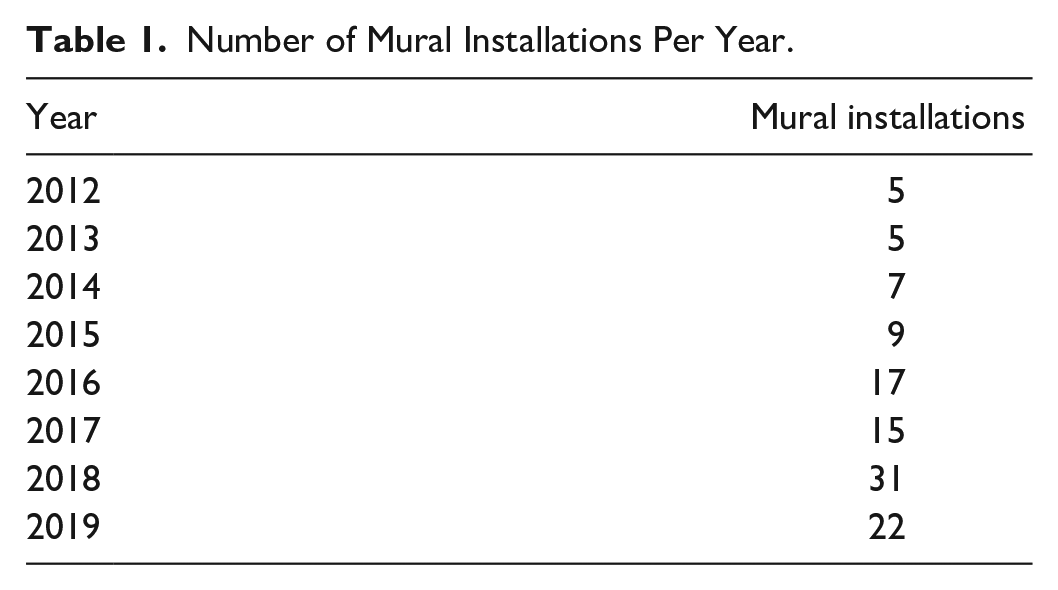
Table 1 shows the number of mural installations sponsored by The Walls Project increased steadily between 2012 and 2015 before doubling in 2016. The substantial increase in mural installations in 2016 was because The Walls Project sponsored special clusters of mural installations in honor of Martin Luther King Jr. each year between 2016 and 2019 in addition to murals painted in neighborhoods throughout Baton Rouge. Figure 1 shows that most of the murals were painted in the disadvantaged portion of the city colloquially known as North Baton Rouge because of the program focus on reactivating community in blighted areas. In comparison with the rest of the city, North Baton Rouge featured larger minority populations, greater levels of concentrated disadvantaged and higher levels of social problems including crime and health disparities (Barthelemy et al. 2016; Barton et al. 2017; Valasik, Brault, and Martinez 2019).
Number of Mural Installations Per Year.
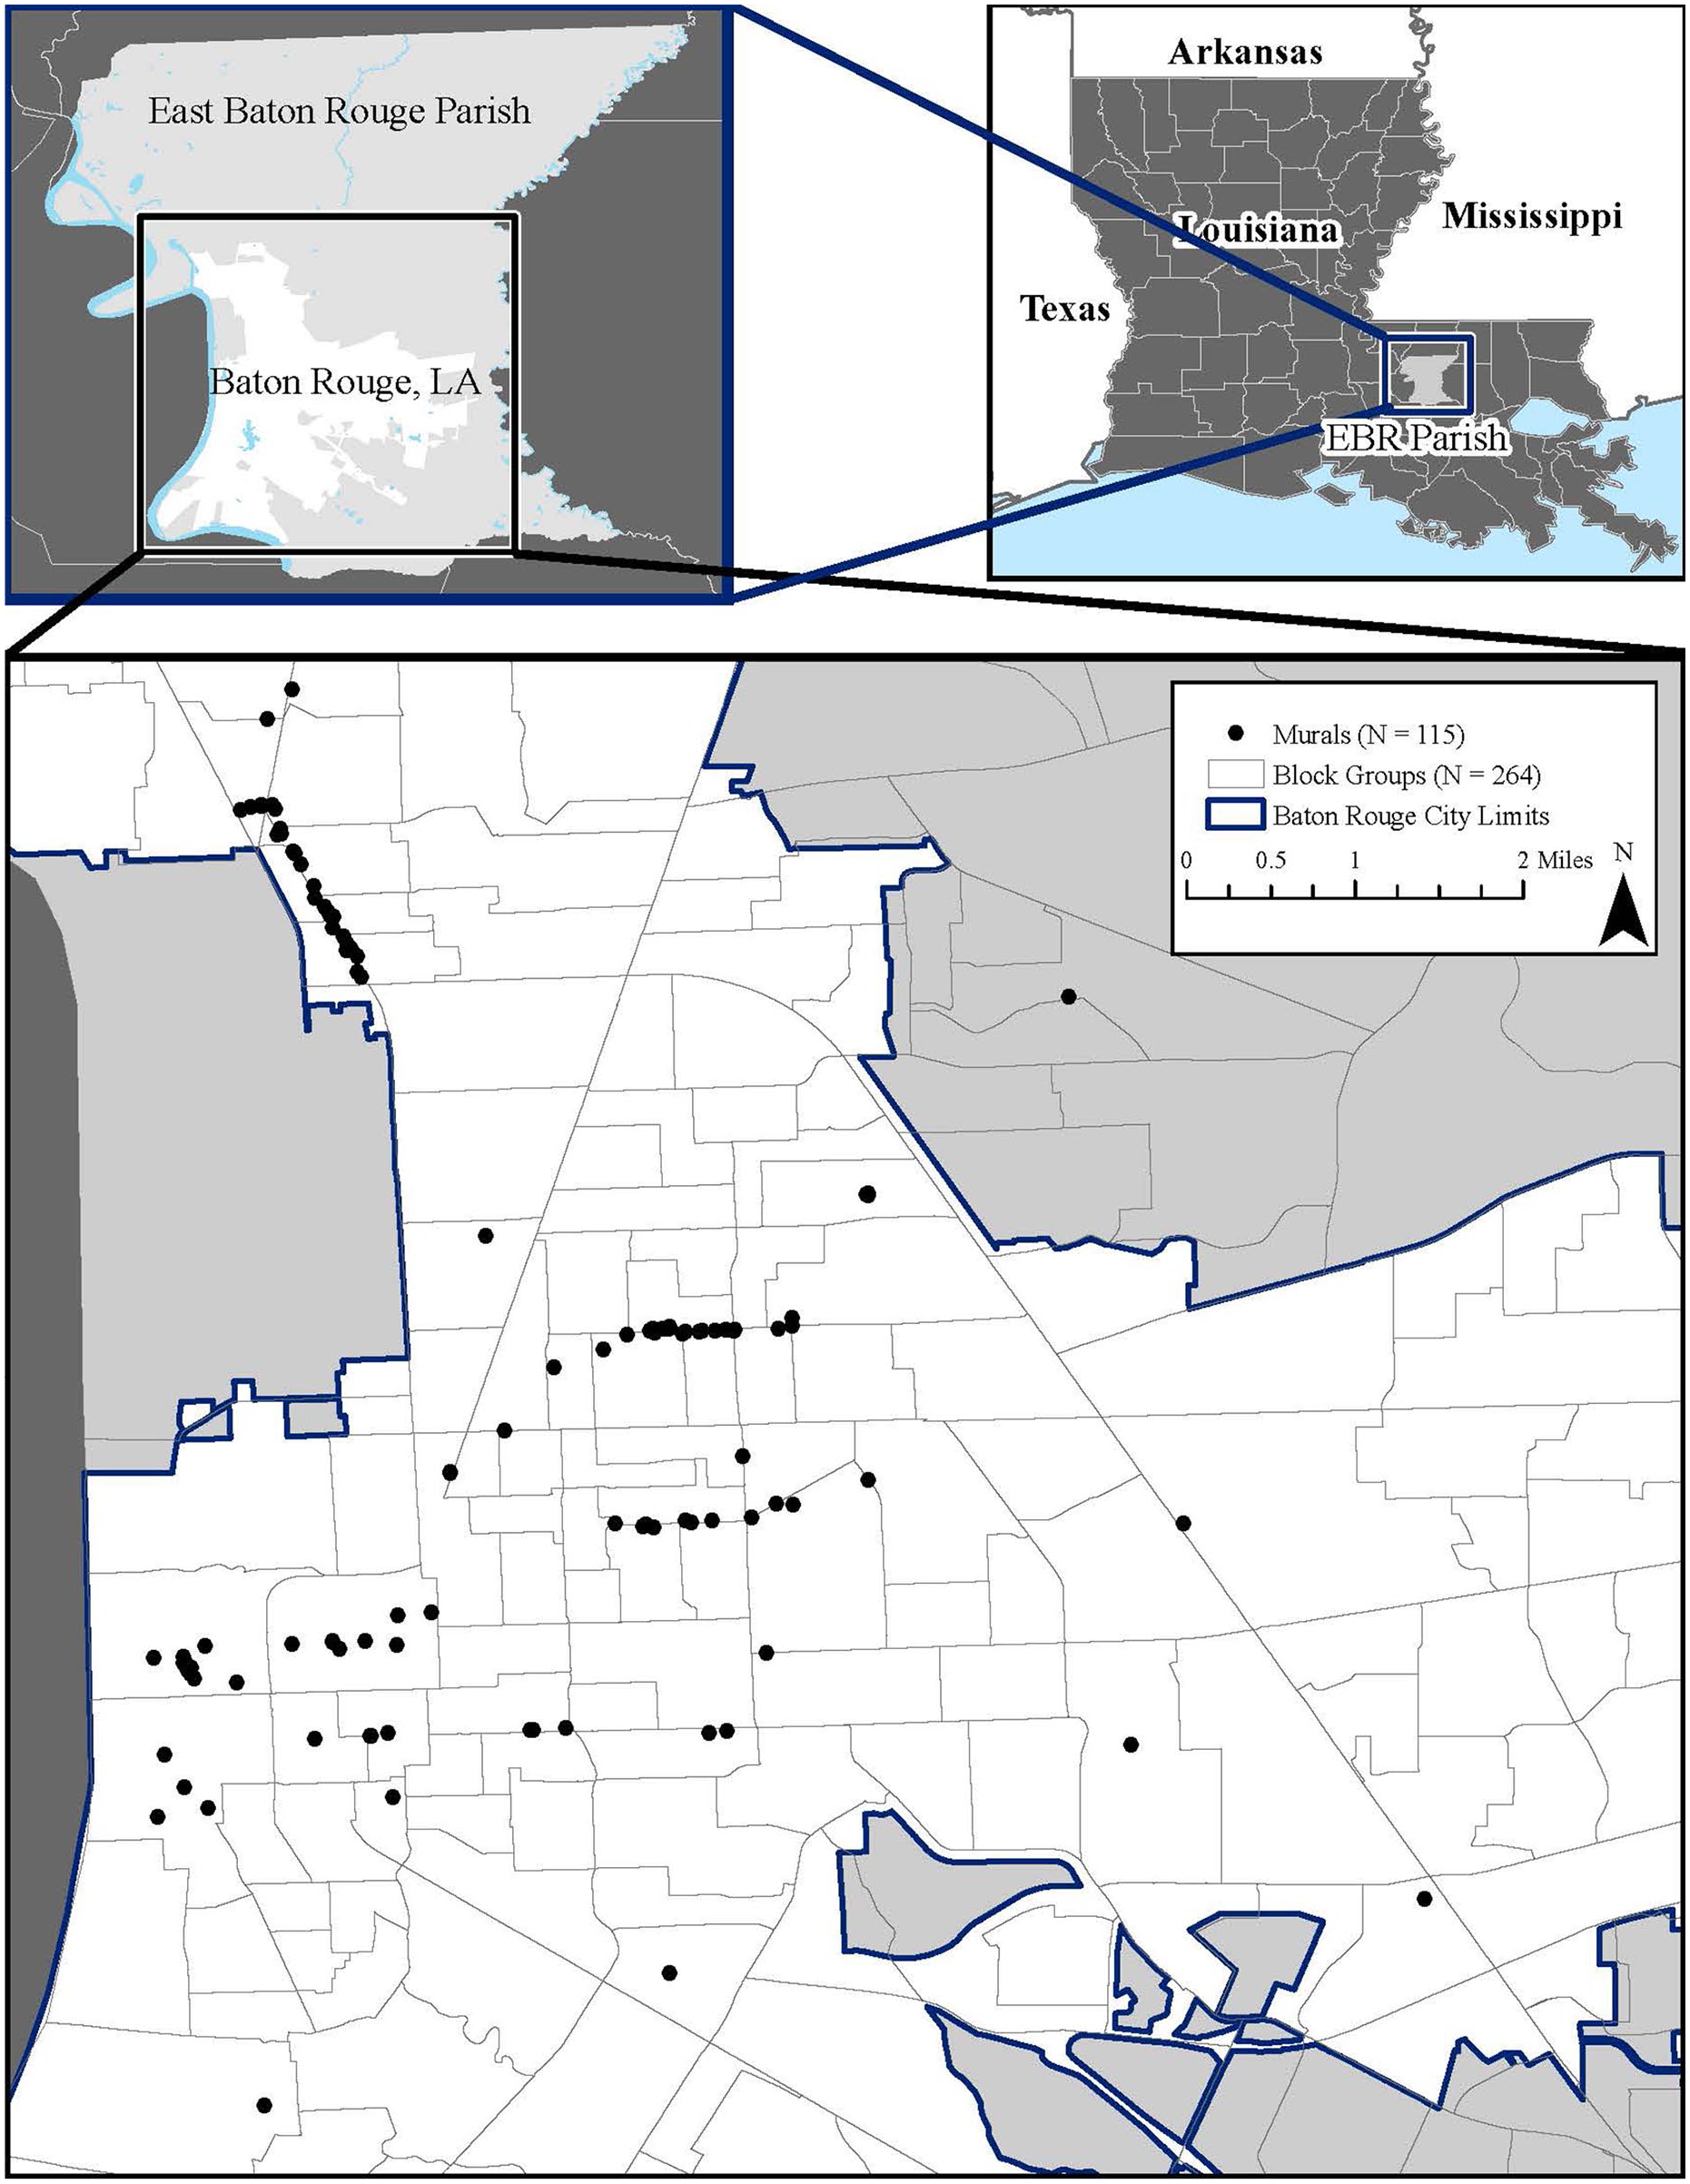
Location of The Walls Project murals.
Analysis Strategy
Analyses were conducted in two stages. The first stage analyzed changes in the number of calls for service for violent crime within 500 feet of each mural installation during the year prior to and after each mural installation. The actual year of installation was omitted from the analyses to control for the wide range of installation durations (i.e., one week to several months). Geographic boundaries of a 500-foot buffer area surrounding each of the murals were determined to isolate the target regions for where the impact of the murals might occur (Lim and Wilcox 2017; Valasik, Brault, and Martinez 2019).
The second stage of the analyses examined variation in calls for service for violent crimes at the block group level between 2011 and 2019. The starting point of 2011 was selected because this was one year before The Walls Project initiative began. The ending year of 2019 was selected because this was the last year for which call for service data was available for complete years. The transition to a larger unit of analysis was required to incorporate control variables that allowed for the comparison of calls for service in areas where murals were installed with areas where murals were not installed.
The block group analyses were assessed with longitudinal Poisson regressions with block group population count treated as an exposure variable. Previous longitudinal studies of neighborhood correlates of violent crime used a fixed-effects or random effects analysis strategy to control for unmeasured variable bias (Barton 2016; Papachristos et al. 2011; Smith 2014). Fixed-effects regression models are preferable to random effects models because of their greater ability to control for omitted variable bias, but fixed-effects models require all independent variables to be time variant. The fixed nature of the American Community Survey block group estimates did not allow for this, so the current study used a random effects regression strategy. While unable to control for unmeasured variable bias in the same way as fixed-effects regression, random effects regression was an improvement over ordinary least squares (OLS) regression because the standard error estimates adjust for the within-unit correlation that occurs with repeated measurements in longitudinal research (Allison 2005).
Data and Measures
Dependent Variable
Data for the dependent variable were collected from Open Data BR (Priola 2018). These data included address-level information for 35,297 calls for service received by the Baton Rouge Police Department (BRPD) for incidents of violent crime (i.e., assault, battery, homicide, robbery of a business, and robbery of a person) between January 1, 2011, and December 31, 2019. Of these calls for service, 2,665 occurred within 500 feet of a mural installation during the study period. Call for service data potentially differs from the more frequently used arrest data which have the additional qualification of being cleared by the police. Klinger and Bridges (1997) found that calls for service may undercount the number of violent crimes that occurred, while more recently, O’Brien and Winship (2017) found calls for service were a strong predictor of crime at later time points. This suggests that call for service data were adequate for the current study and that comparable analyses with arrest data would find substantively similar and stronger relationships than those found in the current study. Calls for service for violent crime were geocoded to the 500-foot areas around mural installations for the descriptive analyses and at the block group level for the multivariate analyses.
Independent Variables
Information for the control measures for the multivariable analyses was collected from the 2013 to 2017 American Community Survey 5-Year Estimates because the midpoint of 2015 matched the midpoint of when The Walls Project was initiated (2011) and when a complete year of calls for service was available (The Walls Project 2019). Consistent with broader research on neighborhood correlates of crime, we controlled for racial segregation, percent ages fifteen to twenty-four years, and median household income (Hipp and Boessen 2013; Light and Thomas 2019; Peterson and Krivo 2010; Valasik et al. 2017; Zahnow 2018). Racial segregation was a measure of black–white entropy calculated using the Geo-Segregation Analyzer (Martori, Pearson, Fournier and Apparicio 2014). We limited our entropy measure to black–white because the racial composition of Baton Rouge is about half non-Hispanic black and about half non-Hispanic white, with about 7 percent of the population identifying with another race (Cable 2013).
Results
Mural installations represent very fine neighborhood-level changes, so the first part of our analyses examined changes in the number of calls for service within 500 feet of mural installations. Results in Table 2 indicate that on average, areas within 500 feet of mural installations were characterized by 2.621 calls for service during the year prior to a mural being installed and about 2.343 calls for service during the year after mural installation. This decrease was slight and not significant.
Descriptive Statistics for the Number of Calls for Service for Violent Street Crimes within 500 Feet of the Location of Each Mural before and after Murals Were Painted (N = 111).
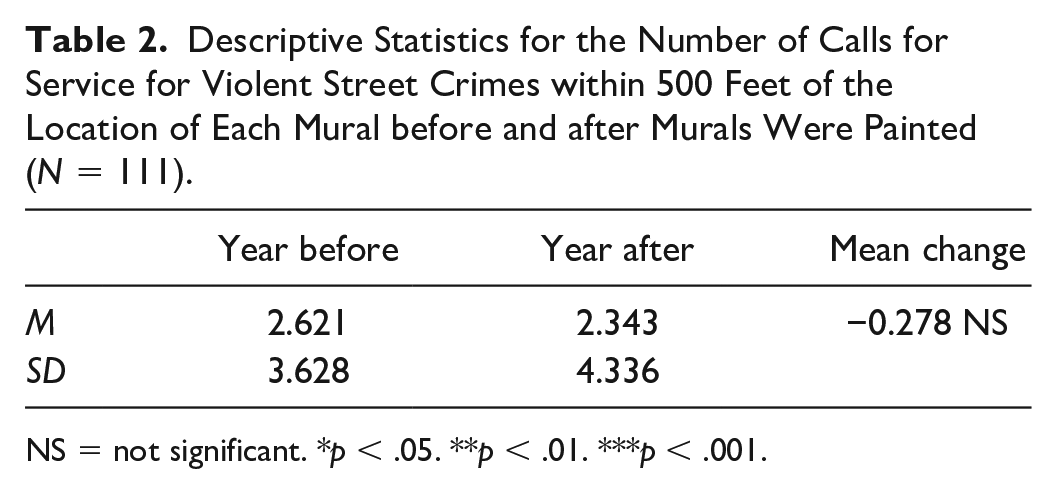
NS = not significant.
*p < .05. **p < .01. ***p < .001.
Descriptive Statistics for Block Group Level Analyses
Table 3 displays descriptive statistics for the block group level analyses. The mean number of calls for service for violent crimes declined in the average block group gradually from 2011 (24.300 calls) to 2015 (18.160) before gradually increasing to 20.330 in 2017 and starting to decline again. Figure 2 shows the mean number of calls for service in block groups where murals were installed compared with the mean number of calls for service in block groups where murals were not installed and with the city mean. Data are missing for block groups with murals for 2011 because The Walls Project began in 2012. Block groups where murals were installed during the study period were more likely to experience an increase in calls for service between 2012 and 2013 before experiencing a relatively steady decline for the remainder of the study period. The spike in 2013 was likely a product of increased gang violence in Baton Rouge. The statistics for the other groups show that block groups where murals were not installed closely mirrored city averages in calls for service and that both experienced relatively steady declines throughout the study period. While all three groups show declines over the study period, block groups with mural installations were more likely to experience larger declines.
Descriptive Statistics for the Block Group Level Analyses (N = 264).
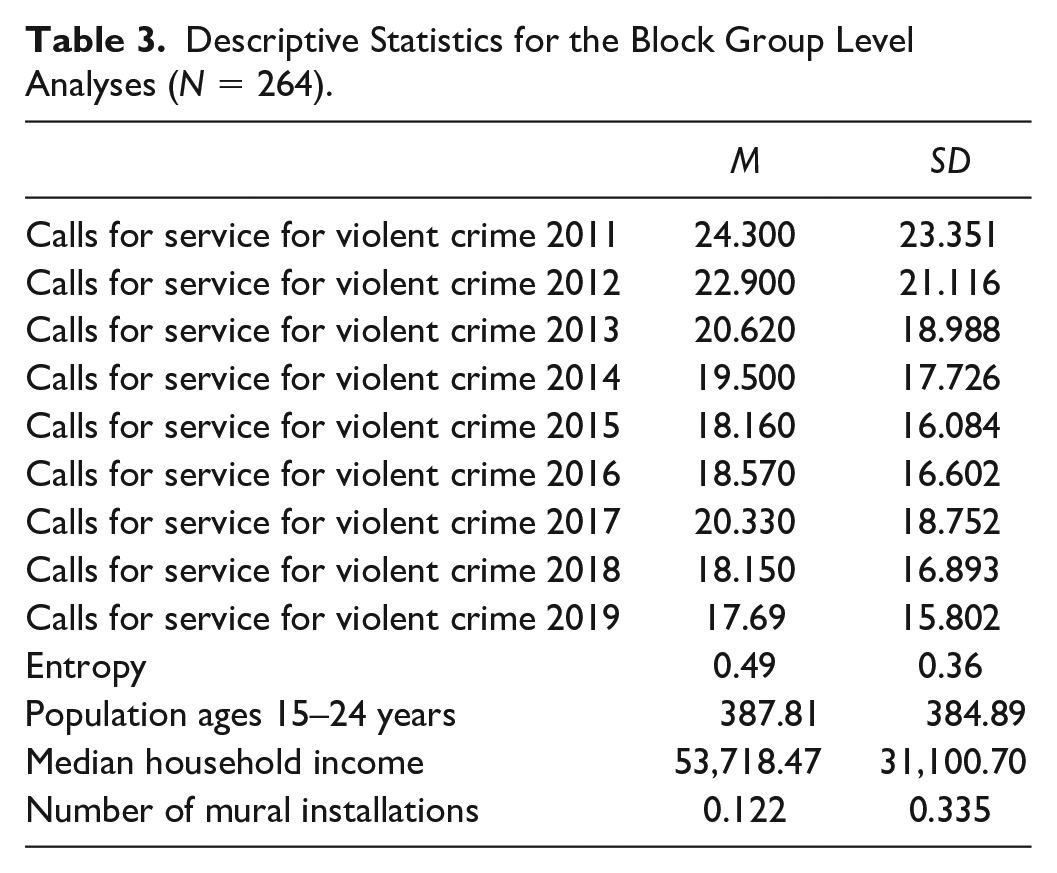
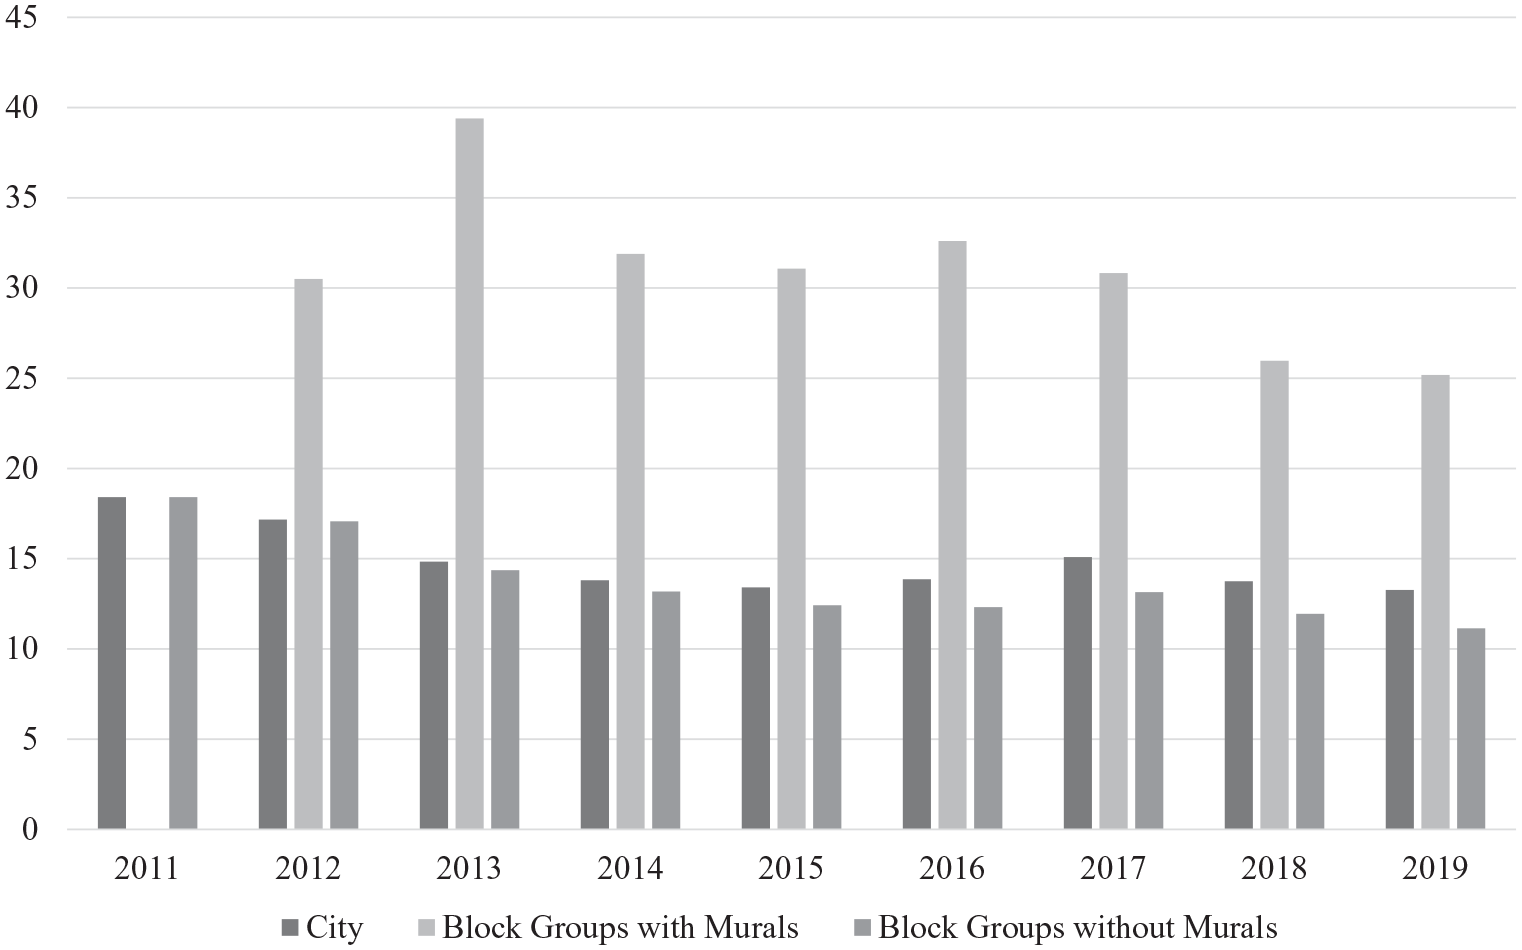
Calls for service for violent crimes 2011 to 2019.
Descriptive statistics for the full sample of block groups indicate a high degree of racial segregation in Baton Rouge with an entropy score of 0.494. The average block group also contained about 387 residents between the ages of fifteen and twenty-four years. The median household income across block groups was $53,718.47, but the standard deviation of $31,100.70 shows household incomes varied substantially. Descriptive statistics for the mural installation variable show 12.2 percent of block groups contained at least one mural installation.
Random Effects Regression Analyses
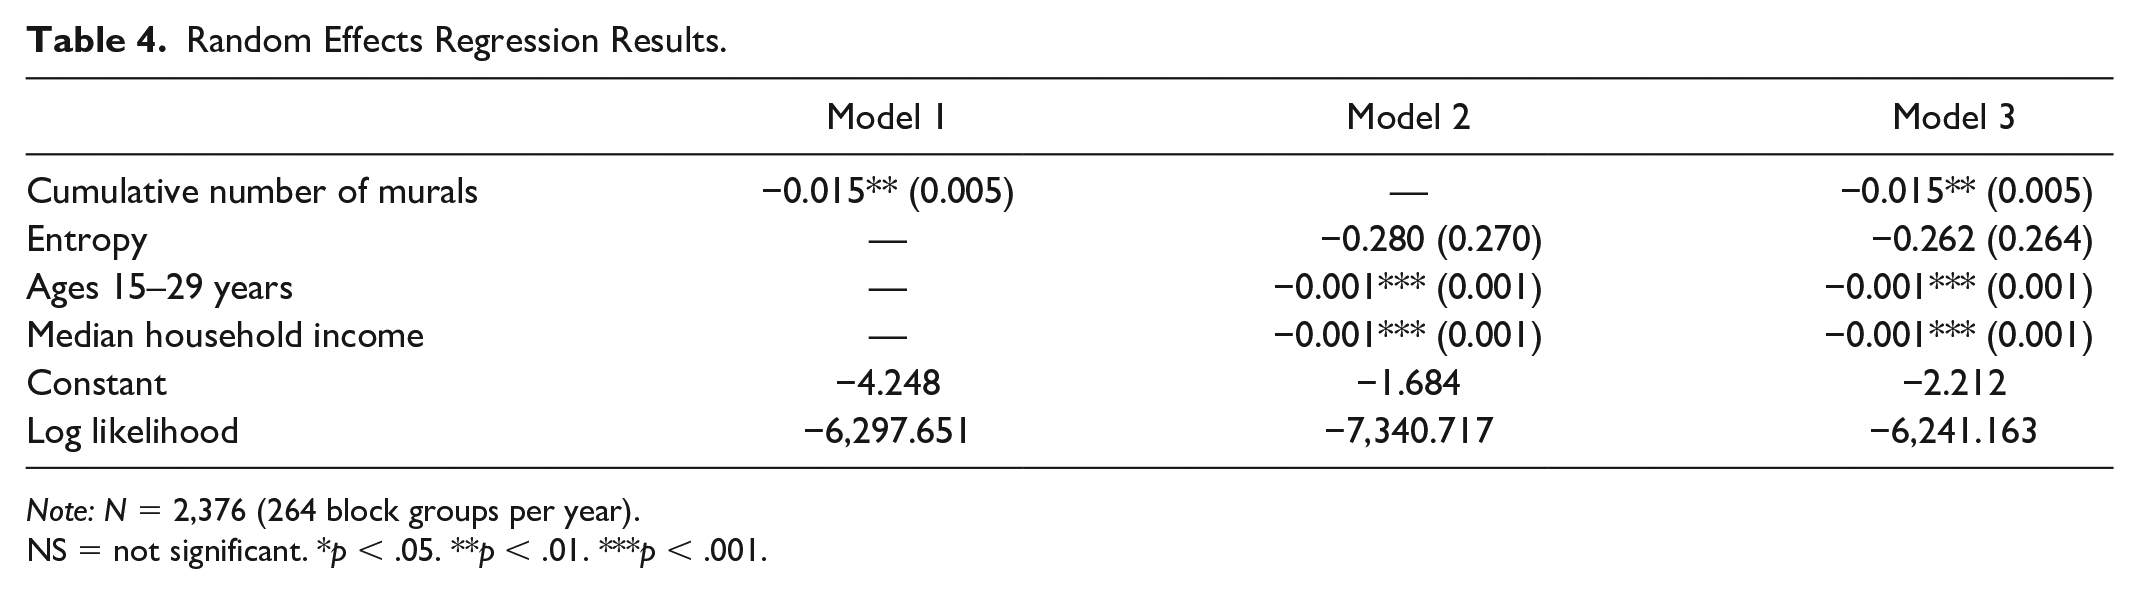
Table 4 presents results of the random effects Poisson regression analyses. Model 1 regressed the number of calls for service on the cumulative number of mural installations per block group. The results indicate that block groups where murals were installed were more likely to experience declines in calls for service for violent crime (β = −.017, p < .001). This is important to note because descriptive results in Table 2 indicated calls for service significantly declined in the 500-foot areas around mural installations and because Figure 2 showed the number of calls for service in the average block group declined during the same period.
Random Effects Regression Results.
Note: N = 2,376 (264 block groups per year).
NS = not significant. * p < .05. **p < .01. ***p < .001.
Model 2 regressed the neighborhood control variables on the number of calls for service. The results show that calls for service were more likely to decline in block groups with more individuals in the age range of fifteen to twenty-nine years (β = −.001, p < .001) and greater median incomes (β = −.001, p < .001). The results also indicate entropy was not significantly associated with calls for service controlling for other neighborhood characteristics.
Model 3 regressed the number of calls for service on the cumulative number of mural installations per block group controlling for other neighborhood characteristics. Like Model 1, results indicate that block groups where murals were installed were more likely to experience declines in the number of calls for service. Age and median household income continued to be negatively associated with calls for service.
Summary of Results
In summary, the descriptive and multivariate results presented in the study suggest the efforts of The Walls Project were associated with declines in calls for service for violent crime in more disadvantaged areas of Baton Rouge. Descriptive results show that calls for service declined within 500 feet of mural installations, but also that the decline was not statistically significant. Results of the multivariate analyses indicated calls for service were significantly more likely to decline in block groups where murals were installed.
Discussion
The relationship of blight reduction with violence has been discussed for several decades, but empirical research suggested mixed implications (Kondo et al. 2018a; MacDonald and Stokes 2020; Skogan 2015). The current study contributes to this research by assessing the relationship of mural installations painted by The Walls Project, a blight remediation effort, with calls for service for violent crime in Baton Rouge, Louisiana. Specific contributions of this study include the extension of research on the relationship of blight remediation with violent crime to a medium-sized American city at multiple levels of analysis. Findings varied by the level of analysis and highlight the importance of how broader neighborhood characteristics might influence violent crime.
Results of the descriptive analyses indicate mural installations were associated with slight declines in calls for service for violent crimes. This suggests The Walls Project had a small impact on reducing the number of specific areas potentially considered crime attractors or generators. This also potentially highlights a weakness of first-generation CPTED initiatives that only focused on changing micro places rather than engaging with larger neighborhood spaces of neighborhood communities (Cozens and Love 2015).
Results of the block group level analyses suggest the influence of mural installations was larger than just the micro areas around mural installations and support the decision to engage with the MAUP in the current study. This decision was important for two reasons. First, recent research called for more generalizable studies about the implications of community art for neighborhood revitalization that analyzed the association of such initiatives with outcomes outside of a single or small group of neighborhoods (Grodach, Foster, and Murdoch 2014; Woronkowicz 2016). Second, research on the relationship of revitalization and violence used varying levels of analysis and produced mixed results (Barton and Gruner 2016; Kondo et al. 2018a; Kreager, Lyons, and Hays 2011; Skogan 2015). That our multivariate analyses reported a significant negative relationship that was not found in the descriptive results highlights the potential importance of the MAUP. Given this finding, future research should assess the importance of blight remediation efforts for the immediate areas being treated and larger proximate areas that could be impacted.
This study suffered from a few limitations. First, the causal mechanism was unable to be assessed. For example, murals may have been negatively associated with calls for service because murals reduced the prevalence of blight, which in turn might have encouraged community engagement as predicted by the social disorganization framework and The Broken Windows Thesis. Alternatively, declines in calls for service might have been due to changes in guardianship and social control as predicted by environmental criminology and routine activities. Second, we were unable to compare our results with a comparable blight remediation initiative in Baton Rouge. This was potentially important because local community characteristics and public–private partnerships were found to be associated with different forms of urban revitalization (Grodach, Foster, and Murdoch 2014; Murdoch, Grodach, and Foster 2016) and potentially influenced the relationship of blight remediation with violence (Cozens and Love 2015; Kondo et al. 2018a). This has implications for longer term effects of blight remediation efforts as the greater potential for revitalization efforts to serve local audiences increases the likelihood that remediation efforts will be maintained (McKinnish, Walsh, and White 2010). The Walls Project is an example of an initiative that incorporated multiple local partners and involved efforts by neighborhood residents. Without a comparable remediation effort, it remains unclear whether such partnerships influence the effectiveness of blight remediation in reducing violence. Finally, the selection of Baton Rouge as a medium-sized city with a high level of violence was a strength because much of the previous research focused on larger cities, but it was also a limitation because features of Baton Rouge such as the high degree of racial residential segregation potentially may have reduced the generalizability of the results. The relationship of blight remediation in medium and smaller cities should be assessed further.
While our results suggest The Walls Project was at least partially associated with reductions in violence, we encourage policy makers to consider a few caveats. First, this initiative focused on some of the most violent areas of a city with a long history of violence (Barton and Gruner 2016; Valasik, Brault, and Martinez 2019). This meant the initiative faced a very steep uphill battle from the start. Second, the installation of murals may have had unmeasured effects such as the encouragement of local community cohesion because this initiative reduced the prevalence of signs of disorder with the help of local residents. The importance of these characteristics was highlighted in previous research but was unable to be assessed in the current study due to data limitations. Finally, mural installations may have produced increased guardianship as the artists and community members spent time in the area during the installation. This might have led to later declines in crime that were unable to be assessed with our data. In short, more research should be conducted about the relationship of blight remediation with violence, but such research should not be limited to the direct relationship of blight remediation with violence.
Footnotes
Declaration of Conflicting Interests
The author(s) declared no potential conflicts of interest with respect to the research, authorship, and/or publication of this article.
Funding
The author(s) received no financial support for the research, authorship, and/or publication of this article.