
Abstract
This paper evaluates a citizen science initiative to assess housing conditions in multiple rural Georgia communities. Using technologies for digitized collection of volunteered geographic information (VGI) on property conditions and an online dashboard to analyze results, local housing teams identified the characteristics and prevalence of housing problems in their communities. Drawing from a pragmatist framework, we note how this process created new connections between local leaders and residents and brought attention to sometimes unexpected issues. Conversely, participation was uneven within local communities in ways that potentially limit the effectiveness of these local initiatives.
Introduction
Citizen science, defined as “projects that engage both professional scientists and non-specialists in the process of gathering, evaluating or computing scientific data” (Curtis 2018, 1), has become a common method for field research. It creates opportunities for interested non-specialists to learn more about the tools and theories that guide scientific research. In addition, the inclusion of local stakeholders can create a more diverse and inclusive body of knowledge, one that incorporates local perspectives and expertise (Connors, Lei, and Kelly 2012). Similarly, there has been a proliferation of digital tools to assist in the creation and sharing of volunteered geographic information (VGI), spatially located information that is collected either passively or actively from individuals through digital platforms. VGI often plays a pivotal role in citizen science initiatives.
In this article, we describe an initiative to use citizen science and VGI as part of community housing assessments. As part of a statewide, university-led partnership, our team developed a digital toolkit that supported parcel-level data collection on housing conditions in rural Georgia communities. Drawing from a pragmatist model of inquiry, we identify ways that the housing assessment process created opportunities for local housing teams to construct new understandings of local housing issues. Participation in the process of data collection also created a deeper sense of connection to the community and increased motivation to address housing problems. At the same time, many communities struggled to create a stable and representative housing team, leaving low-income neighborhoods underrepresented and affecting the pace and quality of data collection.
Our paper draws from a pragmatist model of social inquiry, asking how this citizen science–based approach mediates local relationships and creates new understandings of public concerns. Through this process, we argue, local housing teams did more than just generate quantitative data to represent housing problems. They also increased their own collective ability and motivation to respond to these issues.
Pragmatism, Planning, and Citizen Science
Drawing from the works of early twentieth-century thinkers such as John Dewey and William James, pragmatism is a non-foundationalist philosophy that emphasizes the social situatedness of knowledge (Dewey 1997; James and McDermott 1967). As Barnes (2008, 1544) puts it, pragmatism views ideas and knowledge “like knives and forks, implements to accomplish particular tasks, and not transcendent truths.” Those “tasks” are the ongoing routines that constitute social life. Knowledge is created through a process of inquiry, where a diverse set of stakeholders develop a shared understanding of social problems. This knowledge is constructed through the process of inquiry, not predating it like an artifact waiting to be unearthed. Harney et al. (2016) argue for a “process pragmatism.” Rather than working with pre-existing publics that are already assembled around the pre-existing agendas that the academic is able and willing to endorse, process pragmatism seeks to use the process of research and knowledge production to construct new publics, new understandings, and new capacity to act. Working in the spirit of pragmatism involves bringing together diverse groups of people with differing worldviews, to find common ground and to create new publics united around issues of common concern. (Harney et al. 2016, 324)
Pragmatism’s focus on a deliberate public process has clear relevance to urban planning. Healey (2009, 284) emphasizes the importance of early work by John Forester who described how pragmatism can help planners “challenge inequities and oppressions and help to build humane and richly informed democratic polities.” Healey (2009, 288) notes multiple contributions of pragmatism to planning theory including a focus on social practice, a holistic view of the planning process, and an emphasis on “the human potentiality for hope even in dark times.” Several authors note the ethical dimension of pragmatist thought (West 1989). Song (2015) argues that through its blending of an inclusive process and explicitly stated goals of social justice, pragmatism offers a form of research praxis uniquely able to address persistent inequalities.
Several authors have critiqued pragmatist thought for a narrow focus on dialogue and neglect of power relations (Corburn 2005; Healey 2009). In response, Forester (2013) has described how critical pragmatism focuses on the role of planners as mediators, focused not just on the substance of debate but on the actions and relations between actors in the planning process. Corburn (2005) further points out that Dewey’s (1997, 38) work fails to consider problematic aspects of the knowledge produced by scientific experts and community members: “Scientists may be unable to translate their information into the ordinary language of everyday practice and publics may be unable to translate their knowledge into the specialized language of science.” This produces epistemological gaps that themselves are potentially political in nature. Corburn’s (2005) “street science” builds on pragmatist foundations to provide a framework that explicitly values local knowledge to bridge this gap. Sweet’s (2018) concept of “cultural humility” also emphasizes the need to decenter the expertise of planners and public officials to make room for other forms of knowledge. In short, scholars have drawn on pragmatism to develop deliberate and deliberative processes of public making and collaborative inquiry that recognize the varied expertise of research partners.
Similar to Corburn’s model, citizen science has become a widely used framework for public engagement in scientific research. Curtis (2018) describes two main strands of citizen science. The first is participatory action research, where community members themselves drive research into collectively identified problems, which has clear connections with a pragmatist approach (see also Kindon, Pain, and Kesby 2007). The second is scientist driven research, where non-experts are enlisted in the process of data collection for already existing research projects. (Sullivan et al. 2014).
A related term, VGI, describes explicitly spatial data produced by ordinary citizens (Goodchild 2007; Haklay 2013). These data can be collected through both active and passive participation. The former includes research projects like eBird or online review platforms such as TripAdvisor. The latter includes services that collect data as background information, such as location services on cell phone applications and geographically located posts on social media (Haklay 2013). VGI data can suffer from inconsistency in sampling and data quality (Brovelli, Minghini, and Zamboni 2015; Brown 2017), but the large size of resulting datasets and unique insights they provide can be outweighing benefits.
VGI sometimes lacks the active engagement common to most citizen science projects, and not all citizen science includes explicitly spatial data. One of the most prominent examples of VGI is the web service OpenStreetMap, which provides user-contributed global data on roads, buildings, and natural features (Bittner 2016). While this dataset has been used within research projects or for social initiatives such as crisis mapping, it is not itself created to answer specific research questions (Haworth 2018; Quinn and Yapa 2015). Yet VGI and citizen science do overlap. For example, a website created to study the spread of disease between oak trees provided tools for concerned citizens to add nearly 2,000 observations to a research dataset (Connors, Lei, and Kelly 2012; see also Taki et al. 2018).
Citizen science and VGI do not necessarily lend themselves to pragmatist inquiry. In many cases, lay publics are enrolled in citizen science projects that reinforce rather than question the primacy of scientific and technical expertise. Likewise, analysts may collect passively contributed VGI (e.g., social media postings, phone location data) in ways that render citizens as simply “citizen sensors” (Goodchild 2007). This is evident in smart city projects that incorporate analysis of topics such as bike sharing (Attard, Haklay, and Capineri 2016) or real-time traffic conditions (Johnson and Sieber 2013).
Yet both citizen science and VGI can mediate a process of inquiry. For example, virtual world building software such as Second Life can provide creative forums for deliberation on the futures of public space (Foth et al. 2009). Cardullo and Kitchin (2019) use Arnstein’s (1969) ladder of citizen participation as a way to classify the kinds of “digital citizenship” created through these projects, starting from passive provision of and/or consumption of crowdsourced data but potentially including forums like hackathons or other meetups where new solutions to urban problems are identified and developed. Falco (2016, 4) similarly argues for the potential role of open-source technologies in empowering citizen participation by reducing the need for professional assistance. This in turn allows community members to create “plans that better represent their wants, desires, needs, vision for their own community and social preferences.”
The collection and use of VGI in citizen science projects can thus facilitate the process of mediation (to use Forester’s term) and social inquiry in (at least) three ways. By providing a platform that necessarily involves city staff, organizational leaders, and local residents in the process of data collection, this process facilitates new collaborations between these actors. This process may also result in unexpected encounters with and between neighborhood residents during fieldwork. Last, by generating a data set that requires analysis and interpretation, this process creates space for new understandings of the community and its future plans to emerge. Put another way, a citizen science framework using community-based data collection creates opportunities for renegotiated relationships and collective understanding essential to a process of social inquiry. A digital process lessens the necessary logistical labor or data entry and provides a structured framework for this process, and this can allow local communities with limited resources to focus on the substantive work of relationship building and local planning.
Realizing these potential benefits can be difficult in practice, however. Our research evaluates the potential of a citizen science–based planning initiative through analysis of a community housing assessment program in seven cities across rural Georgia. Specifically, we give attention to the ways that a community-based process of VGI data collection affected participants’ relationships with each other and local residents, changed collective understanding of local problems, and informed collective planning for future change. We do so while also evaluating the extent of residents’ involvement in these projects. In doing so, we contribute to understanding of how the use of VGI and citizen science may enhance an inclusive, pragmatist model of community planning.
Setting and Methods
The communities we partnered with for this research were part of the Georgia Initiative for Community Housing (GICH), a program designed to facilitate community planning for affordable housing. This program is collaboratively led by the University of Georgia and the Georgia Department of Community Affairs. Each year, five communities enter this program, and these are most often small municipalities from rural parts of the state. As part of their application, communities assemble a housing team that includes a range of key stakeholders, including elected officials, members of community organizations, and housing professionals such as real estate agents or mortgage lenders. Leaders of these housing teams are most often employed in local departments of planning and/or economic development but do not receive additional salary for their leadership role. Over the course of GICH’s three-year program, planning teams attend bi-annual retreats where they attend sessions on issues including techniques for managing their properties, tools for reducing blight, and information for working with state housing authorities and their funding programs. The goals for each community most often included targeted redevelopment of a set of properties along with applications for state or federal funding. In its fifteen-year history, GICH has enrolled seventy-six communities throughout the state. Each of the authors has a connection to GICH. Jermaine Durham is the director, Kim Skobba has worked with multiple communities to do housing assessments and other research around housing issues, and Jerry Shannon helped develop the digitized process described in this article.
In recent years, many communities have included housing assessments to provide data for redevelopment plans and funding applications. Community housing assessments, also called windshield surveys, provide a systematic approach to understanding exterior conditions of the local housing stock and other neighborhood issues (White et al. 1992). These house-by-house surveys evaluate specific aspects of the housing structure or lot conditions. In most cases, planning teams have opted to conduct this assessment themselves rather than hire an outside agency. Working with the city of Pembroke, one of the first communities in GICH to conduct their own housing assessment, as well as an existing tool developed by Jeffrey Crump (2003) at the University of Minnesota, faculty at the University of Georgia, including one author of this paper (Dr. Skobba), developed a standardized data collection form for this process. Most communities involved multiple community groups—including local academic institutions, churches, or non-profit organizations—in organizing and conducting this survey. Yet as we describe later in the paper, this process was often far from smooth, and volunteers were often recruited throughout the survey process.
In 2017, the authors developed a second version of this survey with housing assessment or appraisal experience. It includes a foundation to roof assessment of built structures as well as questions on the condition of the lot (e.g., overgrown grass, trash/tires; Table A1, shown in the online supplementary file). Each issue listed on the survey has a point value, and the sum of these points is used to create a general classification from a list of six categories. Supplemental Table A1 also provides a summary of categories included in each of these two surveys, though for version 1, not every community included each category. Table A2, also in the online supplementary file, summarizes the classification system of each survey from well maintained through dilapidated.
Through a United States Department of Agriculture (USDA) grant, our research team created a set of digitized data collection tools to support these communities. This two-part suite of tools includes online forms for data collection and a web application to map and analyze survey results. Data collection is accomplished through one of two platforms: OpenDataKit (ODK), an open-source software that is most functional on Android devices, or Fulcrum, a proprietary multiplatform data collection tool that requires a paid subscription. Both tools allow users to input data via smartphones or tablets, greatly reducing the need for volunteers to do manual data entry. Both also allow for data to be linked to existing parcel records based on address or parcel number, which reduces the risk of error and allows for the import of data on parcel ownership and tenure status for analysis. Last, these platforms include the ability to link photos of the properties to the survey records.
Once collected, these data are visualized through an online web application. Few planning teams include members with expertise in Geographic Information Systems (GIS) software for mapping and analysis. Dr. Shannon and research assistants developed an online web application using the open-source Shiny platform, created by the company RStudio for the R programming language (RStudio 2016). Through this online platform, planning team members can view properties by their overall rating and by specific property issues. They can also download records of selected properties and identify the most common problems listed in the survey data (Figure A1, found in the supplementary online materials).
Since the creation of the housing assessment survey, ten Georgia communities have moved through this housing assessment process. We focus on seven communities that generated the most responses for this paper, shown in Table 1. 1 The remaining three communities were pilot studies for this project and collected minimal data. All but one of these communities—Lewisville (~25,000 residents)—have populations less than 15,000, and four have 5,000 or less. They are located throughout Georgia: Marshalltown and Arlington in the east near the South Carolina border; Hancock, Stewart, and Lewisville just outside the Atlanta suburbs; and Benson and Tyler in the central region of the state. Tyler is also home to a regional college.
Demographic Summary of Study Communities.
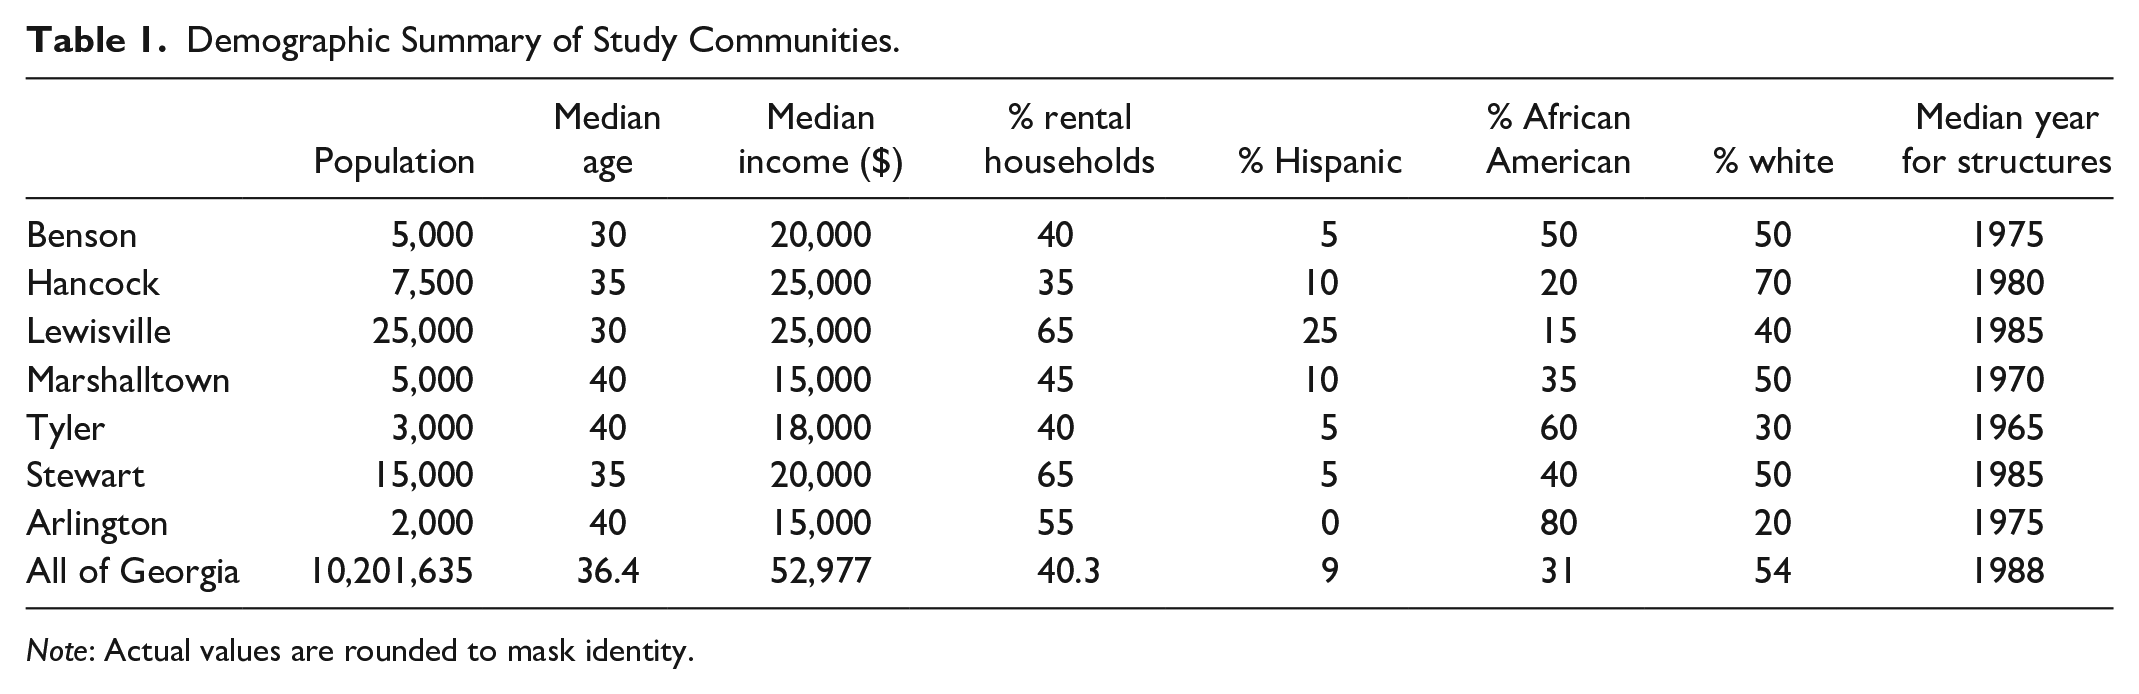
Note: Actual values are rounded to mask identity.
Table 1 provides a demographic summary of these communities from the 2013–2017 American Community Survey (U.S. Census Bureau 2019), with values rounded to mask their identity. None of these communities have a median income of more than 50 percent of Georgia’s ($52,977). The rate of renter-occupied housing ranges from 40 to 65 percent, which is at or above Georgia’s statewide rate of 40.3 percent. The racial composition of these communities varies widely. Arlington is 80 percent African American, while the rate of Lewisville is only 15 percent. Similarly, 70 percent of the population in Hancock is classified as white, in contrast to only 30 percent of the population in Tyler. Housing structures are somewhat older than the statewide average, with a median construction dates ranging from 1965 to 1985.
We used several methods to evaluate the outcomes of this process in local communities. First, as partners with these communities, we tracked our own experiences as participant-observers. One of the authors, Dr. Skobba, led student survey teams in three communities and so had extensive experience working with local residents and housing teams. Second, we conducted fifteen interviews with housing team leaders after the conclusion of the process, four of them with communities listed in this paper. These interviews were transcribed and coded using a directed content analysis (Hsieh and Shannon 2005). Initial themes were tied to key elements of the housing survey process such as the use of digital tools or the participation of community members. Last, we used descriptive statistics and exploratory analysis to identify trends within the collected housing data across communities.
Findings
Assembling a Housing Survey Team
While these communities began with an existing housing team, many still struggled with survey planning, training, and community outreach. Once teams had decided to start a housing assessment, they often wanted to begin data collection as quickly as possible, usually within a few weeks. This resulted in limited time on planning and recruitment. As a result, after an initial burst of activity, many communities stalled out as volunteers moved on to other tasks and plans for where to go next were unclear.
A main challenge was assembling a team for data collection. In Arlington, this was done by a paid staff with previous experience in housing assessments. Local university students were responsible for data collection in Benson, which was completed for course credit over the course of a semester. As part of the institutional partnership, students in housing classes at the University of Georgia worked with Hancock and Marshalltown for data collection, and in both cases, faculty and a smaller group of students returned periodically after initial data collection to complete the survey. Stewart and Tyler both relied on community volunteers, high school students, and city staff for data collection. While these volunteers were often local residents or nearby students, they were often strangers to targeted neighborhoods.
In communities relying on volunteer data collection, a process of continual recruitment was common. For example, a housing team leader in Stewart said the following about the process of data collection:
It’s been mostly college kids and then staff. I’ve done a lot of it. Then we had some just community volunteers. Those have been individual people who are interested in helping, and I’ll give them a stack of maps and a Kindle and just say, “All right, at your own timing, get as many of these as you can and bring them back to me.”
Right. Have you felt like it’s been helpful to do things like have a little wave of involvement like, “Hey, January is going to be, we’re going to get a bunch more data month,” and then you let it settle for a while? Or has it just been a rolling, ongoing project?
It was important for us to have the goal to reach 1,000 by the end of the year because then we had to meet it. It made us do volunteer days with the high school students and get partnered with a school club that came out and did it. That happened because we’re like, “We’re at 800. We need 200 more to get to the thousand mark.” Then that group was like, “We’ll do it. We’ll make it our community service month.” There’s been little bursts of energy with it. Yeah, and that’s consistently, we’ll get, I don’t know, a handful of houses every two weeks or so.
Many survey teams worked in short bursts to cover a broad area and then returned to fill in gaps as needed. The stop and start nature of data collection is illustrated in Figure 1. In this graph, the x-axis shows the number of days after the first property was surveyed, and the y-axis shows the rate of completion based on the final count of survey records. Lewisville is not included on this graph, as they were one of the first to use this process and did not include dates for individual records. In all communities, the first 25 percent of records were collected in the first fifty days, and in four communities, more than half of all records were collected during this time period. Yet for most communities, there is a clear lull in data collection after this point, extending between 100 and 200 days, followed by shorter bursts of activity up until the completion of data collection. In Stewart and Tyler, data collection took a year or more, but for the former this also resulted in the largest sample of any community (1,910 records). Tyler was the second largest dataset (1,315 records), and their timeline shows a steady pace for data collection punctuated by breaks of approximately fifty days.
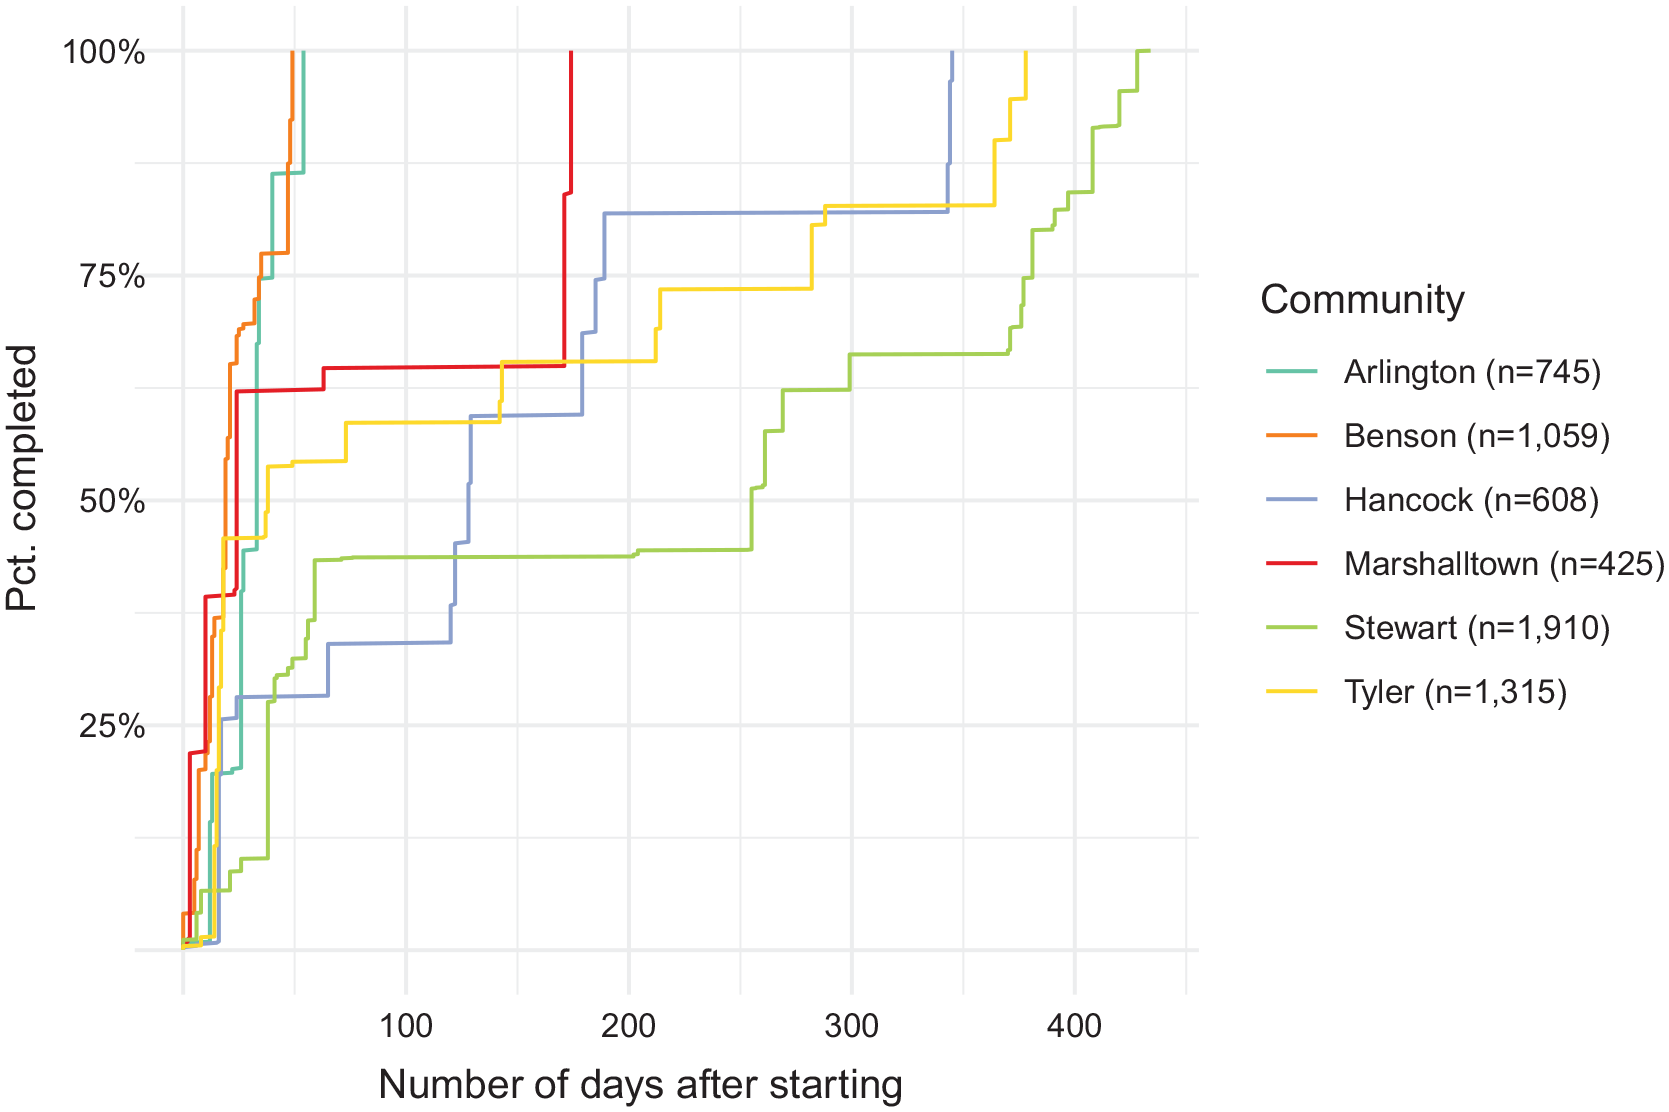
Rate of survey completion among communities.
Digital tools shaped this process in multiple ways. Most obviously, the use of tablets and digital forms greatly reduced the workload for local teams, allowing them to focus on recruitment and speeding data collection. The housing team leader in Stewart said that without the digital tools, we wouldn’t have been able to accomplish things. We wouldn’t be able to do the housing assessment. We wouldn’t have had the data or the understanding of the data to be able to have these important conversations at the local level.
Similarly, the team leader in Tyler said, “I like the fact that now I can go out and do [the survey] on my own because it’s an app that you can just put on one of these devices and head out and have it done.” Second, the use of digital data collection allowed communities to more easily track progress and plan ongoing work. Team leaders regularly checked the number of records collected and used maps of existing surveys to plan for their next steps.
Housing team leaders thus drew upon a number of networks to recruit volunteers for this process. These included existing city staff, students, and local non-profits and religious groups. The work of recruitment was an ongoing process, which led to an intermittent process of data collection. Digital tools lessened the necessary labor for community-based data collection, but even so, communities sometimes rushed through an initial planning process that could have resulted in a more sustainable and focused process.
Connections to Residents and Neighborhoods
The process of data collection also created opportunities for survey teams to interact with local residents. Many residents are understandably curious about why their homes are being surveyed. Communities have pursued systematic ways of answering these concerns. Many post notices on social media or in local newspapers prior to the event or announce it at community gatherings. Some communities print postcards with information about the assessment and contact information for housing team leaders.
In many cases, one-on-one interactions during data collection provide a chance to not only clarify the goals of the housing assessment but also to talk with residents about needs in specific neighborhoods. Once residents understand that the goal of the assessment is to secure resources for neighborhood improvements, they often speak about specific concerns: properties in need of repair or chronic problems across multiple properties. A housing team leader in Hancock described it this way: Doing the walkthrough, some of the people would come out on their porches or out in their yard and actually were thrilled that we were doing the assessment and glad to hear that we care. And that was probably the biggest surprise because I think we’re not always aware of the situation. We look at the cover and not inside.
Similarly, another team leader emphasized the value of physically surveying each house, giving this advice to future communities: To walk their neighborhood with someone from the neighborhood. And to walk through neighborhoods with their eyes open. And then the emphasis on that is walking. There are so many things that gloss over and you pass by in your car every day and you don’t think about it. We don’t allow ourselves to think about it. But the act of walking engagement is a different way to experience your community.
The mayor of one community expressed something similar: You know, when you’re even, when you’re campaigning, you might go through the community, you’re not thinking a whole lot about it. But it was you know, I’m happy that I was able to do most of it, because it really, it was really an eye-opener.
In these examples, the experience of walking through neighborhoods allowed the reality of common housing problems to fully sink in for housing team members.
While collecting data in Marshalltown, a resident spoke with one of the authors (Dr. Shannon) about an adjacent property that clearly needed repair. “Make sure you get that one,” she said, noting that it had been in poor shape for years and expressing frustration that the city had done little to address it. In other communities, we have observed lengthy discussions between city staff and local residents around pressing housing needs. The long-term impact of these conversations is difficult to evaluate, creating informal relational connections between housing team members and local residents. We did not follow-up with residents on changed perception of their neighborhood or the local government, but this could be one topic for future research.
In a few cases, survey teams were comprised of students from nearby universities, often tasked with completing surveys in unfamiliar, often low-income neighborhoods. Through the process of data collection, students became more comfortable with both the neighborhood and interacting with residents. In Tyler, a housing team leader expressed it this way:
There were several [students] that came back and help me even after the class was over with. And they offered . . . they wanted to do that. They wanted to come back and be part of it. But it was mesmerizing to see them. They . . . the fear because we went in some really bad places. Some wouldn’t get out of the car. Some would get out the car, some wanted the doors locked and didn’t want to roll down the windows. And I live here, so it didn’t scare me so bad, and they would all walk, and the residents would walk up to my car, you know, and they’d say “what are you doing?’ And, you know . . .
They’re just people.
They’re just people.
In this case, the team leader highlights how an initial reaction of fear and uncertainty about “really bad places” changed over time as students realized neighborhood residents were “just people.” In Stewart, the team leader expressed how involving high school students in data collection had a similar effect: Well, anytime you get youth engaged it expands the conversation. Because all those kids go home and talk to their parents and talk to their friends, and they ask questions. And I mean, it makes . . . honestly, it makes people that have the spending power and decision-making power to pay more attention. You know, if your kid comes home and says, “I just walked down the street, and they live in deplorable conditions.”
These interviews do underscore the outsider status of housing survey teams, even when these individuals were residents of the broader community. While the survey process did not fundamentally change this dynamic, it did produce a sense of connection and concern among volunteers. The labor-intensive nature of this survey process provided an opportunity for these individuals to form new connections to unfamiliar neighborhoods and their residents, and we see this as a key benefit of this approach when compared with outsourcing survey work to a private agency.
At the same time, these experiences suggest there is room for a more inclusive process, one where the residents are more actively involved in data collection and analysis. While students are often an available volunteer base, pairing them with local residents might better incorporate the latter’s local knowledge and perspective. This in turn may increase the local collective capacity to address key housing problems.
Community Housing Data
Community collected data also informed local understanding of housing conditions. Together, these seven communities rated 6,841 structures. Table 2 shows the overall classification of structural conditions based on collected responses. In all communities, a plurality of structures were classified as standard (v1) or well maintained (v2), and in five of the seven, a majority of structures received this classification. The notable exception to this trend is Marshalltown, where only 28 percent of properties were rated well maintained. This community had one of the oldest median structure ages of all communities and also one of the lowest median incomes. On the high end, 27 percent of structures in Tyler were rated as dilapidated, and Stewart, Benson, Arlington, and Marshalltown all had approximately 10 percent of structures rated as needing serious repair.
Housing Classifications by City.
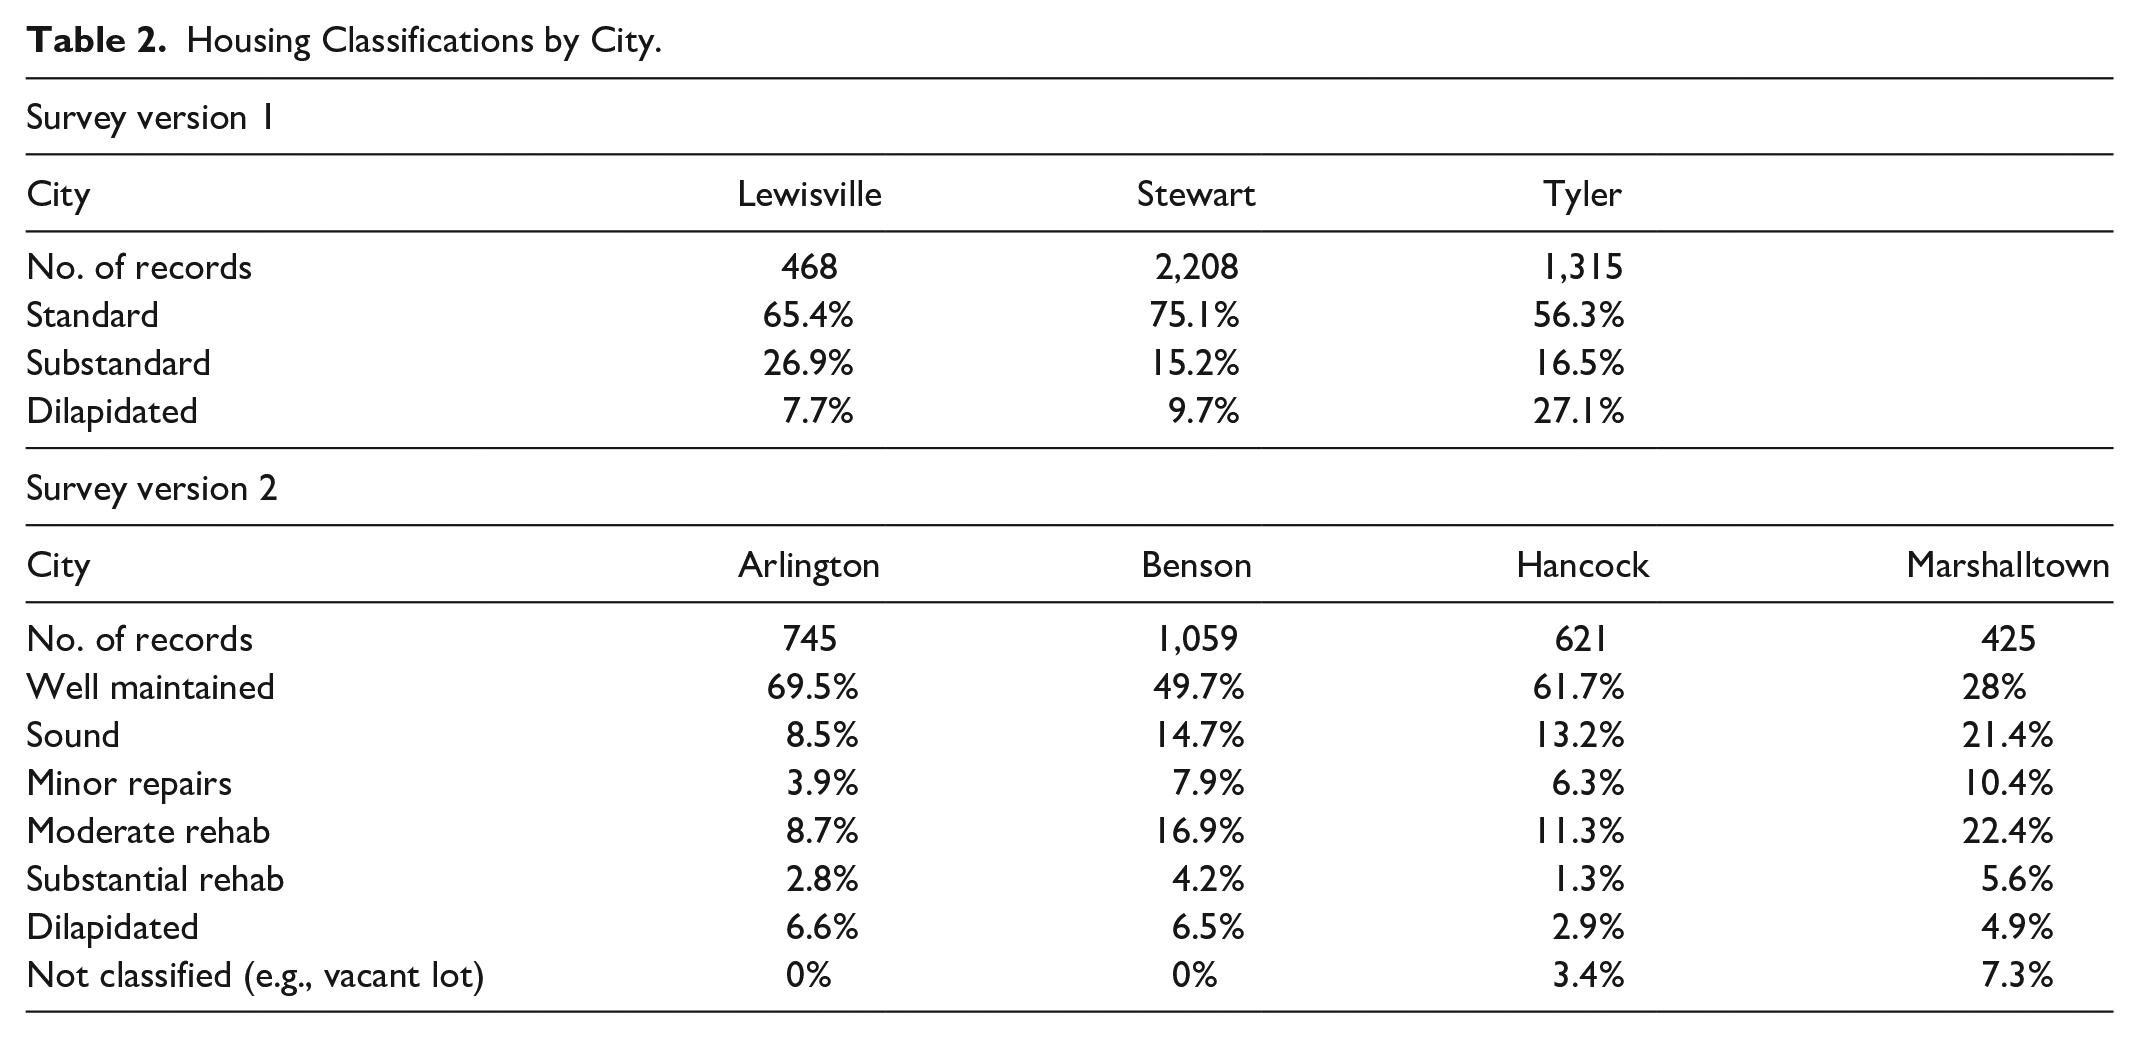
While the two versions of our housing survey differ in question formatting and issues focused on, there are also a few areas of overlap where we could link the two surveys. We analyzed the prevalence of these issues across communities, leaving off Lewisville because it had more highly customized questions than the other early communities. Table A3 (shown in the supplementary online appendix) shows these rates for all issues present in at least 2 percent of survey responses.
Across all communities, the three most common issues reported were dry rot (16.1%), repainting on the exterior (15%), and missing shingles (13.1%). Most issues were present in less than 10 percent of surveyed properties, and less than 3 percent of properties required major repairs. The housing team leader in Tyler commented on the value of this detailed data, saying that there were people that started with us, a three year period, that has had still not done the housing assessment. And I thought, how do you know? How you really know what you’re working on? If you haven’t accumulated the data to know which way to go. And so that was, I don’t think you can do anything without that.
These rates varied widely between communities. Marshalltown specifically averaged 10.7 percent higher than the overall rates, and Tyler was 8.3 percent higher than the overall rates. This was also apparent when examining specific issues. For example, looking at rates of minor dry rot present on stairs or porches, Marshalltown’s rate of 26.6 percent was more than 15 percent higher than Hancock (11%). Benson’s rate of 13.1 percent of properties with a cracked foundation was nearly twice as much as Hancock (7.1%), but less than half of Marshalltown (22.8%).
While these results may show differences across communities, their variability may be the result of multiple factors. This can be seen by comparing Marshalltown and Hancock. These communities varied in their focus, with Marshalltown rating structures in specific areas and Hancock opting for a more city-wide approach. The variability may also indicate a lack of consistency among reviewers. For example, Marshalltown’s survey was largely done by students in a service-learning class at our institution, and faculty supervision may have influenced the higher rates in that community. Hancock was surveyed by a mix of our student and local officials, but in a different semester and over a smaller area. In both cases, instructors did use spot-checking to verify the reliability of student ratings. Benson was largely surveyed by students as well, as it is home to a regional university. Yet those students may not have received the same training as those at the University of Georgia. In Arlington, surveying was done largely by a single individual with past experience in housing evaluation, and this person did not collect data on yard conditions for any properties, resulting in a 0 percent rate for all categories.
Issues of data reliability are common in citizen science projects. One immediate solution is clearer guidelines for training, and the authors have recently created a guidebook to assist with this process. In addition, potential inconsistency in data collection sometimes might be the result of a fragmented process of volunteer recruitment. The digital technologies used to collect data speed up data collection, but they do not replace volunteer training. In other words, communities must collaboratively agree on categories used to measure and represent local problems. This is made more difficult when volunteers may have widely varying levels of experience with housing issues and come in at various stages of the process. Future communities may also choose to implement a quality check across submitted responses, rechecking to ensure consistency across volunteers.
Making the Data Useful
The housing assessment data collected by these communities were used for a variety of purposes. Most commonly, they were used to support applications for grant funds through the federal Community Development Block Grant (CDBG) program or a similar program at the state level, the Community HOME Improvement Program (CHIP). Team leaders expressed hope that these funds would have a catalyzing effect, spurring other owners and landlords to similarly improve their properties.
In Stewart, the housing team used collected data to evaluate rental properties within the city. More specifically, relying primarily on property tax data, team members were able to identify the impact of large landlords within the city. In both of the above examples, team members noted how property records linked with survey data provided a more precise understanding of key issues, both in terms of their geographic location as well as the nature of the problem. As the team leader in Stewart noted, this process “helped us to see that, it just helped us really understand it.” Likewise, the team leader in Tyler stated that their data helped them realize that they lacked land for new homes, and so they analyzed results to decide whether to repair or replace existing homes. Tyler also received a $600,000 CDBG grant that relied in part on data collected during their housing assessment.
In addition, communities used these data for unexpected purposes. During their housing assessment, Stewart was sued by a property developer over a rezoning decision. The city used housing assessment data to contextualize and support the city’s decision. In Tyler, data highlighted multiple issues previously not prioritized by the city, including missing or incorrect street addresses in property records and broken or missing street lights. More notably, while collecting data, team members were struck by the number of tires piled in residents’ yards. While this was not originally a main focus, the housing team leader reached out to multiple state agencies to ask about funds for a subsidized tire recycling event. Eventually, the city received funds from the state’s Environmental Protection Division targeted for Zika prevention, as tires (and the pools of water they often contain) are a common habitat for mosquitos. The resulting weeklong campaign was extremely popular, although tire cleanup remains an ongoing issue for the city.
Overall, housing team leaders in these communities agreed with this statement from the leader in Hancock: I really think it’s giving us as the city, as this committee, a real true picture of the housing in our city and how it affects everything. How it affects jobs. How it affects new businesses coming in. That’s really what I think the biggest impact has been to us, is actually getting a real clear picture of what we have in our city.
Most of these cities are small enough that team members had a general understanding of the major housing problems going into this process. Through both data collection and analysis, however, these teams developed a more granular understanding of these issues, using their results to secure state or federal funding. In multiple cases, these data were also useful in unexpected ways or revealed problems previously not prioritized by these teams. While it is difficult to prove that the housing assessment process and data were decisive in any given project, communities consistently described how both helped shape the focus of and inform plans for housing redevelopment.
Conclusion
Our work with these local communities demonstrates multiple ways that a citizen science approach supports the goals of pragmatist planning. Through their housing assessments, communities highlighted in this research have used VGI data collection to inform their understanding of local housing conditions. These data provide local housing teams with a more precise understanding of how and where housing quality is insufficient. The specificity and size of these datasets can both inform local initiatives and be used to advocate for state and federal funding.
In addition, the process of data collection was just as impactful as the resulting dataset. By spending time walking through these neighborhoods, housing team members and other volunteers were able to speak with local residents, observe housing conditions firsthand, and, in some cases, become aware of new issues. In doing so, they expressed coming to “really know” the issues present in each community, a phrase which indicates not just temporal and spatial accuracy, but also a deeper sense of personal connection with residents and neighborhoods. In this sense, we argue that the community-driven nature of this process is crucial, generating new and shared understandings of neighborhood needs and strengthens motivations for collective action to address them. Put another way, the value of this process was not just in the collected data or the results of data analysis, nor is the use of VGI and a volunteer-driven process incidental to the success of housing redevelopment in these communities. Rather, the process of constructing these data—walking the streets, speaking with residents, collecting data, and reacting to poor housing—helps mobilize a public able to articulate and respond to local problems.
Recognizing that “citizens” may be defined in ways that are either exclusionary (Glenn 2011) or, in the case of citizen science, reductive (e.g., citizens as sensors; Goodchild 2007), the citizen science approach described here frames citizenship in a more constructive sense, emerging from collective mobilization around issues of common concern. University experts did play a consultative role—providing software and training to local communities—but to use Arnstein’s taxonomy, these projects were very much partnerships shaped through coalitions of local participants. The reliance on local actors is not necessarily inclusive, however. In many communities, survey and housing teams were not made up of members of the neighborhoods being surveyed, which may in turn exclude certain residents’ perspectives from plans for redevelopment and new housing.
Indeed, while a locally driven citizen science approach is fundamental to these outcomes, we also recognize that these case studies fell short of a pragmatist model in several ways. Most notably, while local housing teams included volunteers from a range of backgrounds (city government, housing-related businesses, students, and non-profit organizations), in most cases, they were not residents of the most targeted neighborhoods. This was most apparent in accounts from local housing team leaders, who emphasized the sense of connection to formerly unfamiliar areas created through the survey process. The groups of volunteers were also usually in flux, which affected the pace of data collection and in all probability the data quality. Last, volunteers did not necessarily participate in interpreting or acting upon the collected data.
The challenges of volunteer recruitment and retention faced by several communities are typical of many citizen science initiatives (Brovelli, Minghini, and Zamboni 2015; Nov, Arazy, and Anderson 2014; Wald, Longo, and Dobell 2016). Some of these struggles are likely due to a lack of planned outreach, but attention to the motivations of participation may also be valuable. Wald, Longo, and Dobell (2016) suggest that volunteer participation is driven by personal and social incentives, what participants have to gain individually. Another survey found that while social incentives such as the approval of “important others” may incentivize participation, resulting data quality is most improved by intrinsic motivations tied to the underlying project goals (Nov, Arazy, and Anderson 2014). The role of organizers in this context is thus to explicitly communicate benefits to potential volunteers as well as highlight the contributions of their data toward actionable local initiatives (Andrews 2016). As noted above, both were challenging for most of the communities in our process.
Although the digitized data collection process may have sped data collection, it may have also contributed to this dynamic. Communities often expressed a desire to move directly to data collection using the tablets, and as a result, the more difficult (and non-digital) work of community recruitment and outreach was given less attention. This resonates with similar analyses of crowdsourced crisis mapping (Brandusescu, Sieber, and Jochems 2015), where even open-source and technically zero-cost software still includes significant time and technical challenges. Ironically, a digitized process may encourage communities to skip over the necessary relational work of community engagement and mobilization, treating technology as a cure-all solution. In addition, the technological tools may have given a veneer of accuracy and authority to the data that may be unwarranted. In the future, we will emphasize the need for ground-truthing results and recognizing potential uncertainty.
This is not to disparage the use of a digitized process. By greatly reducing the logistical labor involved in data collection, the technology we supplied to communities reduced the need for more tedious (and often error prone) tasks such as data entry. The detailed results captured through the collected assessments provide a more granular perspective on housing problems within each community. In addition, the open-source platforms used to create these tools (ODK and R) allow them to be shared and adapted by others.
Still, our examples underscore that these technologies are not inherently participatory or inclusive. They may be valuable tools within a process of counter-mapping (Fields, Bissell, and Macrorie 2020) or insurgent planning (Miraftab 2009), especially given their relative accessibility. In our case, at least one community (Stewart) explicitly stated the goal of using data to demonstrate the negative impact of a prominent local landlord. Digital tools proved were an important resource in the communities we worked with, most of whom had median incomes below the state average and lacked local technical capacity. However, a process of outreach and inclusion was still needed in these places.
Future research may assess strategies for creating more inclusive projects using a VGI approach. As part of the American South, communities in Georgia are still marked by the legacy of slavery and Jim Crow segregation, and this is often reflected in racial divides between (often white) civic leaders and low-income neighborhoods of color. Song (2015) is one of several authors who have argued for a need to address histories of racial exclusion and resistance as part of pragmatist work. Given that citizen science also enrolls publics who largely identify as white (Board on Science Education 2018), this issue is an urgent one.
Citizen science and VGI have emerged as promising new models for participatory research. This article uses these methods experimentally to assess their value in a participatory planning process, albeit one that is limited in scope (Honey-Rosés and Stevens 2019). For small communities, such as those included in this research, tools for community-based data collection can support work to collectively identify and respond to local problems. At the same time, these technologies do not replace the labor of recruiting volunteers, collecting data, or interpreting results. Our current research focuses on developing templates for data analysis to guide community decision making, specifically analysis of renter/owner-occupied properties and identification of the largest property owners. In doing so, we hope to further support and extend these community-driven efforts to assure affordable, quality housing.
Supplemental Material
sj-docx-1-jpe-10.1177_0739456X20976807 – Supplemental material for “Really Knowing” the Community: Citizen Science, VGI, and Community Housing Assessments
Supplemental material, sj-docx-1-jpe-10.1177_0739456X20976807 for “Really Knowing” the Community: Citizen Science, VGI, and Community Housing Assessments by Jerry Shannon, Kimberly Skobba, Jermaine Durham and Chase Polak in Journal of Planning Education and Research
Footnotes
Acknowledgements
The authors are grateful to the editor and reviewers who provided thoughtful comments on this article. We recognize the work of our partner communities in collecting these data. The late Dr. Karen Tinsley also was a key collaborator for this research.
Declaration of Conflicting Interests
The author(s) declared no potential conflicts of interest with respect to the research, authorship, and/or publication of this article.
Funding
The author(s) disclosed receipt of the following financial support for the research, authorship, and/or publication of this article: Funding for this research was provided by the National Institute of Food and Agriculture (grant #2015-68006-22846).
Supplemental Material
Supplemental material for this article is available online.
Notes
Author Biographies
References
Supplementary Material
Please find the following supplemental material available below.
For Open Access articles published under a Creative Commons License, all supplemental material carries the same license as the article it is associated with.
For non-Open Access articles published, all supplemental material carries a non-exclusive license, and permission requests for re-use of supplemental material or any part of supplemental material shall be sent directly to the copyright owner as specified in the copyright notice associated with the article.