
Abstract
This paper uses Philadelphia’s taxi data between January 2015 and December 2017 to analyze the spatial and temporal characteristics of taxi trip declines after the launch of transportation network company (TNC) services. Findings show declining number of taxi trips throughout the day and worsening congestion in downtown. Multilevel models indicate that wealthier neighborhoods correspond to bigger taxi trip losses, while neighborhoods with higher transit use correspond to smaller trip declines. Findings inform traffic management efforts and help identify residents’ potential travel needs. Other cities can apply methods outlined in this study to taxi and TNC data to investigate their traffic conditions and transport needs.
Introduction: The Need for Studying Taxi Trips
Set in the year 2263, the flying taxi chase scene in Luc Besson’s The Fifth Element captivated the public imagination when the movie premiered in 1997. More than two decades later, amid the precipitous decline of taxi ridership in many major U.S. cities, the mere existence of the humble yellow cab in the twenty-third century seems every bit as far-fetched as flying cars zipping through the concrete jungle. Despite the taxi industry’s well-documented decline amid increasing competition from transportation network companies (TNC) such as Uber and Lyft, taxis still play an important role in many large cities. Moreover, the spatial and temporal characteristics of taxi trips can offer insights into a city’s traffic conditions and travel patterns. This knowledge in turn informs the city’s transportation planning and traffic congestion mitigation efforts. For example, if a city’s traffic easing measures were effective, taxi passengers should expect to spend less time sitting in traffic. As services such as TNC and bike share expand residents’ travel options, the change in taxi use over time could also help reveal residents’ travel needs. Significant declines in taxi trips in certain types of neighborhoods, for example, signal that residents might have replaced traditional taxis with other modes. Meanwhile, stable taxi use in some neighborhoods could indicate that the residents lack the means to access more convenient, more affordable modes of transport and have to rely on taxis to meet certain travel needs.
In this paper, I apply spatial and temporal analyses and multilevel models to publicly available taxi trip data to investigate traffic conditions and the implications of taxi trip declines on residents’ travel needs in the City of Philadelphia between January 2015 and December 2017. Findings suggest that during the analysis period, taxi ridership decreased to various extents across neighborhoods and throughout the day on both weekdays and weekends. Meanwhile, the time taxi customers spent sitting in traffic in the Central Business District (CBD) increased, indicating worsening traffic congestion in downtown Philadelphia. Taxi trip declines exhibit socioeconomic patterns across neighborhoods. Higher percentages of transit users and nonwhite residents in a neighborhood are associated with fewer taxi trips and less severe taxi trip declines over time. In contrast, higher neighborhood incomes are associated with bigger taxi trip declines.
The contribution of this paper is also methodological. I demonstrate the use of taxi trip data to examine not only a major city’s changing traffic conditions over time but also the change in taxi use across neighborhoods with different demographic characteristics. Cities with access to taxi or TNC trip data could apply the methods outlined in this paper to gaining a better understanding of their transportation systems, evaluating traffic improvement efforts, and identifying residents’ travel needs.
Previous Studies on Taxi Trips and Taxis’ Relationship with Other Modes
Taxi data enable the understanding of the physical characteristics of a city and the travel behavior of its residents. Scholars have used taxi data to identify retail centers (Nong et al. 2017), reveal city structures (Liu et al. 2015), and decipher the spatial and temporal characteristics of residents’ travel patterns (Zheng et al. 2018). There have been multiple studies that investigate taxi travel patterns and the reduction in traffic speeds in New York City using the city’s taxi data (see, for example, Hochmair 2016; New York City Taxi & Limousine Commission 2019; Schaller 2017). Scholars have also examined taxi trip data to understand the transport system’s post-disaster recovery (Donovan and Work 2017; Zhu et al. 2016).
Access to taxi service exhibits socioeconomic and demographic patterns. Taxis have historically been used disproportionately by high-income households as well as low-income households, with less use by middle-income households (Renne and Bennett 2014). Furthermore, in a study assessing taxi’s function and relationship with public transit in Boston, Massachusetts, Austin and Zegras (2012) have found significant associations between an area’s median household income and taxi ridership at certain times of day (Austin and Zegras 2012). Research and anecdotal evidence have suggested that the taxi industry has a history of discrimination against minority population groups and low-income neighborhoods (Brown 2018; LaMendola 1991; Nelson 2016). In contrast, although TNC services have not eliminated driver biases, they have dramatically lower racial/ethnic service gaps compared with traditional taxi service (Brown 2018). There is also a strong association between paying for taxi trips with cash and neighborhoods that have high shares of immigrants and residents lacking access to bank accounts and formal banking products such as credit cards (King and Saldarriaga 2017).
Researchers have found both competing and complementary relationships between taxis and other modes of travel. Taxi service can be seen as a higher level of public transit (Kattan, de Barros, and Wirasinghe 2010). Taxi riders often have multimodal travel journeys, many of which began with transit trips (King, Peters, and Daus 2012). As such, taxi usage exhibits complementary characteristics to conventional transit service (Kattan, de Barros, and Wirasinghe 2010; King, Peters, and Daus 2012), although an analysis of New York City’s taxi trips has suggested that taxis compete with buses in areas that are well served by buses (Hochmair 2016). In terms of private automobile, taxis decrease the number of residents who drive to work (Kattan, de Barros, and Wirasinghe 2010). Furthermore, taxis fill an automobility gap for carless households and provide a mobility safety net for carless travelers (Brown 2018).
Researchers have also explored the relationship between taxis and emerging transport modes such as TNC services, such as Uber and Lyft, and bike share. TNC services are less regulated than taxicabs at the local levels around issues including fares, closed entry, and driver vetting (Cohen and Shaheen 2018). Unlike taxis, which are typically restricted to a specific geographic jurisdiction, TNC drivers are free to bring their vehicles further in the search for work (Anderson 2014). Researchers have found that TNC services replace traditional taxis (Henao 2017; Rayle et al. 2016) and have a negative effect on taxi ridership (Contreras and Paz 2018; Nie 2017). In dense urban areas, bike share can compete with taxis in terms of travel time (Faghih-Imani et al. 2017). When choosing between bike share and taxis, weather conditions and travel distance are among the key factors that affect travelers’ decisions (Zhou, Wang, and Li 2019).
So far, few studies have used taxi trip data to investigate the changing traffic conditions and residents’ travel needs as emerging services such as TNC services and bike share have increased the array of travel options in large cities. In this paper, I showcase the use of taxi data as a cost-effective tool to understand a large city’s congestion problems over time and to explore the implications of taxi trip declines on residents’ travel needs. In the following sections, I first investigate the spatial and temporal characteristics of taxi trip changes over time. I quantify the deteriorating traffic conditions in Philadelphia’s CBD by examining the increases in the time taxi customers spent sitting in traffic between January 2015 and December 2017. I then use multilevel linear regression models with random intercepts to explore the relationship between taxi trip declines and various neighborhood socioeconomic, exposure, and built environment factors.
Taxi Trip Data and Research Context
Taxi Trip Data
Taxi trip data come from the Philadelphia Parking Authority (PPA), the independent administrative agency that regulates taxicabs in Philadelphia, via a Freedom of Information Act (FOIA) request. The data include information for each taxi trip that was completed between January 2015 and April 2018, including the trip origin and destination coordinates, trip distance, pick-up and drop-off time stamps, trip fare, tips, and payment methods. This study considers taxi trips that were completed between January 2015 and December 2017, the first and the third full calendar years after UberX’s (Uber’s affordable TNC service) launch in Philadelphia. During the analysis period, more than 90 percent of taxi trips both started and ended within the city limits, although taxis are allowed to pick up and drop off passengers outside of the city (PPA] 2008).
Taxi Use in Philadelphia
Taxis play an important role in Philadelphia’s transportation system, although taxi use has declined significantly over time. Between January 2015 and December 2017, taxis completed an annual average 6.9 million fare trips in the city. The number of taxi trips, however, dropped precipitously over that period. By the end of 2017, the number of taxi trips had declined by an annual average 20 percent to less than two-thirds the number of trips in 2015, even though the taxi fleet size remained largely unchanged. 1 During the same period, transit ridership in Philadelphia also decreased (National Transit Database 2019), suggesting that the loss in taxi trips might not have been picked up by transit.
The decline in taxi trips coincided with the emergence of TNC services and bike share. The rapid growth of Uber and Lyft has been well documented by the local media since the services entered Philadelphia in October 2014 and late January 2015, respectively. Between 2016 and 2018, Uber and Lyft saw their trips increase by 13 million (Laughlin 2018). As of 2018, an estimated 25,000 TNC vehicles were operating in the Philadelphia area (Laughlin 2018), compared with fewer than 1,600 taxis in the city (Bergen 2017). Similar to TNC services, bike share grew rapidly after its launch in Philadelphia in spring 2015. Ridership nearly doubled from 430,000 annual trips in 2015 to almost 800,000 trips in 2017 (Indego 2018).
Declining Taxi Use and Deteriorating Traffic Conditions
In this section, I investigate the spatial and temporal characteristics of taxi trip declines by examining taxi trip change across neighborhoods and by time of day between 2015 and 2017. I then compare the time taxi passengers spent sitting in traffic in Philadelphia’s CBD in 2015 and 2017 to reveal the worsening traffic congestion in downtown Philadelphia. In the spatial analysis, taxi pick-ups and drop-offs are spatially joined and aggregated to Census tracts based on the trips’ pick-up/drop-off coordinates. The temporal analysis aggregates taxi pick-ups by time of day based on pick-up time stamps.
Declining Taxi Use across Neighborhoods
Between 2015 and 2017, taxi trips (including both pick-ups and drop-offs) declined in 339 of Philadelphia’s 384 neighborhoods represented by Census tracts. Neighborhoods that gained taxi trips had relatively low taxi usage, with fewer taxi trips than the city average in both years. Neighborhoods that generated the most taxi trips in 2015 experienced bigger declines than the city average. By 2017, the top twenty neighborhoods in pick-ups in 2015 had a median decline rate of 39 percent, compared with 33 percent for the city as a whole, even though the neighborhoods continued to have the most taxi trips in 2017.
Taxi trip declines exhibit spatial patterns across neighborhoods. As shown in Figure 1, between 2015 and 2017, neighborhoods in the western and central northern parts of Philadelphia experienced smaller trip declines or even moderate increases in pick-ups and drop-offs. Many of these neighborhoods have lower household incomes and higher shares of nonwhite residents than the city average. In contrast, more affluent neighborhoods and neighborhoods with higher shares of residents who are white in areas such as Northwest Philadelphia saw some of the biggest taxi trip declines.
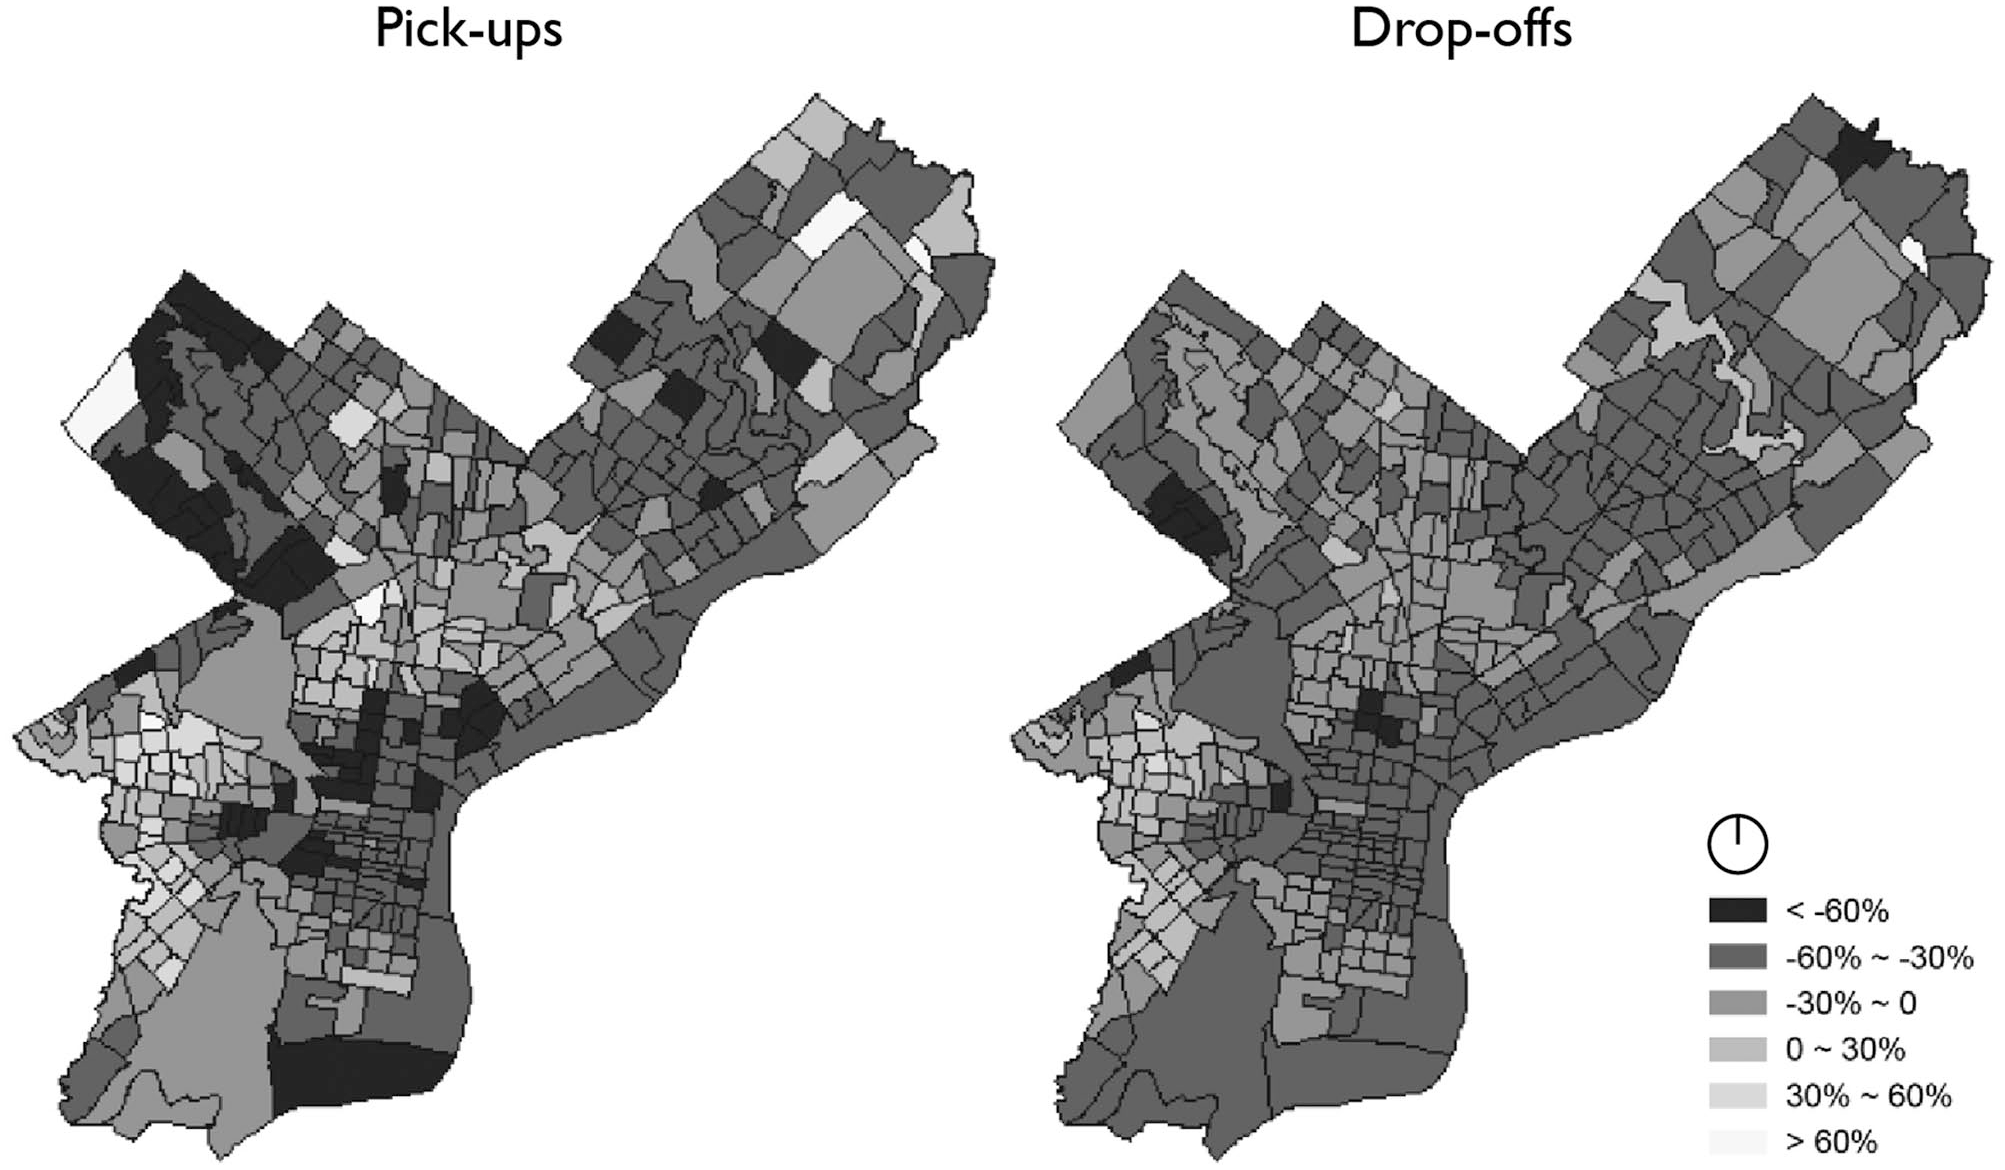
Percentage change in taxi pick-ups and percentage change in taxi drop-offs by Census tract in Philadelphia between 2015 and 2017.
Declining Taxi Use throughout the Day
Between 2015 and 2017, the number of taxi trips decreased throughout the day on both weekdays and weekends. Figure 2 shows the aggregate taxi pick-ups by hour of day on weekdays and weekends for 2015, 2016, and 2017. On weekdays, the morning and evening peak periods saw 38 and 33 percent fewer trips in 2017 than in 2015, suggesting a potential decline in commute trips by taxis. On both weekdays and weekends, the biggest taxi trip declines (43% for weekdays and 50% for weekends) occurred in the evening, when leisure and recreational activities tend to intensify. The large taxi trip declines in the evening likely resulted from a shift to TNC services, which are most commonly used for leisure and recreational activities (Dong 2020; Feigon and Murphy 2018; Rayle et al. 2016). Overall, taxi trips had greater declines on weekends than on weekdays. The temporal distribution of taxi trips remained consistent throughout the day on weekdays and weekends, indicating similar taxi usage patterns over time.
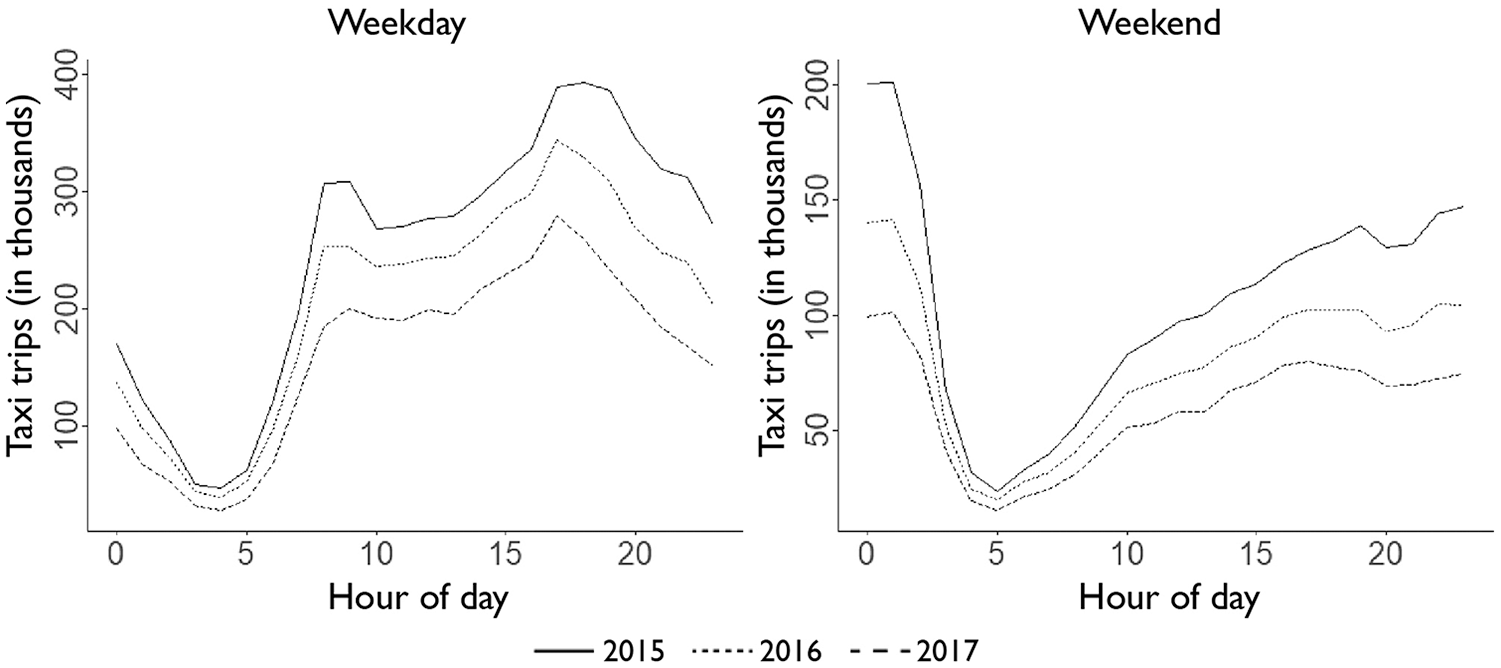
Number of taxi trips in Philadelphia by time of day for weekdays and weekends in 2015, 2016, and 2017.
Worsening Congestion in CBD
In this analysis, I investigate traffic condition in Philadelphia’s CBD by comparing taxi customers’ in-vehicle wait time (i.e., the time customers spent sitting in traffic) between 2015 and 2017. Philadelphia’s CBD, represented by the Center City business improvement district, is a 560-acre district that encompasses 233 blocks and more than 1,500 properties (Center City District N.d.). In 2017, approximately 9 percent of the city’s taxi trips both started and ended within the CBD. To exclude trips that might have started in the CBD and traveled outside before returning to and terminating in the CBD, I only consider trips with a travel distance of three miles or less and a fare of $10 or less, excluding fees and tips. For reference, a three-mile taxi ride with zero in-vehicle wait time costs approximately $10 in Philadelphia. The median trip distances in the analysis are 0.74 and 0.73 miles in 2015 and 2017, respectively. In-vehicle wait time is not included in the taxi trip data and is calculated based on PPA’s taxicab tariffs (PPA N.d.) using the formula below:

Note:
First 1/10 mile (flag drop) or fraction thereof: $2.70
Each additional 1/10 mile or fraction thereof: $0.25
Each 37.6 seconds of wait time: $0.25
Wait time is calculated in seconds
Trip distance is calculated as the actual travel distance in miles
Taxi fare is calculated in dollars
As shown in Figure 3, taxi customers experienced longer in-vehicle wait time throughout the day on both weekdays and weekends in 2017 than in 2015, indicating deteriorating traffic condition in the CBD between the two years. The median in-vehicle wait time increased from 123 seconds in 2015 to 138 seconds in 2017, while the median trip distance remained consistent. The finding on longer wait time echoes observations that between 2013 and 2017, the average travel times for traversing the CBD increased by 20 and 40 percent for cars and transit (Center City District 2018). Between 2015 and 2017, weekdays saw greater increases (sixteen seconds) in in-vehicle wait time than weekends (eleven seconds). Wait time had the biggest percentage increase between 7 a.m. and 10 a.m. on weekdays, indicating worsening congestion in the CBD during morning commute hours. Between 2015 and 2017, the overall traffic patterns in the CBD remained largely consistent on both weekdays and weekends, as indicated by the distribution of wait time throughout the day across the two years in Figure 3.
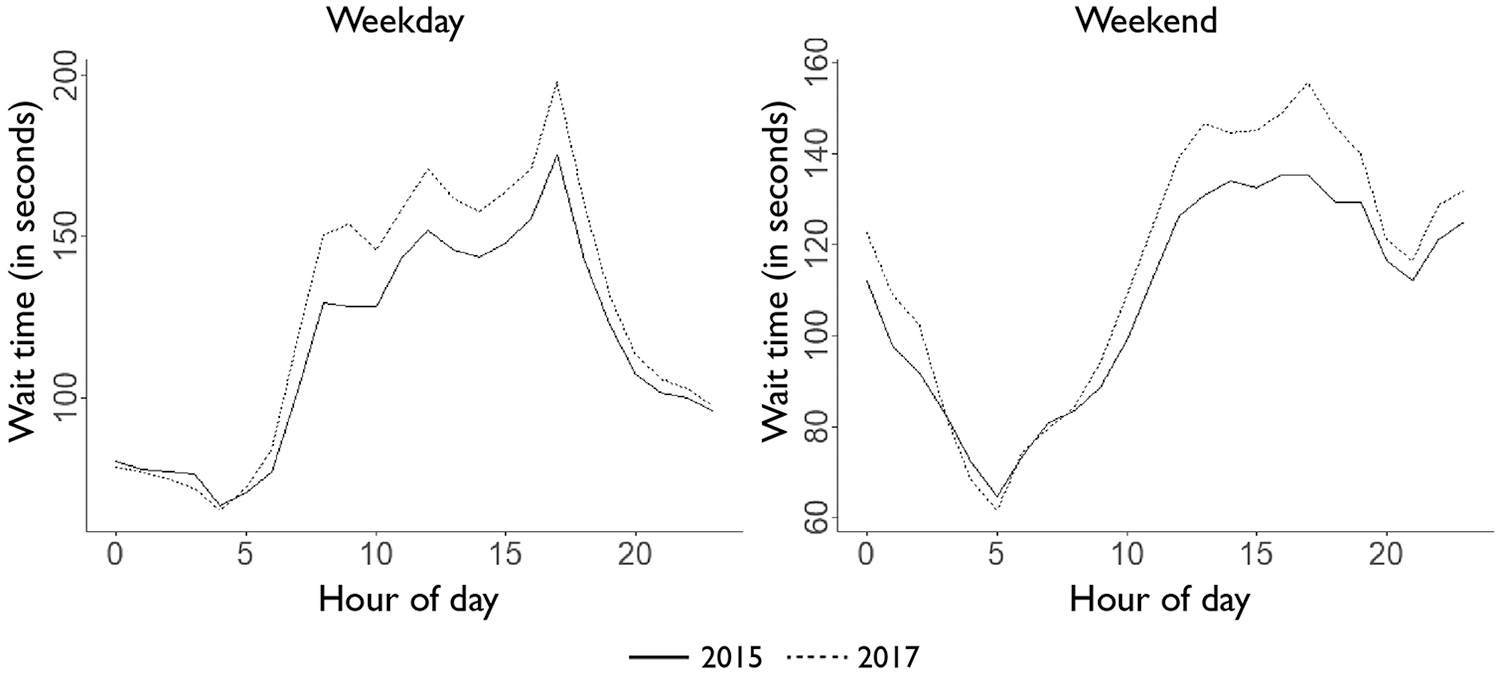
Median taxi in-vehicle wait time by time of day for weekdays and weekends in 2015 and 2017.
Relationship between Taxi Trip Loss and Neighborhood Characteristics
While the spatial and temporal analyses reveal where and when taxi trip declines occurred, they do not explain what types of neighborhoods tend to have more or fewer taxi trips, and whether certain neighborhoods are more prone to trip declines than others. In this section, I answer these questions by using multilevel linear models with random intercepts to explore (1) the associations between neighborhood socioeconomics, exposure, transport mode, and land use–related predictor variables and the numbers of neighborhood taxi pick-ups and drop-offs in 2015 and 2017; and (2) the relationship between the predictor variables and the percentage change in the number of taxi pick-ups and the percentage change in drop-offs between 2015 and 2017.
Data Summary for Multilevel Analysis
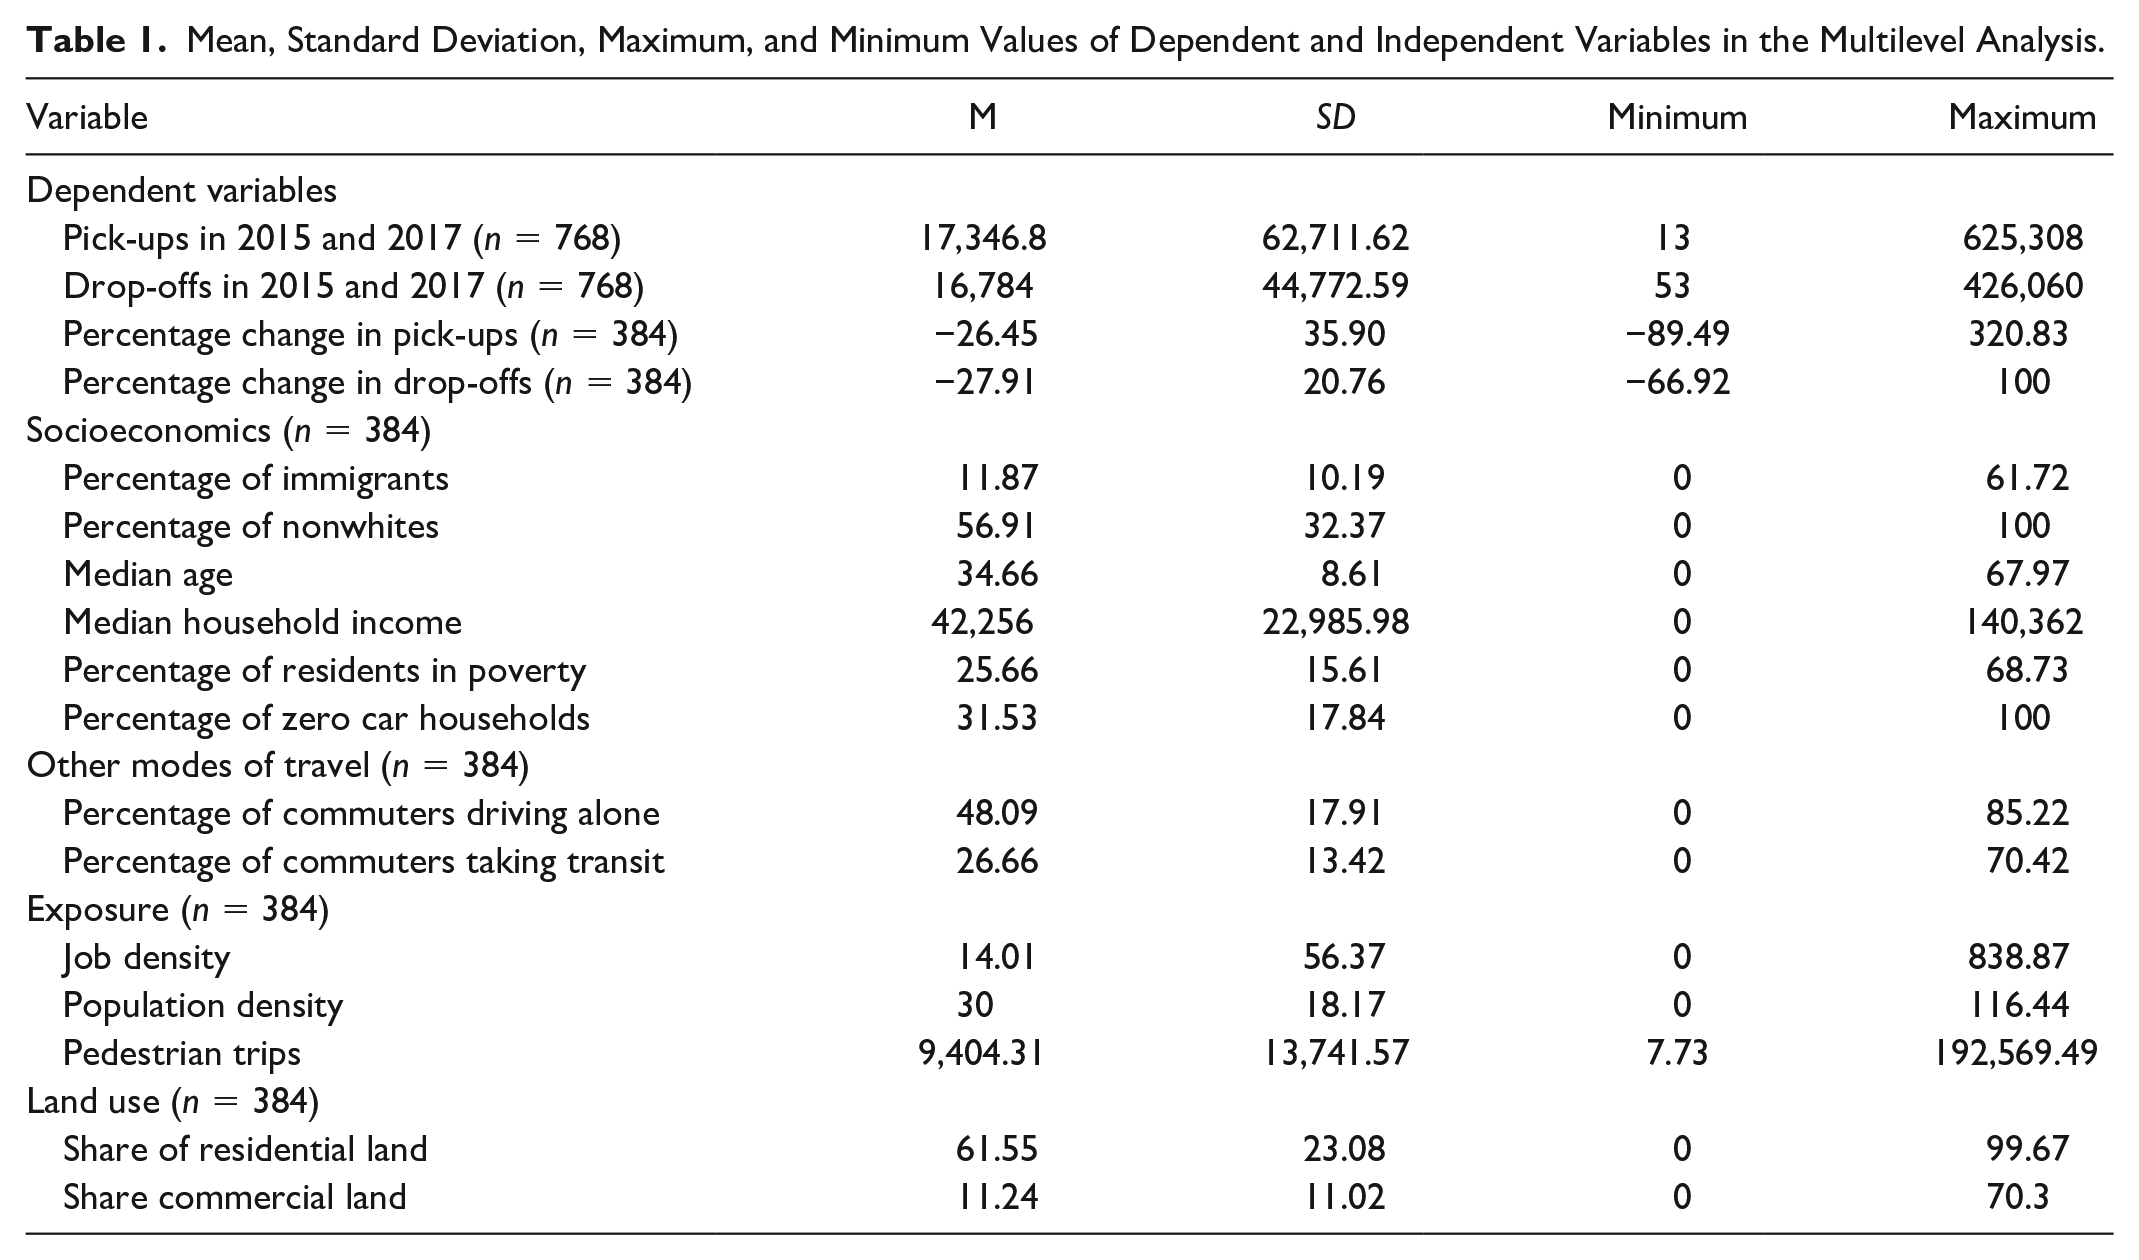
Table 1 summarizes the variables considered in the multilevel analyses. All variables are measured by Census tract. The first analysis predicts the number of taxi pick-ups and the number of taxi drop-offs (both on logarithmic scale) in 2015 and 2017. Data for the first analysis record the number of taxi pick-ups and the number drop-offs in each neighborhood in 2015 and 2017 and have a panel structure. Population and socioeconomic variables for the analysis come from the 2015 and 2017 five-year American Community Surveys (ACS) (U.S. Census Bureau 2017). The second analysis predicts the percentage change in pick-ups and the percentage change in drop-offs by neighborhood between 2015 and 2017. To account for the variation in the predictor variables over time, I calculate the three-year averages for the socioeconomic factors, population density, and mode of travel variables between 2015 and 2017 using the 2015, 2016, and 2017 five-year ACS data. In both analyses, land use and exposure variables are considered constant across the years. Taxi pick-ups and drop-offs are spatially joined and aggregated to Census tracts based on the trip coordinates for pick-up and drop-off.
Mean, Standard Deviation, Maximum, and Minimum Values of Dependent and Independent Variables in the Multilevel Analysis.
Demographic and socioeconomic characteristics
Taxis have historically been used disproportionately by high-income and low-income households (Renne and Bennett 2014). In addition, due to the lack of banking products such as credit cards (Brown 2018; Transportation Research Board 2015), low-income and immigrant residents’ access to TNC services, which provide an alternative to taxis but often require credit cards for payment (King and Saldarriaga 2017), might be limited. I include neighborhood median income, the percentage of residents living in poverty, and the percentage of immigrants to account for taxi usage across income groups and the “unbanked” or “underbanked” residents.
In many cities, neighborhoods that are disproportionately minority have traditionally been underserved by taxis (Transportation Research Board 2015). To account for neighborhood racial composition, I control for the percentage of nonwhite residents in a neighborhood. I also include neighborhood median age in the models as the use of for-hire vehicle services, including traditional taxicab and TNC services, skews toward young individuals (Conway, Salon, and King 2018).
Between 2015 and 2017, the demographic characteristics and socioeconomic conditions remained relatively consistent for each Census tract. Pearson’s correlation for each variable between 2015 and 2017 is greater than .9, indicating limited variation across the two years.
Other modes of travel
I include the percentage of workers who drove alone to work and the percentage of workers who took transit to work in the models to account for the modes’ potential complementary or substitution effects on taxis. Similar to the demographic and socioeconomic characteristics, the share for each commute mode remained highly consistent for each Census tract between 2015 and 2017.
Exposure variables
Exposure variables provide estimates of potential taxi customers and include population density, job density, and the number of pedestrian trips in each neighborhood. Total employment comes from the 2015 Longitudinal Employer-Household Dynamics data published by the U.S. Census Bureau (N.d.). The area used to calculate population density and job density excludes large parks and bodies of water. Total pedestrian trips are the sum of pedestrian trips that originated and ended in a Census tract, including pedestrian trips to and from transit stops. Data for pedestrian trips come from the Delaware Valley Regional Planning Commission’s (DVRPC) regional travel model. The model estimates pedestrian trips based on Philadelphia region’s 2012 household travel survey.
In the percentage change in taxi trips analysis, I include the percentage change in population between 2015 and 2017 to control for the change in the number of potential taxi customers in each neighborhood over time.
Built environment factors
The shares of residential and commercial land in a neighborhood are included in the models to account for the association between land use and taxi usage. Land use data come from the DVRPC’s 2015 Land Use shape files (Delaware Valley Regional Planning Commission 2018). The calculation of land use shares excludes nonurban land uses such as military and mining.
Variable transformation
I transform variables with skewed distributions to the logarithmic scale, including the number of taxi pick-ups, the number of taxi drop-offs, median household income, population density, job density, and pedestrian trips. For observations with values of zero, I add one to avoid taking the natural log of zero.
Multilevel Modeling Framework
The multilevel model is suitable for the current analysis for it allows the effects to vary by group (Gelman and Hill 2006) and accounts for unobserved spatial correlation across observations. In this study, neighborhoods within the same area likely share certain socioeconomic and built environment characteristics. As a result, taxi usage and subsequently the percentage change in the number of taxi trips in neighborhoods in the same area might be spatially correlated. The Philadelphia City Planning Commission, Philadelphia’s municipal planning department, groups the city’s neighborhoods into eighteen nonoverlapping planning districts with similar geographic areas (City of Philadelphia 2011). Each planning district reflects the unique socioeconomic and built environment conditions of the contiguous neighborhoods it encompasses. In both analyses, I allow the models’ intercepts to vary across planning districts to account for the unobserved spatial correlation across neighborhoods within the same district, as well as correlation that varies across planning districts. In the first analysis that predicts log taxi pick-ups and drop-offs in 2015 and 2017, I also allow the models’ intercepts to vary across Census tracts to account for spatial correlation within neighborhoods across the two years. In both analyses, I use robust multilevel models to mitigate the effect of outliers on the parameter estimation. Models are estimated using the R package robustlmm (Koller 2016).
To avoid multicollinearity among the independent variables, I exclude variables with variance inflation factors (VIFs) greater than 4. Variables such as the percentage of households with two or more vehicles, the percentage of residents with college degrees or higher, and residential land use share are excluded from all or some models due to their high multicollinearity with other independent variables.
Findings from Multilevel Analyses
Table 2 presents the parameter estimates for the socioeconomic, travel mode, exposure, and land use factors from four robust multilevel models. Models 1 and 2 predict the number of taxi pick-ups and the number of drop-offs in 2015 and 2017. Coefficients for non-log-transformed independent variables are the predicted percent difference in taxi trips per unit of the independent variables (Gelman and Hill 2006). Coefficients for log-transformed variables, such as population density, have the interpretation as the expected proportional change in taxi trips per proportional change in the independent variables (Gelman and Hill 2006). For example, according to Model 1, each 1 percent increase in pedestrian trips in an average neighborhood corresponds to a 0.755 percent increase in the number of taxi pick-ups, all else being equal. In addition to socioeconomic, exposure, travel mode, and land use factors, Models 1 and 2 also include a dummy variable for the year 2017.
Parameter Estimates from Robust Multilevel Models with Varying Intercepts for Taxi Pick-Ups, Drop-Offs, Percentage Change in Pick-Ups, and Percentage Change in Drop-Offs between 2015 and 2017.
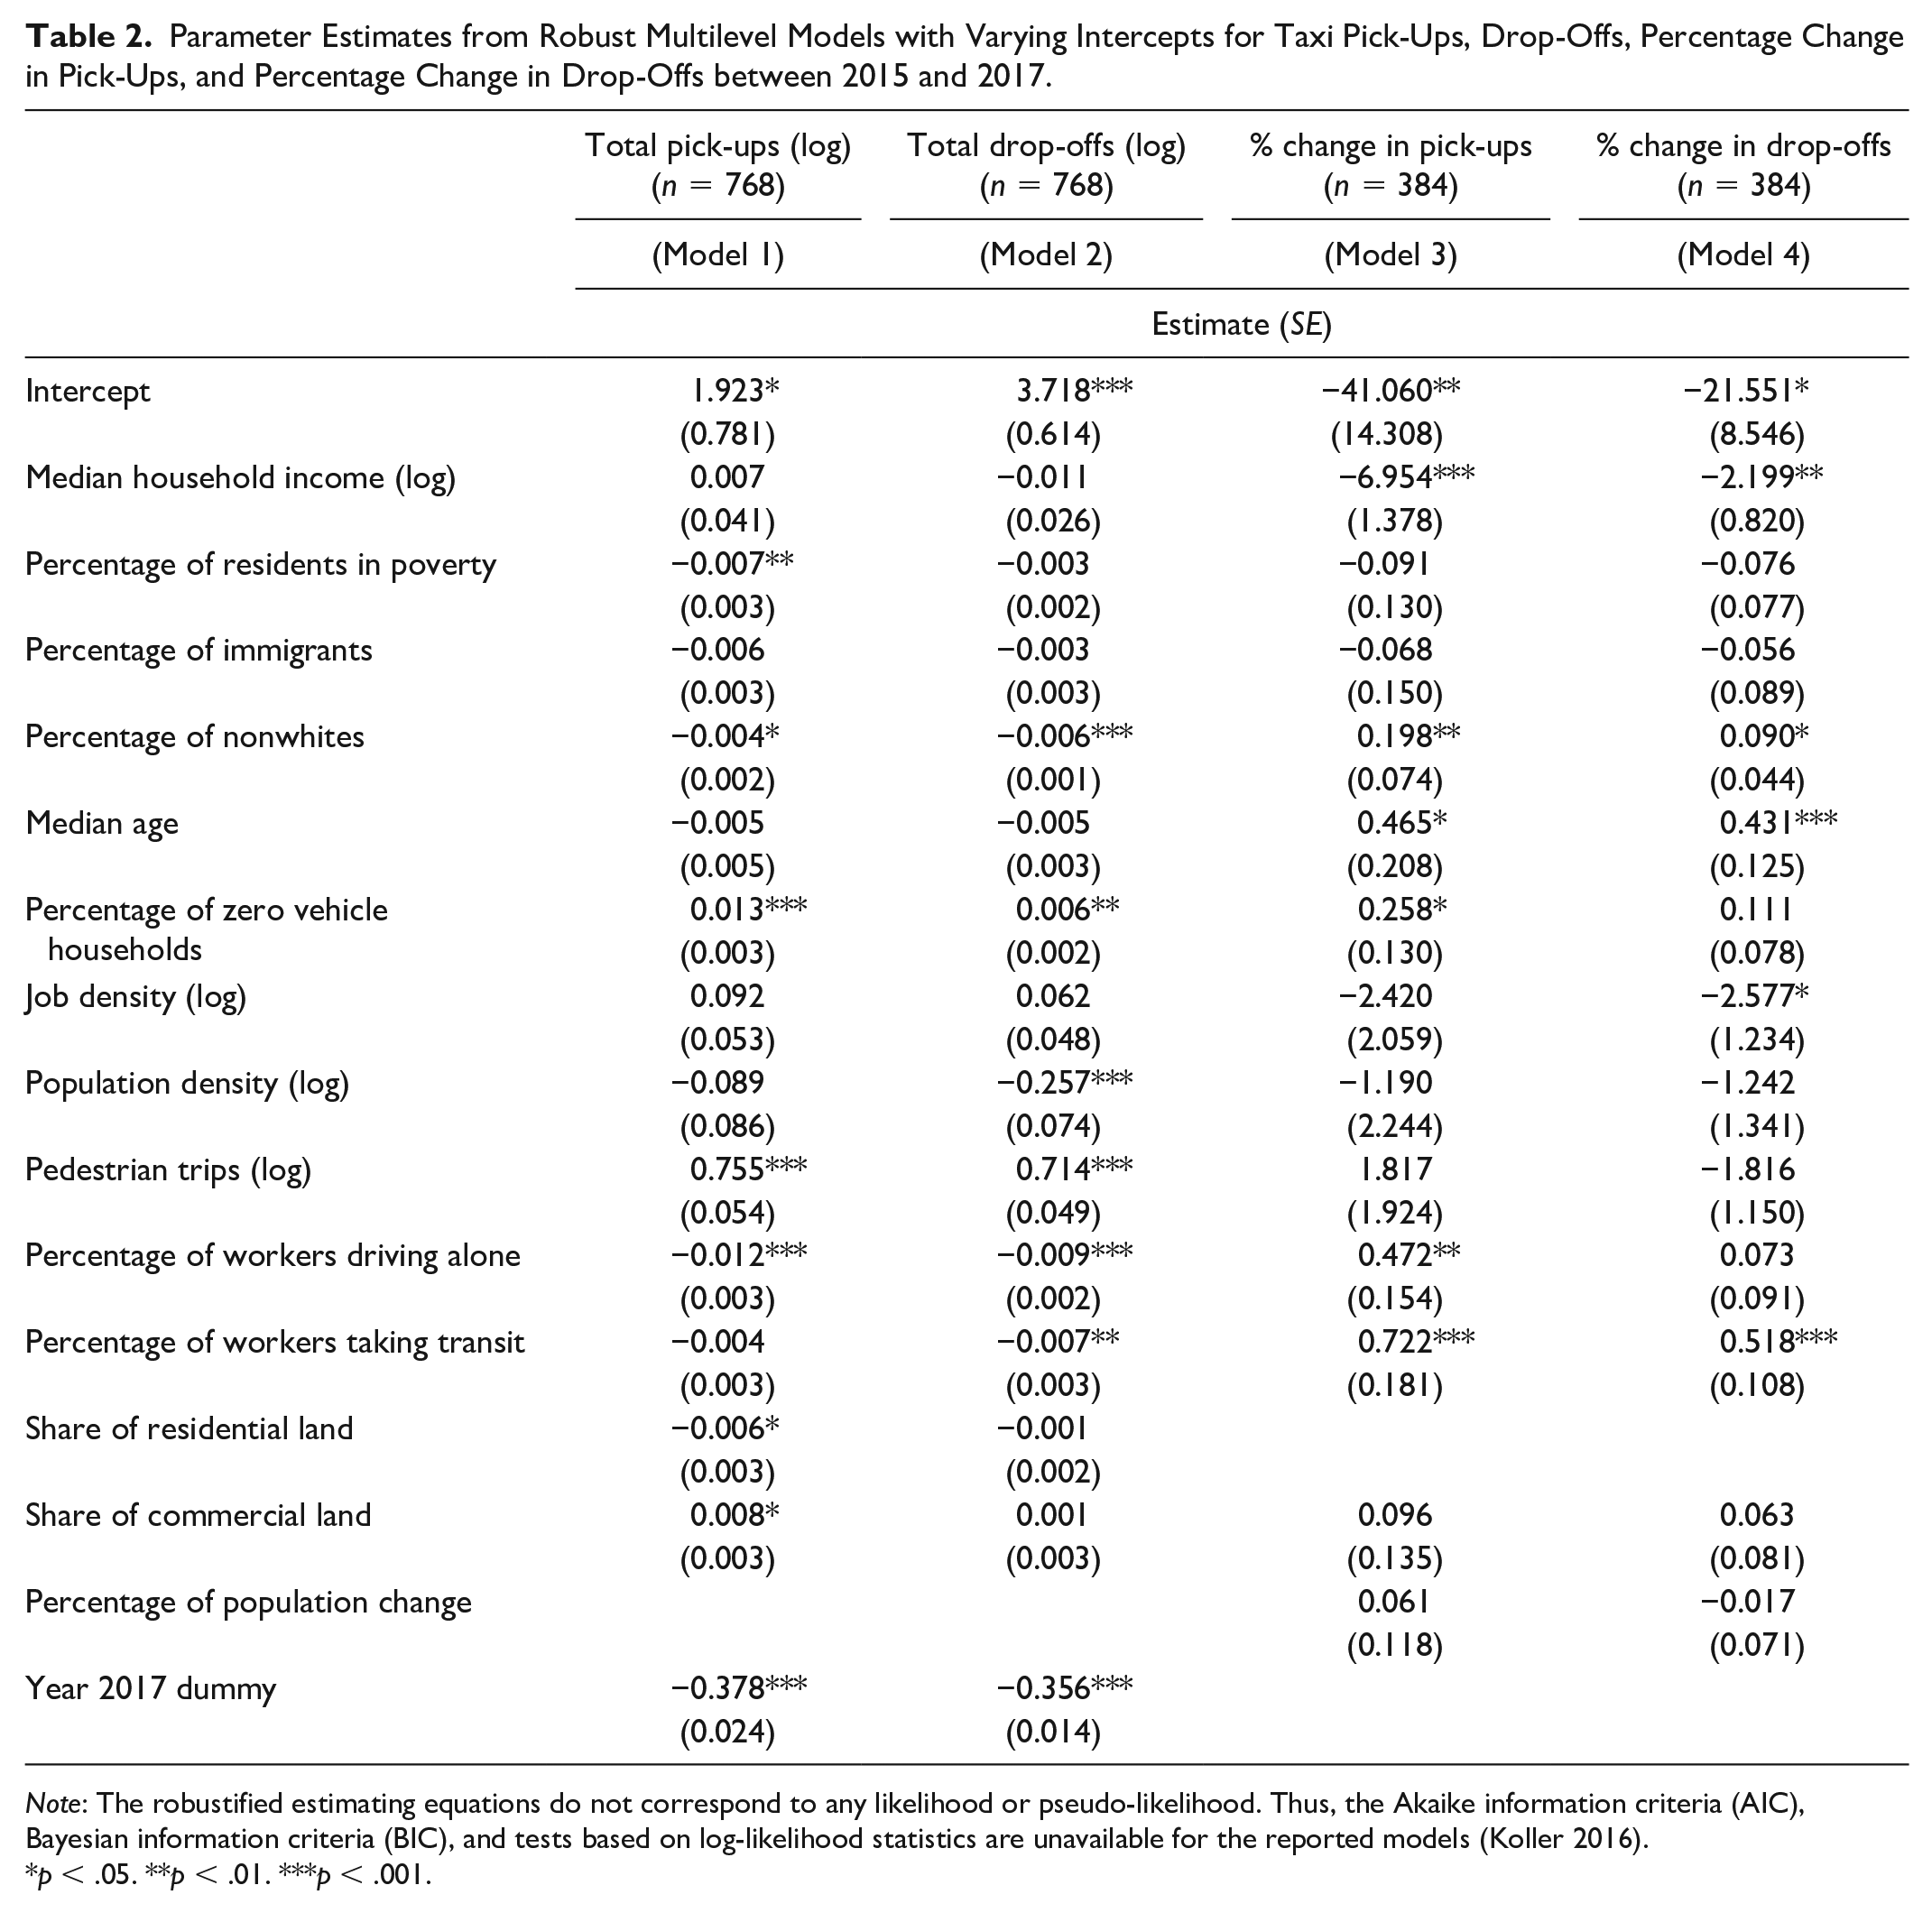
Note: The robustified estimating equations do not correspond to any likelihood or pseudo-likelihood. Thus, the Akaike information criteria (AIC), Bayesian information criteria (BIC), and tests based on log-likelihood statistics are unavailable for the reported models (Koller 2016).
p < .05. **p < .01. ***p < .001.
Models 3 and 4 predict the percentage change in taxi pick-ups and the percentage change in drop-offs between 2015 and 2017. Coefficients for non-log-transformed variables have direct interpretation as the difference in the percentage change of taxi trips between 2015 and 2017 associated with a one-unit difference in the independent variables. For log-transformed variables, the coefficients are interpreted with respect to percent changes in the independent variables. For example, a 1 percent increase in neighborhood median household income corresponds to an average 0.07 percentage point (−6.95 multiplies by the natural logarithm of 101%) decline in pick-ups in 2017 than in 2015, all else being equal.
Demographic and socioeconomic variables
Taxi use is statistically significantly associated with the percentage of nonwhite residents, the percentage of zero vehicle households, and the percentage of residents living in poverty in a neighborhood. Accounting for exposure, travel modes, and other factors, each percentage point increase in a neighborhood’s share of nonwhite residents corresponds to a 0.4 percent (Model 1) decrease in taxi pick-ups and a 0.6 percent decrease in drop-offs (Model 2). Household vehicle ownership is more positively associated with pick-ups than drop-offs. Each additional percentage point in the share of households without a vehicle is associated with 1.3 percent more pick-ups (Model 1) and 0.6 percent more drop-offs (Model 2), all else being equal. Higher poverty rates are significantly associated with fewer pick-ups. The analysis finds no significant association between neighborhood poverty levels and taxi drop-offs.
As shown in Models 3 and 4, the percentage of nonwhite residents, neighborhood median income, and median age are significantly associated with the percentage changes in taxi pick-ups and drop-offs between 2015 and 2017. Higher shares of nonwhite residents correspond to increases in neighborhoods’ percentage change in taxi pick-ups (Model 3) and percentage change in drop-offs (Model 4), all else being equal. Given the overall declining trend in taxi trips across neighborhoods, the positive associations between the predictors and the percentage change in taxi trips likely indicate smaller decreases in taxi trips between the two years. In terms of income, wealthier neighborhoods are associated with bigger declines in both taxi pick-ups and drop-offs. On average, a 10 percent increase in a neighborhood’s median household income corresponds to a 0.66 percentage point bigger decline in pick-ups and a 0.21 percentage point bigger decline in drop-offs. Last, older neighborhoods are associated with significantly smaller declines or even increases in taxi pick-ups and drop-offs.
Exposure variables
More pedestrian trips are significantly associated with more taxi pick-ups and drop-offs in a neighborhood. On average, a doubling of pedestrian trips in a neighborhood correspond to roughly 69 percent more pick-ups and 64 percent more drop-offs. The models find no significant association between pedestrian trips, the percentage change in taxi pick-ups, and the percentage change in taxi drop-offs.
Population density and job density have inconsistent significance of associations with taxi trips and percentage change in taxi trips. A 10 percent increase in population density corresponds to an average 2.4 percent decrease in taxi drop-offs (Model 2), all else being equal. The analysis finds no statistically significant association between population density, taxi pick-ups, and percentage changes in taxi trips. Higher job density is significantly associated with bigger declines in taxi drop-offs. A 10 percent increase in jobs per acre in a neighborhood corresponds to an average 0.25 percentage point bigger decline in taxi drop-offs between 2015 and 2017, all else being equal. Models 1 and 2 find no significant association between job density, taxi pick-ups, and drop-offs.
Other transport modes
The percentage of auto commuters and the percentage of transit commuters in a neighborhood are statistically significantly associated with fewer taxi trips, as indicated by Models 1 and 2. Meanwhile, higher percentages of auto commuters and transit commuters are associated with smaller declines or even increases in taxi pick-ups and drop-offs. Each additional percentage point in the share of workers who drove alone to work corresponds to an average 0.47 percentage point increase in the percentage change in taxi pick-ups between 2015 and 2017. The percentage of transit commuters is more positively associated with taxi pick-ups than drop-offs. On average, a 1 percentage point increase in the share of transit commuters in a neighborhood corresponds to a 0.72 (Model 3) percentage point smaller decline in pick-ups and a 0.52 (Model 4) percentage point smaller decline in drop-offs.
I also tested the associations between bike share use and taxi trips. However, bike share stations are only available in roughly one-fifth of Philadelphia’s neighborhoods in the analysis period. In addition, factors that were considered in bike share station siting almost certainly correlate with at least some of the variables included in the models. I therefore excluded bike share use from the reported models.
Land use
The shares of residential and commercial land use in a neighborhood have significant and opposite associations with the number of taxi pick-ups. An additional percentage point higher share of residential land use corresponds to 0.6 percent fewer pick-ups, whereas an additional percentage point higher share of commercial land use is associated with 0.8 percent more pick-ups. The models find no significant association between the land use factors, taxi drop-offs, and the percentage changes in taxi trips between 2015 and 2017.
Discussion and Policy Implications
In this section, I discuss the planning implications around the key takeaways from the spatial, temporal, and multilevel analyses. First, results highlight the need to investigate the reasons behind the smaller declines in taxi use in low-income neighborhoods. The finding that lower-income neighborhoods correspond with smaller taxi trip declines over time suggests that some residents in low-income neighborhoods might still need to rely on taxis to meet certain travel needs. Meanwhile, residents in wealthier neighborhoods have been able to move away from taxis faster than those in lower-income neighborhoods, thus contributing to the bigger taxi trip losses in more affluent neighborhoods. A possible explanation for the difference in the decline of taxi use is that residents in high-income neighborhoods have adopted alternative modes to taxis at a higher rate than have residents in low-income neighborhoods. For example, studies have shown that low-income residents are less likely to have credit cards, which could prevent them from using TNC services, even though these services are often cheaper than traditional taxis. Future studies should investigate whether the smaller declines in taxi use among low-income residents are the result of a lack of access to more convenient, more affordable travel options. Strategies such as providing discounted taxi rides might help to reduce the financial burden facing low-income residents who are captive taxi users due to the lack of other travel options.
Second, findings suggest that the city examine whether neighborhoods with different racial compositions benefit equally from new travel options. The multilevel analysis shows that neighborhoods with higher shares of nonwhite residents have smaller taxi trip declines than neighborhoods with higher percentages of white residents. Exploring the reasons for the less severe shift away from taxis in disproportionately nonwhite neighborhoods helps to identify obstacles that prevent residents from taking advantage of the increasing array of travel options such as bike share and TNC services. This knowledge could in turn inform the city’s planning efforts that aim to improve access, such as the siting of new bike share stations.
Third, findings remind the transit agency to investigate whether the demand for taxis in transit-rich neighborhoods could be met by transit through service adjustment. In Philadelphia, many of the neighborhoods with above city average transit use are located near high-speed rail transit and are often served by multiple bus routes. However, even though neighborhoods with higher transit use are generally associated with fewer taxi trips, some residents in transit-rich neighborhoods still rely on taxis for certain trips, as indicated by the less severe taxi trip declines in neighborhoods with higher shares of residents who took transit to work. The more stable demand for taxis in transit-rich neighborhoods highlights the need to investigate whether residents, especially those who might lack the means to access alternative travel options, have to use taxis to complement transit due to inadequate transit services.
Last, the taxi in-vehicle wait time analysis quantifies the deteriorating traffic conditions in downtown and informs the city’s congestion mitigation efforts. Between 2015 and 2017, while the overall travel pattern in the CBD remained consistent, traffic congestion worsened throughout the day, with weekday mornings suffering the worst travel time deterioration. In recent years, the City of Philadelphia has implemented measures, such as increased traffic enforcement, to manage the curb and speed up traffic. An understanding of the temporal characteristics of the worsening traffic congestion enables the city to take a more targeted approach when designing strategies and allocating resources such as traffic police and parking enforcement officers to untangle traffic jams in the CBD. The comparison of in-vehicle wait time over time also allows planners and traffic engineers to examine the effectiveness of the various traffic improvement measures.
Conclusion
In this paper, I use taxi trip data to analyze traffic condition and the spatial and temporal characteristics of taxi trip declines in Philadelphia between 2015 and 2017. I use robust multilevel models to investigate the relationship between taxi trip declines and neighborhood characteristics. Findings indicate that over the study period, the total number of taxi trips decreased across neighborhoods. Traffic congestion worsened throughout the day in the CBD, resulting in travelers spending more time sitting in traffic. Low-income neighborhoods and neighborhoods with disproportionately nonwhite residents had smaller taxi trip losses than wealthier neighborhoods and neighborhoods with higher shares of white residents. Findings inform the city’s congestion mitigation efforts and remind the city to identify the travel needs for disadvantaged residents who might have to rely on taxis for certain trips due to the lack of means to access more convenient, more affordable transport alternatives.
Two major limitations of this study present opportunities for future research using taxi or TNC trip data. First, this study does not make causal connections between the emerging travel options such as TNC services and bike share and the declining taxi trips in Philadelphia. Any robust examination of the impact of the new services on taxis requires an in-depth understanding of the trips completed by the new services. Second, using neighborhood-level factors such as median household income to predict aggregate taxi trips may give rise to ecological fallacy. That is, taxi users’ demographic backgrounds vary, and some customers might not even reside in the neighborhood of their trip origin or destination; the sociodemographic characteristics of a neighborhood therefore might not be representative of the characteristics of the taxi customers who started or ended their taxi trips in the neighborhood.
Using publicly available taxi trip data, this study showcased a cost-effective way for examining a city’s transport system and residents’ travel needs over time. Furthermore, the analysis demonstrates that anonymous taxi trip data can provide useful information about the well-being of a city’s transport system without compromising the customers’ data privacy. As TNC services have become an integral part in many cities’ transport system, local officials should consider obtaining and applying the methods outlined in this study to anonymized TNC trip data to monitor the changing traffic conditions and travel needs in their communities.
Footnotes
Acknowledgements
The author would like to acknowledge William Schmid from the Philadelphia Parking Authority and Duane Deane from Curb Mobility LLC for providing the taxi trip data, and Matthew Gates from the Delaware Valley Regional Planning Commission for providing estimates of pedestrian trips. Chandan Deuskar, PhD, in City and Regional Planning at the University of Pennsylvania provided valuable insights during the revision.
Declaration of Conflicting Interests
The author(s) declared no potential conflicts of interest with respect to the research, authorship, and/or publication of this article.
Funding
The author(s) received no financial support for the research, authorship, and/or publication of this article.