
Abstract
An experimental study of smoke propagation from an apartment to an escape route corridor in a real-scale residential building is presented in this paper. The experiments were performed using the same experimental setup but with different ventilation and apartment door opening times. The setup consisted of a fire in a two-seater sofa in an apartment connected to a corridor and other apartments. A total of four scenarios are presented in this paper. The baseline scenario examines the smoke propagation from the apartment to the corridor during a ventilation-limited fire with a closed façade and door between the apartment and corridor opening after 5 min. In the other scenarios, the effect of closing the door, smoke permeability and ventilation openings in the façade are investigated. The results show the impact of ventilation and door opening time on the conditions in the corridor. Closing the door of the apartment has a significant impact on decreasing smoke propagation, for example carbon monoxide concentrations in the corridor are 15–26 times lower than the baseline scenario. Ventilation openings have less impact, for example carbon monoxide concentrations are 2.6–3.7 times lower than the baseline scenario when additional ventilation openings are used. Overall, the results demonstrate the reliability of the design and provide insights into smoke propagation in real-scale residential buildings.
Introduction
Objectives
Small fires within residential buildings are fairly common. Even a small fire involving everyday household items can produce substantial amounts of smoke, especially if the fire is ventilation-limited. The smoke can propagate throughout the dwelling and into escape routes, potentially rendering the situation untenable.
The main objective of this article is to analyse and quantify smoke propagation to an escape route in a residential building. In addition, it aims to evaluate the reliability of real-scale experiments by conducting them multiple times.
Background
Over the years, multiple studies have been performed on smoke propagation. These experiments are typically conducted in a laboratory or specially designed and purpose-built settings, often focusing on standardised tests or single rooms with well-ventilated fires. Large-scale experiments in existing residential buildings, particularly those with ventilation-controlled fires, are rarely performed to examine smoke propagation in multi-compartment settings. However, there are a few studies worth mentioning concerning this paper.
One of the earliest attempts to conduct experiments into smoke propagation was made in the early 1970s in the Corridor Fires Program by the National Bureau of Standards (NBS, former name of the National Institute of Standards and Technology (NIST)). The purpose of the programme was to research the effect of various factors, such as configuration, fuel loading, surface linings and floor coverings, on the propagation of fire and smoke as they propagate through a corridor from an adjoining room.1–4
Other large-scale experiments were carried out by Heskestad et al. 5 in 1986. More than 60 fire tests were conducted in a building with a corridor and three attached rooms, one of which was a burn room, to validate fire models for multiroom fires in healthcare facilities. Gas burners were used as a fire source, and measurements were taken of various parameters, including temperature, optical density and gas concentrations. Different combinations of open and closed doors and windows, and natural or forced ventilation were tested. The experiments revealed a smoke front propagating under the corridor ceiling in one direction while the return front was filling the remaining space above the floor in the opposite direction. Other doors and windows had minor effects on the smoke front propagation, with an open door to the burn room. With the door to the burn room closed, the propagation speed of the smoke front was very sensitive to other openings.
Morikawa et al. conducted fire experiments in the late 1980s in a full-scale, two-story fire-resistant building to assess the toxicity of fire effluent gases under realistic conditions. Natural polymers and mixtures of natural and synthetic polymers were burned in a ground-floor room under different ventilation conditions. Different gas concentrations were measured, such as carbon monoxide (CO), oxygen (O2), carbon dioxide (CO2), hydrogen cyanide (HCN) and nitrogen oxides (NOx). After flashover, oxygen concentrations dropped below 5%–6%, carbon dioxide concentration rose above 15%, and carbon monoxide concentrations reached 70,000 ppm.6,7
Madrzykowski 8 used an experimental multiroom setup in 1991 to measure the level of sprinkler fire exposure in an exit corridor and the adjacent space. The impact of a 1 MW crib fire was compared with that of a sprinkler-controlled fire. Measurements of gas temperatures as well as O2, CO2 and CO levels were taken at specific points in three rooms. In the scenario without sprinklers, O2 concentrations fell below 3%, while CO2 concentrations rose to 24%, and CO concentrations reached up to 17,000 ppm in the burn room. In contrast, during the sprinklered scenarios, the levels of CO and CO2 concentrations dropped significantly, and O2 concentrations remained above 12%. The findings indicated that sprinklers were effective in maintaining tenable conditions outside the room where the fire originated.
In 2000, Purser 9 introduced modern assessment techniques to evaluate tenability conditions based on the results of large-scale experiments in multi-compartment buildings. He examined the tenability conditions in various rooms and corridors connected to the fire room using dose-related models like the fractional effective dose (FED) methodology. Purser analysed the impact of fuel type, ventilation and building enclosures on fire scenarios and concluded that fires in enclosed or partially enclosed spaces generate large amounts of toxic smoke, posing a significant threat to the building occupants. Fires in enclosed spaces can become ventilation-limited, resulting in the production of large amounts of toxic smoke, which can rapidly propagate and contaminate building spaces. In such situations, escape is limited due to visual obscuration and smoke irritation, which could lead to incapacitation and even death due to exposure to asphyxiant gases (such as CO and hydrogen cyanide (HCN)) present in the smoke.
Gann et al. 10 performed room-scale fire tests in a laboratory setting in 2003 to obtain data on the concentration of toxic products, including CO2, CO and HCN, in both pre-flashover and post-flashover fires. Several individual items, including sofas containing flame retardants, were burned in a room with a long adjacent corridor to measure toxicants. In a closed room, the toxicant concentrations resulting from sofa cushion fires were found to be comparable to those produced by pre-flashover fires of the same cushions in a room with an open door. The pre-flashover data have higher uncertainties than the post-flashover data due to a less established upper layer and lower species concentrations.
Johansson et al. 11 studied 45 pool fire tests conducted over 6 years in a three-room compartment with a stairway, under four different ventilation scenarios. The aim was to assess the reproducibility and variability of such experiments. Temperature rise varied by ±7% to 35% within a 95% confidence interval, influenced by weather conditions and other unknown factors, though their exact contributions could not be distinguished.
There are also several examples of experiments where the focus has been on the fire room itself, such as by NIST, 12 Kerber, 13 Hoffmann et al. 14 and Guillaume et al. 15
Other experiments focus more on smoke propagation in homes or houses. In 2013, Kerber 16 conducted an experimental investigation on fire service ventilation practices in modern house designs. The study was carried out in a large fire facility, with two houses constructed inside it. Fifteen experiments were conducted, in which the location and number of ventilation openings were varied. The study examines the potential occupant tenability and provides knowledge for the fire service to examine their horizontal ventilation standard operating procedures and training content. One scenario in each house was conducted in triplicate to examine repeatability. In 2014, Crewe et al. 17 experimented with a British house built in the 1950s to test the effects of a fire. The experiment monitored the temperature, smoke, CO, CO2 and O2 levels in the living room, stairwell and front and back bedrooms. At around 8 min, O2 concentrations were around 2%, while CO and CO2 concentrations reached about 3.75% (37,500 ppm) and 13% in the burning room. During the experiment, the front bedroom door was left open while the back bedroom door was closed. Despite the relatively small fire, the results showed that toxic fire gases propagated throughout the entire house, with lethal concentrations of effluent being measured at each sampling point. The upper story’s poor state of repair and the missing carpets contributed to a high degree of gas and smoke permeation. The researchers calculated the available escape time to be the time before the main escape route became impassable. Given known human responses to fire, such an incident could have resulted in fatalities for sleeping or immobile occupants. Similar experiments were conducted in 2014 in the Netherlands by the Fire Service Academy. Hazebroek et al. 18 described the results of six experiments in fully furnished Dutch dwellings built in the 1930s. In the experiments, temperature, heat flux, CO, CO2, NOx and O2 levels in all rooms of the dwelling were measured. Initially, rapid-fire development in modern furnishings and rapid smoke propagation to other rooms were observed in the experiments. Those developments were strongly influenced by the ventilation profile: open or closed windows and interior doors, resulting in ventilation-limited fires in the closed setting. Smoke propagates quickly to rooms directly connected to the fire room, leading to unsurvivable conditions. Closing interior doors improves survivability. Besides high levels of CO, high levels of NOx were also measured. In the fire room, unsurvivable conditions were measured between 2 and 5 min.
More recent experimental research focuses more on building developments, such as airtightness and ventilation. In 2020, Brohez and Caravita 19 studied the impact of fire hazards associated with airtight building envelopes and mechanical ventilation in more energy-efficient homes. To study their impact, a large-scale experimental facility was built in Belgium. The tests measured gas pressure, mass loss rate, temperature, flow rate and gas concentrations. The results showed that mechanical ventilation was not sufficient to prevent fire-induced pressure inside the room, which could trap occupants for several minutes. Another example is the VIPA studies carried out also in Belgium. One of the studies focuses on the application of smoke control in residential care buildings during immediate or delayed evacuations. 20 The study highlights that a room’s airtightness affects fire and smoke propagation. The airtightness in combination with closing doors can create sudden pressure differences, causing smoke to propagate to adjacent rooms. A residential smoke control system can help prevent smoke propagation during the evacuation, in a defend-in-place strategy and during the intervention of the fire brigade.
A review of the above mentioned experimental studies reveals that only a limited number of experiments have been conducted in real-scale residential buildings with ventilation-limited fires. In addition, it also points out that several repeats in large-scale multiroom fire tests are uncommon and that the focus is rarely on smoke propagation to escape routes and other apartments. The majority of studies have focused on room or multiroom configurations within a dwelling or apartment. This article aims to complement previous studies by providing a series of well-instrumented experiments and their interpretation with different ventilation conditions during real fire scenario circumstances. Various scenarios with different preventive measures to decrease smoke propagation have been tested, such as closing doors. The fire apartments, adjacent corridors and apartments have been equipped with numerous sensors to measure physical and chemical parameters and produce data sets for several scenarios.
Statistical overview
In the Netherlands, on average, around 30 fire fatalities (30 incidents) occur every year in residential buildings. It corresponds to an average of 0.2 deaths per hundred thousand inhabitants due to fire in residential buildings. In most cases, the victim is either in the fire room or on the fire floor. Fatal residential fires start in a chair, sofa or mattress in approximately 30% of cases.21–24 The fire service rescues about 65 victims (49 incidents) annually from the apartment of fire origin, but the chance of being rescued from an apartment on fire is only twice as likely as dying. Apart from rescues from the fire apartment, around 183 victims (33 incidents) are annually rescued from other neighbouring apartments.25,26 The majority of them (112 victims in 7 incidents) are rescued in large-scale rescue operations involving more than six victims per incident. The main reason for rescues is that escape routes are blocked due to smoke propagation from a small fire size. The fatalities are primarily elderly (above 60 years of age) and not self-reliant, while the rescued victims are mainly self-reliant adults under 60 years of age. In general, residents of apartment buildings have a relatively high chance of becoming involved in a rescue or fatal residential fire. The increasing negative impact of smoke propagation on the ability to escape from fire in residential buildings is evidenced by the need to rescue self-reliant individuals. To enable independent escape, measures are necessary to prevent or limit smoke from propagating into escape routes (corridors). 26
The statistics show that fires that lead to smoke propagation in residential buildings in the Netherlands are common and can have serious consequences for both residents and firefighters.21–26 These findings from the statistical overview are used to develop several scenarios that will be tested in a series of real-scale experiments. These experiments will closely simulate dwelling fires, focusing on smoke propagation outside the fire-affected apartment and gathering data on tenability.
Experiments
Description of the test site and preparations
Large-scale experiments were carried out to study the propagation of smoke to escape routes and other apartments in an existing residential building. The building, constructed in 1973 with a concrete and brick structure, consists of four floors. The layouts of the first three floors are nearly identical, each with five apartments on either side of an internal corridor (C1.2). This corridor connects to adjacent corridors (C1.1, C1.3 and C1.4) and staircases that lead outside. Both the apartments and corridors are designed as separate fire compartments. The internal corridor (C1.2) has a flat ceiling without any protruding beams and spans an area of 34.2 m2 (19 m long and 1.8 m wide), with a volume of 82 m2 (2.4 m height). The apartment door has an area of approximately 1.9 m2 (2.1 m height, 0.9 m width and 0.3 m soffit). Each apartment is approximately 21 m2 with a volume of 53 m2. Upon entering an apartment, there is a small open area (formerly the kitchen), which leads to the living room/bedroom area via an open passage. The outer wall features windows and a balcony door. The bathroom is a separate room, accessible from the kitchen (see Figure 1).
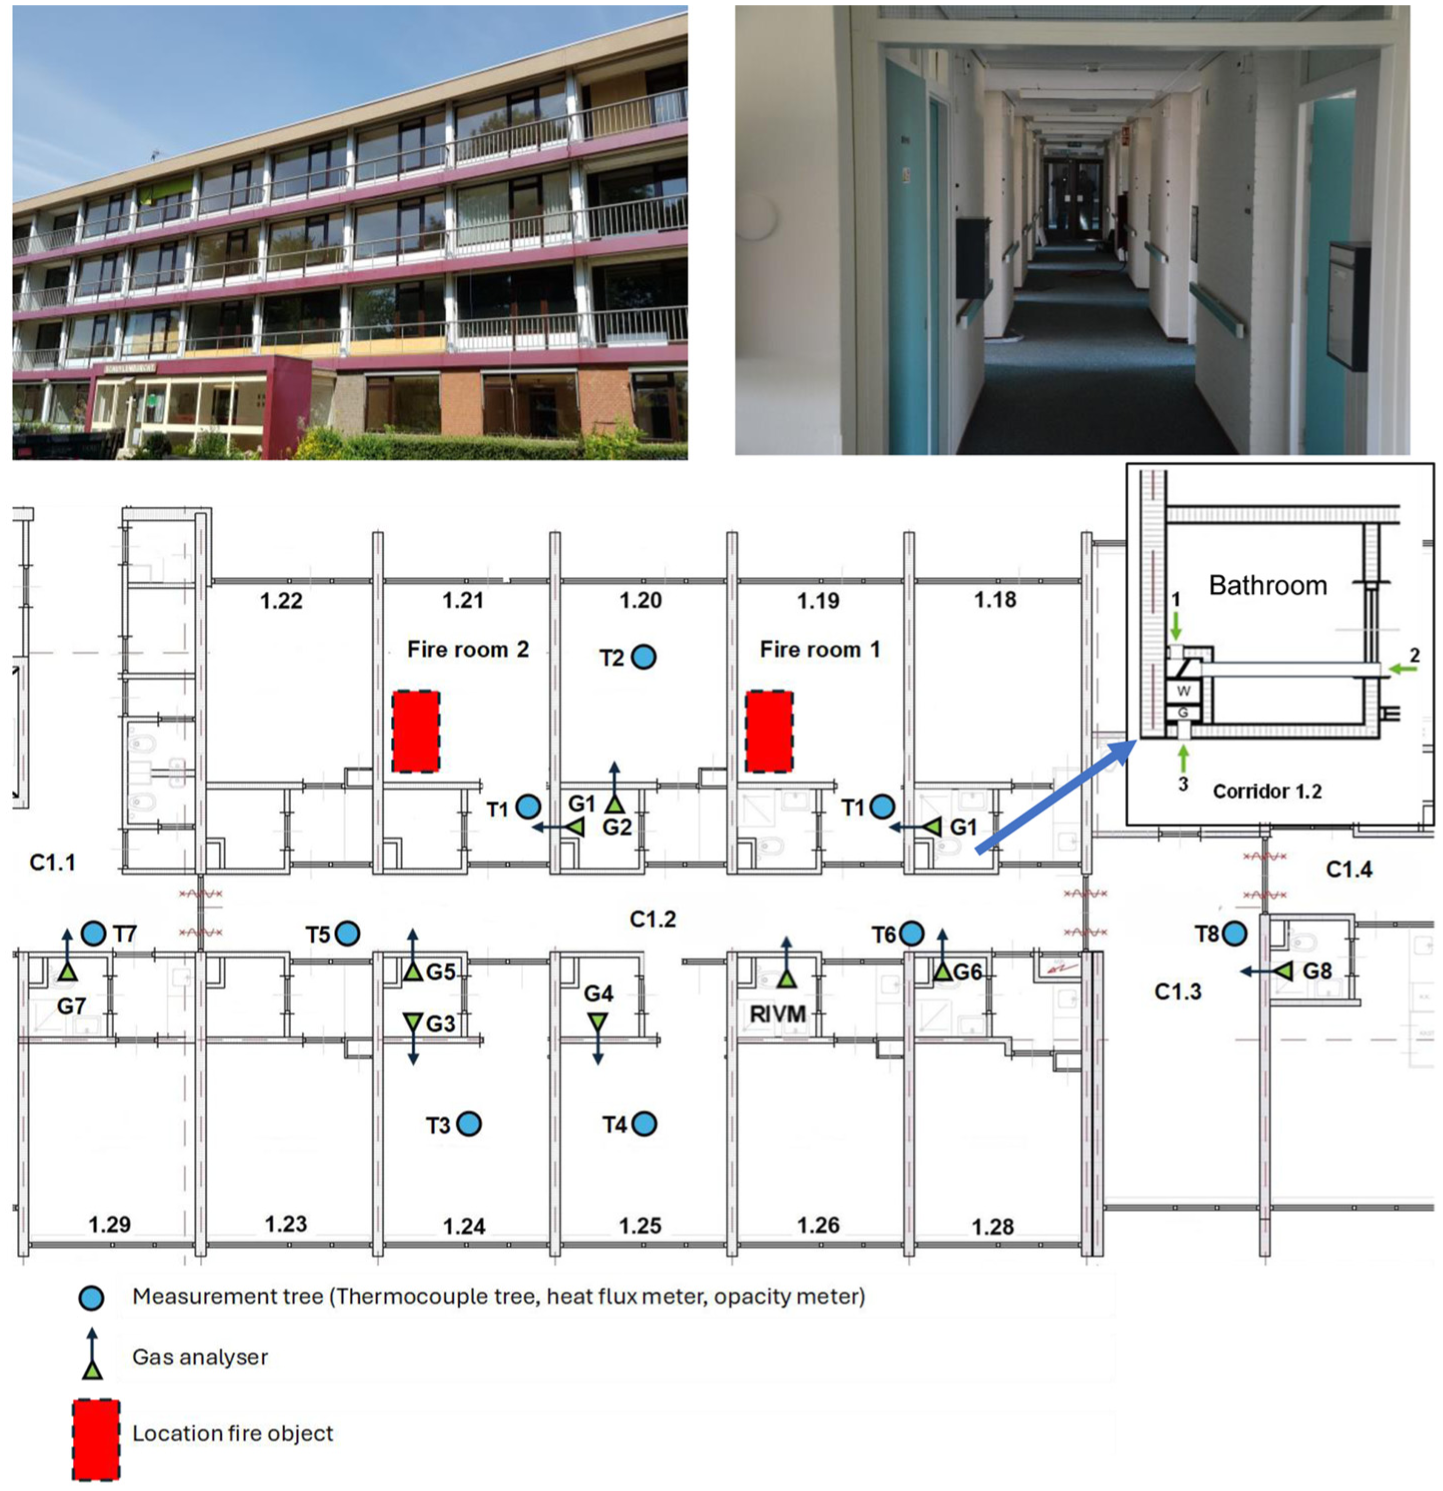
View of the façade, the internal corridor (see Ebus et al. 27 for more pictures), and a floor plan of the first floor with measurement location and configuration of ventilation.
Each apartment in the building has a ventilation shaft with a duct for natural exhaust ventilation, with air supplied through façade openings. Valves are located in the kitchen and bathroom (duct ‘W’ and green arrows 1 and 2 in Figure 1), and the duct is connected to the floors above and below. In addition, apartments 1.18, 1.20 and 1.22 have a second duct (‘G’ and green arrow 3 in Figure 1) that ventilates the corridor, with valves in the wall separating the corridor from the apartments. This duct is also vertically connected across floors. Both ducts are completely separated, and each has its own outlet to the roof. There are no fire or smoke dampers in the system, which is typical for buildings constructed before July 2021, when stricter smoke resistance regulations were introduced. Figure 1 shows an image of the building’s façade, its internal corridor, the floor plan of the first floor and the ventilation ducts in the bathroom.
Before starting the experiments, the building was adjusted to ensure safety and consistent test conditions. In the fire apartment, all windows were fitted with removable calcium silicate fire protective boards to prevent window failure. Combustible furnishings were removed, except for floor finishing, which was protected with calcium silicate fireboard. To evaluate the airtightness of the compartments, blower door tests were conducted at a pressure differential of 50 Pa, consistent with the standard for smoke resistance assessments. 28 With natural ventilation valves closed, the measured air leakage rates were 43 dm3/s (leakage area: 61 cm2) for fire apartment 1 (A1.19) and 95 dm3/s (136 cm2) for fire apartment 2 (A1.21). 29 A more extensive description can be found in the NIPV Research Report. 27
Experimental methodology
Over 2 weeks, 19 fire experiments were conducted with various scenarios. Except for the first day (one test), two tests were performed daily, divided over two fire apartments (A1.19 and A1.21), starting at 10:30 a.m. and 3:00 p.m., respectively. The bathroom door remained closed in all tests. The configuration of apartment and corridor doors was kept consistent throughout each experiment. At the start of every test, all doors were closed except for apartment door 1.25, which remained open throughout the study (see Figure 1).
This article evaluates 10 of the 19 experiments. Tests 6–11, 14 and 15 were excluded due to differing scenarios, and test 2 was omitted due to equipment failure. A summary of the evaluated experiments is provided in Table 1, with full experimental details, including weather conditions, available in Table 13 of the Appendix and the NIPV research report. 27
Experiment information.
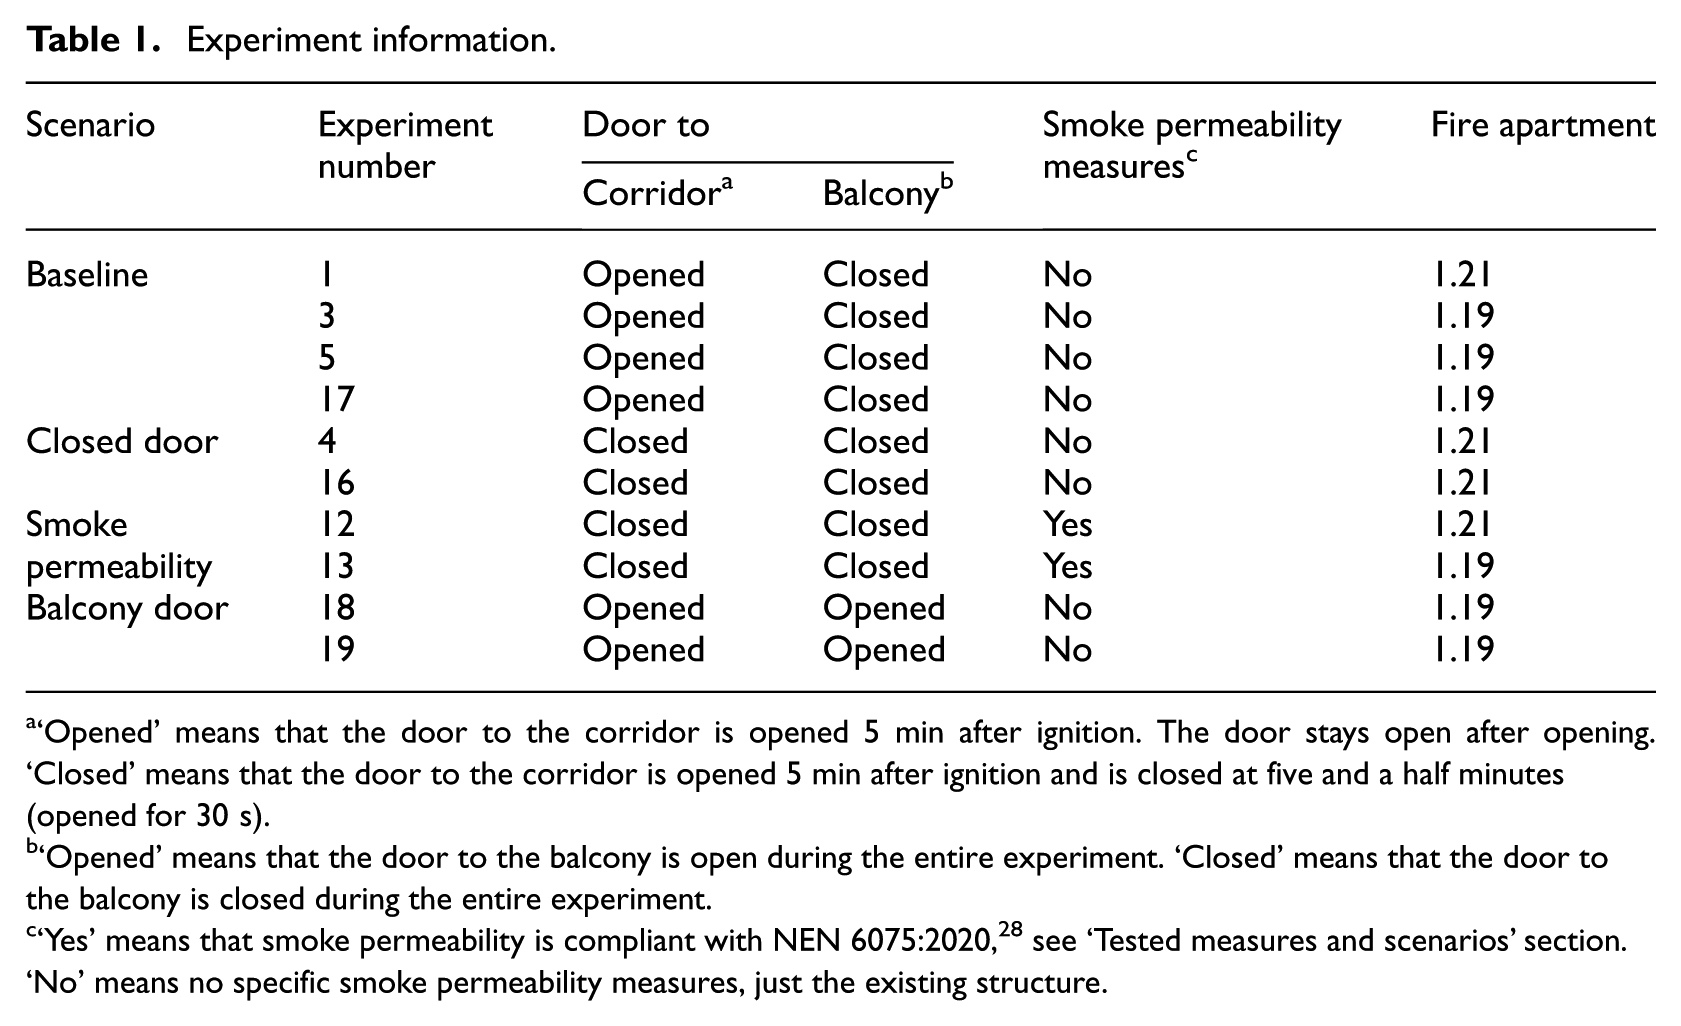
‘Opened’ means that the door to the corridor is opened 5 min after ignition. The door stays open after opening. ‘Closed’ means that the door to the corridor is opened 5 min after ignition and is closed at five and a half minutes (opened for 30 s).
‘Opened’ means that the door to the balcony is open during the entire experiment. ‘Closed’ means that the door to the balcony is closed during the entire experiment.
‘Yes’ means that smoke permeability is compliant with NEN 6075:2020, 28 see ‘Tested measures and scenarios’ section. ‘No’ means no specific smoke permeability measures, just the existing structure.
Fuel load and ignition
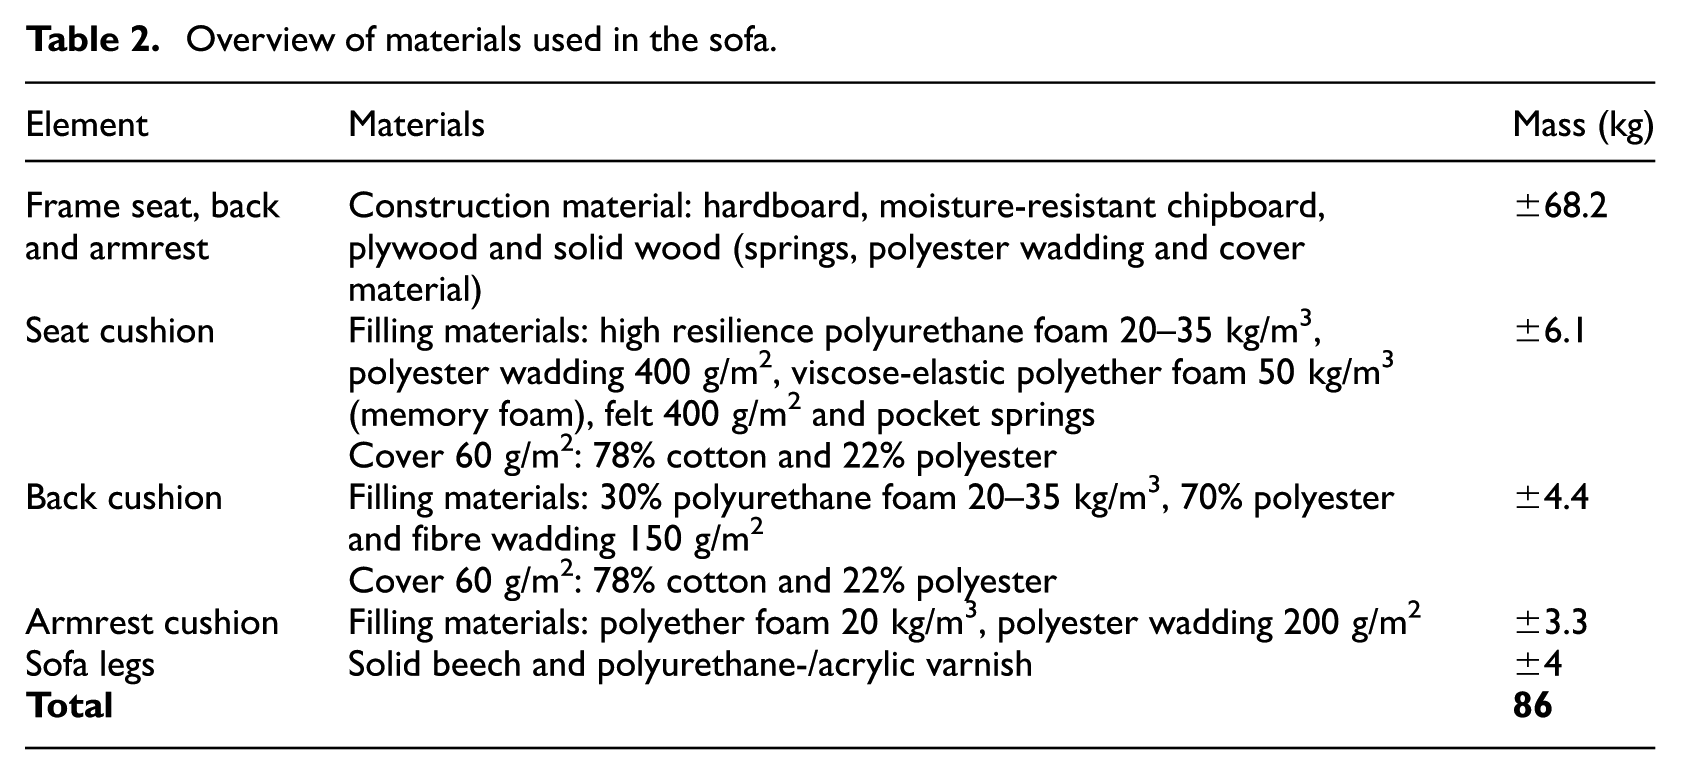
All evaluated experiments used an identical two-seater sofa as a fuel load (Figure 2). The sofa, the most sold model in the Netherlands (203 × 97 × 82 cm; 86 kg), was stored and conditioned in the test building. It lacks fire safety certification, as no such requirements exist for domestic sofas in the Netherlands. Material composition and mass distribution are detailed in Table 2. Each fire in Table 1 was initiated using a BS 5852 30 crib 5, placed at the junction of the seat cushion, backrest and armrest (Figure 2) and allowed to develop for 20 min, see also Leene. 31
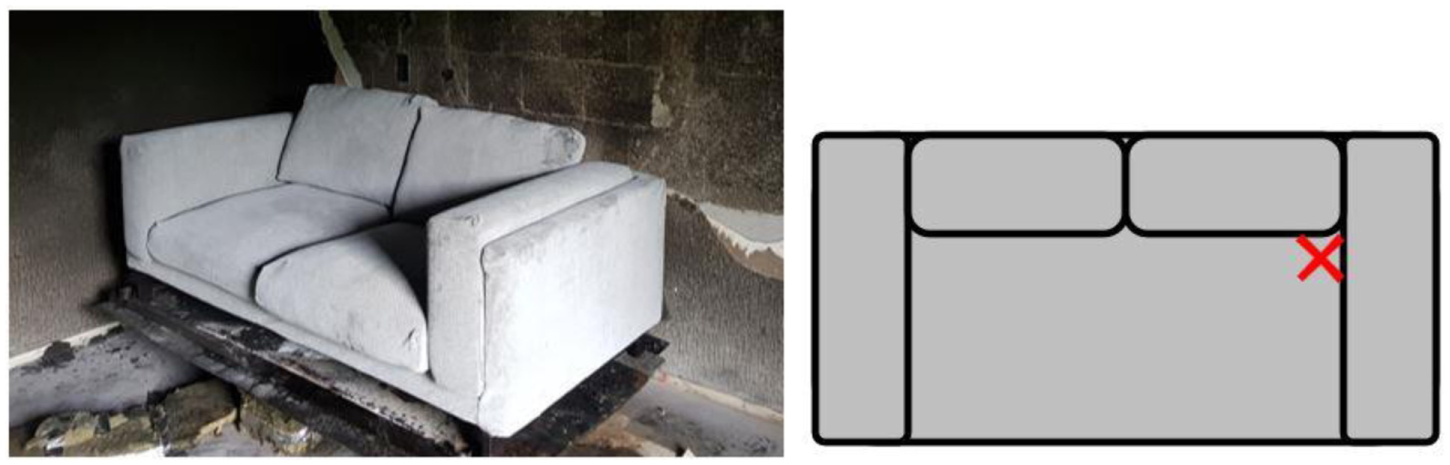
Fire object two-seater sofa (left picture) and point of ignition (right picture).
Overview of materials used in the sofa.
Tested measures and scenarios
The experimental design is based on a representative occupant escape scenario (Figure 3), in which a person, alerted by a smoke alarm and with limited or no self-reliance, exits the fire apartment via the front door into the internal corridor (C1.2), either independently or with assistance. To simulate this, a firefighter opens the apartment door 5 min after ignition and exits through corridors C1.3 and C1.4, mimicking the occupant’s escape route (Figure 1).
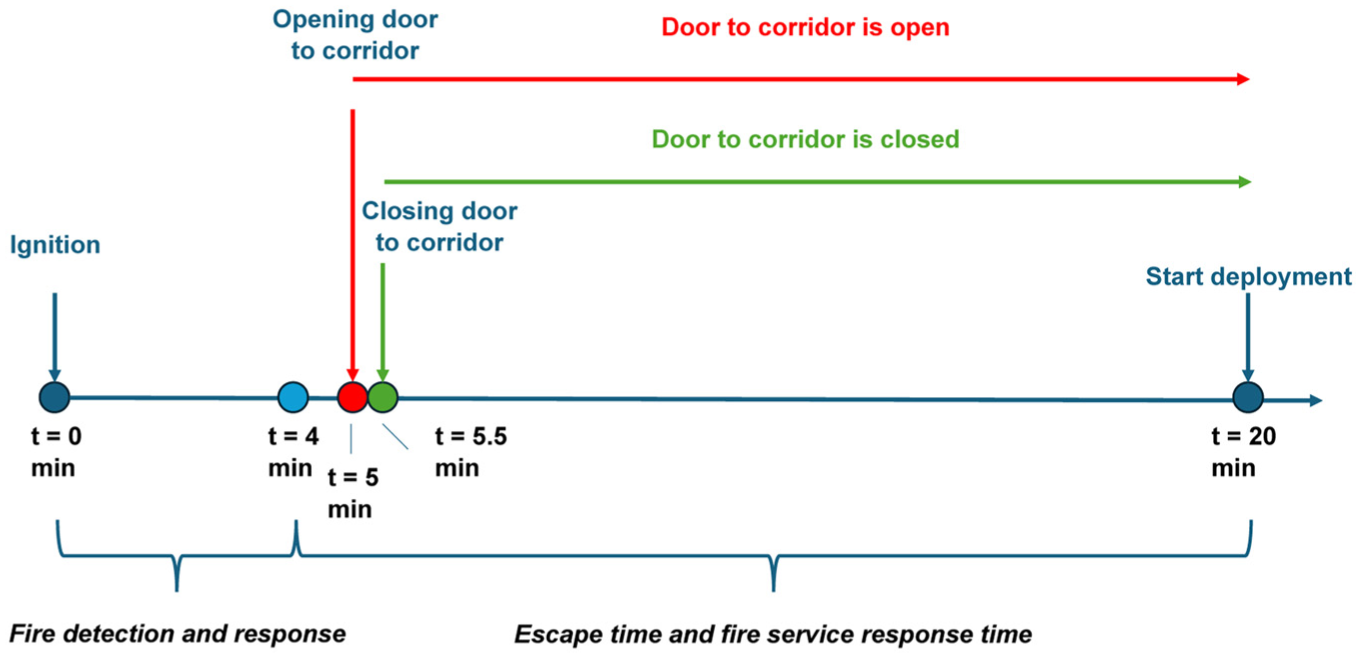
Occupant escape, illustrating the sequence of events and the two possible scenarios for the door opening between the fire compartment and the corridor.
In the baseline (experiments 1, 3, 5 and 17) and balcony door scenarios (experiments 18 and 19), the apartment door remains open after the simulated escape, reflecting pre-2020 Dutch building codes, 32 which did not require self-closing doors. In contrast, the closed-door (experiments 4 and 16) and smoke permeability scenarios (experiments 12 and 13) simulate improved containment: the door is closed 30 s after opening, representing either a self-closing mechanism or occupant action, see Figure 3 and Table 1.
The smoke permeability scenario complies with NEN 6075:2020 28 standards, incorporating S200-rated fire doors, sealed joints and closed ventilation systems to limit smoke propagation. The balcony door scenario explores the impact of an open façade, with the fire apartment’s balcony door left open throughout the test. All other experiments were conducted with a closed façade.
Instrumentation
An overview of the instrumentation and technical specifications is provided in Table 3.33–40 All instruments were calibrated before each experiment. Additional details are available in Ebus et al. 27
Summary of technical data and used instrumentation.
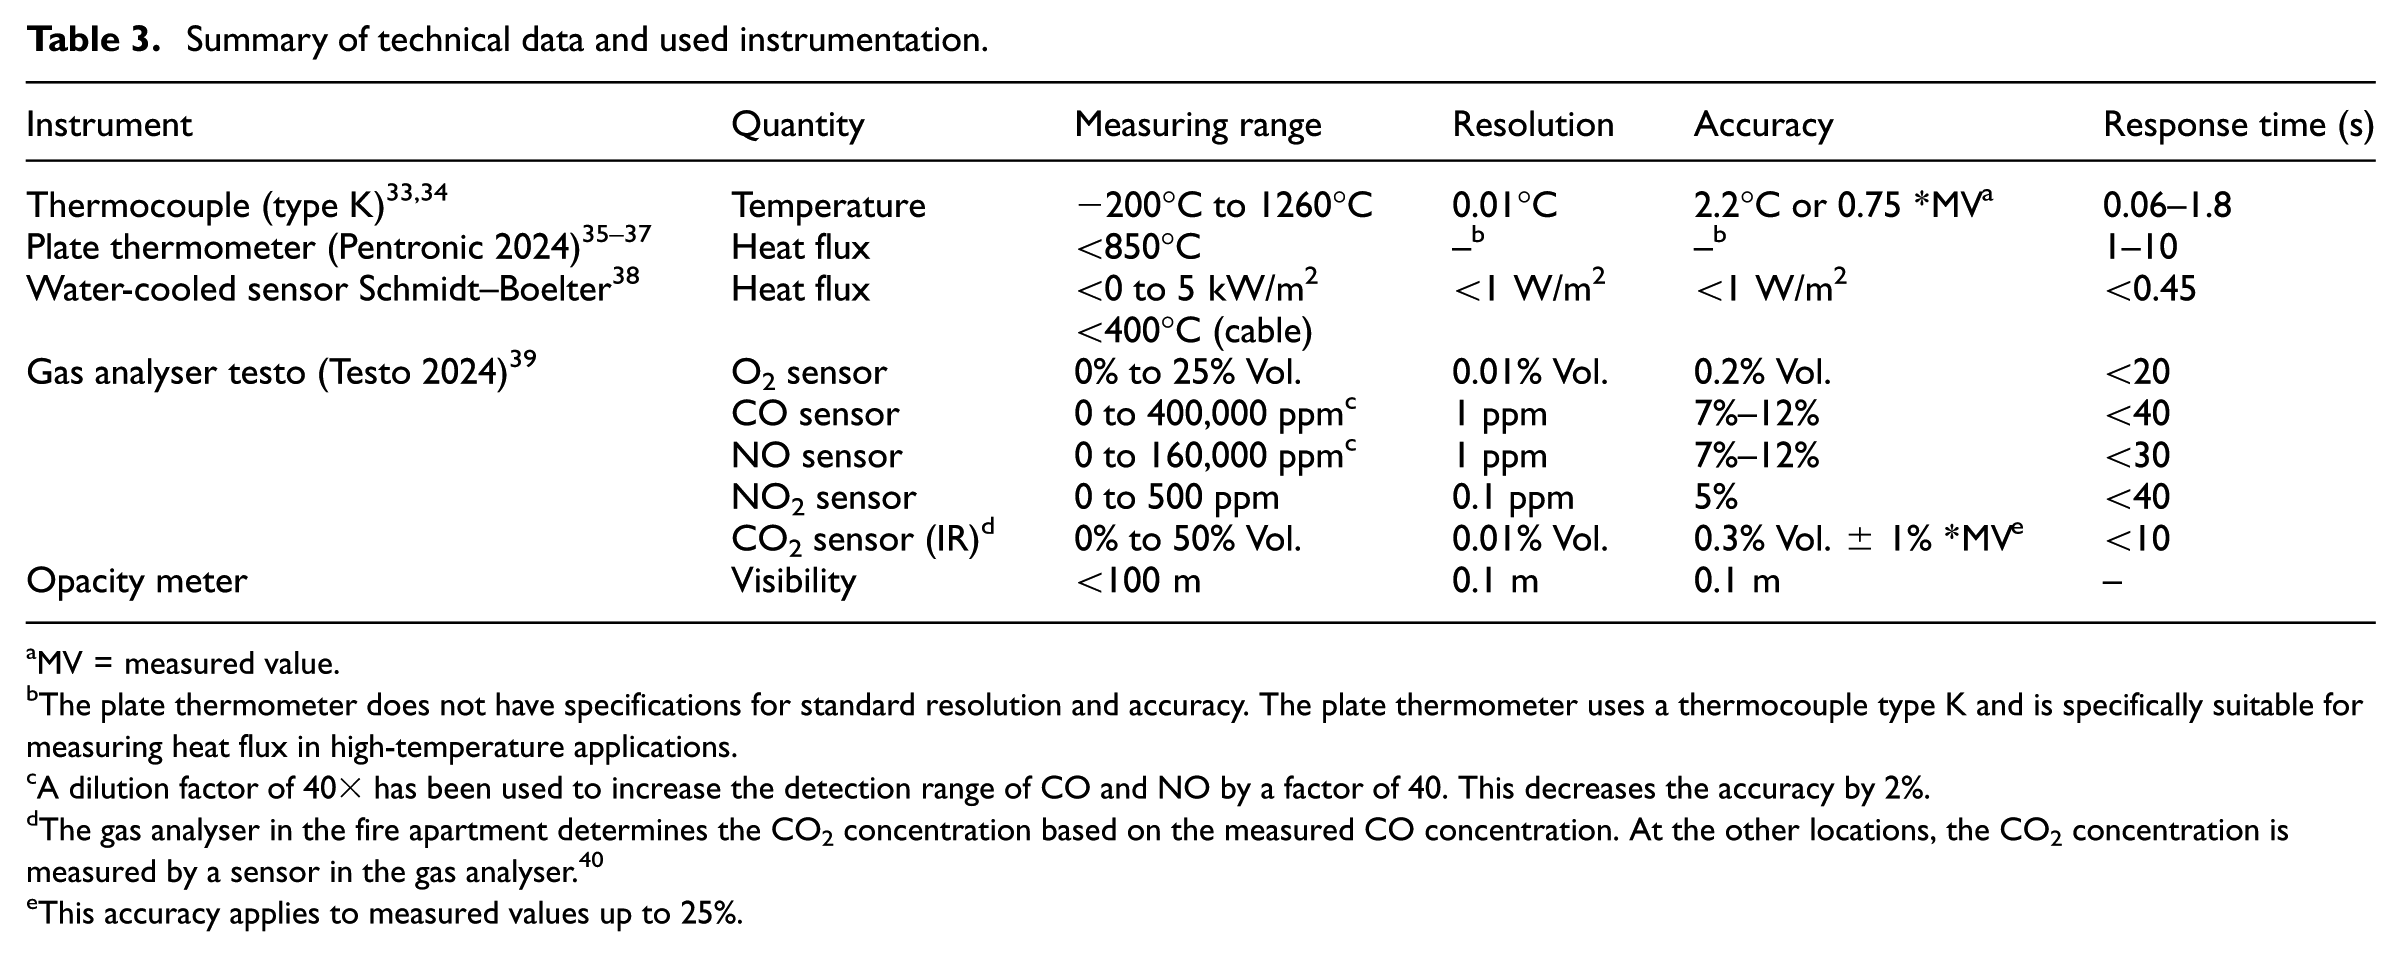
MV = measured value.
The plate thermometer does not have specifications for standard resolution and accuracy. The plate thermometer uses a thermocouple type K and is specifically suitable for measuring heat flux in high-temperature applications.
A dilution factor of 40× has been used to increase the detection range of CO and NO by a factor of 40. This decreases the accuracy by 2%.
The gas analyser in the fire apartment determines the CO2 concentration based on the measured CO concentration. At the other locations, the CO2 concentration is measured by a sensor in the gas analyser. 40
This accuracy applies to measured values up to 25%.
Gas temperature was measured using 0.75 mm type K thermocouples33,34 and heat flux with plate thermometer heat flux meters (PTHFM) at 1.5 m height.35–37 Gas concentrations (O2, CO, CO2, NOx) were measured using Testo 350 analysers, 39 with individual sensors for each gas. A 2.2 m hose connected to a smoke probe (inserted ∼30 cm into the room) allowed remote sampling from a cleaner environment.
Visibility was estimated using custom-built opacity meters consisting of a light source and a photovoltaic cell spaced 17–25 cm apart. Optical density was calculated using the Beer-Lambert law in literature41,42
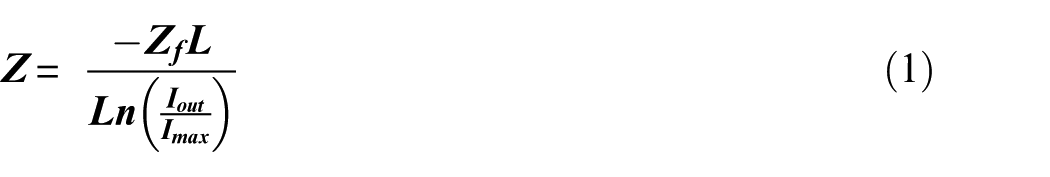
In equation (1),
Sensor locations are shown in Figure 1 and detailed in Table 4. Measurements were taken at different heights, with attention to: 1.5 m above the floor, corresponding to the breathing height of a standing occupant, and 0.3 m above the floor, corresponding to the breathing height of a lying occupant. This article focuses on data collected at 1.5 m in the fire apartment, corridor C1.2 and apartment 1.25.
Sensor positioning.
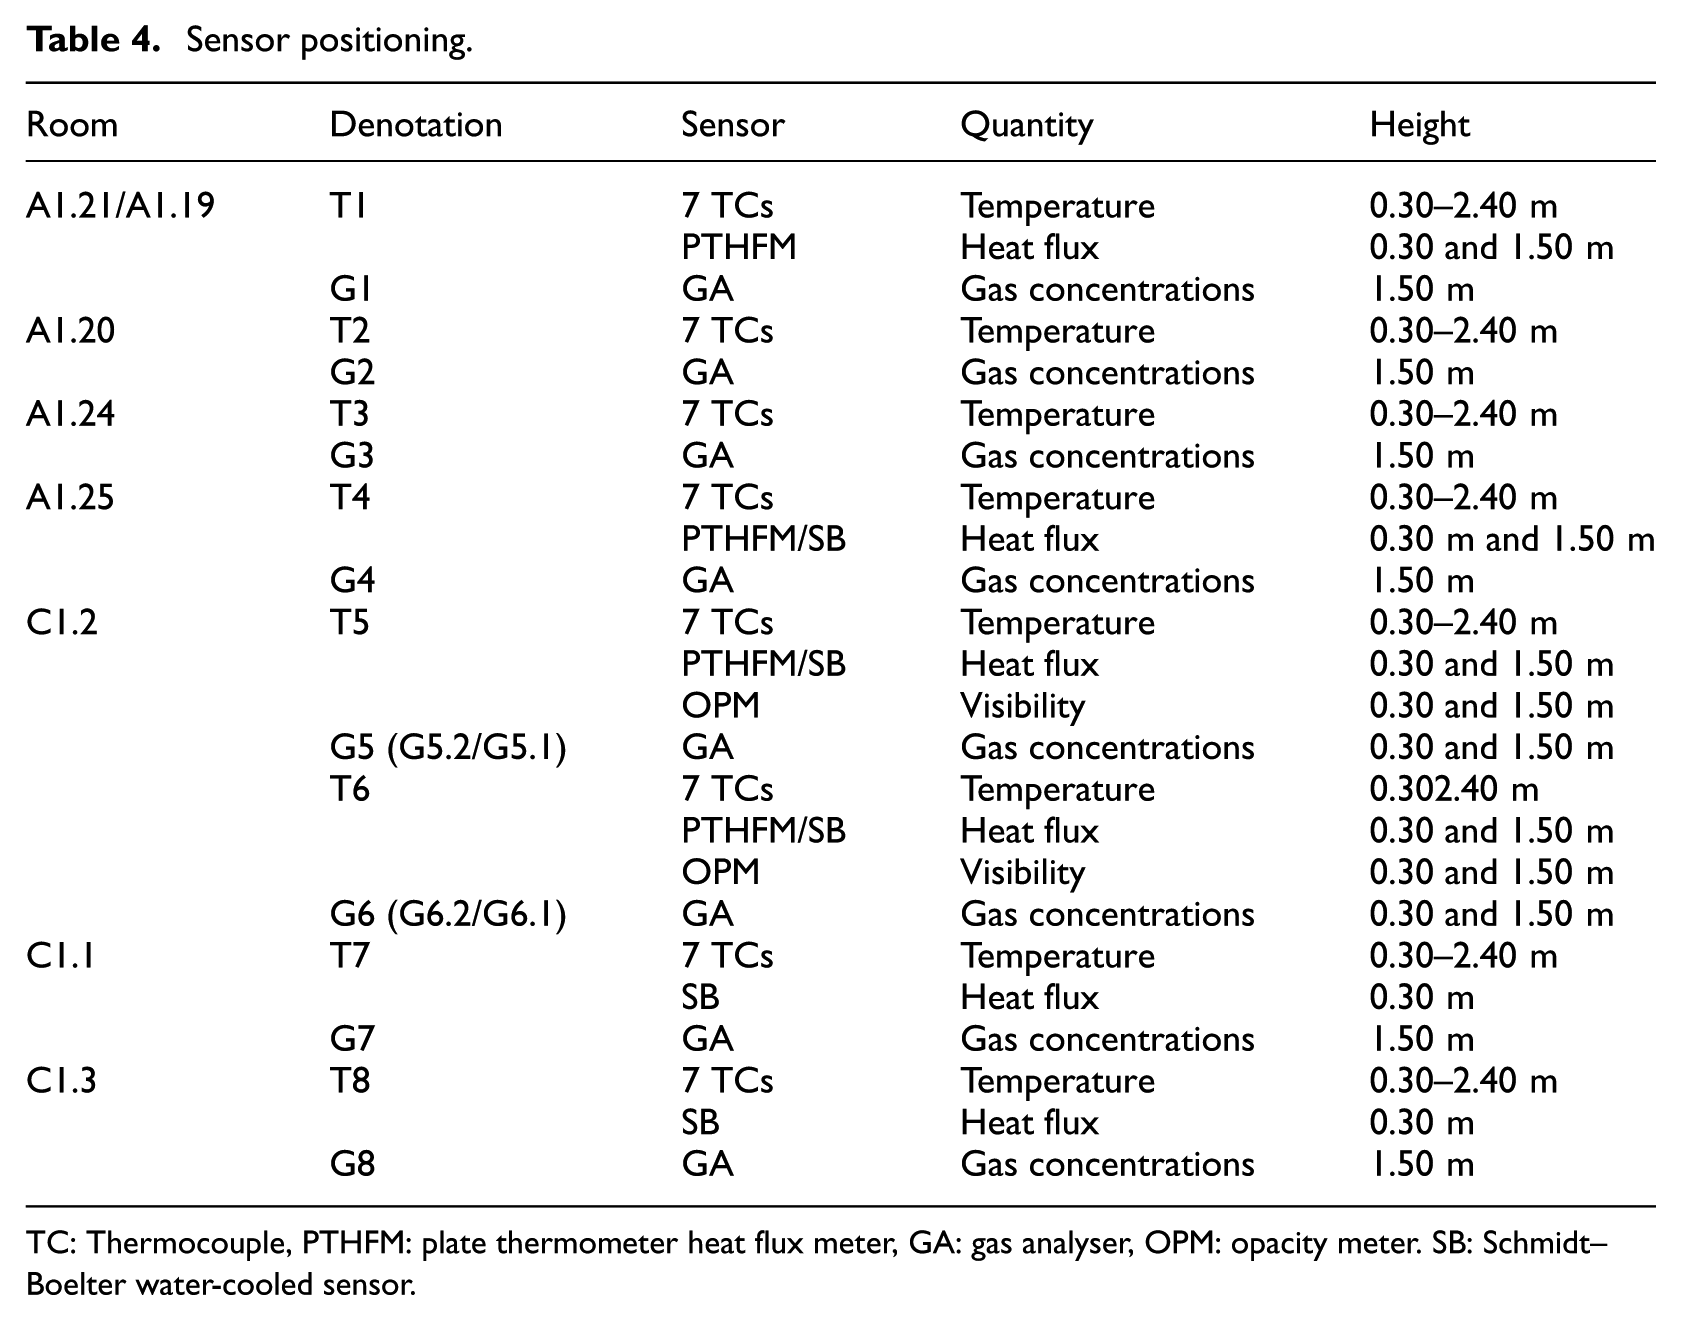
TC: Thermocouple, PTHFM: plate thermometer heat flux meter, GA: gas analyser, OPM: opacity meter. SB: Schmidt–Boelter water-cooled sensor.
Sampling rates were 10 Hz for temperature, heat flux and visibility, and 3 Hz for gas concentrations. For analysis, data were down-sampled to 1 Hz (except gas concentrations, which retained their original rate). Additional results and details on these and other measurements can be found in the research reports.27,31
Results
The results of the experiments are presented in this section. Results from the baseline scenario are shown first, followed by results from experiments with closed doors and smoke permeability, as well as the balcony door open. A selection of these results is provided, while more detailed information about specific time-value series and additional data can be found in Ebus et al. 27
Baseline scenario
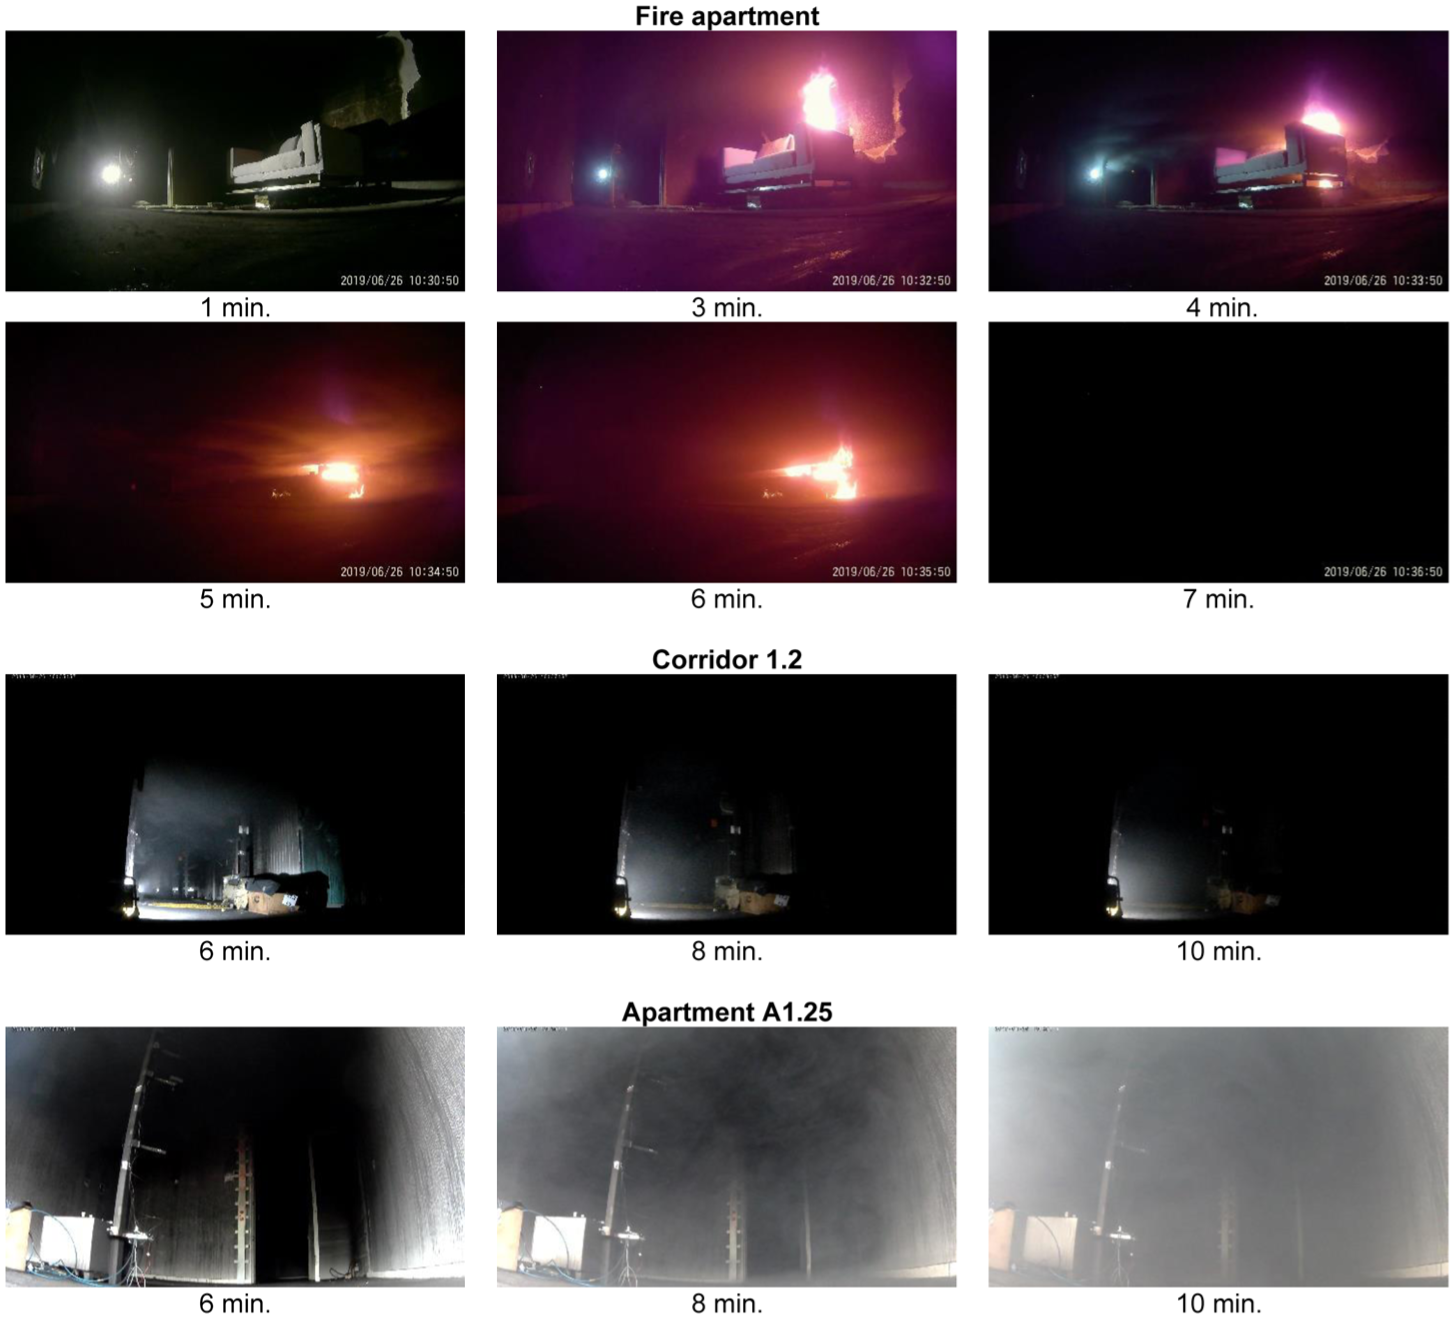
The baseline scenario involves a fire on a sofa in an apartment where the occupant escapes after 5 min by leaving the front door open and exiting to the corridor. During the first 20 min, no interventions are carried out. A total of four repeats (E1, E3, E5 and E17) of the baseline scenario have been performed. The fire development and the change of conditions in the fire apartment, corridor 1.2 and apartment A1.25 for experiment 1 are illustrated in Figure 4.
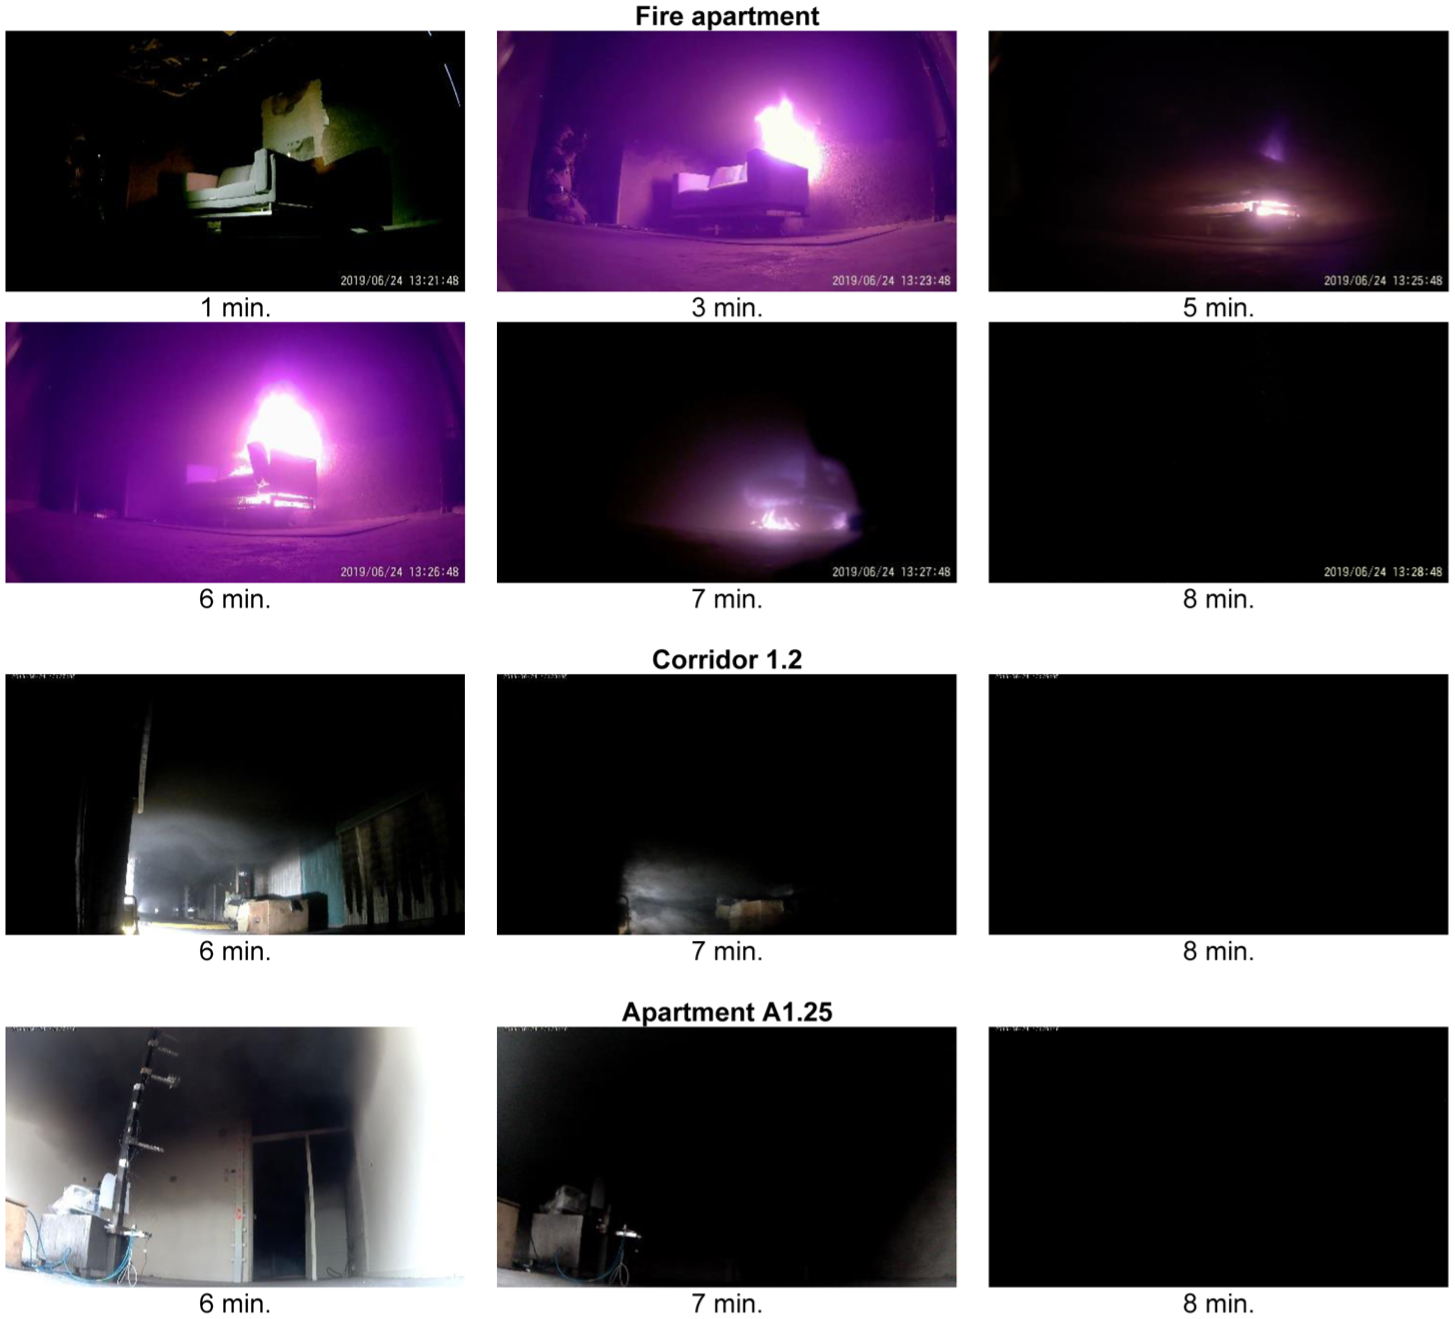
Baseline scenario: outline of fire development and conditions in time in the fire apartment for experiment 1.
After the crib is ignited in the corner of the sofa, the fire starts to grow. During the first minutes, there is no visible layer of smoke. However, after 3 min, the fire development accelerates, and a smoke layer starts to fill the apartment. In 5 min, the fire apartment is nearly filled with smoke (Figure 4). During this time, the smoke also influences the behaviour of the fire, slowing down its development. When the front door is opened at 5 min, smoke propagates into the corridor, allowing fresh air to enter the fire apartment. This inflow of oxygen causes the fire development to increase again, as shown by the 6 min image in Figure 4. The intensified fire development results in increased smoke production, and by 8 min, the fire apartment is entirely filled with smoke, further affecting the fire behaviour and slowing down its development. At this point, both the corridor and apartment 1.25 are completely filled with smoke.
Table 5 provides a summary of the maximum measured values for temperature, carbon monoxide, carbon dioxide and nitrogen oxides, as well as the minimum measured values for oxygen. It concerns the measured values in the fire apartment (FR), the corridor at two positions (C1.2) and apartment 1.25 (A1.25) at 1.5 m above the floor.
Baseline scenario: maximum values for temperature, carbon monoxide, carbon dioxide, nitrogen oxides and minimum* values for oxygen.
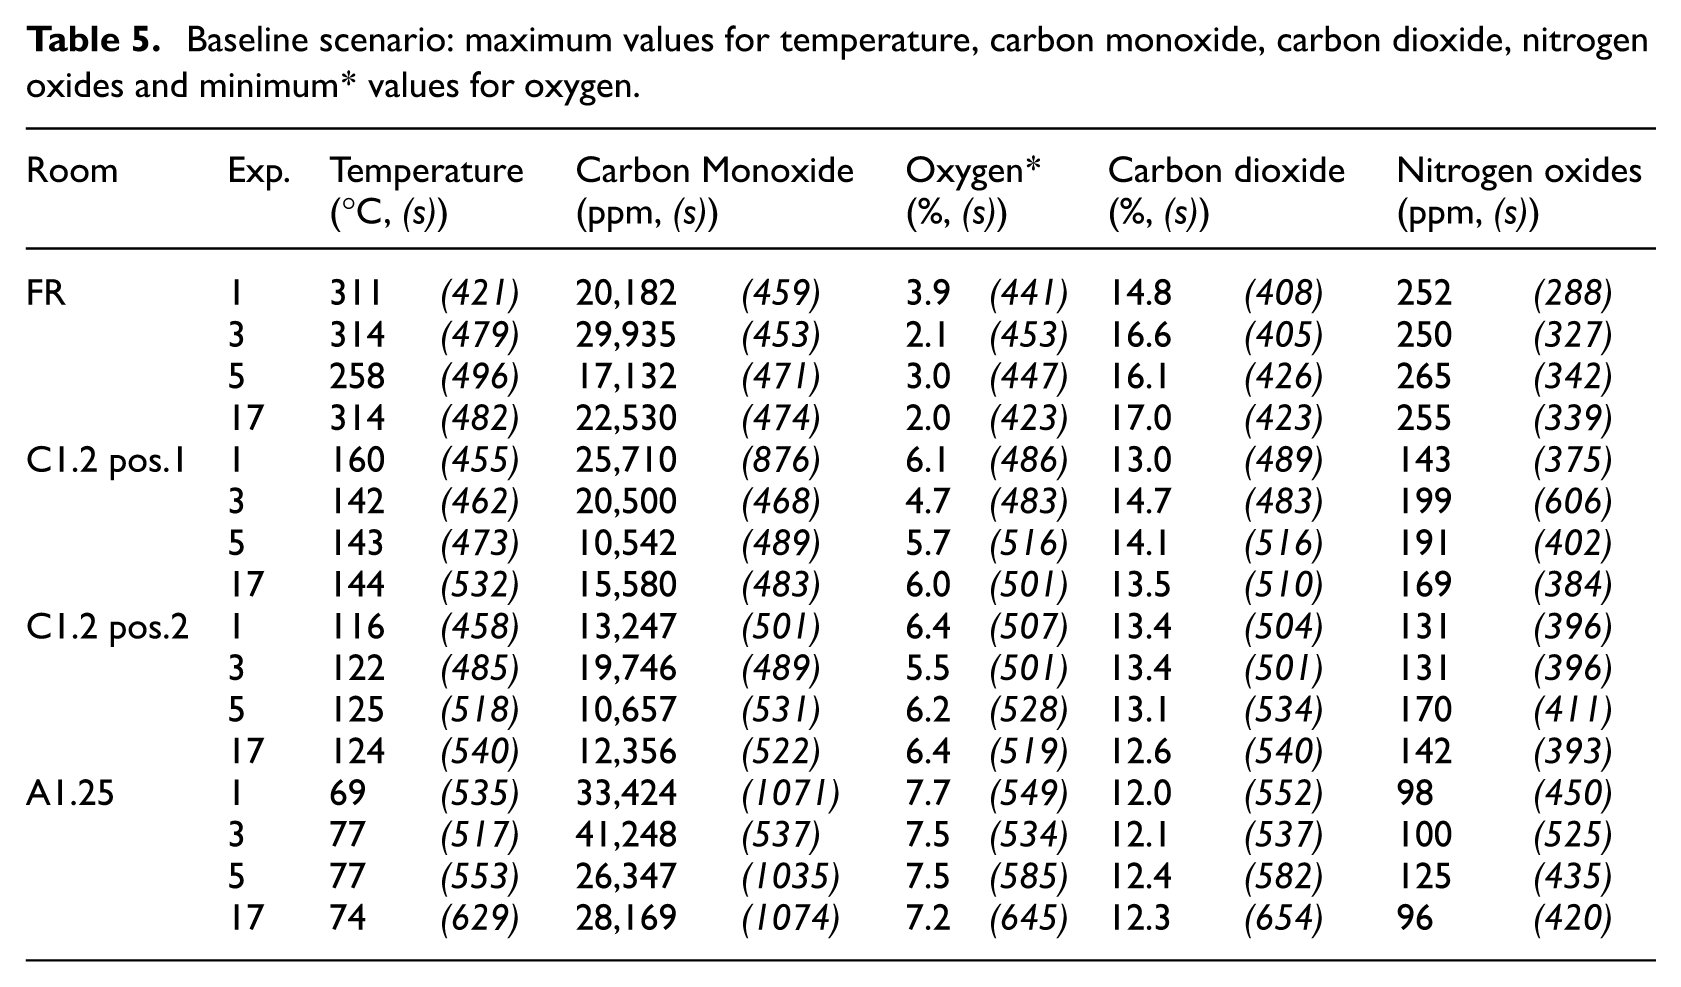
Figure 1 gives an overview of the measurement instrument positions. C1.2 position 1 in Table 5 is the closest measuring point in corridor C1.2 relative to the fire apartment. C1.2 position 2 in Table 5 is the furthest measuring point in corridor C1.2 relative to the fire apartment. For instance, in experiment 1, fire apartment 2 (A1.21) is utilised. Therefore, position 1 corresponds to T5 and G5, and position 2 corresponds to T6 and G6 in Figure 1. The measured values during the first 13 min in the same room and level (1.5 m) are also presented in Figures 5 and 6, in addition to Table 5.
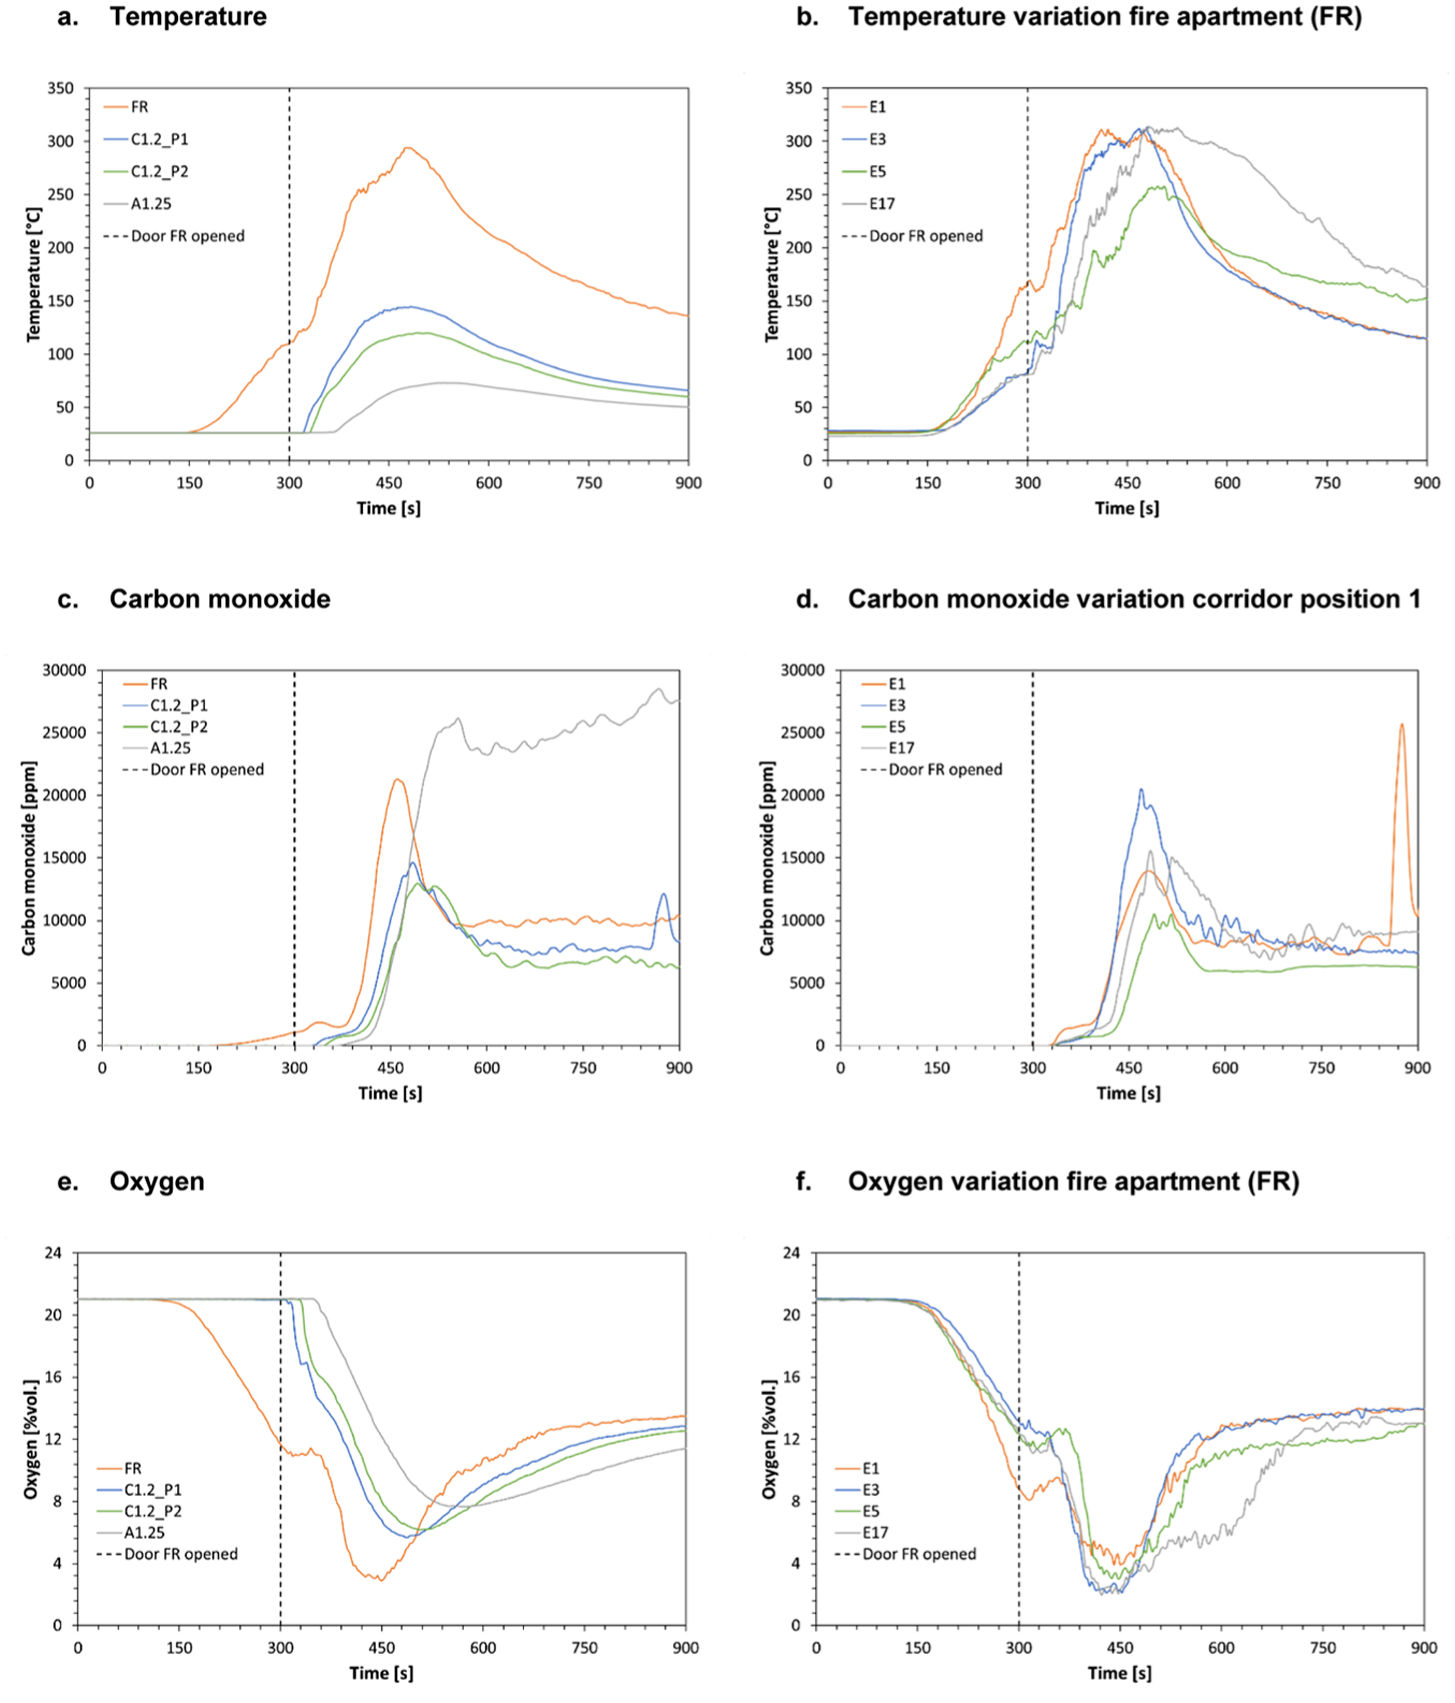
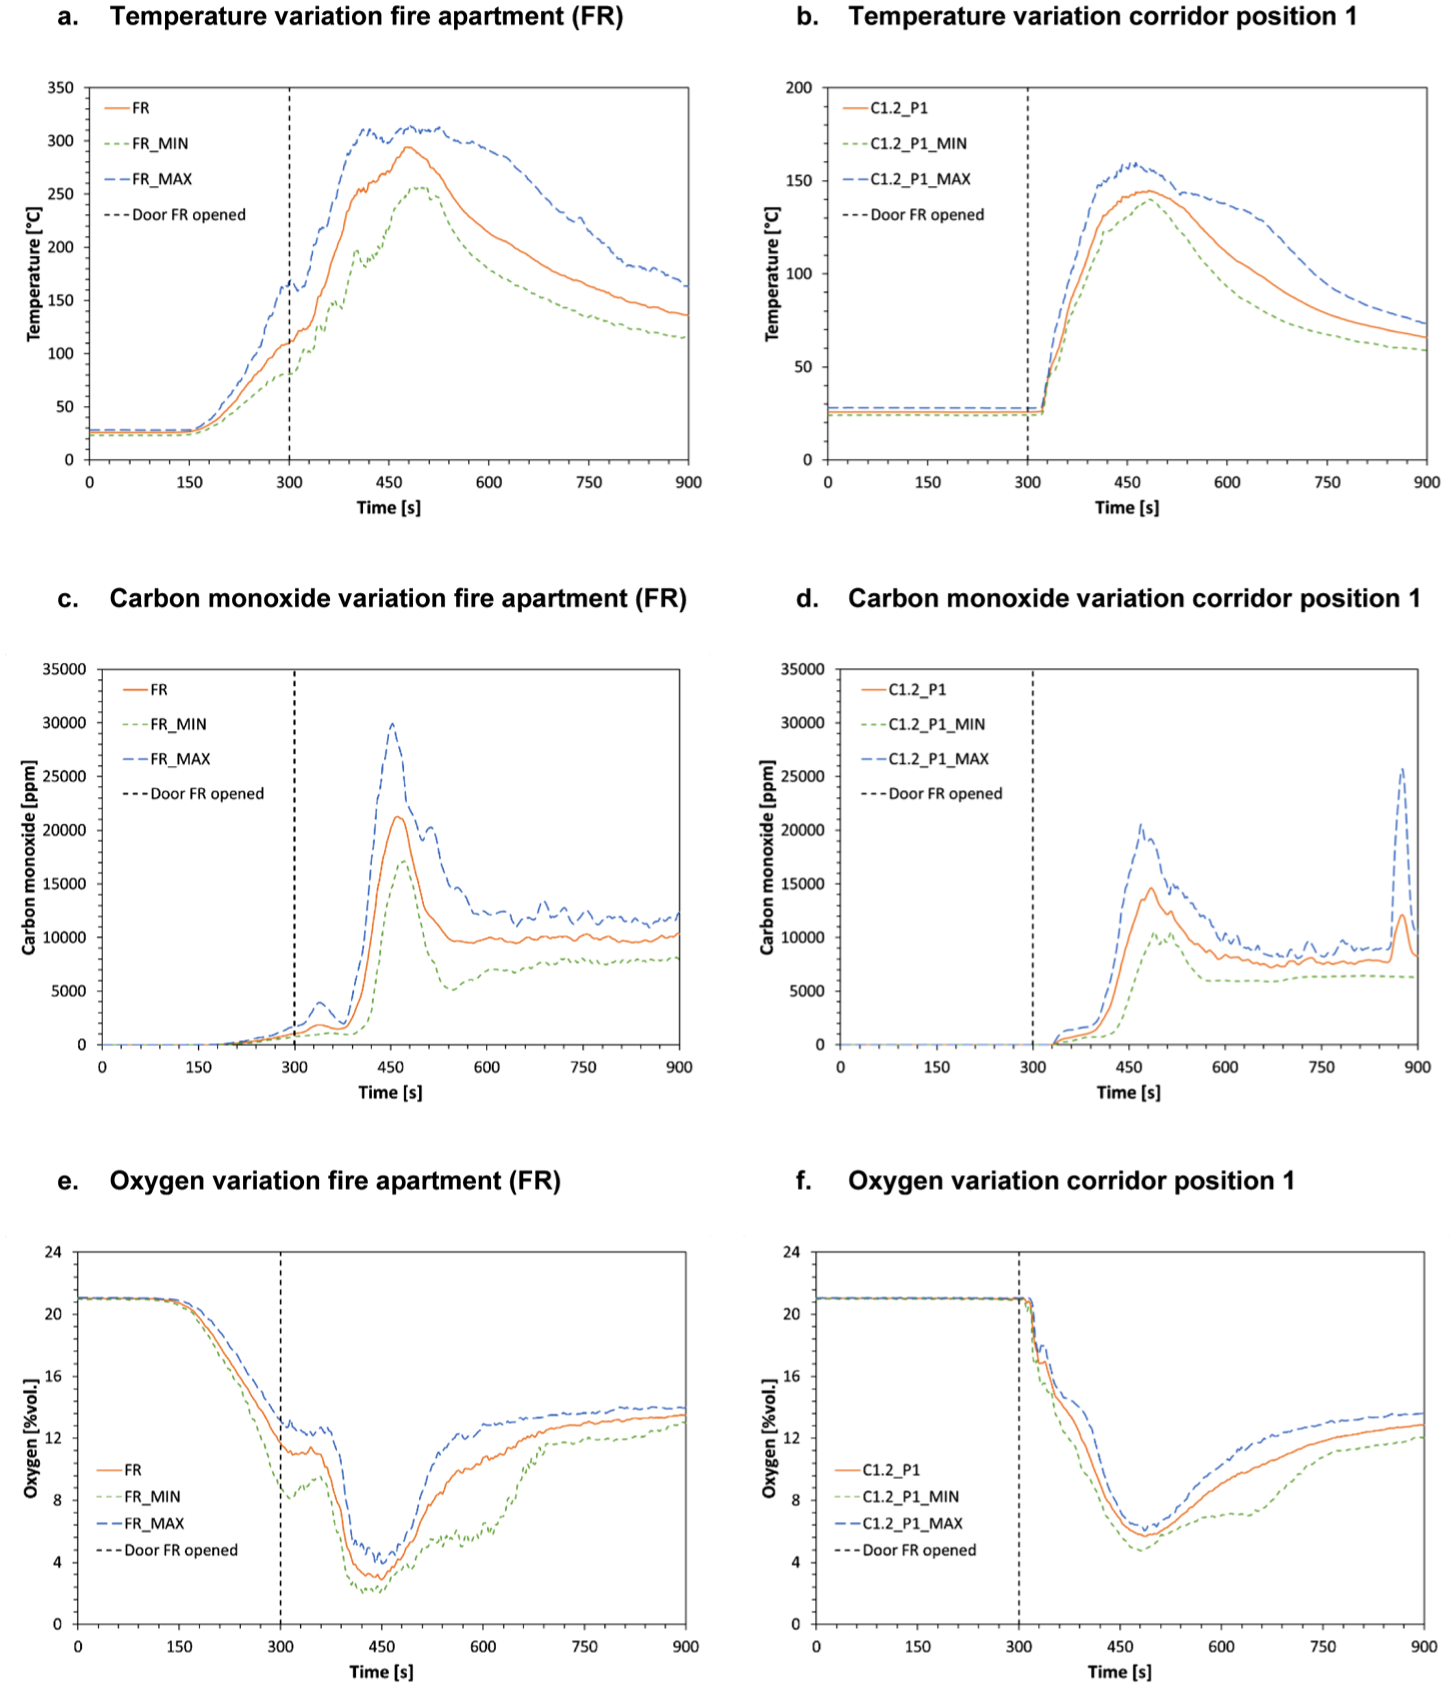
Baseline scenario: average time series in the fire apartment, corridor and apartment A1.25, (a) temperatures, (c) carbon monoxide concentrations, (e) oxygen concentrations and time series of the four baseline experiments (E1, E3, E5 and E17) (b) temperatures in the fire apartment, (d) carbon monoxide concentrations in the corridor at position 1 and (f) oxygen concentrations in the fire apartment.
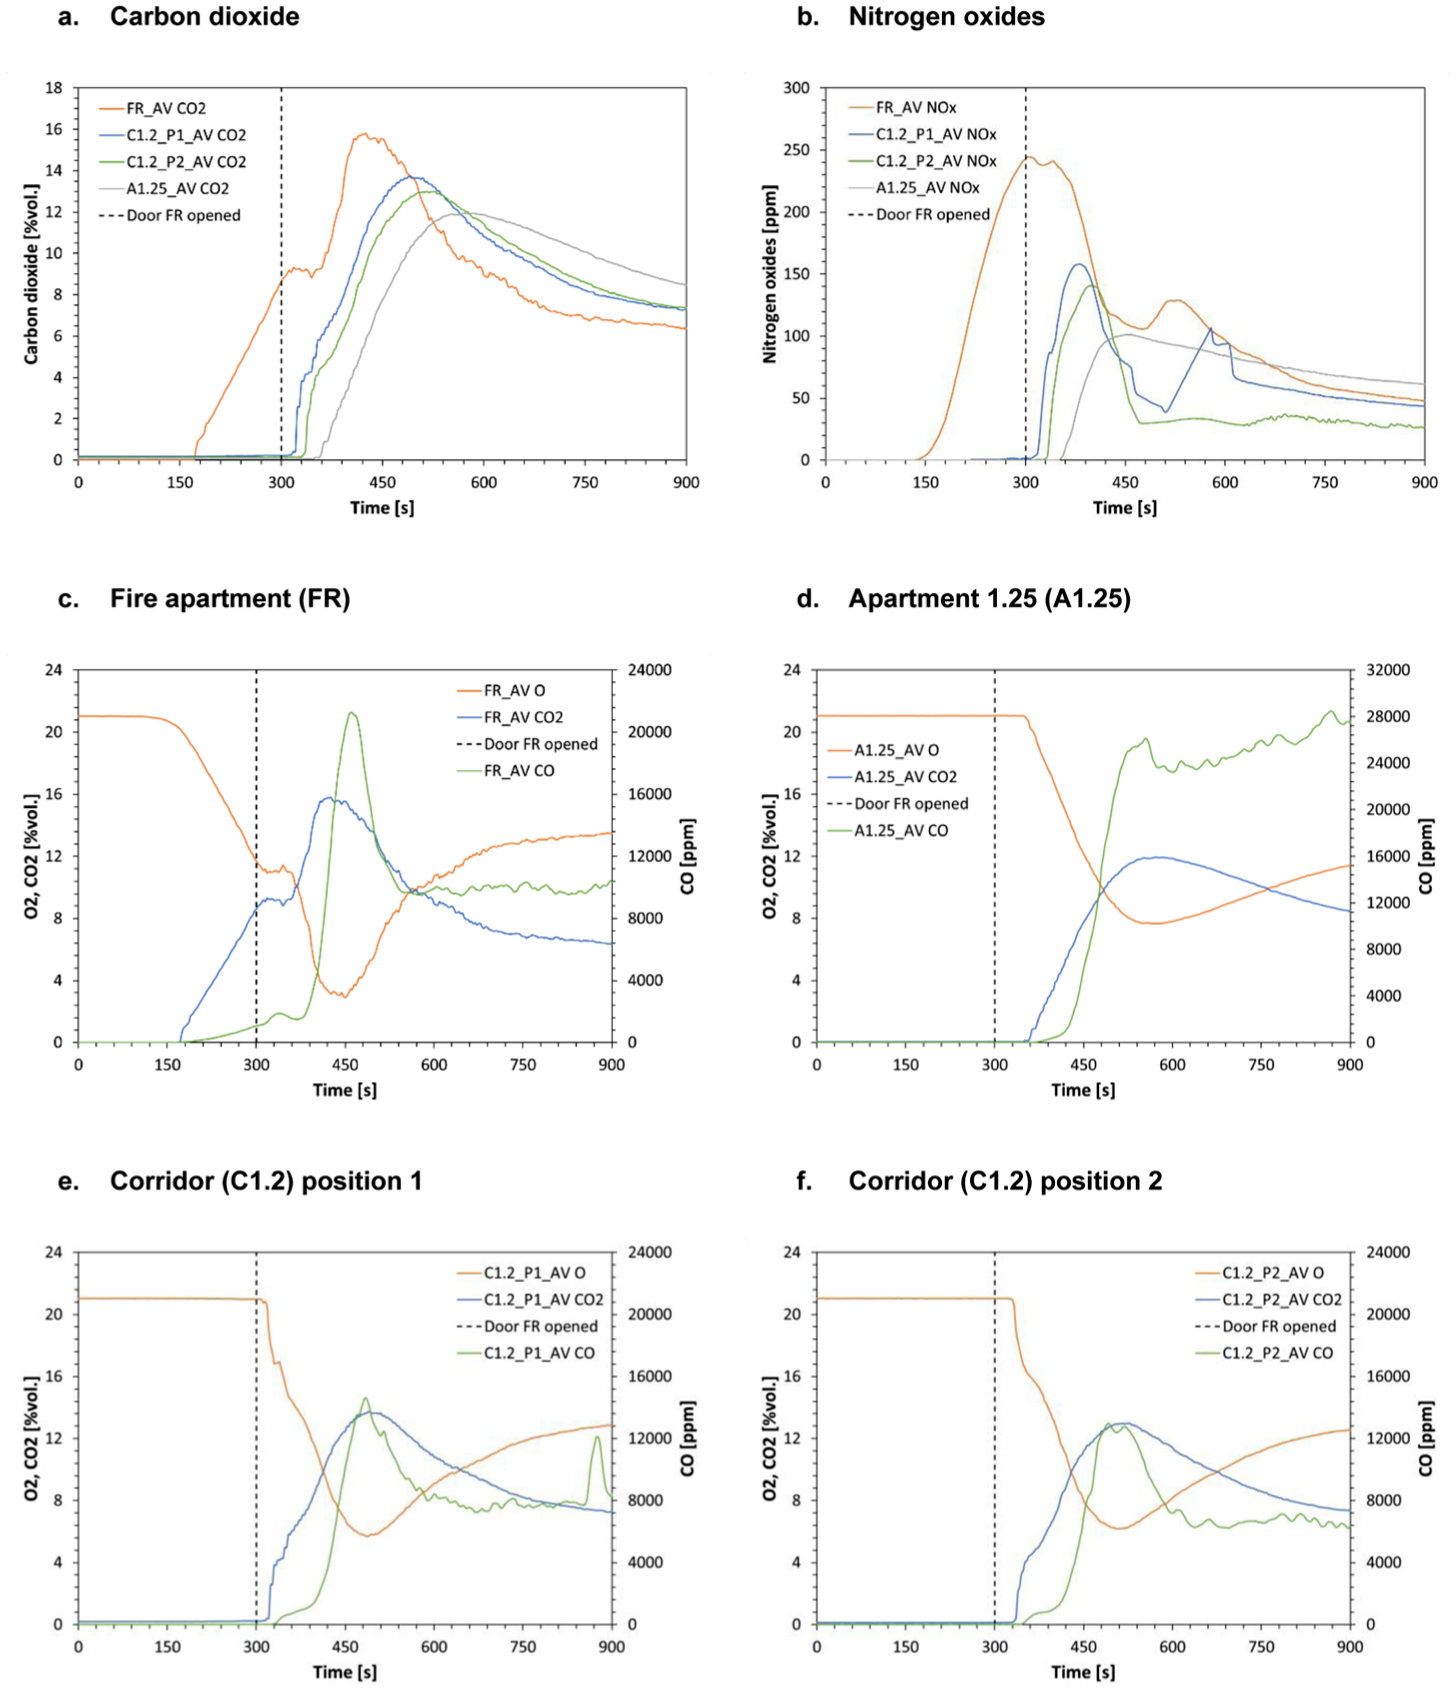
Baseline scenario: average time series in the fire apartment, corridor and apartment A1.25, (a) carbon dioxide, (b) nitrogen oxide concentrations and combined time series of carbon and oxygen concentrations, (c) fire apartment, (d). apartment A1.25, (e) corridor position 1 and (f) corridor position 2.
Temperature
Temperatures in the fire apartment start to rise after 2 min 30 s (150 s). Before the front door is opened (<5 min), all four experiments show an almost linear temperature rise in the fire apartment (Figures 5(a) and (b)). After the front door is opened (>5 min), the temperatures start to rise in the corridor and apartment 1.25. The rate of temperature increase reduces with an increase in distance from the fire apartment (Figure 5(a)). In the fire apartment, the temperature reaches a maximum in the experiments between 258°C and 314°C. In the corridor at position 1, the maximum temperature is between 142°C and 160°C, and it is between 116°C and 125°C at position 2. In apartment A1.25, the temperature reaches a maximum between 69°C and 77°C (Table 5).
Oxygen, carbon and nitrogen concentrations
Figure 5(e) and (f) shows a decline in oxygen concentration in the fire apartment after 2 min 30 s (150 s). When the front door is opened (>5 min), oxygen concentrations drop below 14 volume percent (%vol.), indicating ventilation-limited conditions. After the front door is opened, the decline in oxygen concentrations temporarily stops for about 1 min as fresh air from the corridor enters the fire apartment. However, after 6 min (>360 s), the oxygen concentrations begin to decrease rapidly, reaching very low levels between 2.0 and 3.9 volume percent (%vol.), see Table 5. Conversely, carbon dioxide concentrations exhibit a reverse trend, as illustrated in Figure 6(a) and (c). After opening the door, concentrations increase rapidly, stabilise for 1 min and then increase again to maximum values between 14.8 and 17.0 volume percent (%vol.) in the fire apartment. Similar concentrations were reported by Morikawa et al.6,7 as well as Madrzykowski 8 and Crewe et al. 17 After reaching their respective minimum and maximum concentrations, the oxygen concentrations stabilise between 12% and 15% Vol., while carbon dioxide concentrations stabilise between 5% and 7% Vol. (Table 5).
In the fire apartment, nitrogen oxide concentrations rise (Figure 6(b)) similarly with the increase in temperature and a decline in oxygen concentrations (2 min 30 s), peaking at between 250 to 265 parts per million (ppm) around the time the front door is opened (>5 min). After the front door is opened, nitrogen oxide concentrations decrease due to the continuing drop in oxygen concentrations and the increase in temperature. As the environment in the fire apartment becomes more ventilation-limited, carbon monoxide concentrations also start to increase rapidly (Figure 5(c) and (d) and Figure 6(c)). Before the front door is opened (<5 min), carbon monoxide concentrations remain below 2000 ppm. After 6 min and 30 s, these concentrations increase rapidly, reaching maximum values between 17,000 and 30,000 parts per million (ppm) in the fire apartment. Similar concentrations were found in experiments conducted by Madrzykowski 8 and Crewe et al. 17
Gas concentrations in the corridor and apartment A1.25 follow similar trends after the front door is opened. In the corridor, maximum concentrations are between 10,000 and 26,000 ppm for carbon monoxide, 12.5% and 15% Vol. for carbon dioxide, and minimum oxygen concentrations between 4.5% and 6.5% Vol. (Table 5 and Figure 6(e) and (f)). The highest carbon monoxide concentrations are measured in apartment 1.25 (A1.25) with maximum values between 26,000 and 42,000 ppm (Table 5 and Figure 6(d)). This increase is attributed to the accumulation of smoke in that apartment, which also exhibits the most visible soot deposition.
Hydrogen cyanide
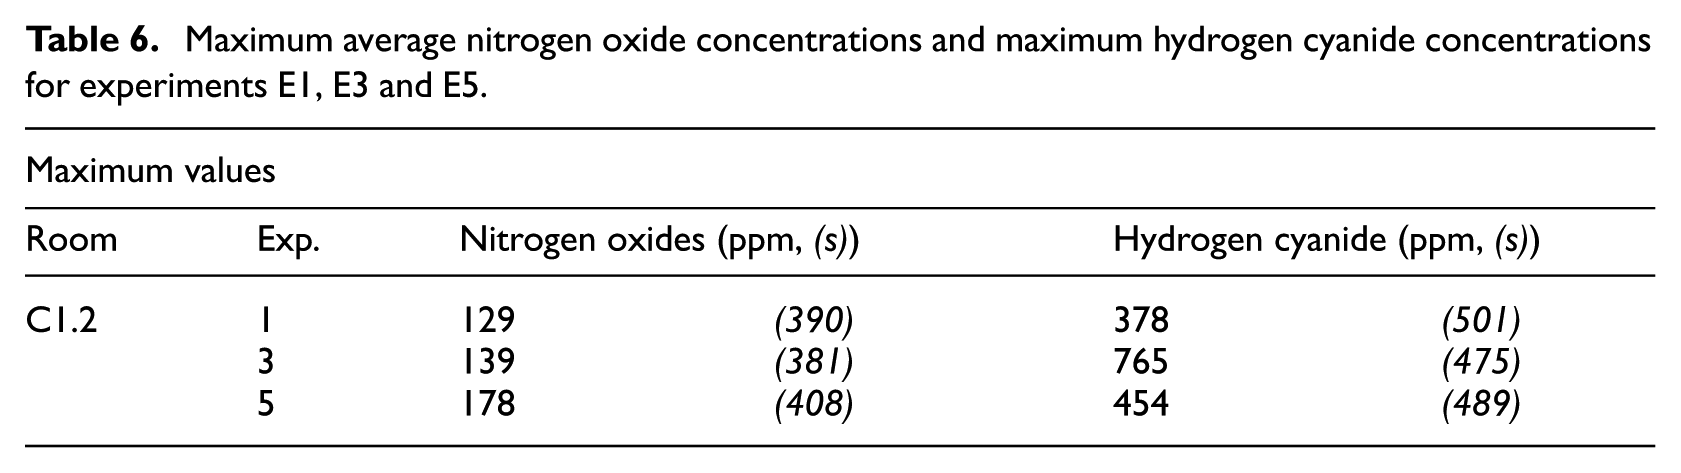
During experiments 1 to 5, the Dutch National Institute for Public Health and the Environment (RIVM) performed smoke and gas concentration measurements 43 in the corridor near apartment A1.26 and T6, see Figure 1. One of the measurements contained hydrogen cyanide concentrations. Table 6 and Figure 7 provide a summary of the combined measured nitrogen oxide concentration as mentioned in the previous section and measured hydrogen cyanide concentrations by RIVM. For nitrogen oxide concentrations, the average concentrations for positions 1 and 2 in the corridor are presented.
Maximum average nitrogen oxide concentrations and maximum hydrogen cyanide concentrations for experiments E1, E3 and E5.
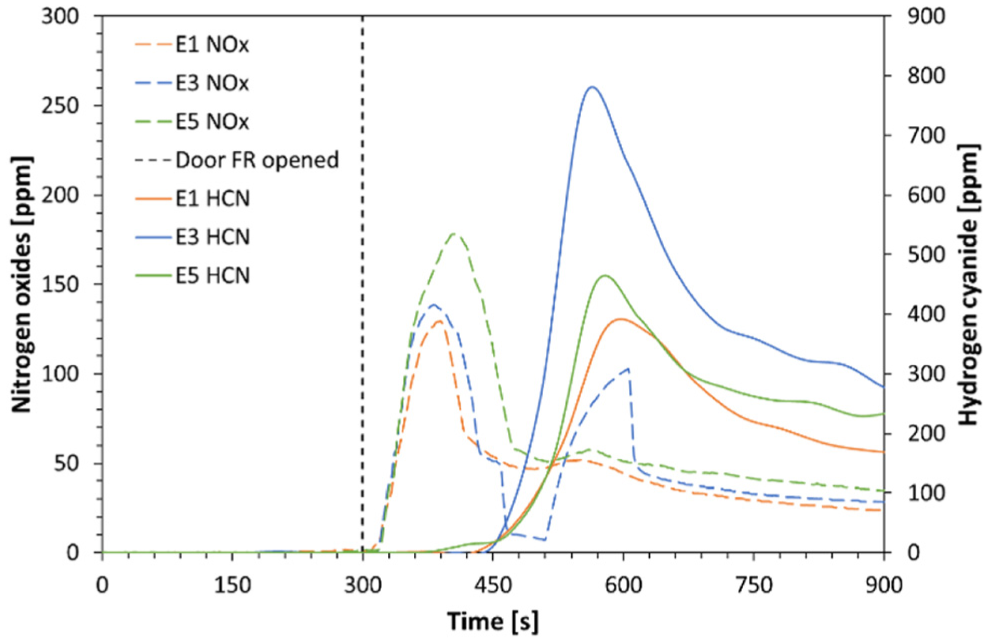
Baseline scenario: measured concentrations of nitrogen oxides (average positions 1 and 2) and hydrogen cyanide in the corridor (C1.2).
Hydrogen cyanide concentrations in the corridor begin to rise 2 min and 30 s after the door is opened (see Figure 7). As mentioned in the previous section, minimum oxygen concentrations and maximum temperatures in the fire apartment are reached approximately 450 to 480 s after ignition. At this point, the environment in the fire apartment becomes severely ventilation-limited, resulting in a decrease in nitrogen oxide concentrations and an increase in hydrogen cyanide concentrations. This trend is reflected in the measured maximum concentrations in the corridor, with maximum hydrogen cyanide concentrations between 378 and 765 ppm around 3 to 4 min after the front door is opened.
Visibility
In addition to temperature and gas measurements, optical density is also measured in the corridor to estimate the visibility (see `Instrumentation' section). Figure 8 shows the average calculated visibility in the corridor at two positions (C1.2) at 1.5 and 0.3 m above the floor.
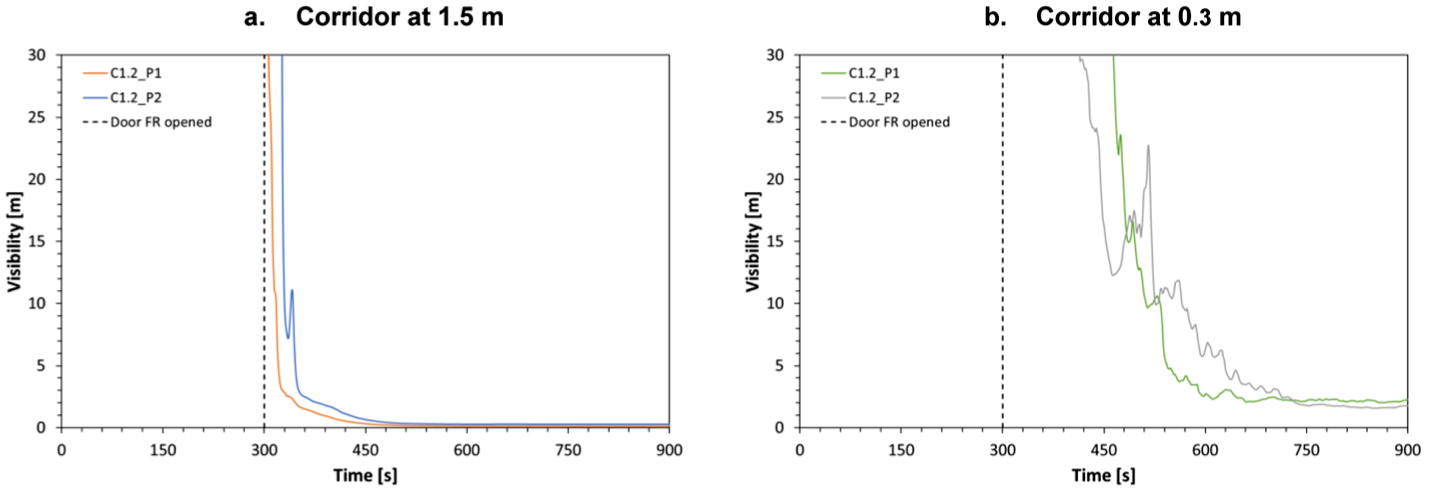
Baseline scenario: average time series of visibility in the corridor at 1.5 and 0.3 m: (a) Corridor at 1.5 m and (b) corridor at 0.3 m.
After opening the door of the fire apartment, smoke enters the corridor, causing the visibility to decrease to less than 5 m at 1.5 m within seconds (Figure 8(a)). After 7 to 8 min, the visibility drops to less than 1 m at 1.5 m. This decrease corresponds with the images in Figure 4 and the trends in the carbon monoxide and oxygen curves in Figures 5 and 6. Initially, the smoke forms a stratified layer in the corridor, which is divided into a hot and a cold zone. As the smoke flow reaches the end of the corridor and apartment 1.25, it collides with the end constructions, creating a downwards and opposite flow at the lower part of the corridor. Due to the temperature difference in the smoke, most of the soot remains in the upper part of the smoke layer. However, after a few minutes, the smoke tends to homogenise due to mixing and cooling effects (see Figure 4). As a result, visibility decreases at the level of 0.3 m (Figure 8(b)). The visibility varies depending on the experiment and position in the corridor. The measurements indicate that there are high levels of soot present in the smoke, which is expected in cases of ventilation-limited fires.
Scenarios: closed door and smoke permeability
These scenarios are similar to the baseline scenario, except for the closure of the door to the corridor (>5.5 min) after the occupant escapes towards the corridor. Results from a total of four experiments are reported here. In addition to the closed-door scenario (experiment numbers 4 and 16), the partitions in the other scenario (experiment numbers 12 and 13) have smoke permeability measures. The fire development and the change of conditions in the fire apartment, corridor 1.2 and apartment A1.25 for experiment 4 are illustrated in Figure 9.
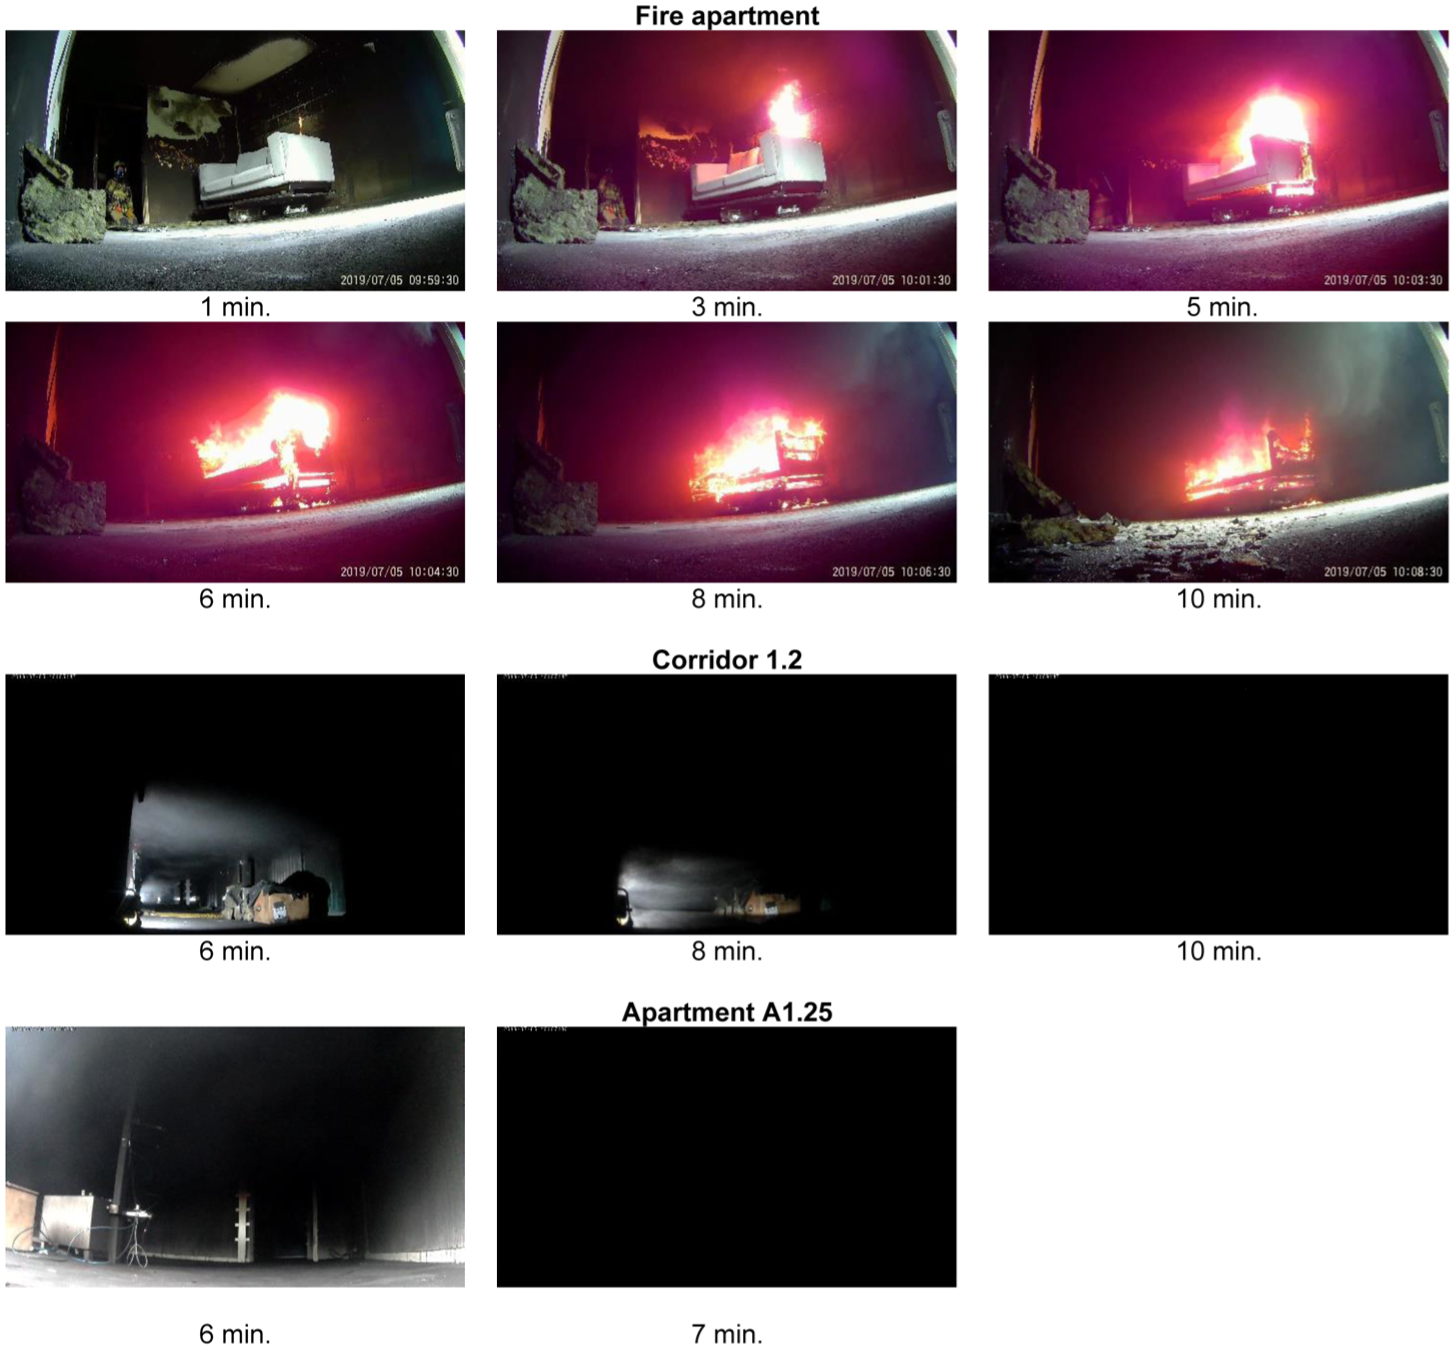
Closed door and smoke permeability scenario: outline of fire development and conditions in time in the fire apartment for experiment 4.
As shown in Figure 9, the images for the first 5 min are similar to the baseline scenario in Figure 4. By 5 min, the fire apartment is nearly filled with smoke (Figure 9), impacting the fire’s development. When the front door is opened (>5 min), smoke propagates into the corridor, allowing fresh air to enter the fire apartment until the door is closed (5.5 min.). This 30-s inflow of oxygen leads to a brief increase in fire intensity, as illustrated by the image taken at 6 min. However, once the door is closed (see the 7-min image), the fire apartment is filled with smoke, which further affects the behaviour and development of the fire. The fire development is slower compared with the baseline scenario. In addition, due to the closed door, less smoke propagates into the corridor, initially forming a smoke layer at the upper portion. After 10 min, the smoke starts to mix, ultimately filling both the corridor and apartment 1.25.
Table 7 provides a summary of the maximum measured values for temperature, carbon monoxide, carbon dioxide and nitrogen oxides, as well as the minimum measured value for oxygen. In addition to Table 7, a selection of measured values during the first 15 min is also presented in Figure 10.
Closed door and smoke permeability scenario: maximum values for temperature, carbon monoxide, carbon dioxide, nitrogen oxides and minimum* values for oxygen.
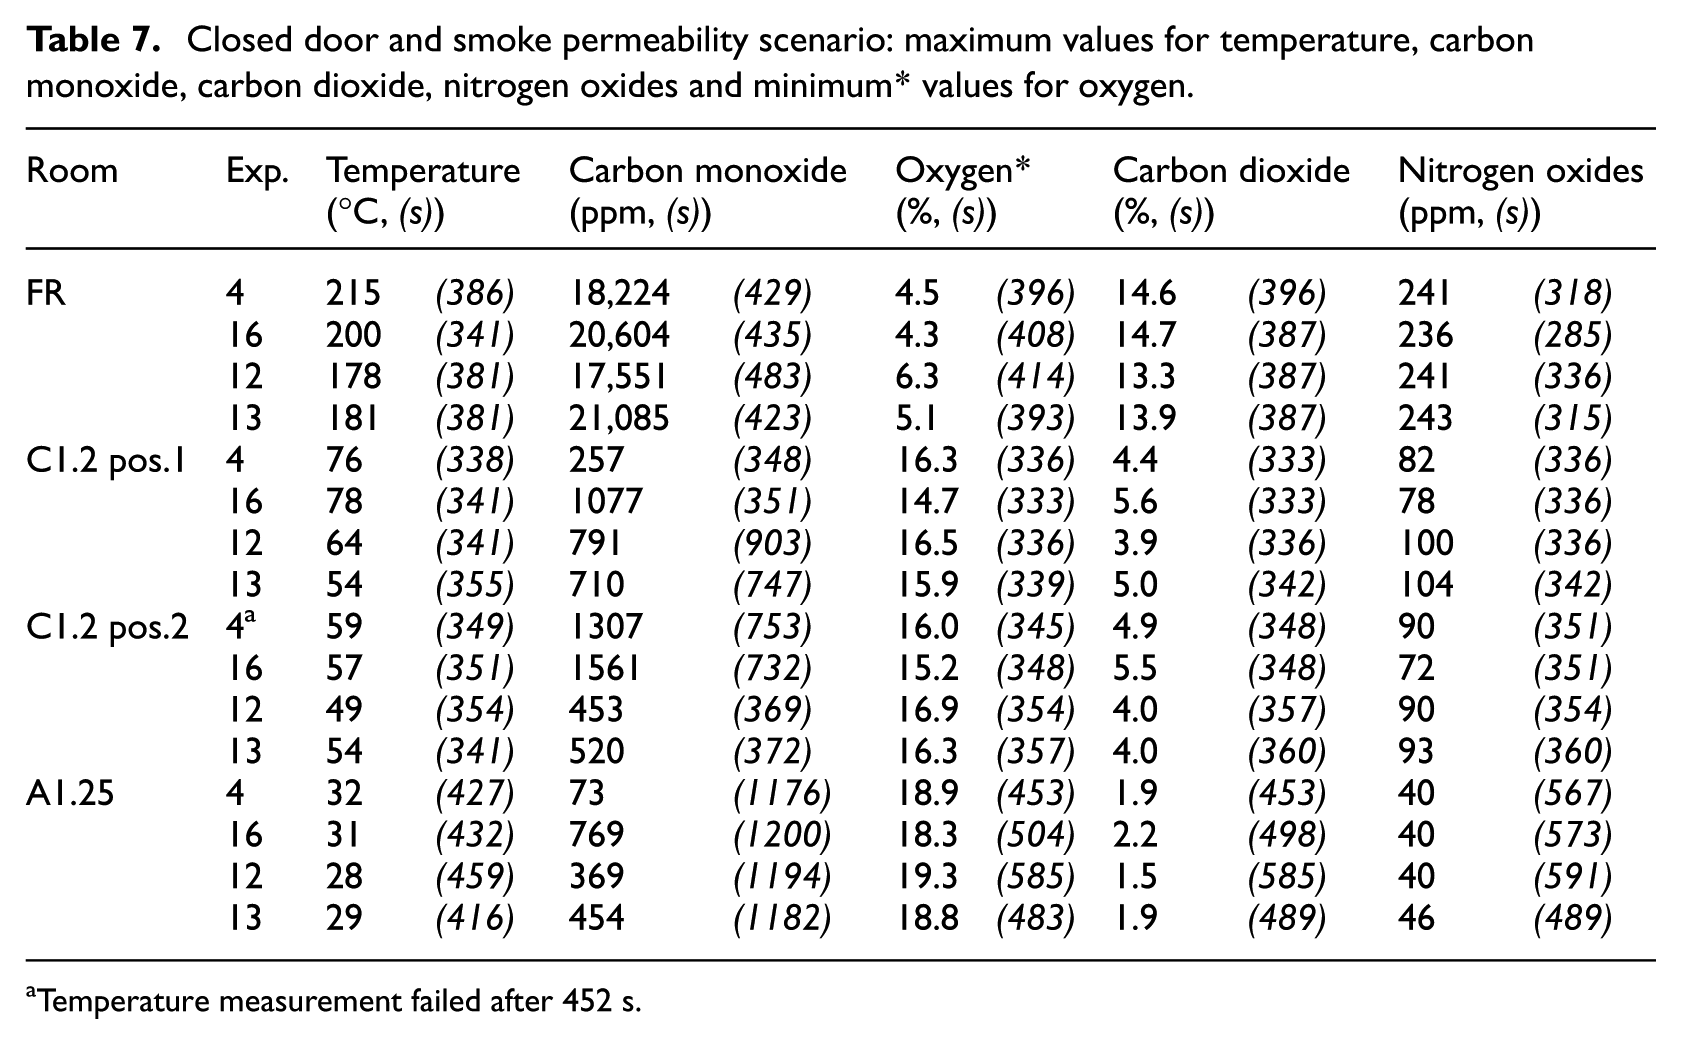
Temperature measurement failed after 452 s.
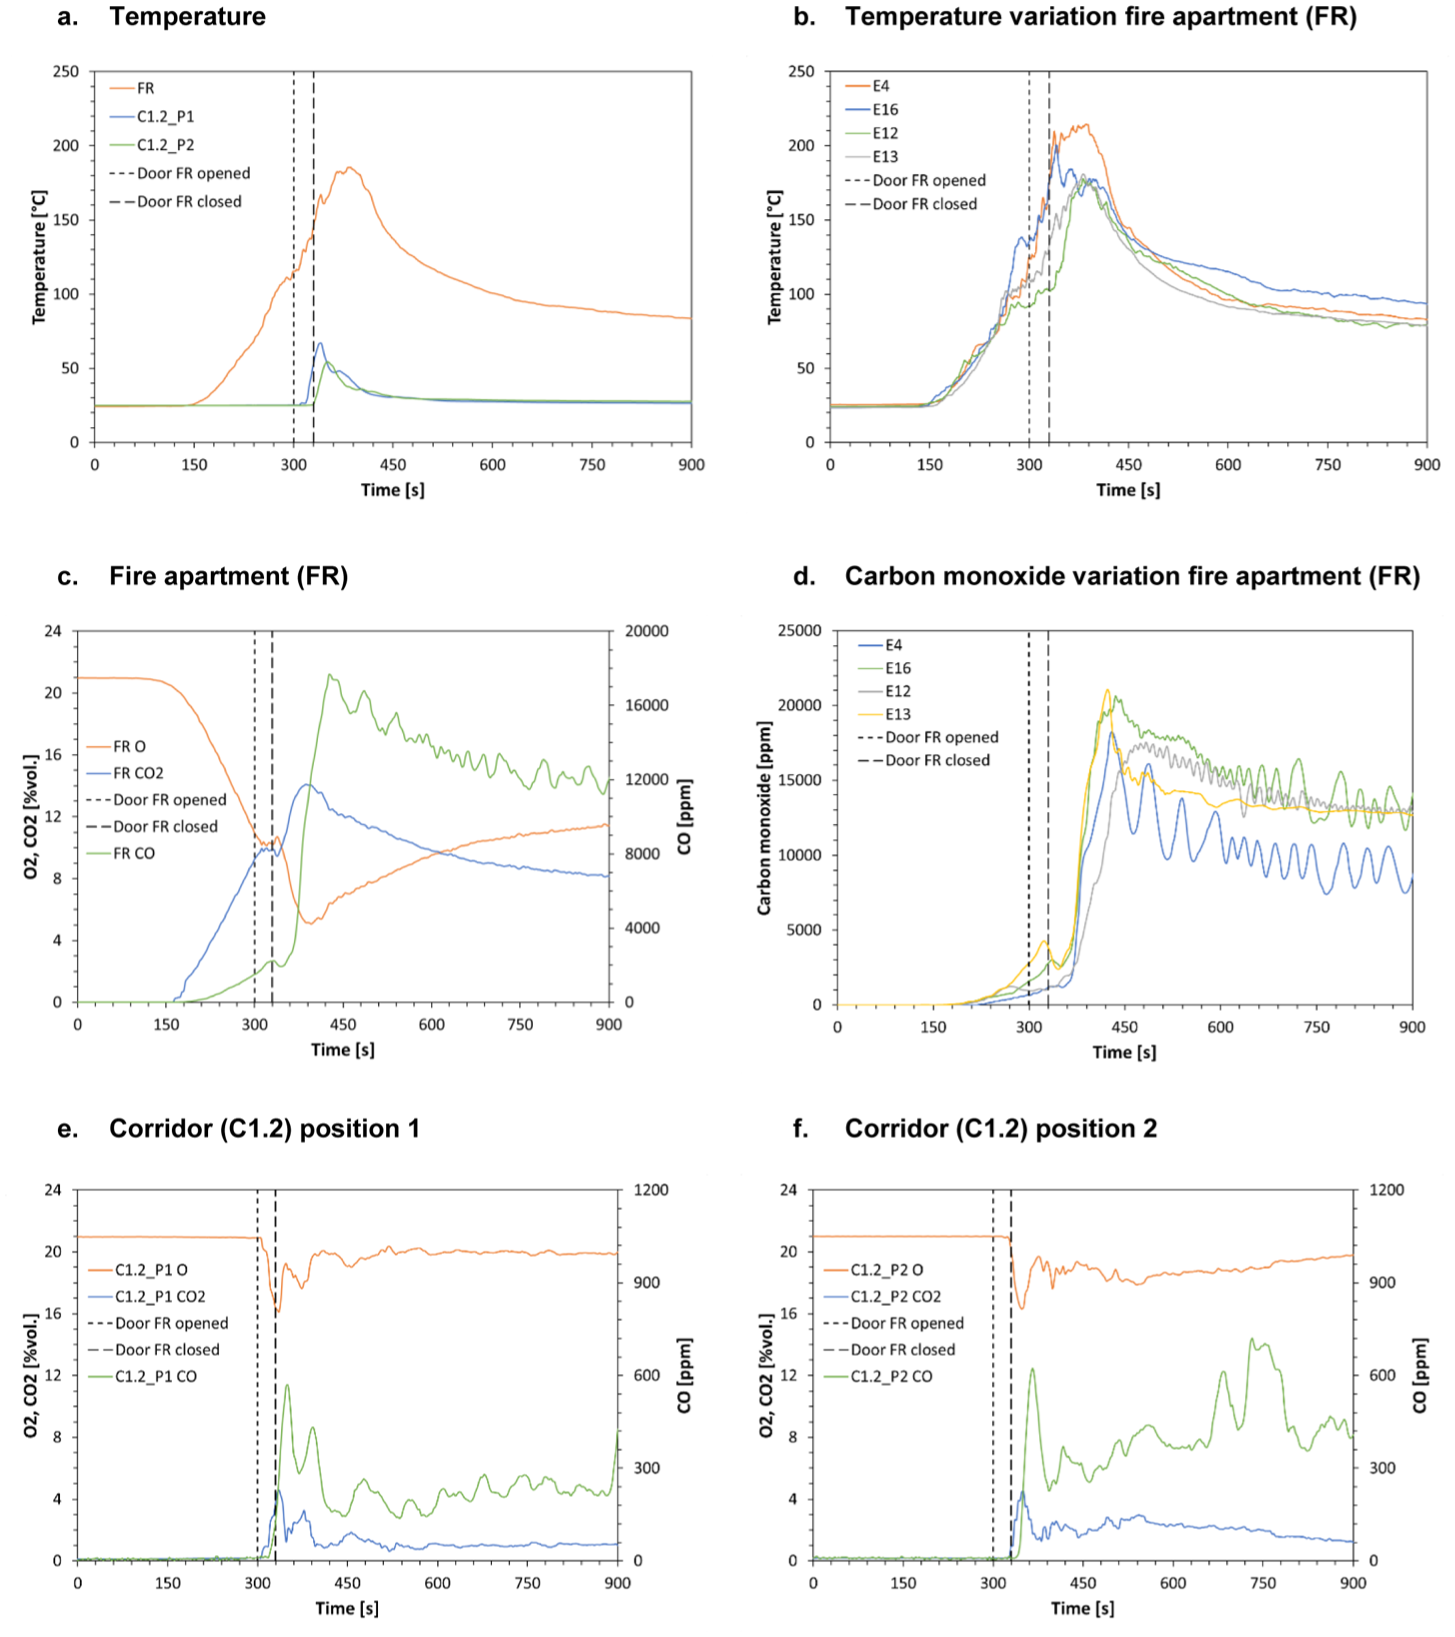
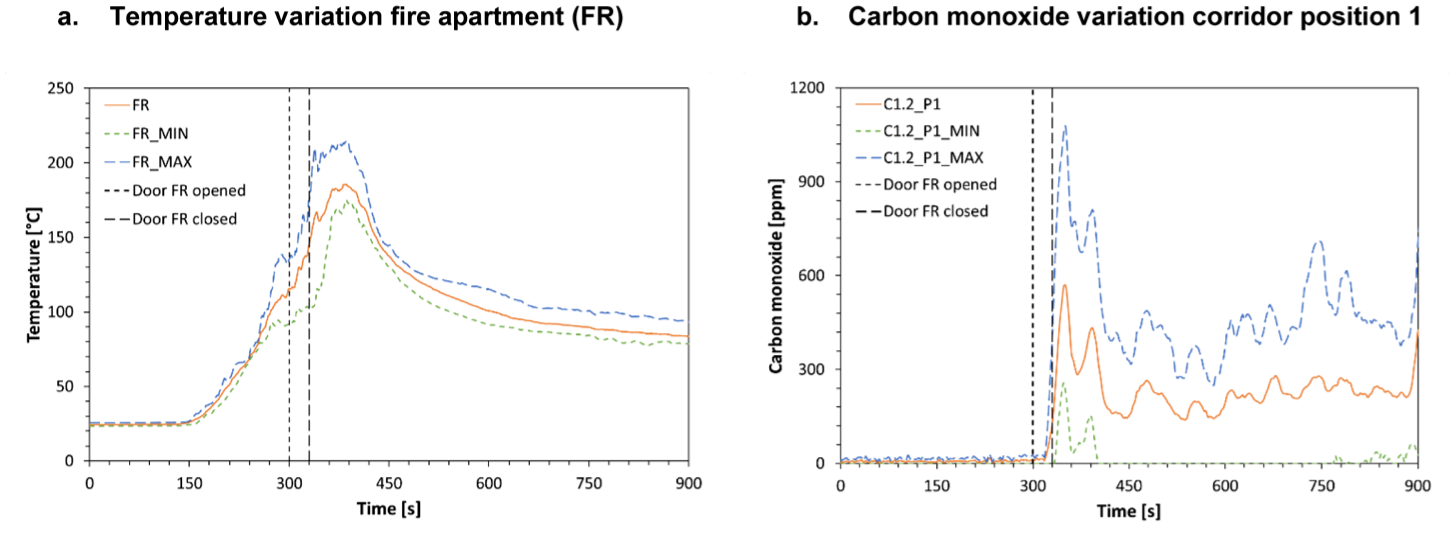
Closed door and smoke permeability scenario: (a) average time temperature series in the fire apartment and corridor, and time series of four experiments (E4, E16, E12 and E13) in the fire apartment, (b) temperatures, (d) carbon monoxide concentrations, and average time series of gas concentrations in (c) fire apartment, (e) corridor position 1 and (f). corridor position 2.
Effect on fire and conditions
Observations reveal that the position of the door significantly influences fire development in the fire apartment and conditions in the corridor. When the door is closed during a fire, the maximum temperatures measured (as presented in Table 7 and Figure 10(a) and (b)) are approximately 80°C to 99°C lower than in the baseline scenario and are reached earlier, within 80 to 110 s. Similar trends are observed in gas concentrations: carbon dioxide levels are generally lower, and oxygen levels are higher and reached earlier. However, concentrations of carbon monoxide and nitrogen oxides show no notable differences from the baseline scenario, with peak values occurring within the same range and timeframe (Table 7 and Figure 10(c) and (d)).
In contrast, briefly opening the front door during a fire has a significant impact on the conditions in the corridor. This action limits smoke propagation, resulting in significantly less contamination compared with the baseline scenario. Corridor temperatures are reduced by about 67 to 82°C and peak earlier, between 117 and 185 s (Tables 5 and 7). The temperature profile in this scenario differs from the baseline, with a rapid rise followed by a swift decline (Figure 10(a)). Carbon monoxide concentrations are substantially lower, on average, 15 to 26 times less than baseline values, though the data show greater variability across similar experiments. Oxygen concentrations initially drop to between 14.7% and 16.9% by volume and then increase again, with values showing more scatter (Figure 10(e) and (f)).
Effect of smoke resistance
There are no significant differences between the closed-door scenario (E4 and E16) and the smoke resistance scenario (E12 and E13), except for differences in detail. All the measured quantity levels are similar between both scenarios, as shown in Table 7. This also holds for the first 5 min, as depicted in Figure 10. After 5 min, opening the front door of the apartment determines the smoke propagation to the corridor.
Scenario: balcony door open
This alternative scenario, referred to as experiments 18 and 19, is similar to the baseline scenario with one key difference – the balcony door in the enclosure is kept open throughout the entire scenario. The fire development and the change of conditions in the fire apartment, corridor 1.2 and apartment A1.25 for experiment 18 are illustrated in Figure 11.
Balcony door open scenario: outline of fire development and conditions in time in the fire apartment for experiment 18.
As shown in Figure 11, the images are different compared with the baseline scenario (Figure 4). With the balcony door open, the fire’s development is less influenced by the smoke layer in the fire apartment. Smoke can escape through the balcony door, allowing fresh air to enter the fire apartment through the same opening. After 5 min, a smoke layer begins to form in the upper portion of the fire apartment. When the front door is opened at this time, smoke propagates into the corridor and apartment 1.25. By 7 min, apartment 1.25 is filled with smoke, and by 10 min, the corridor is also entirely filled. Moreover, due to the open balcony door, the fire development is more intense compared with the baseline scenario. The fire growth is less impacted by ventilation and continues to grow; after 10 min, a significant portion of the sofa has burned.
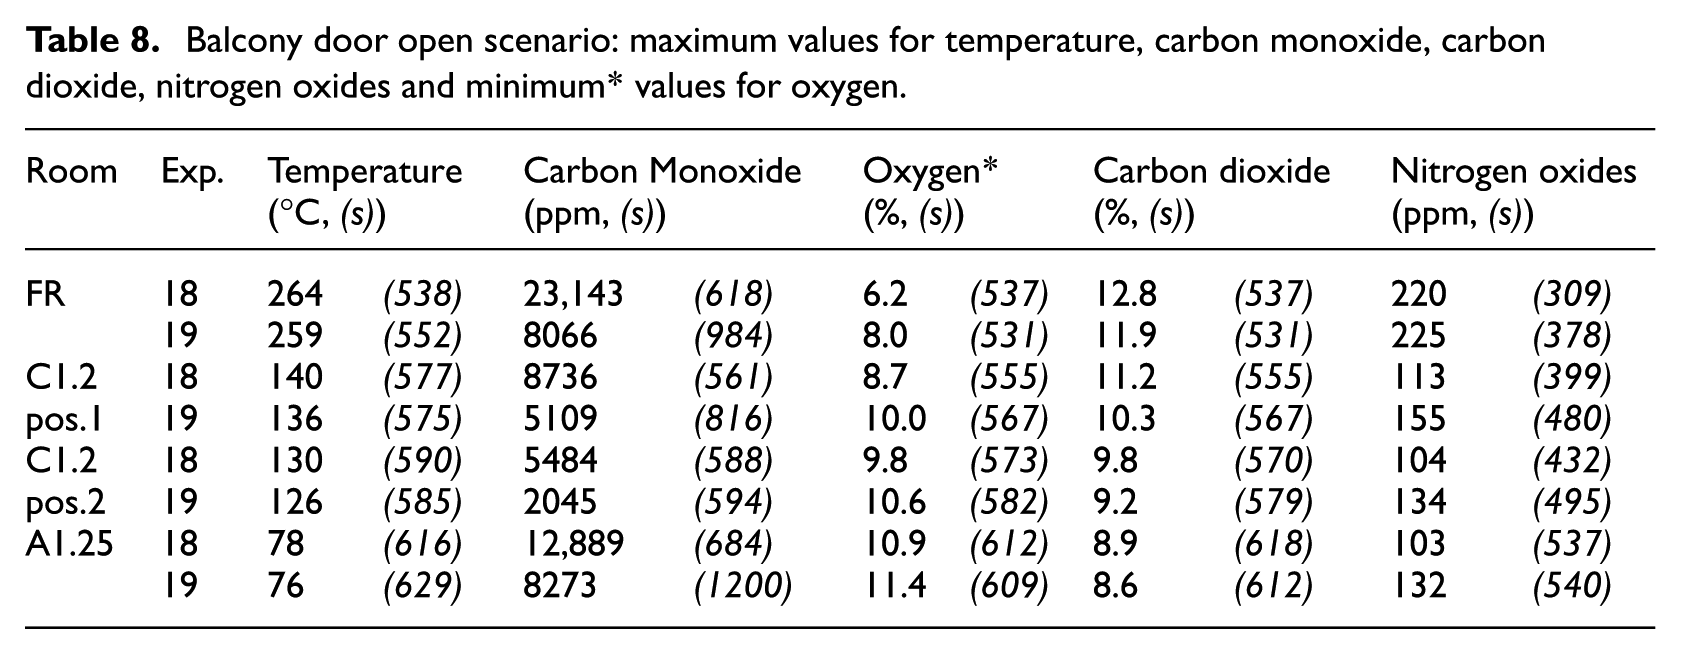
Table 8 presents a summary of the maximum measured values for temperature, carbon monoxide, carbon dioxide and nitrogen oxides, as well as the minimum recorded value for oxygen. In addition to Table 8, a selection of measured values during the first 15 min is also presented in Figure 12.
Balcony door open scenario: maximum values for temperature, carbon monoxide, carbon dioxide, nitrogen oxides and minimum* values for oxygen.
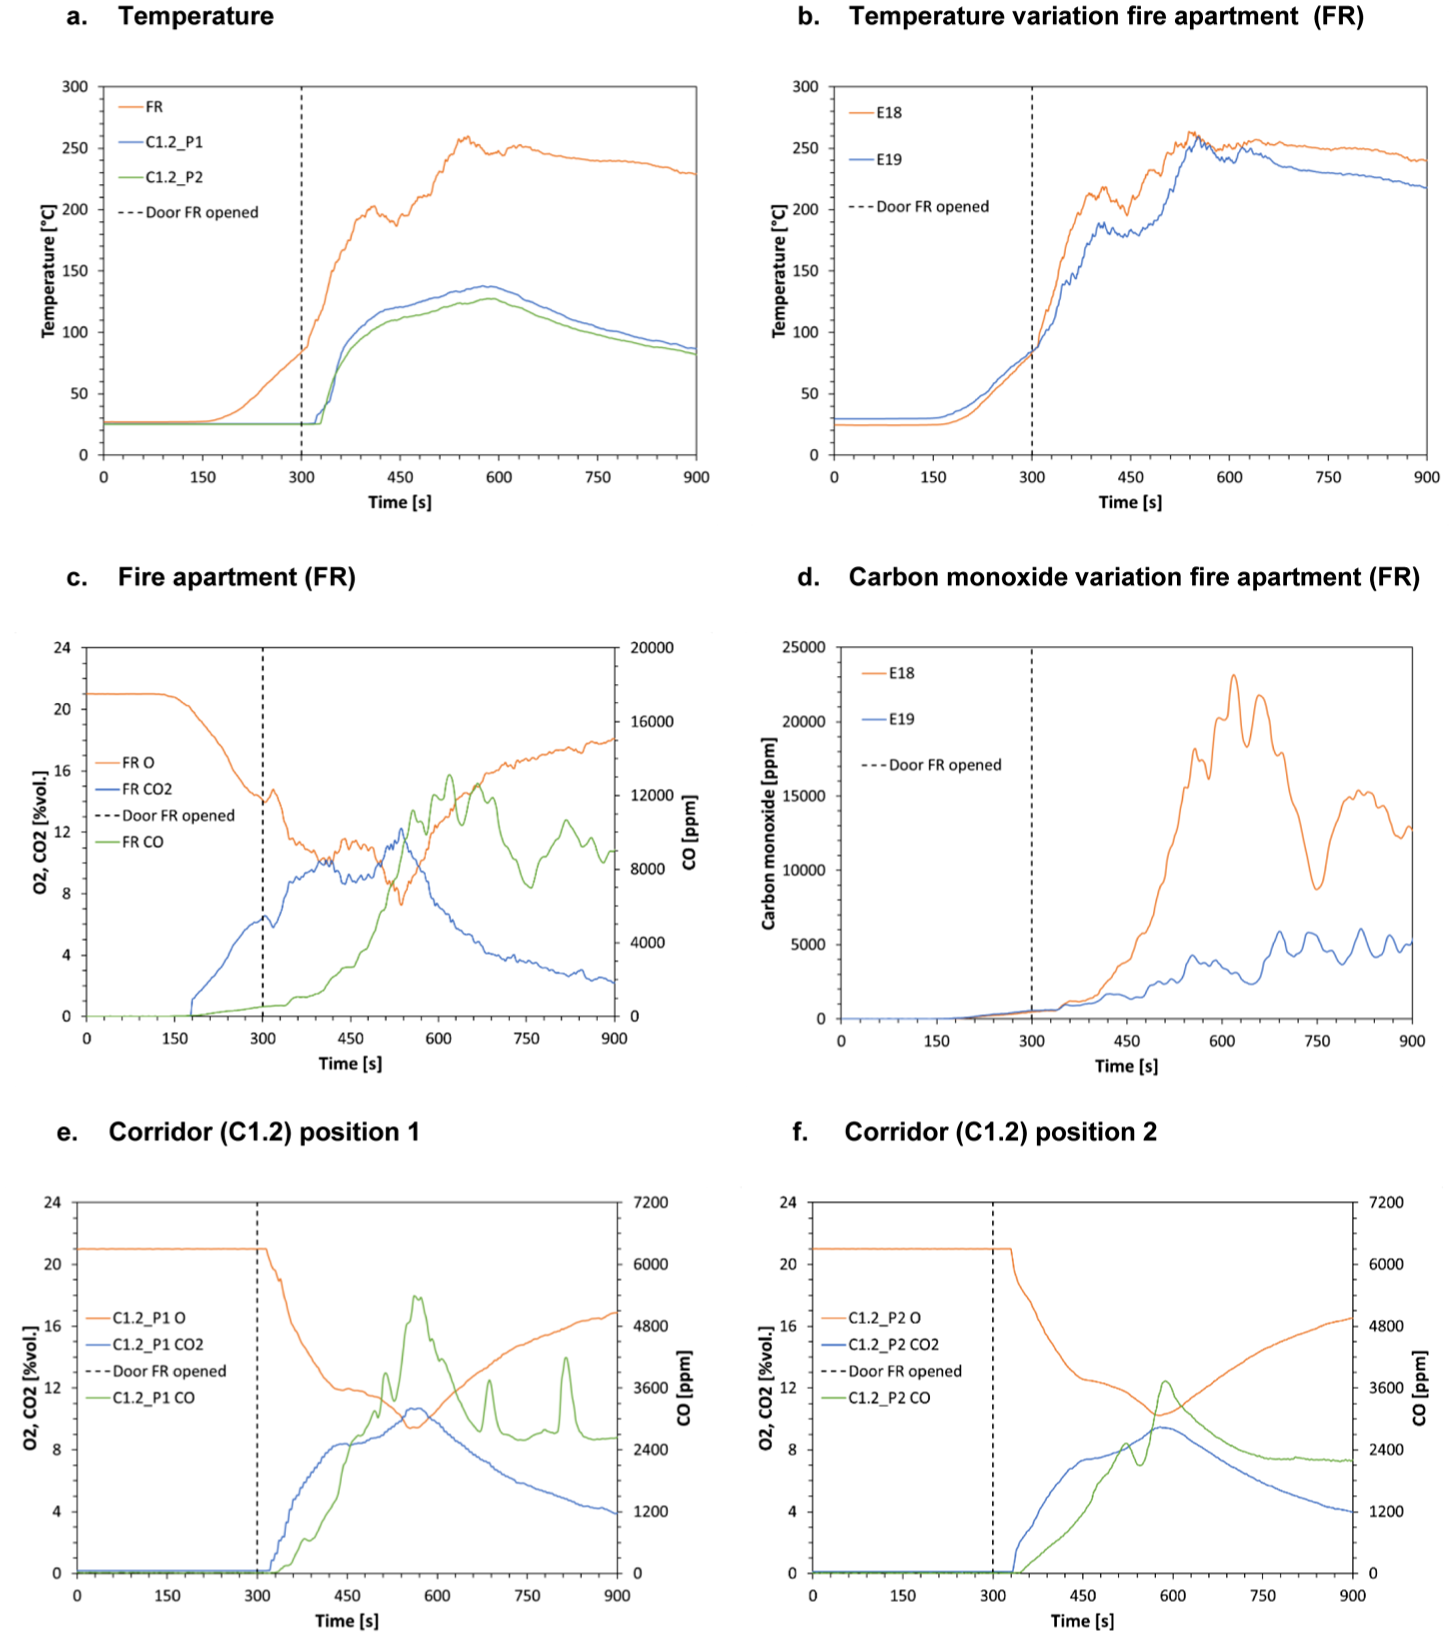
Balcony door open scenario: (a) average time-temperature series in the fire apartment and corridor, and time series of two experiments (E18 and E19) in the fire apartment, (b) temperatures, (d) carbon monoxide concentrations, and average time series of gas concentrations in (c) fire apartment, (e) corridor position 1 and (f) corridor position 2.
Observations are made on the effect of the open balcony door in the enclosure. Results show that with the balcony door open, maximum temperatures were on average 38°C lower than baseline values (Table 5), reached later (56–111 s) and decreased more gradually (Figure 12(a) and (b)). Carbon dioxide and nitrogen oxide concentrations were generally lower, while oxygen levels were higher and reached later (Figure 12(c), (e) and (f))). However, carbon monoxide levels varied significantly between experiments 18 and 19, likely due to sensor placement or inconsistent ventilation, rather than equipment malfunction (Figure 12(d)).
In the corridor, the balcony door has minimal effect on temperature: slightly lower at one point (by 9°C) and slightly higher at another (by 6°C), with peaks reached later (50–120 s) compared with the baseline scenario (Figure 12(a) and (b). Carbon monoxide concentrations are 2.6–3.7 times lower and also reached later (Table 8). Similar trends are observed for carbon dioxide, oxygen and nitrogen oxides as in the fire apartment. The maximum concentrations for carbon dioxide and nitrogen oxides are generally lower, while the minimum concentrations for oxygen are higher and reached later than the baseline concentrations (Figure 12(c), (e) and (f))).
Discussion
Uncertainties related to large-scale fire experiments can be divided into several subcategories. The uncertainties associated with the experimental design (systematic errors) include possible errors in the equipment used for the experiments. Other uncertainties (e.g. random errors) are linked to the variations between tests conducted with the same setup. Factors such as weather and ventilation conditions can have a significant impact on fire growth and smoke propagation in real fires, which can lead to variations in the results of experiments. Random errors can be demonstrated with the repeatability and reproducibility of the experiments and are related to reliability. In large-scale fire experiments, it is impossible to control all the factors, which means that there will always be variations between different tests conducted with the same setup. Therefore, it is essential to report on the uncertainties of the experiments in a real-scale building to use the data with confidence. Another element discussed here is the validity by using triangulation by comparing different data sources obtained from different measuring techniques and researchers.
Experimental design
The accuracy of the measuring equipment outlined in Table 3 indicates the potential deviation of the measured values from the actual values. Although the equipment’s accuracy may suggest small uncertainties, systematic errors resulting from decisions made during the experimental design can significantly affect the overall uncertainty. Therefore, it is important to consider these systematic errors when evaluating the results.
Protective hoods
Thermocouples in the fire apartment were equipped with custom-made hoods insulated with mineral wool, as shown in Figure 13. This decision aimed to prevent the influence of direct radiation from the fire source and the impact of water applied by firefighters during later stages of the experiments (after 20 min). These protective hoods are custom-made, and no relevant parameters are known. While smoke can flow through the hoods past the thermocouples, the equipment placement and the use of hoods in the fire apartment can influence the measured temperature values. The smoke flow in the kitchen of the fire apartment is turbulent. If the hood's opening direction is not aligned with the smoke flow, it can cause a delay in the measured temperature. At a later stage in the scenario, radiation from the heated hoods could potentially affect the temperature measurements.
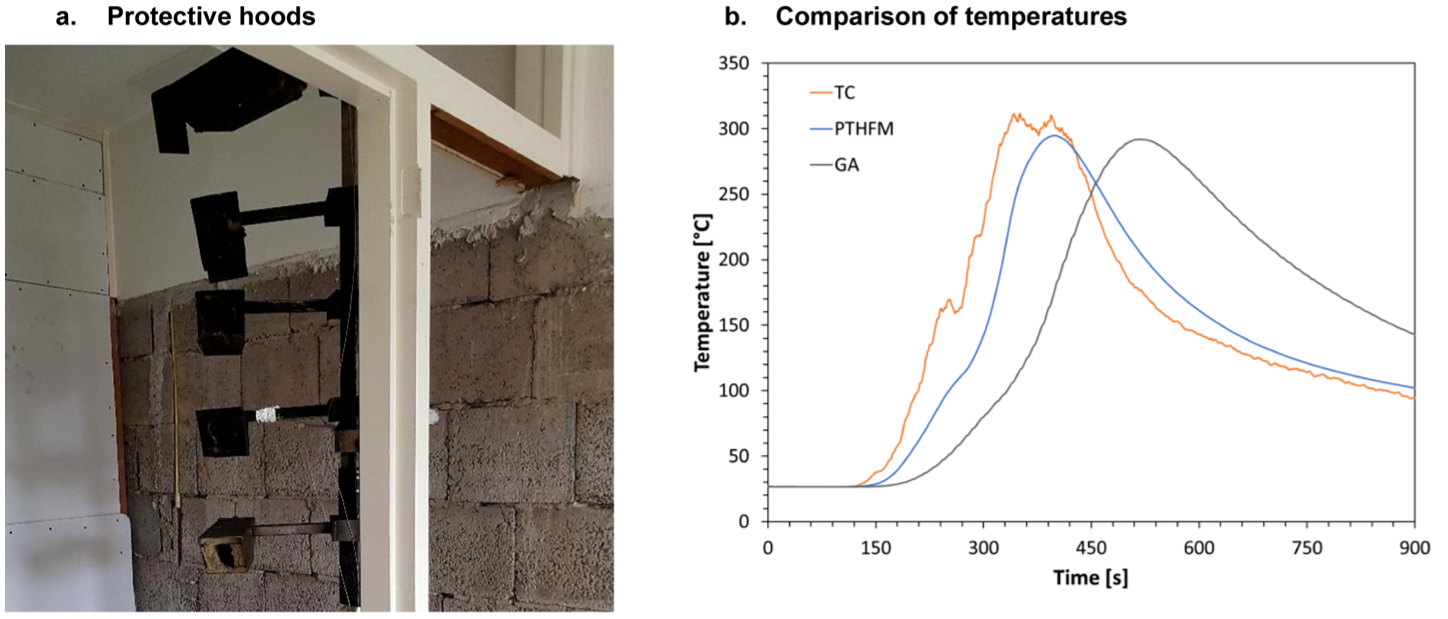
Protective hoods and comparison between temperatures measured with the thermocouple, plate thermometer and gas analyser for experiment 1 at 1.5 m.
At the same location as the thermocouple at 1.5 m, a plate thermometer (PTHFM) and a gas analyser (GA) are present, which are not protected with hoods. The plate thermometer has a horizontal orientation facing towards the ceiling. While these thermometers are sensitive and designed to measure thermal radiation, direct radiation from the fire is not expected to influence the measurements due to the position (1.5 m) and horizontal orientation. The gas analyser measures the temperature with a thermocouple inside the probe, measuring the gas inflow temperature. Therefore, the raw temperature output of the plate thermometer and gas analyser can be compared with the measured temperature from the thermocouples with the protective hoods. Although both the plate thermometer (PTHFM) and gas analyser would be expected to have a delay, the measured temperature is directly related to the temperature of the smoke. Figure 13 compares the temperature measured by the thermocouple, the plate thermometer and the gas analyser at 1.5 m for experiment 1 (baseline scenario) in the fire apartment.
Figure 13 clearly shows that the temperatures measured by the thermocouple, plate thermometer and gas analyser are consistent. The plate thermometer responds more slowly than the thermocouple. Furthermore, the highest temperature recorded by the plate thermometer is approximately 16°C lower than that recorded by the thermocouple. The gas analyser has an even slower response compared with the plate thermometer, with its highest temperature being about 20°C lower than that of the thermocouple. These results confirm that the measuring instruments are correctly placed within the smoke layer. However, due to the location and configuration (shielded setup), temperatures can be underestimated during the early stages and overestimated during later stages.
Measurement position
The focus of this research is to measure how smoke propagates to escape routes, particularly in the corridor shown in Figure 1. When planning the experiments, certain positions for measurements were selected strategically. As a result, two measurement positions are in the corridor and one position in other areas, including the fire apartment. It is important to mention that the measurements at each position reflect the specific values at that position at a certain time and are influenced by local effects. These measured values should not be considered as the average values for the entire room without further analysis. If there is a steady flow of smoke in one direction past the measuring instruments, the sensitivity to local influences is lower compared with situations without a constant flow and with changing eddies. In the context of the experiments, this means that the chosen position in the fire apartment (impacted by local eddies) and the position in other rooms, such as apartment 1.25 (experiencing changing eddies and not a constant flow), are particularly sensitive to local effects.
Open-door to apartment 1.25
Throughout the experiments, the door to apartment 1.25 (A1.25) is intentionally left open to allow for measuring the smoke’s propagation from the fire apartment to the corridor and into an apartment with an open door. This strategic decision enabled us to understand the impact of open and closed doors on potential escape routes. However, it is essential to acknowledge the potential effect on the representation of smoke propagation to the corridor due to the expanded volume area over which the smoke could propagate with the open door to apartment 1.25. It is crucial to note that the measured values over time may skew towards underestimation, particularly if the conditions become more homogeneous. Notably, the results suggest the potential for gas concentrations to accumulate in apartment 1.25, given its role as a deadlock space to which the smoke gravitates without recirculating, see `Oxygen, carbon and nitrogen concentrations' section.
Reliability
The concept of reliability refers here to the extent to which a measurement can be repeated and still produce consistent results. It encompasses two main types: repeatability and reproducibility. Repeatability measures the variation in results obtained under the same conditions, while reproducibility assesses the agreement of results under changed measurement conditions. In experiments in a real-scale building, it is difficult to distinguish between repeatability and reproducibility. However, this analysis is primarily focused on repeatability, as the conditions were intentionally kept consistent across repeated tests. To ensure repeatability, factors such as the same measurement procedure, calibration of instruments and location are controlled (see `Experiments' section). However, varying conditions such as weather conditions can affect repeatability and reproducibility, which is inherent in large-scale experiments in existing buildings (see Table 13, Appendix). The reliability of the experiments is discussed by general observation, possible explanations and functional analysis.
Functional analysis is a technique used to compare different curves quantitatively in terms of their repeatability and reproducibility. Peacock et al. 44 introduced several measures that can quantify the agreement between different data sets, which can be used as an indication of repeatability and reproducibility. This technique involves treating time series curves as vectors, which allows for the quantification of length, angle and distance between two different curves. This technique has been used to evaluate fire models45,46 but can also be used for experiments. Johansson et al. 11 applied this approach to compare the time-temperature curves of single experiments with the average time-temperature curve.
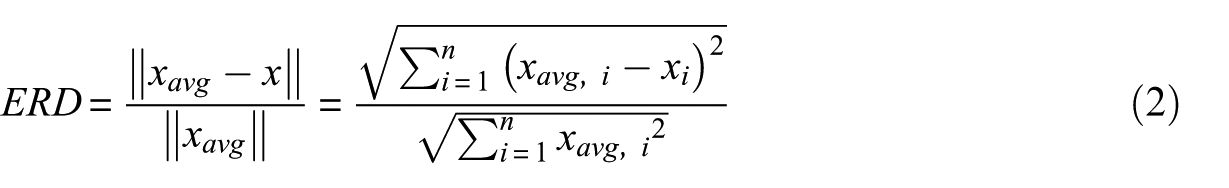
Three measures can be distinguished in functional analysis: the Euclidean relative distance (ERD), the Euclidean projection coefficient (EPC) and the Secant Cosine (SC). The ERD is a measure used to determine the mean difference between two curves, the individual test (x) and the average curve (xavg). ERD helps in quantifying the level of agreement between the two curves. A smaller value of ERD indicates a better agreement between the curves. A value of 0 indicates that the curves are identical, while a value of 0.2 indicates that the average difference between the curves is 20%. The ERD is described in equation (2).
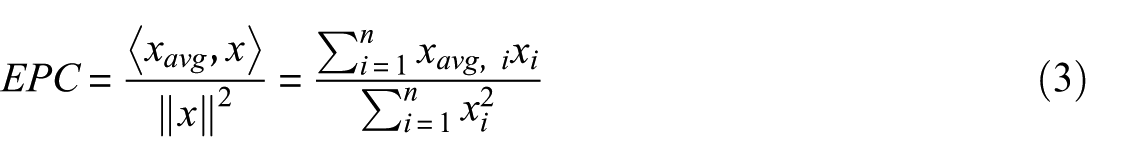
The EPC is a measure of the offset between an individual curve and an average curve. It generates a value that, when multiplied by the test value, produces the best possible alignment between the two curves. An EPC value of 1.0 indicates the smallest difference between the curves. Equation (3) is utilised to compute the EPC.
A third measure is called Secant Cosine (SC) and assesses how closely the curves from each individual test follow the same trend as the average curve. The SC value ranges from 0 to 1, where a value of 1.0 indicates that the curves are identical. The SC is calculated using equation (4).
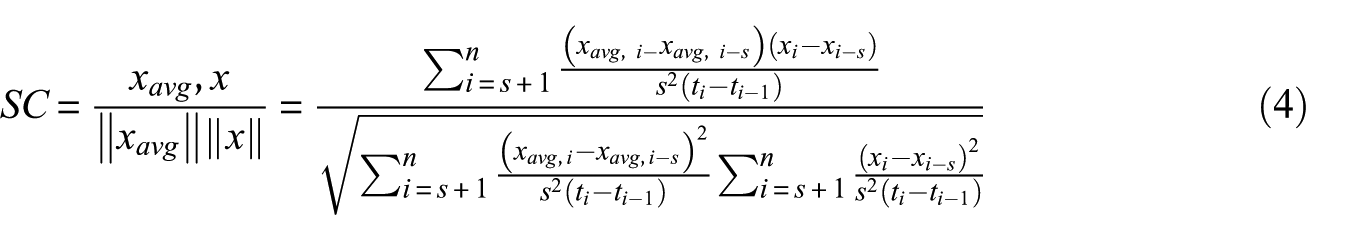
In equation (4), ‘t’ represents the time for each observation, and ‘s’ represents the noise present in the data. If ‘s’ is greater than the period of the noise, it will smoothen out the noise in the data. However, it is important not to use a value of ‘s’ that is too large, as it may result in the loss of natural variation in the data. In this paper, a value of 10 s (10 data points) for temperature curves and 15 s (5 data points) for gas concentration curves has been used for `s'
In this discussion, the ERD, EPC and SC are used to compare the time-value curves of single experiments with the average time-value curves of similar experiments. This comparison is performed for the baseline scenario and the closed door and smoke permeability scenario. The ERD and SC are represented by the mean value and standard deviation, while the EPC is represented by the mean, minimum and maximum values. The ERD, EPC and SC are determined for the first 1200 s in the fire apartment (FR) and between 300 s (when the front door is opened) and 1200 s in the corridor (C1.2).
Baseline reliability
In the baseline scenario, the overall temperature development and gas concentrations in all four experiments in the corridor and apartment 1.25 are very similar (see Figure 5(d) and Figure 14 (b), (d) and (f)). In the fire apartment, the results show more variation (see Figure 5(b) and Figure 14 (a), (c) and (e)). The observed variation in measurements in the fire apartment can be attributed to the measuring equipment (e.g. position, see ‘Experimental design’ section). The localised turbulence (eddies) in the kitchen/hallway of the apartment make the positioning of the equipment sensitive to measurement variation. It is also worth noting that the measurements are not indicative of the temperatures and gas concentrations near the fire source. However, this is not the primary objective of this study, and the measurements only represent the smoke propagation from the fire source to the corridor.
Baseline scenario: variation time series in the fire apartment: (a) temperature, (c) carbon monoxide and (e) oxygen and variation time series in the corridor at position 1: (b) temperature, (d) carbon monoxide and (f) oxygen.
Compared with the other experiments, experiment 17 (E17) showed variations in temperature development, oxygen and carbon dioxide concentrations after 8 to 10 min. An explanation for these variations can be changes in weather conditions, as experiment 17 was conducted in the second week of the experiment period and the other baseline experiment in the first week. Other unknown random errors could also have contributed.
Another observation is that the CO concentration development is similar in all four experiments, except for some peaks. Experiment 1 (E1) had unexplainable peaks between 14 and 16.5 min (Figures 5(d) and 14(d)). Experiment 3 (E3) had anomalously higher measured peaks in all rooms than the other experiments (Figure 5(d)). Nitrogen oxide concentrations are similar for the first 7 min. However, after 7 min, the concentrations start to differentiate in the corridor (see Figure 6(b)). These differences cannot be explained directly but could be related to localised near-wall flows and associated sensor positioning in the corridor.
The results from the functional analysis, presented in Table 9, confirm the general observations (Figure 14). The temperature curves in the corridor are almost identical (SC ≈ 1), the average difference between the curves is limited (ERD ≈ 10%), and the average offset (EPC) of the curves is between 9% higher or lower than the mean. A similar conclusion can be drawn for the oxygen and carbon dioxide curves with an SC ≈ 1, an ERD ≈ 7%–10% and an EPC between 4% and 9%. In the fire apartment, the temperature, oxygen and carbon dioxide curves show more variation (SC between 0.82 and 0.88), and the average difference (ERD) of the mean curve is around 1.5 times larger than the corridor.
Functional analysis of the measurements of the baseline scenario (E1, E3, E5 and E17).
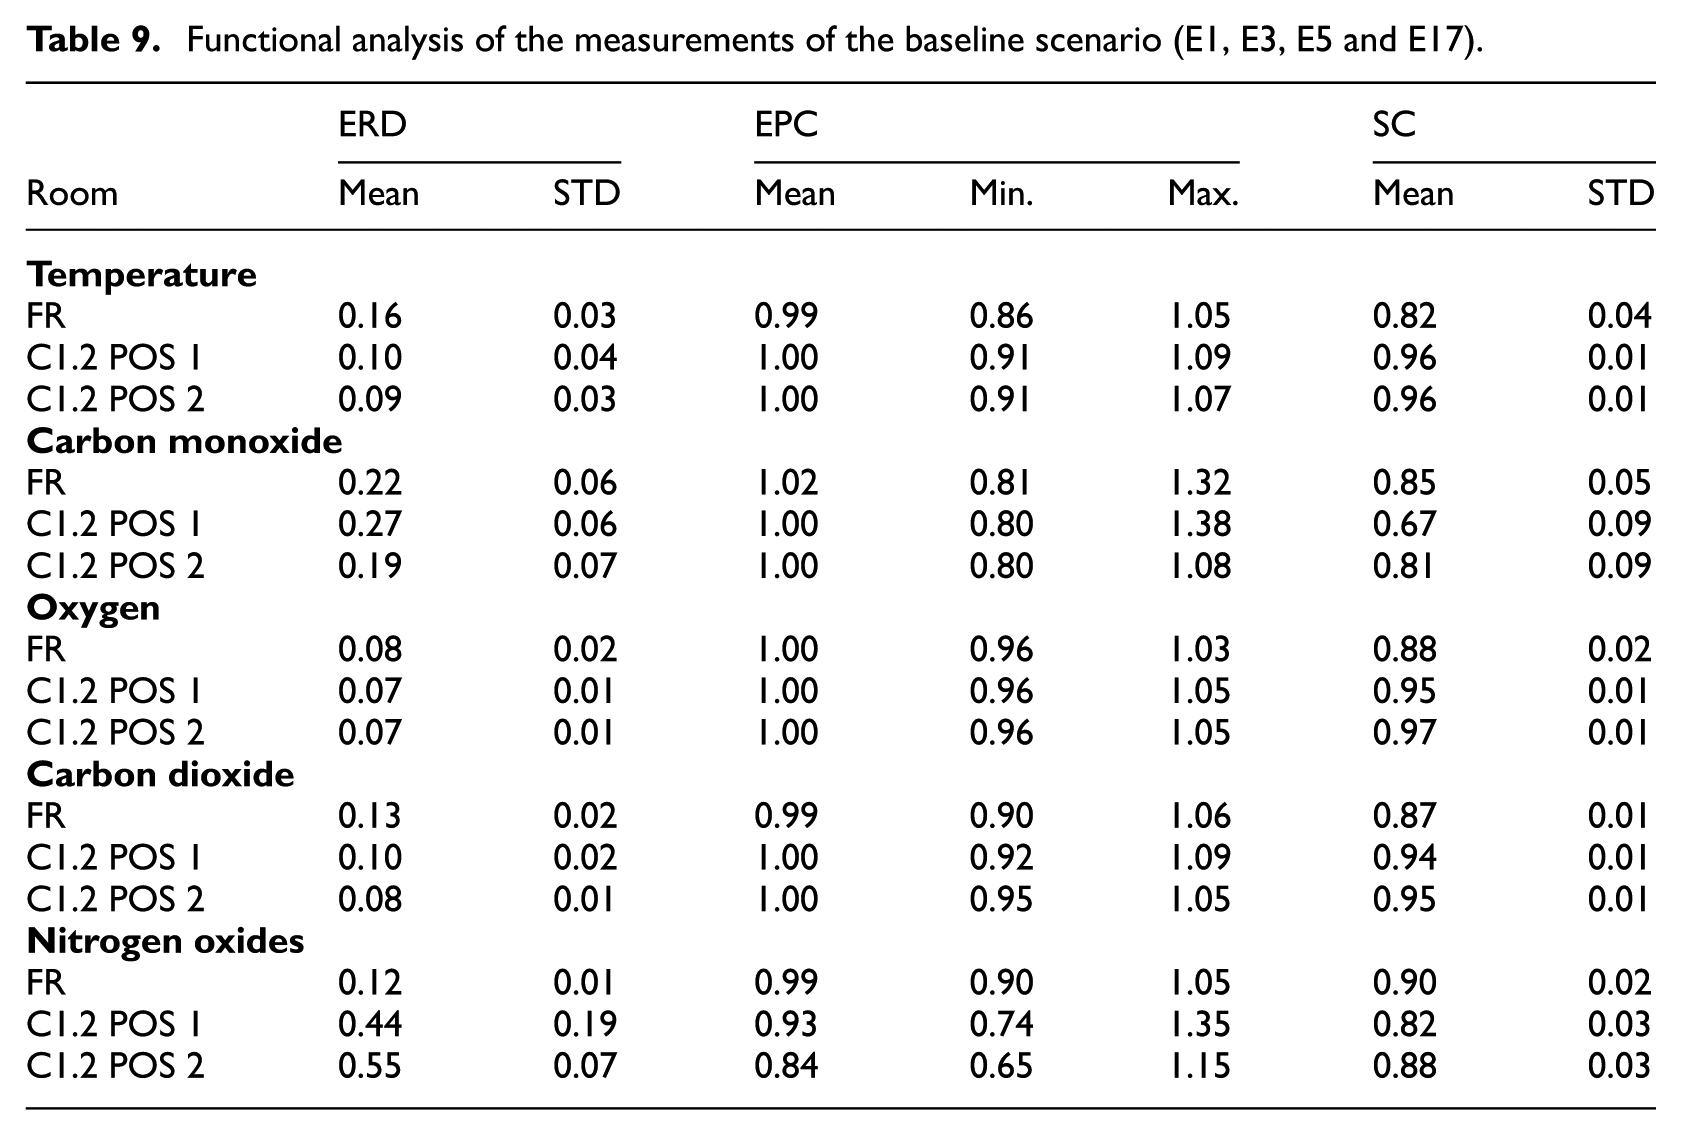
The functional analysis of the carbon monoxide and nitrogen oxides reveals a different outcome. The average trend (SC), average difference (ERD) and offset (EPC) show a better agreement for almost all curves in the fire apartment compared with the corridor. However, the curves have larger variations compared with the temperature, oxygen and carbon dioxide curves. Especially, the average trend for carbon monoxide (SC ≈ 0.7–0.8) in the corridor and the average difference for nitrogen oxides (ERD ≈ 50%) show large variations.
The results from the functional analysis show that temperature variations are relatively small and are smaller in the corridor than in the fire apartment. This is also experienced in the work of Johansson et al. 11 Surprisingly, the oxygen and carbon dioxide concentrations show small differences, given the fact that the fires were ventilation-limited. However, carbon monoxide and nitrogen oxide concentrations show more variations.
Reliability of closed door and smoke permeability scenario
In general, the overall temperature development and gas concentrations are similar in all four experiments in the fire apartment for the closed-door and smoke permeability scenarios (see Figure 10 (b) and (d) and Figure 15(a)). This also applies to the temperature curves in the corridor. The gas concentration curves in the corridor show more variation, especially the carbon monoxide and nitrogen oxide concentrations (Figure 15(b)).
Closed door and smoke permeability scenario: variation time series in fire apartment for (a) temperature and variation time series in the corridor at position 1 for (b) carbon monoxide.
The results from the functional analysis, presented in Table 10, confirm the general observations. The temperature and oxygen curves show the same trend (SC between 0.82 and 0.97), the average difference between the curves is limited (ERD between 3% and 9%), and the average offset (EPC) of the curves is between 6% and 8% higher or lower than the mean. For the other gases, the results show larger variations, mainly in the corridor. The average difference (ERD) and offset (EPC) between curves are not limited. Especially the ERD and EPC of the carbon monoxide curves in the corridor are large, for example the ERD is between 76% and 81%. This confirms the general observations of scattered results. To a lesser extent, this also applies to the carbon dioxide and nitrogen oxide curves in the corridor.
Functional analysis of the measurements of the closed doors (E4 and E16) and smoke permeability scenarios (E12 and E13).
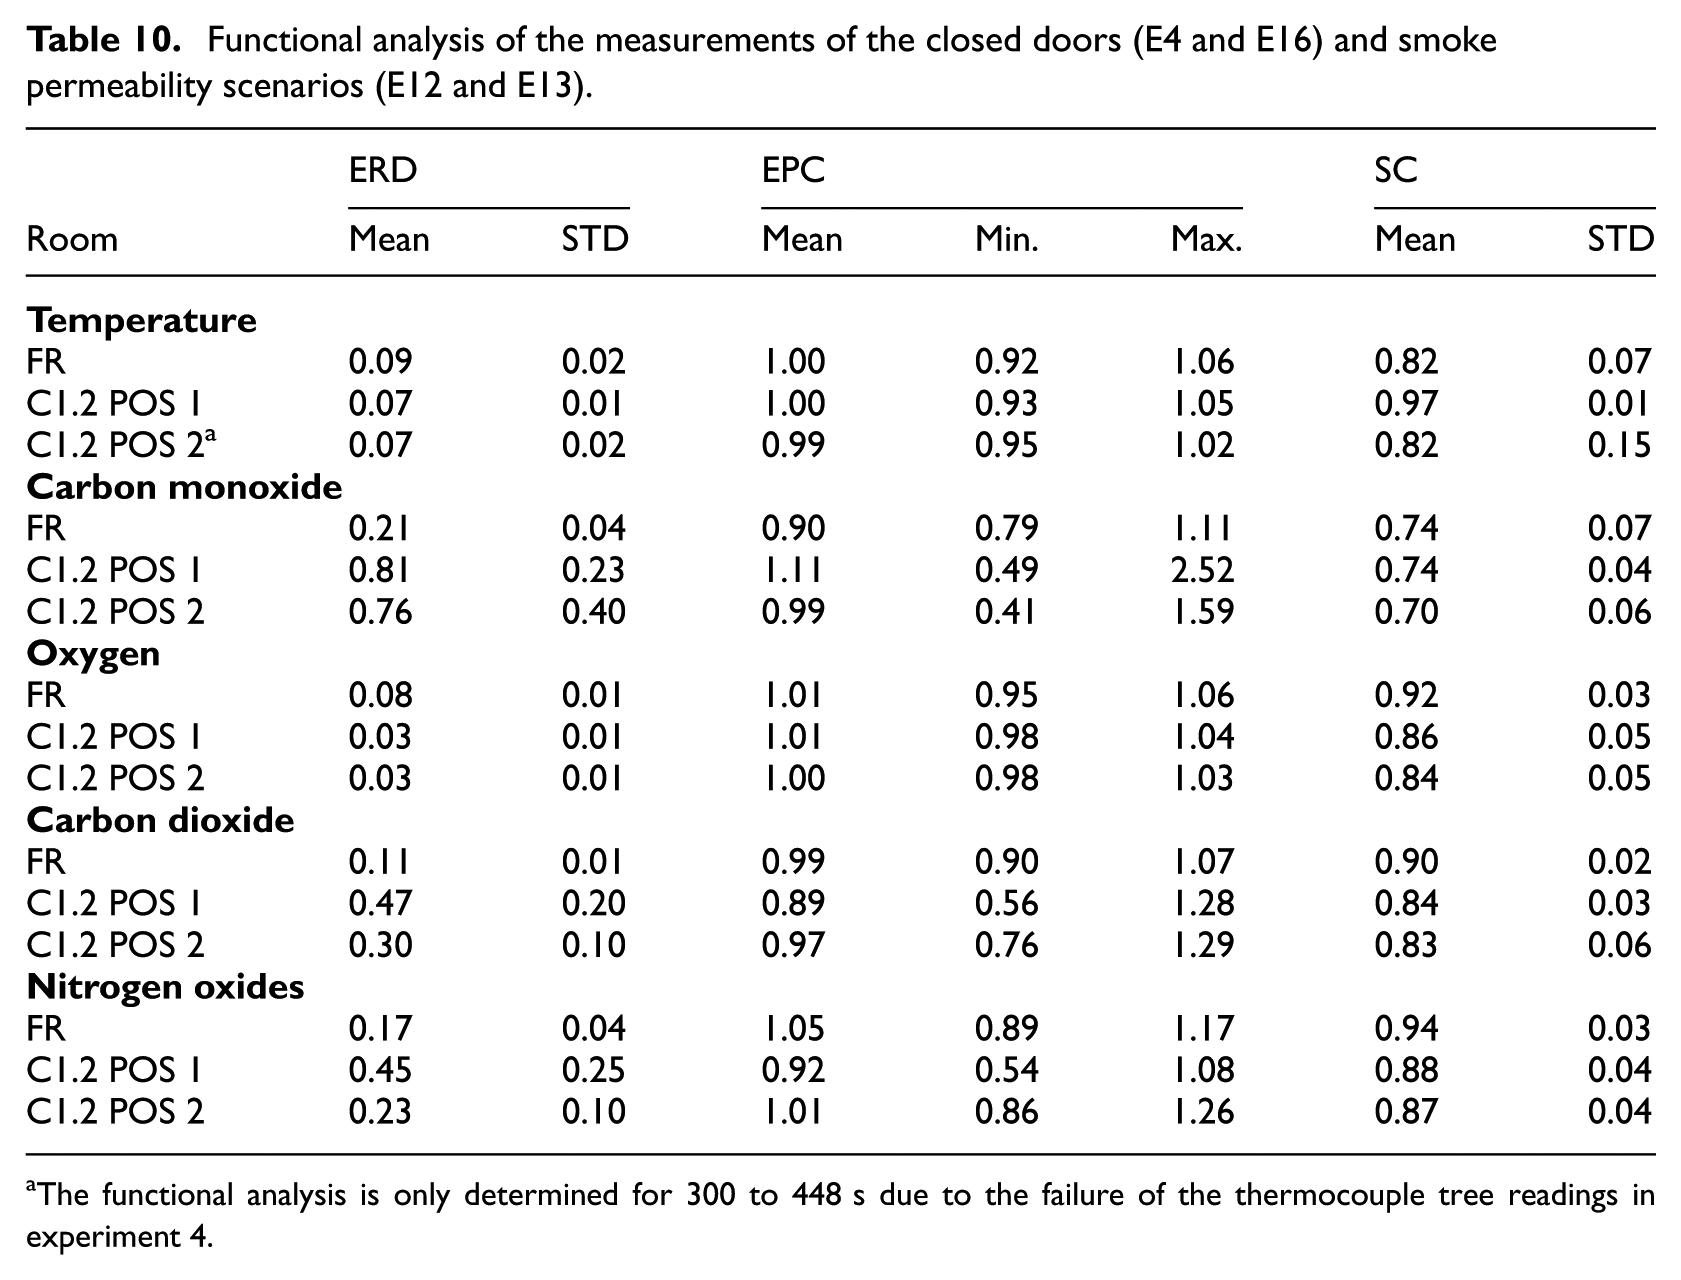
The functional analysis is only determined for 300 to 448 s due to the failure of the thermocouple tree readings in experiment 4.
Reliability of balcony door scenario
Since two experiments were conducted, only general observations can be made regarding the reliability of the open-door balcony situation. The development of temperature, carbon dioxide and oxygen concentrations shows nearly identical curves (Figure 12). In contrast, the concentrations of carbon monoxide exhibit greater variability and are notably dissimilar, as mentioned in the `Scenario: balcony door open' section.
Triangulation of carbon monoxide measurements
Reliability is expressed in the former paragraphs in terms of the distribution characteristics of the results, which describe the precision of measurements. However, reproducing or repeating measurements does not necessarily guarantee the trueness or validity of those measurements (see ‘Experimental design’ section). Triangulation of data sources is a means to strengthen the validity of the measurements. The Dutch National Institute for Public Health and the Environment (RIVM) measured during experiments 1 to 5 smoke and gas concentrations in the corridor at 1.5 m above the floor. 43 They used other instruments and techniques (FTIR) to measure different toxic gases. Figure 16 and Table 11 present a comparison of the measured carbon monoxide concentration by RIVM and NIPV.
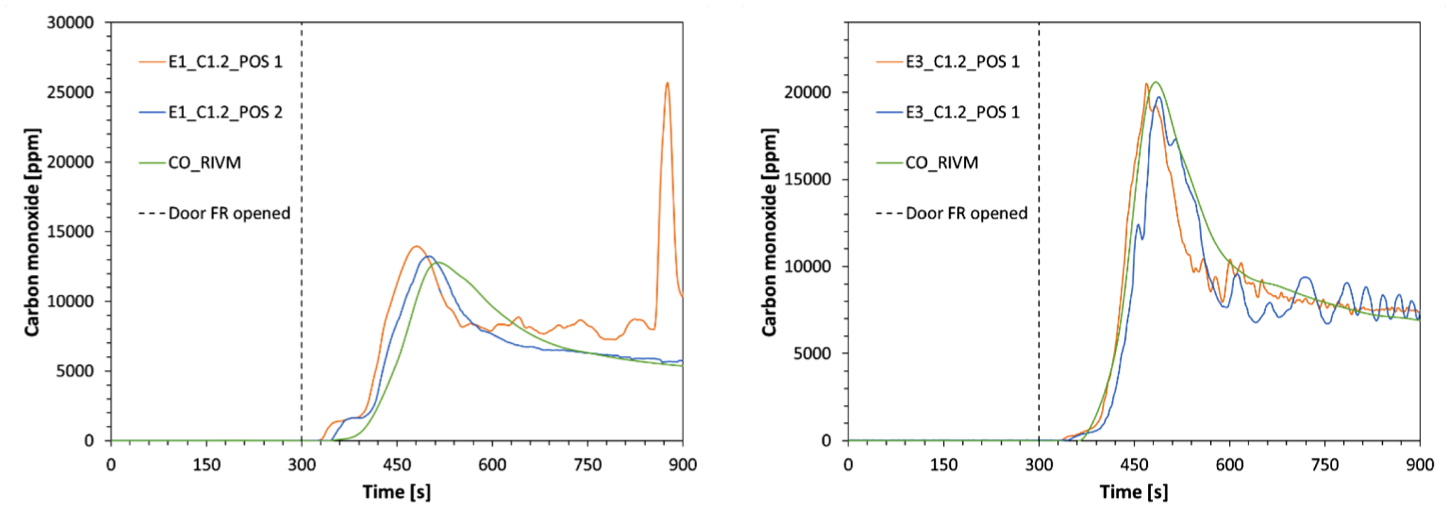
Comparison between carbon monoxide concentrations measured by RIVM and NIPV at 1.5 m in the corridor (C1.2) for experiments 1 and 3.
Comparison of carbon monoxide concentration in the corridor C1.2.
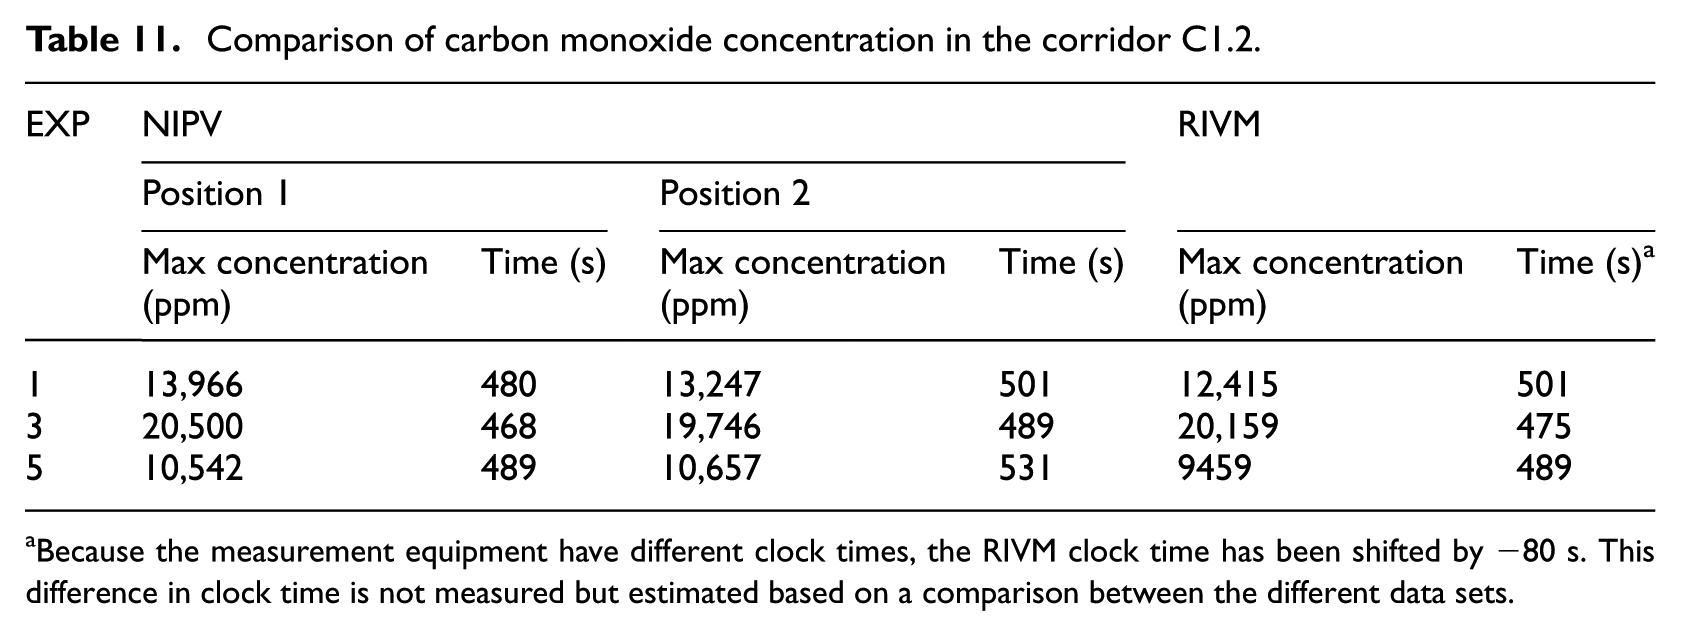
Because the measurement equipment have different clock times, the RIVM clock time has been shifted by −80 s. This difference in clock time is not measured but estimated based on a comparison between the different data sets.
Both Figure 16 and Table 11 show very similar curves and peak values, which adds to the reliability of the carbon monoxide measurements in the baseline experiments. While this conclusion cannot directly be applied to other experiments and other gases, it does indicate that it might be the case, considering that the same equipment is used to measure other gases.
Interpretations and conclusions
The summary of the results is presented in Table 12. In all the studied scenarios, smoke propagates from the fire apartment to the escape route (corridor). In the baseline scenario, the fire in the fire apartment becomes ventilated-limited in minutes. After the apartment door is opened, large amounts of smoke propagate to the corridor, leading to a temperature rise, low oxygen concentrations and high levels of carbon monoxide, hydrogen cyanide, carbon dioxide and nitrogen oxides at 1.5 m. On average, the peak values in the fire apartment show the lowest oxygen concentration and the highest measurements for other variables.
Summary of results.
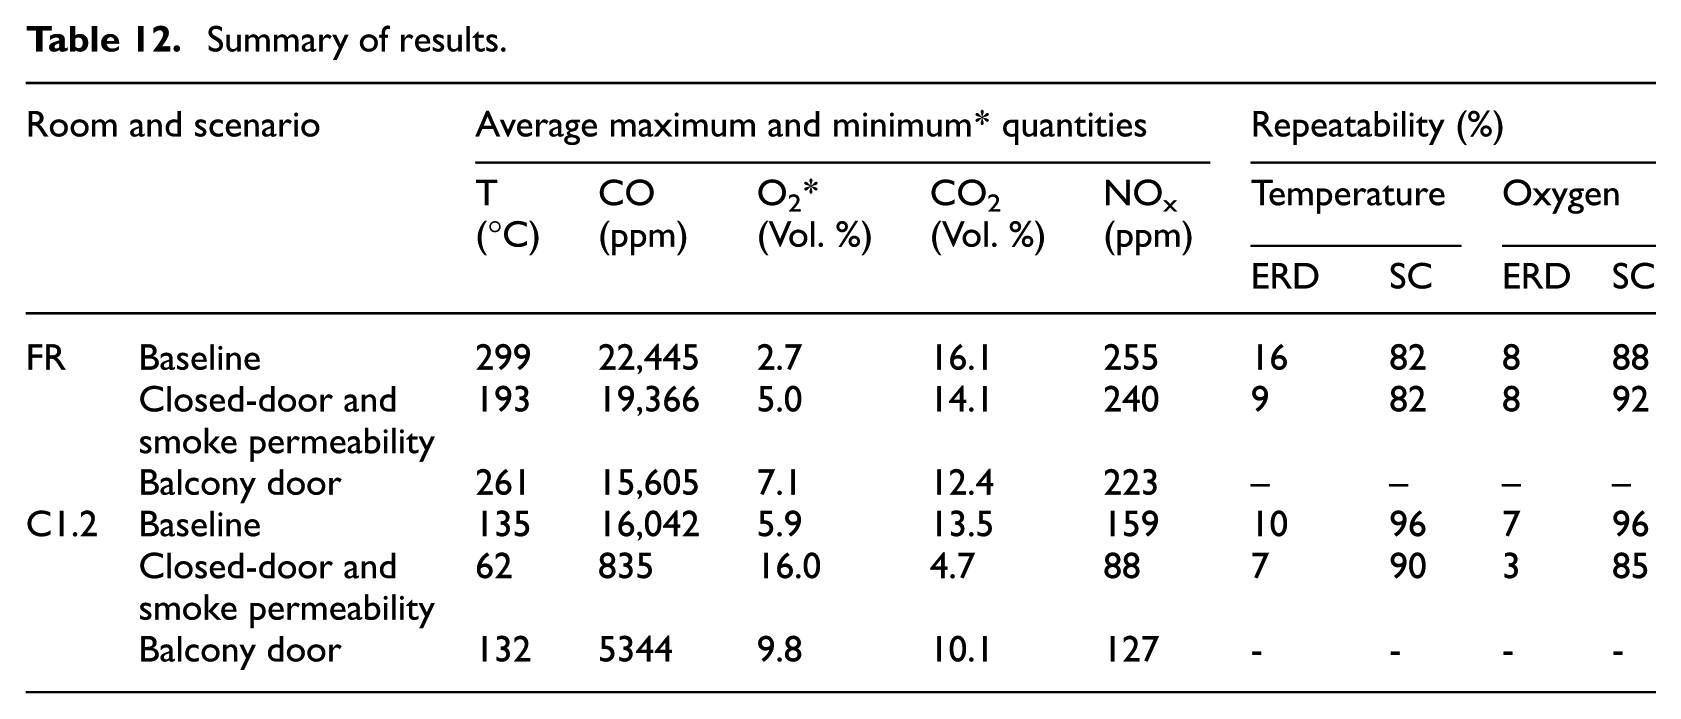
Closing the door 30 s after opening has a significant impact on the fire development and smoke propagation to the corridor. This lowers temperatures, decreases carbon monoxide, carbon dioxide and nitrogen oxide concentrations and increases oxygen concentrations. The maximum measured carbon monoxide concentration is, on average, 15–26 times lower in the corridor than in the baseline scenario. The results show no significant differences between the closed-door scenario and the smoke permeability scenario.
Opening the balcony door will influence the fire development and smoke propagation to the corridor, but it has less impact compared with the door closed. On average, minimum values are higher for oxygen concentrations and maximum values are lower for temperature and other gas concentrations compared with the baseline scenario. The maximum measured carbon monoxide concentration is, on average, 2.6–3.7 times lower in the corridor than compared with the baseline scenario.
This study addresses the objective of analysing and quantifying smoke propagation to an escape route in a residential building by conducting numerous real-scale experiments. The experiments involved extensive data collection using sensors to measure temperature, gas concentrations and optical density. The results show that different factors, such as ventilation and the opening time of the front door, have a significant impact on the outcomes. The experiments demonstrate the reliability of the experimental design in terms of reproducibility, repeatability and validity, even with variations in ventilation and weather conditions. Temperature development and oxygen concentration are found to be highly repeatable with limited variations (ERD between 3% and 16% and SC between 82% and 96%). Other gas concentrations are less consistent, which indicates that such measurements are more sensitive to conditions that are not easy to control during these types of experiments. Overall, the baseline scenario shows better repeatability than the other scenarios. This research contributes to a better understanding of smoke propagation in real-scale residential buildings and provides insights into the repeatability of ventilation-limited experiments. The results can be valuable for understanding the impact of smoke propagation on tenability.
Footnotes
Appendix 1
Execution date and weather conditions at the start of experiments.
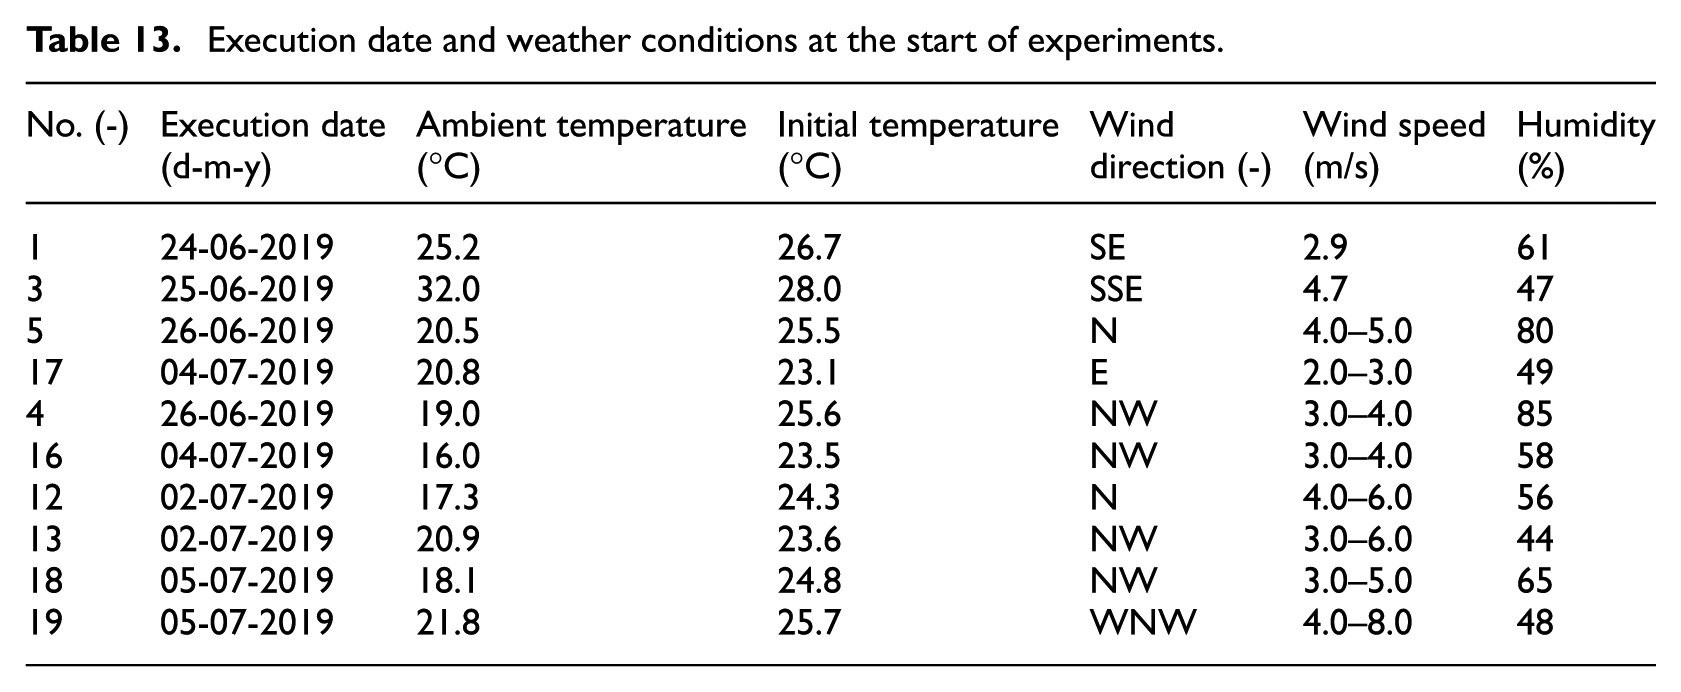
| No. (-) | Execution date (d-m-y) | Ambient temperature (°C) | Initial temperature (°C) | Wind direction (-) | Wind speed (m/s) | Humidity (%) |
|---|---|---|---|---|---|---|
| 1 | 24-06-2019 | 25.2 | 26.7 | SE | 2.9 | 61 |
| 3 | 25-06-2019 | 32.0 | 28.0 | SSE | 4.7 | 47 |
| 5 | 26-06-2019 | 20.5 | 25.5 | N | 4.0–5.0 | 80 |
| 17 | 04-07-2019 | 20.8 | 23.1 | E | 2.0–3.0 | 49 |
| 4 | 26-06-2019 | 19.0 | 25.6 | NW | 3.0–4.0 | 85 |
| 16 | 04-07-2019 | 16.0 | 23.5 | NW | 3.0–4.0 | 58 |
| 12 | 02-07-2019 | 17.3 | 24.3 | N | 4.0–6.0 | 56 |
| 13 | 02-07-2019 | 20.9 | 23.6 | NW | 3.0–6.0 | 44 |
| 18 | 05-07-2019 | 18.1 | 24.8 | NW | 3.0–5.0 | 65 |
| 19 | 05-07-2019 | 21.8 | 25.7 | WNW | 4.0–8.0 | 48 |
Funding
The authors disclosed receipt of the following financial support for the research, authorship and/or publication of this article: This work was funded by the Netherlands Institute Public Safety (NIPV).
Declaration of conflicting interests
The authors declared no potential conflicts of interest with respect to the research, authorship and/or publication of this article.