
Abstract
In 2005, a line-of-duty death of an instructor at a firefighter training facility spawned research into both firefighter training and improving firefighter protective gear. Since the incident, there has been additional research into the material properties, firefighter facepiece performance, and the classification of firefighter exposures. This has been in parallel to significant improvements in the ability to model fires and predict, rather than prescribe, fire growth. As this recent body of work was not available at the time of incident investigation, the incident was revisited using the current version of Fire Dynamics Simulator. The full day of training evolutions was modeled in Fire Dynamics Simulator using recent data on wood pyrolysis (the fuel) and facepiece reaction to heat. Fire Dynamics Simulator results were evaluated against the testing done following the incident. Facepiece research was used to develop hole formation criteria that could be evaluated from Fire Dynamics Simulator predictions of facepiece exposure. This was used to compare the performance of facepieces contemporary with the incident to today’s facepieces. In addition, exposure predictions were evaluated in the context of exposure hazard categories developed for firefighter protective gear.
Introduction
Fire Dynamics Simulator (FDS),1,2 a computational fluid dynamics model (CFD) for fire, has a long history of being used to investigate fires with significant public loss of life or line-of-duty deaths (LODDs) for the members of the fire service. This history dates back prior to the first official release of FDS.3,4 If successful, modeling can reveal conditions during the fire that are otherwise difficult or impossible to ascertain just from a post-fire examination of the scene. Modeling also has the potential to investigate “what-if” alternatives to the event.
The first published application of FDS to an LODD was during the investigation of a fire on Cherry Road in Washington, DC in 1999. 5 This analysis predicted fire growth by predicting the time to ignition for furnishings in the structure and then applying a fixed heat release rate per unit area (HRRPUA) post-ignition. The model demonstrated how changes in the ventilation lead to changes in the heat release rate (HRR) which rapidly exposed fire fighters in the flowpath of the smoke to conditions beyond the protective capability of their fire fighting gear. One of the most notable applications of FDS was in the federal investigation on the collapse of the Twin Towers at the World Trade Center on 11 September 2001. 6 Similar to the Cherry Road analysis, fire growth was predicted by the use of an ignition temperature with a prescribed burning rate. However, here the burning rate was developed from a large-scale testing of surrogate office workstations. This investigation was shortly followed by an investigation into the fire at the Station Nightclub in Rhode Island in 2003. 7 A similar approach was taken to that of the World Trade Center Investigation of prescribing burning rates based on large-scale testing. In this investigation, FDS was used to explore possible outcomes had sprinklers been present or had exit paths been clear and unblocked.
More recently, FDS was used in a UL Fire Safety Research Institute project looking at line-of-duty injuries (LODIs) and near misses (fire events where an LODI or LODD was narrowly avoided) for the fire service. This project, funded by the US Department of Homeland Security’s Assistance to Firefighters Grant Program, looked to develop insights on the proximate factors contributing to LODI and near misses with the goal of improving firefighting training and tactics and identifying potential changes to the relevant codes and standards. Two exemplar studies from this project are as follows: (1) an analysis of a fire in a garden apartment where a prescribed fire in FDS was used to assess the thermal conditions the firefighters were exposed to 8 and (2) an analysis of a fire in a single-story, single-family home where cone calorimeter test data were used to prescribe the HRR in FDS to assess the thermal environment. 9
Notable in these prior applications of FDS is the limited degree to which the FDS model accounted for the impact of thermal feedback on fire growth. This is reflective of the difficult challenges associated with fully predictive fire growth. These challenges were highlighted in detail in the 2007 Dalmarnock study 10 which was a round-robin modeling effort using a fire in a furnished living room. Multiple institutions used FDS to predict fire growth. This was done for both blind (modelers only had details on the furnishings, room geometry and construction, and ignition method) and open-test conditions (modelers had access to all test data). Results showed significant variance from the measured data, especially in the blind study.
Since the Dalmarnock study, there has been significant development of all FDS submodels including those for combustion, heat transfer, and pyrolysis. There has also been continued research into the methods for measuring and assessing material properties in support of pyrolysis modeling. For this fourth and final paper in this Special Edition of the Journal, a 2005 LODD incident at a fire training facility in Pennsylvania was revisited using the current release of FDS. This effort used data provided by the first three papers in this Special Edition combined with a recently developed engineering pyrolysis model 11 referred to as SBPyro in the FDS User’s Guide. 2 From the first three papers:
The first paper 12 discusses the methods for measuring and determining material properties required for modeling the pyrolysis of materials. Data collected during this research were used for the prediction of fire growth and the prediction of the response of firefighter protective gear (in this case, the facepiece).
The second paper 13 discusses the thermal exposures encountered by fire fighters on the fireground and a method of classifying those exposures into hazard categories. These categories were used for assessing the FDS exposure conditions during the incident.
The third paper 14 discusses the thermal performance of the facepiece used in self-contained breathing apparatus (SCBA). Data from this paper and other work were used to develop criteria for the expected time of hole formation in a facepiece exposed to a fire environment.
The purpose of the FDS modeling is twofold. First, model predictions were compared against full-scale test data related to the incident to assess the ability of FDS to predict fire growth over training fuels in a fire training facility and to predict the resulting thermal environment. Second, model predictions were used to evaluate the impact of changes in codes and standards for the performance of firefighting protective gear (i.e. would the same event with today’s gear have resulted in the same outcome?).
Incident overview and investigation
The incident selected for modeling was a training activity at the Pennsylvania State Fire Academy (PSFA) that resulted in the LODD of an instructor. 15 The academy has a burn building representing a residential type structure. It has one below-grade level and three above-grade levels connected by interior stairs. An exterior view of the structure is shown in Figure 1, and a plan view of the below-grade level where the LODD occurred is shown in Figure 2. Plan north is to the left, a convention that is maintained throughout this article. The northwest stairs lead directly to the outside, and the south stairs lead to the first floor.
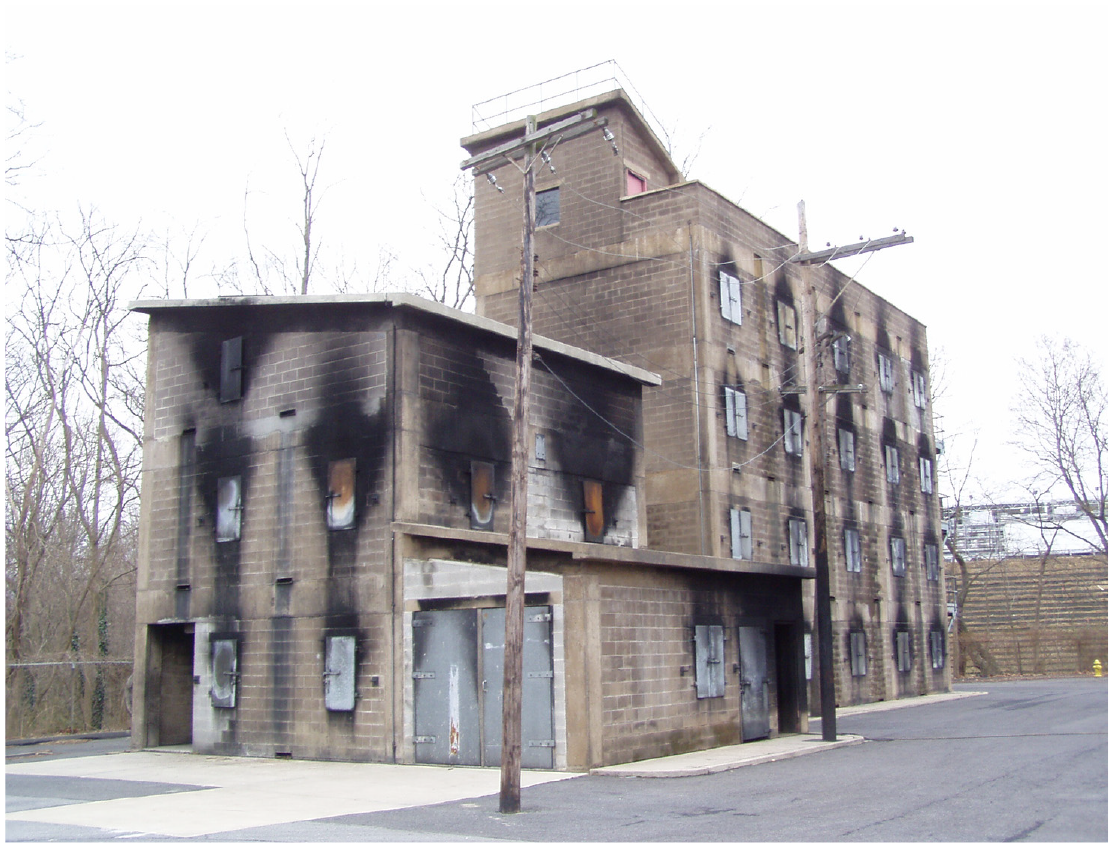
Photograph of the burn building exterior. The lower left of the photo corresponds to the upper right of the plan view in Figure 2.
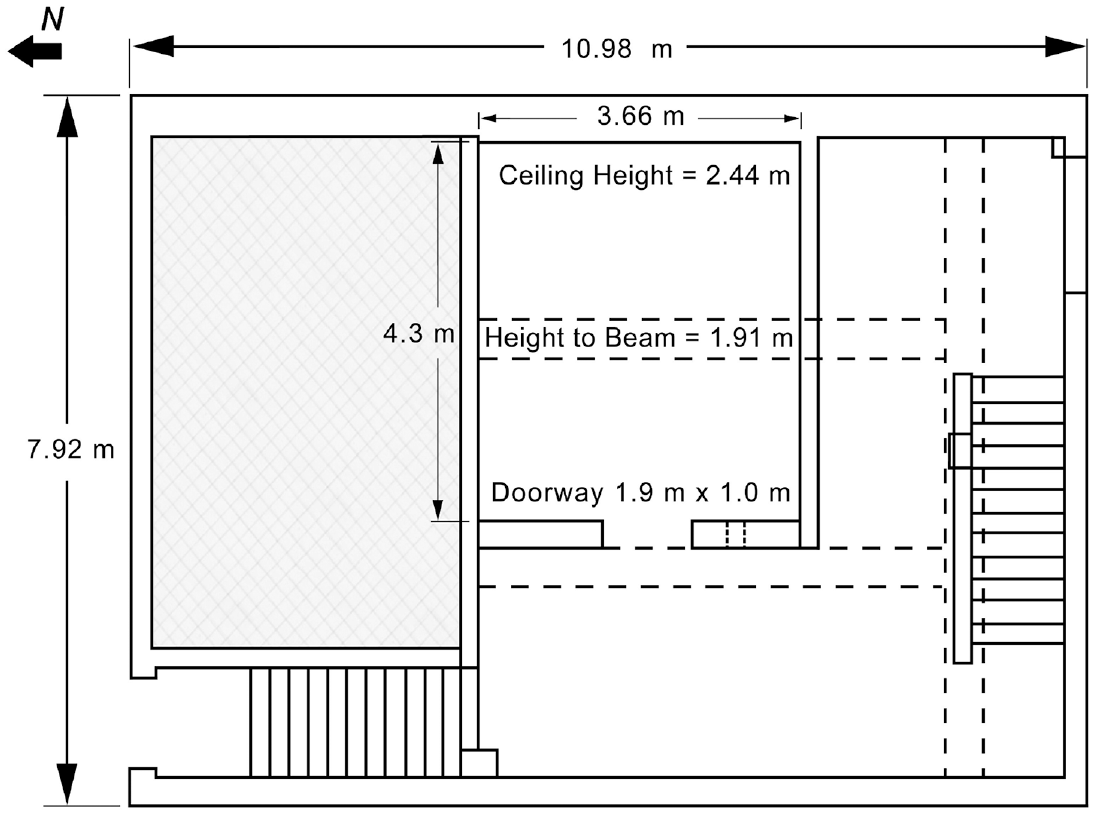
Plan view of the burn building basement.
On 23 October 2005, a series of training evolutions took place in the structure. For each evolution, an instructor wearing turnout gear and an SCBA placed wood pallets into the basement burn room, Figure 3, to create elevated temperatures and poor visibility. Once the desired conditions were reached, a fire attack team would descend the south staircase, knock down the fire, and then hydraulically vent the basement using the northwest staircase for the vent path. The fire was not fully extinguished during each evolution, and the residual fire and embers were used to rekindle new wood pallets placed for the next evolution. During the sixth evolution of the day, the instructor became incapacitated while adding wood pallets to the fire. Tragically, while the instructor was rescued alive, he later succumbed to his injuries while being treated in the hospital. Either as the proximate cause of the incapacitation or prior to the rescue attempt, the SCBA facepiece melted and exposed the instructor to the immediately dangerous to life or health (IDLH) conditions in the fire room. The second objective of this study looked at the potential impact had today’s protective gear been in use at the time of the incident, that is, the outcome assuming that facepiece failure rather than a medical event was the proximate cause.
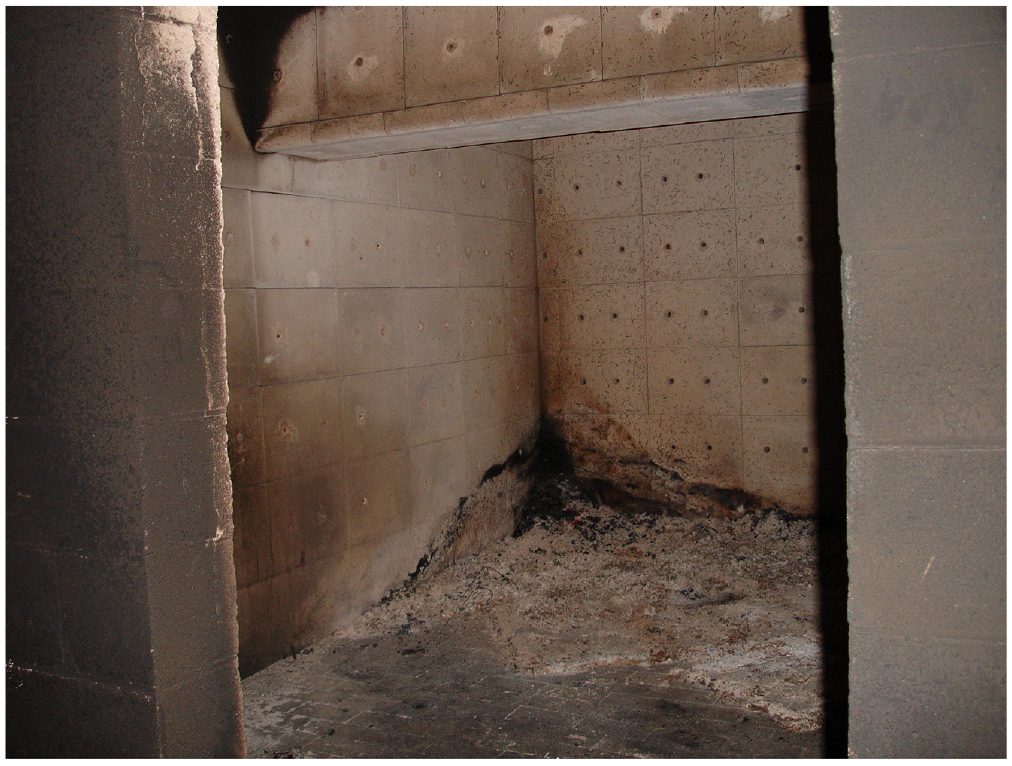
Photograph of the basement burn room looking in from outside the room.
The Pennsylvania State Fire Commissioner, Edward Mann, initiated the investigation of the incident by contacting the National Institute for Occupational Safety and Health (NIOSH). Since the injured instructor was still alive and undergoing treatment in the hospital, NIOSH rapidly dispatched an investigator to the scene within 48 h of the incident. In the report, 15 the investigator noted that on arrival, the basement burn room was still warm and that a bed of embers remained in the NE corner of the burn room (embers can be seen glowing in Figure 3). The report described that the incident occurred during the last evolution of the day for a Suppression Instructor Development course. The fire scenario was intended to be a flashover type fire. Interviews with other instructors revealed that the visual objective would be for the students to discover flames exiting the doorway of the basement burn room after they descended the stairs. Interviews also noted that while the instructor was wearing full personal protective equipment (PPE), the facepiece had visible signs of pre-existing damage in the form of crazing or scratches. See Figure 4 for a photograph of a similarly damaged facepiece from the NIOSH report. During the last evolution, the instructor entered the building, descended down the south stairs into the basement, and began adding pallets to the burn room. After a short period of time, the instructor returned to the first floor, and when asked if he was OK, he stated that “It’s hot as hell down there!.” The instructor laid down on the concrete floor and manipulated his gear in an effort to cool off and gained some relief. After another query on his condition, the instructor replied he was OK and descended back into the basement to finish adding fuel to the fire. The total time on the first floor was approximately 1.5 min. While in the burn room, enroute to adding additional pallets to the fire, the instructor fell to the floor dropping the pallets in the process and crawled part way back to the door with an apparent path of falling toward the southeast corner and then moving toward the southwest corner. After a few minutes, students descended the south stairs into the basement with a hose line, entered the burn room, discovered the instructor on the floor, and called a mayday. The NIOSH report hypothesized that the facepiece failure was the proximate cause of the instructor’s initial collapse.
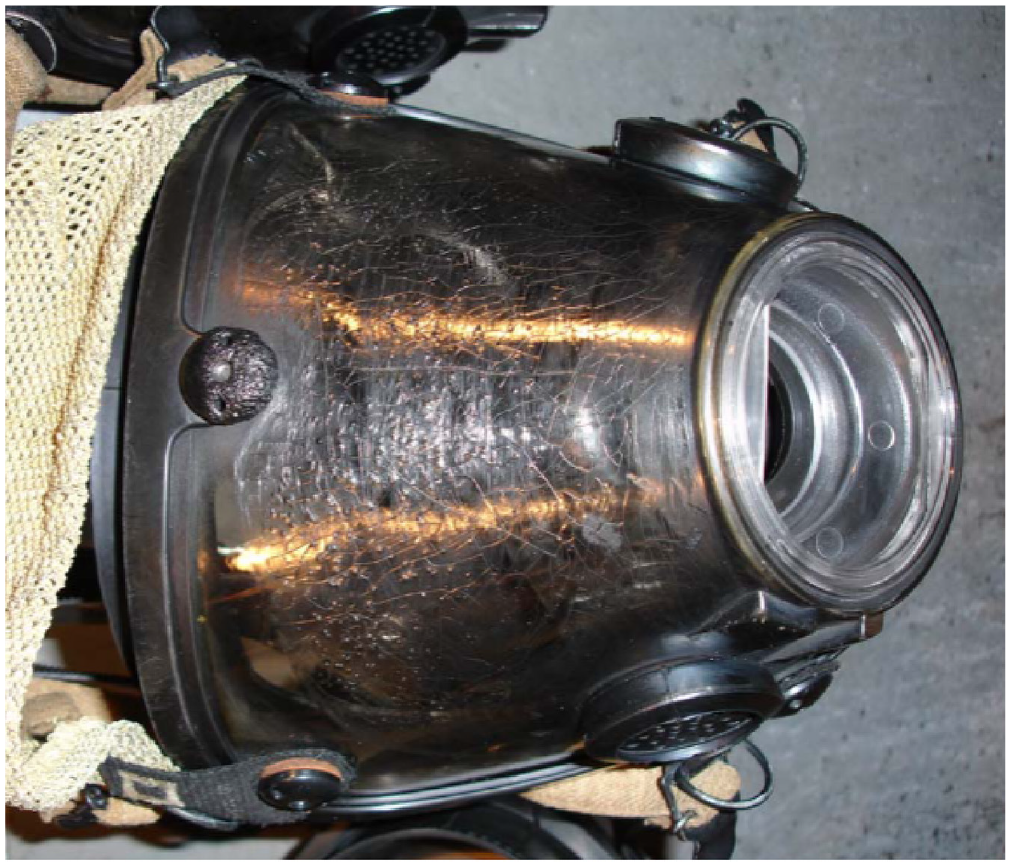
Photograph of exemplar SCBA facepiece with similar damage as the victim’s facepiece prior to the incident.
As part of the investigation, assistance was sought from the National Institute of Standards and Technology (NIST) in understanding the fire conditions during the training evolutions. NIST performed two series of tests to aid in the effort. For the first series, members of the NIST fire research group traveled to the training facility and conducted experiments with the goal of replicating the conditions during the training evolution. 16 In the second series, stacks of wood pallets were burned in an open corner under a calorimeter.
Onsite experiment
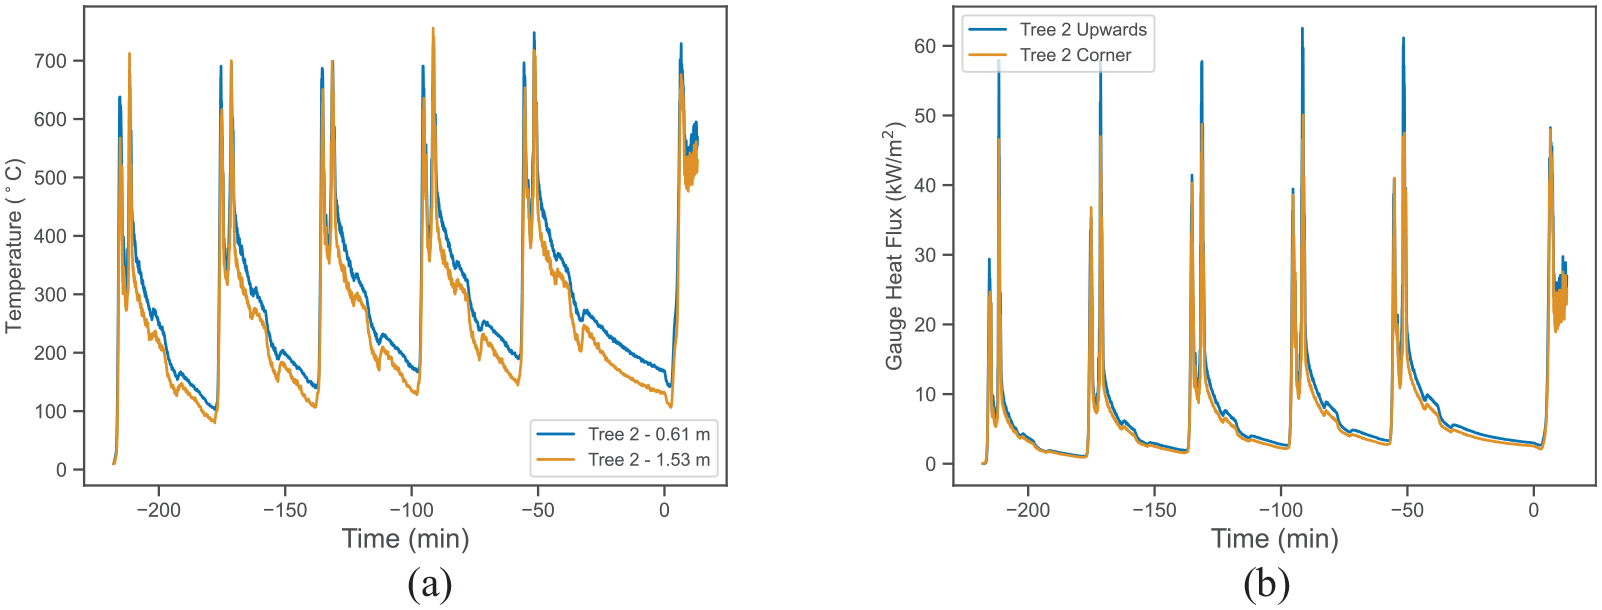
In March of 2006, a set of eight back-to-back evolutions was performed in the basement burn room at the Pennsylvania training facility. The basement was instrumented with five thermocouple trees, seven heat flux gauges, and video (visible and infrared). The tree locations are shown in Figure 5. Each tree contained eight type-K thermocouples starting at 0.025 m (1 in) below the ceiling with the remaining spaced at 0.305 m (1 ft) intervals. The heat flux gauges were water-cooled, Schmidt–Boelter type gauges. Three pairs of gauges were placed at 1.5 m (5 ft) below the ceiling at tree locations 1, 2, and 5. One gauge in each pair was pointed up at the ceiling, and the other gauge was pointed at the NE corner of the burn room. The seventh gauge was placed facing north, toward the fire location, at the Tree 1 location at 0.610 m (2 ft) below the ceiling.
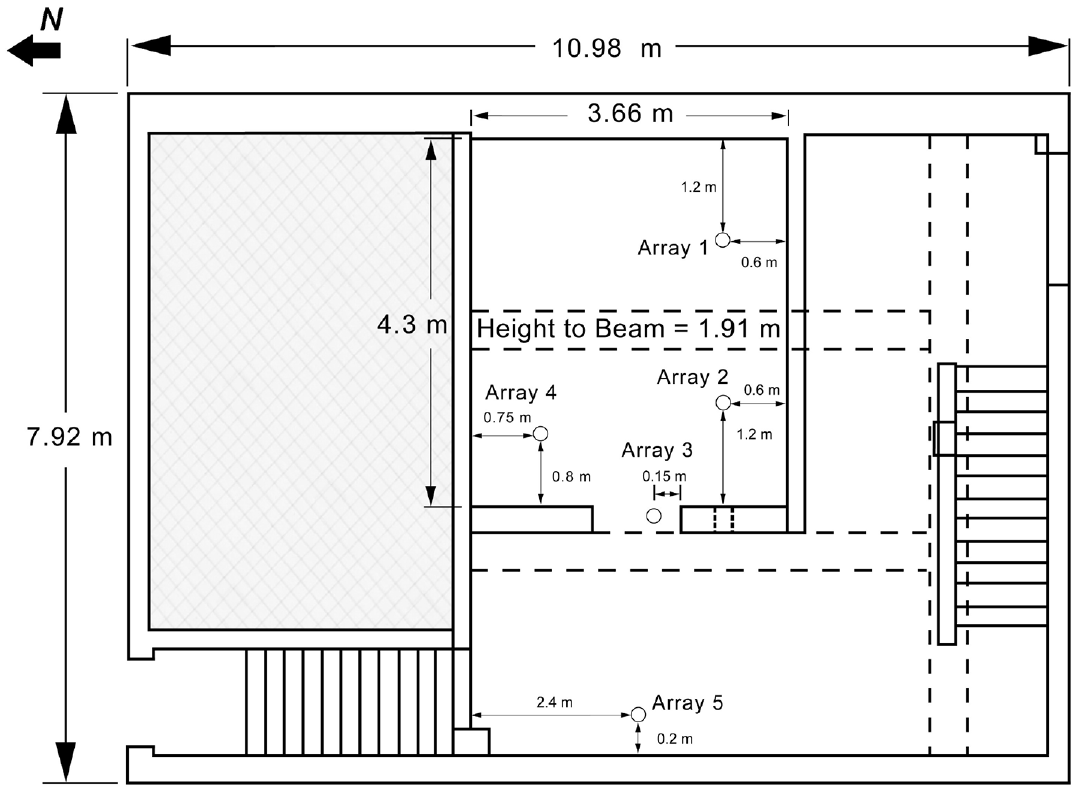
Instrumentation locations for the onsite experiment.
The first evolution was a pre-burn used to pre-heat the basement and establish embers for the future evolutions. For each subsequent evolution, additional pallets were placed in the burn room, the fire was allowed to grow until all the pallets were involved, the fire was suppressed, hydraulic ventilation was performed, and the basement was opened up to allow smoke to dissipate and cooling to occur. Evolution spacing varied between 20 and 45 min. The first five evolutions used five pallets (the first also included excelsior which is shredded wood used as an ignition source) with total combustible masses of 56.9–75.1 kg. The last three evolutions used six or seven pallets with total combustible masses of 81.1–111.3 kg. The total experimental duration of the eight evolutions was 3.5 h. After the last evoluiton, a new pallet was placed on the floor of the fire room near where the instructor was found. After 1.5 h from the end of the last evolution, the fire room was re-entered and the pallet had been reduced to ash. After 2 h, wall temperatures were measured with a thermal imaging camera (TIC). Temperatures were 400°C high on the east wall of the NE corner of the burn room, 180°C on the center of the burn room floor, and 120°C on the ceiling outside the door to the burn room.
Temperatures and heat fluxes at Tree location 2 are shown in Figure 6. Both temperatures and heat flux show a steady rise over the course of the eight evolutions. There is a long gap between Evolutions 6 and 7 similar to the gap before the sixth evolution during the incident. Temperatures at head level were 200°C with heat fluxes near 5 kW/m2. Temperatures and heat fluxes would have been higher closer to the ember pile putting the exposure into the Emergency I category 13 and possibly the Emergency II category.
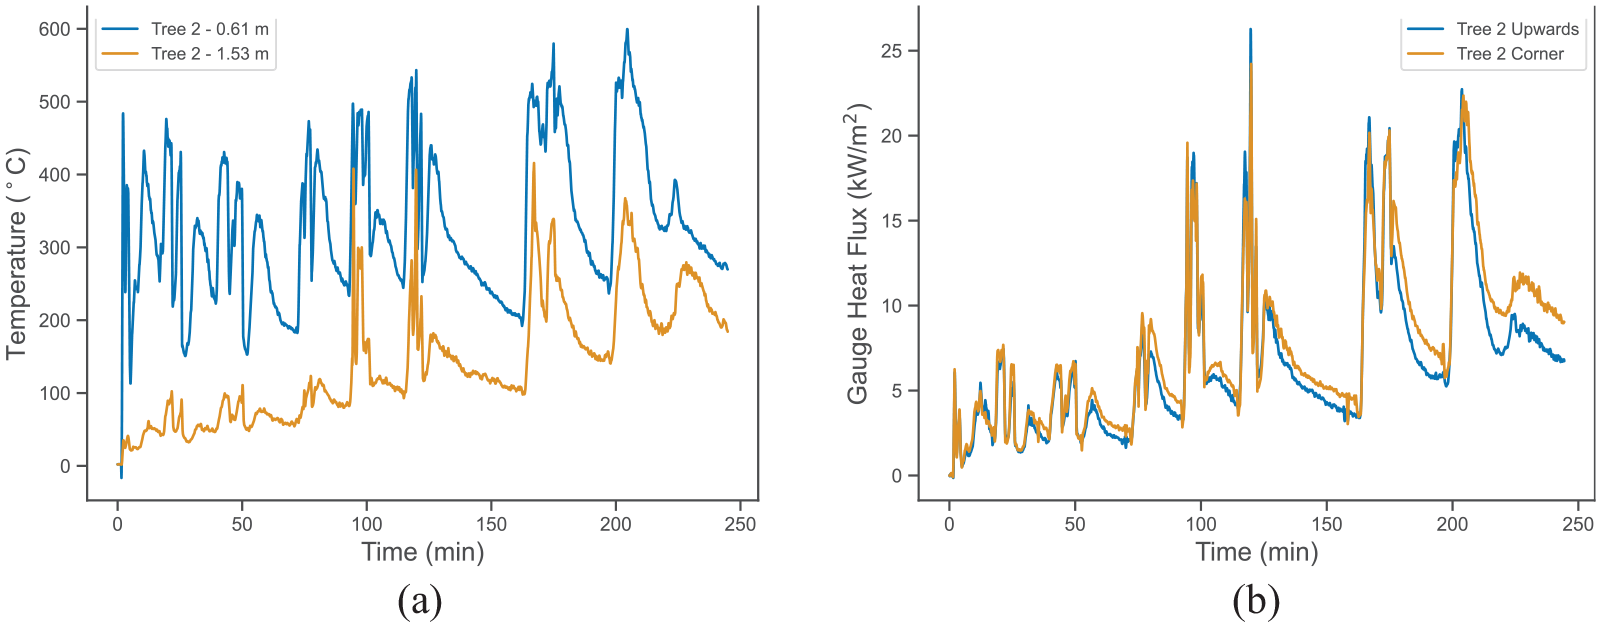
(a) Measured temperature and (b) heat flux during the onsite experiment.
Open corner experiments
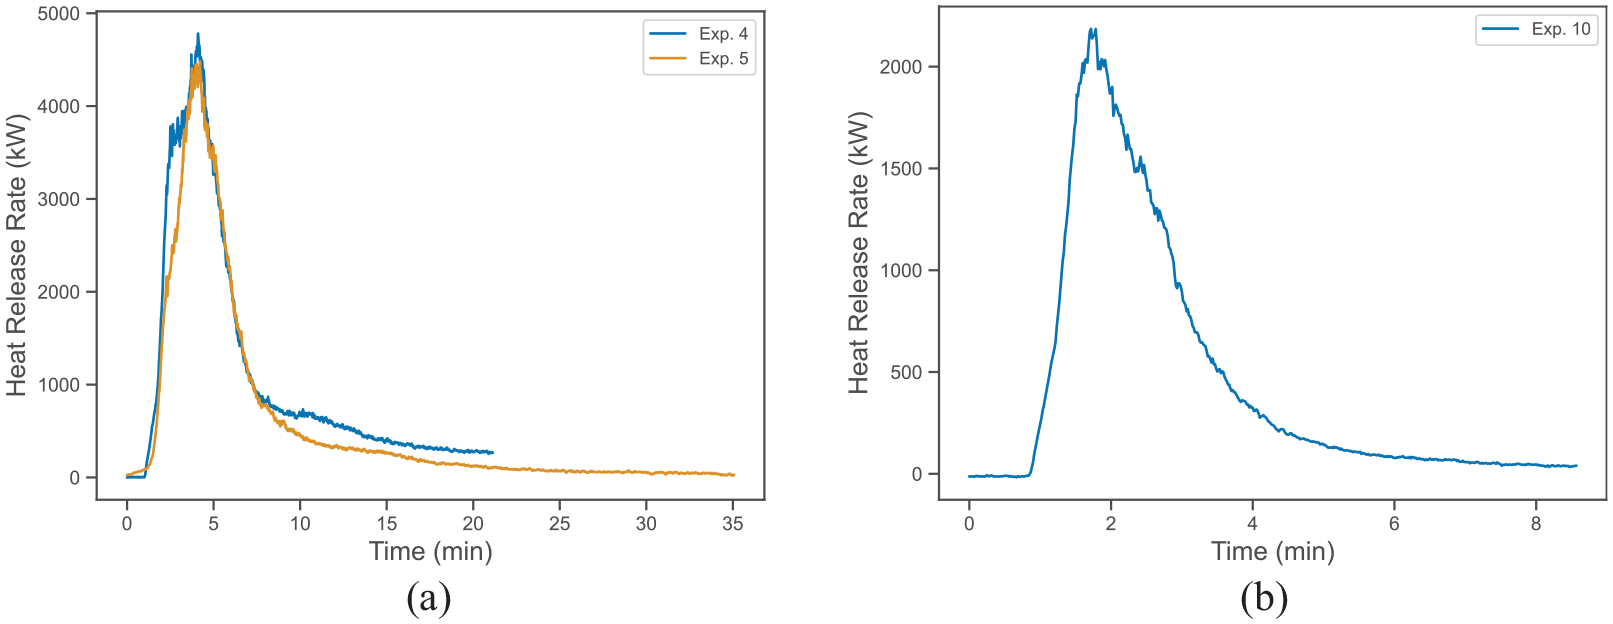
In July of 2006, a set of 13 experiments was performed on the NIST campus in Gaithersburg, MD. The experiments used an oxygen consumption calorimeter to measure the HRR from groups of wood pallets that varied in number and configuration. Excelsior was used in each experiment. Three of the experiments consisted of just excelsior. The experiments took place in an open corner consisting of two 2.44 × 2.44 m2 walls with a triangular ceiling. The surfaces consisted of two layers of 13 mm (0.5 in) gypsum wall board. Pallet experiments ranged from three pallets weighing 27.5 to six pallets weighing 97.8 kg. The three excelsior experiments used 7.4, 14.8, and 29.6 kg of excelsior. Two of the experiments, Experiments 4 and 5 (Figure 7), had pallet configurations similar to that used in the training facility consisting of six pallets weighing 97.8 kg, stacked on end, leaning against the corner. Each of these experiments used 14.8 kg of excelsior. Excelsior and pallets were unconditioned. Figure 8 shows the HRRs measured in the two pallet experiments and the excelsior experiment (Experiment 10) which used 14.8 kg. The peak HRR for Experiments 4 and 5 was 4.8 and 4.5 MW near 250 s. The excelsior experiment peaked at 2.2 MW at 100 s.
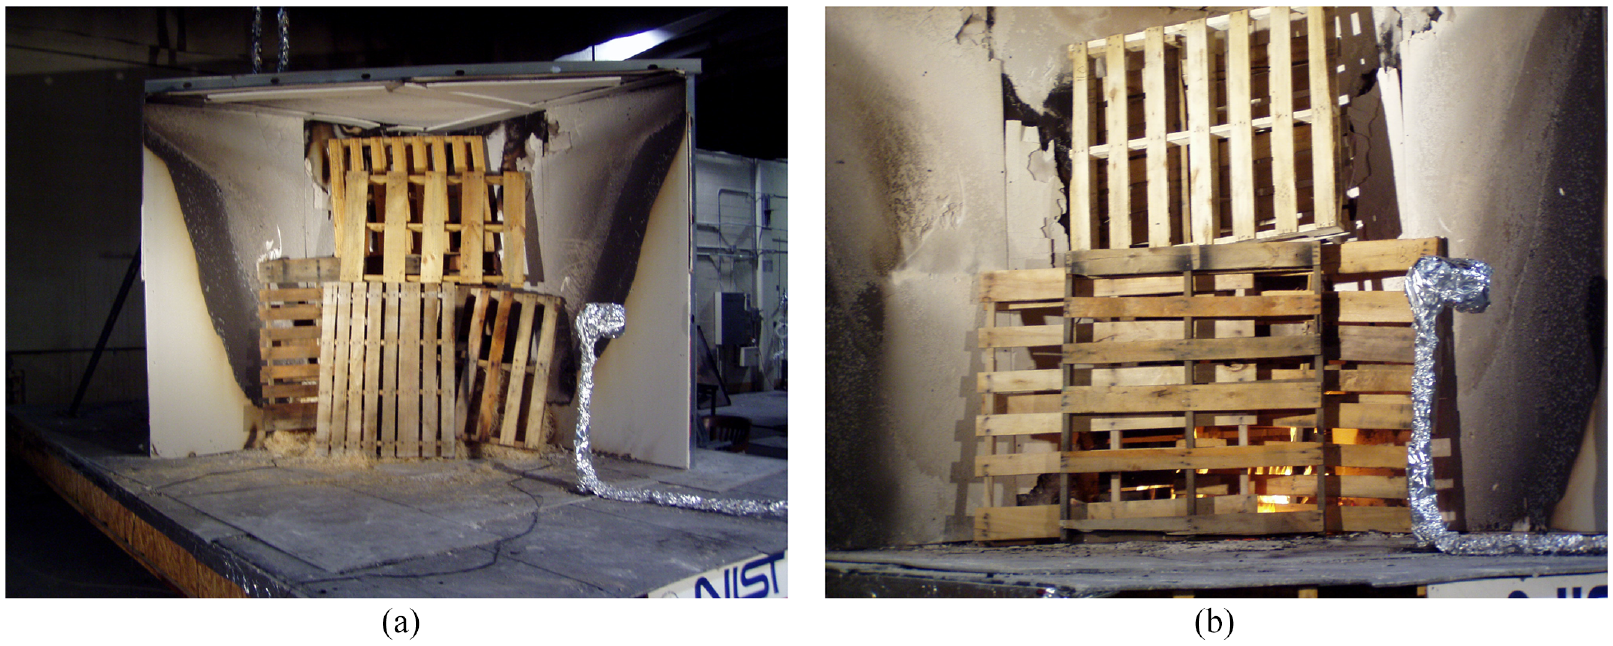
Pre-fire photos of open corner experiments: (a) Experiment 4 and (b) Experiment 5.
Measured heat fluxes for (a) pallets and (b) excelsior in open corner experiments.
Fire model development
Fire modeling of the event was performed using FDS v6.8.01,2 at githash gc1b5f1a (pre-FDS v6.9.0 test version). FDS is a CFD model developed for the purpose of modeling fires in the built environment. Full details of model are provided in the freely available guides at https://pages.nist.gov/fds. Aspects of the model particularly relevant for this specific application are turbulence modeled using large eddy simulation (LES) with Deardorff’s Model 17 for closure; combustion model using a mixing controlled, single-step, fast chemistry with fixed product yields; 18 radiation transport modeled using a finite volume model 19 with absorption coefficients computed using RADCAL 20 and the source term in the flame volume corrected to obtain a minimum radiant fraction (assumed to be 35%); and pyrolysis (for this work) modeled using a scaled heat flux approach that relies on cone calorimeter data. 11
The purpose of fire modeling was twofold. First, to demonstrate how the research presented in the other papers of this special edition can be applied for modeling the fire ground. Second, to investigate the exposures seen by the instructor’s facepiece and to evaluate the resulting hazard. As part of the second item, modeling efforts considered both the facepiece worn that day and a current facepiece to examine the impact of evolving standards for PPE.
Modeling challenges
There were significant challenges to modeling the incident. These challenges were typical of attempts to use computer modeling in the investigation of a fire incident. Significant challenges included as follows:
There were no detailed records of the fuel load, for example, details such as the number, weight, construction, time of placement, and specific orientation/location of the wood pallets used for each evolution. Interviews during the investigation process provided some anecdotal evidence on typical fuel loads for a training evolution.
As each new evolution was started, the instructor dynamically changed the basement ventilation by opening and closing the basement door and window to control the fire growth and development of hot layer conditions. Trainees would also change ventilation as part of their training goals by opening the south stair door to enter the basement and then opening the basement door for hydraulic ventilation. While details on the ventilation were not recorded during the incident, they were recorded during the NIST experiment at the facility where the NIST experimental protocol was based on interviews.
The exposure of a facepiece is a function of the fire conditions over time and the location and orientation of the facepiece over time. Challenges in understanding the fire conditions have already been mentioned. There were no recorded details on the exact timing of the instructor’s movements during the final evolution which began with the instructor outside the building after a midday break following the fifth evolution. There was limited evidence on the general movement pattern of the instructor during a training evolution.
Fire scenarios modeled
The incident occurred during the sixth evolution of the day. While there were differences in the exact fuel load and the timing with which pallets were loaded for each training evolution, the evolutions were intended to be similar events. This meant that gaining some understanding of what differences there might have been in the fire exposures between the fifth evolution and the sixth evolution could be important to understanding the proximate cause of the event. Therefore, two fire scenarios were modeled with each focusing on a single evolution (the fifth or the sixth). For the focused evolution in each scenario, the one-by-one addition of wood pallets to the burn room was modeled in an attempt to generate as realistic an exposure to the facepiece as possible. Each scenario also included prescribing a path in time for the instructor’s facepiece that included both location and orientation. For evolutions prior to the focused evolution, prescribed fires were used. The goal for the prescribed fires was to reasonably represent the heating and cooling cycles in the burn room as the NIST experiment showed that over the course of a day that significant heat was stored in the basement walls, ceiling, and floor. The details of the fire are discussed in section on modeling of the wood pallets. It was unknown if the facepiece failed prior to or after the instructor collapsed in the fire room. It was known that the facepiece did not fail during the fifth evolution. Focusing on the last two evolutions allows for the comparison of the facepiece exposures between the two evolutions which did differ in the sequence of events. In the fifth evolution, loading of pallets was uninterrupted. In the sixth evolution, after some pallets were added to the burn room, there was an approximately 5-min pause before adding more pallets. During that pause, fire would have been growing over the pallets placed earlier.
Timeline of the day
Details are sparse on the timing of events. The NIOSH report and NIST interviews with staff provide the following sequence of events for the day:
The first five evolutions occurred between approximately 0900 and 1200 h.
Following the the fifth evolution, there was a break until approximately 1238 h. The instructor left the building during this break.
At approximately 1238 h, the instructor re-enters the building and begins to add pallets to the fire.
Shortly after, additional instructors re-enter the building to monitor the trainees. A couple of minutes afterward one of the additional instructors hears the interior stair door to the basement open and sees an instructor come out, lay on the floor, and open up their gear to cool off while noting how hot it was downstairs. The instructor on the floor insists they are alright and do not need to go outside.
In approximately 1.5 min, the instructor on the floor gets up and re-enters the basement.
At approximately 1245 h, pallets are again being added to the basement fire.
A few minutes later, the trainees enter the basement, discover the instructor on the floor of the fire room, call a mayday, and begin the rescue of the instructor.
At 1253 h, witnesses report the instructor being carried out of the building.
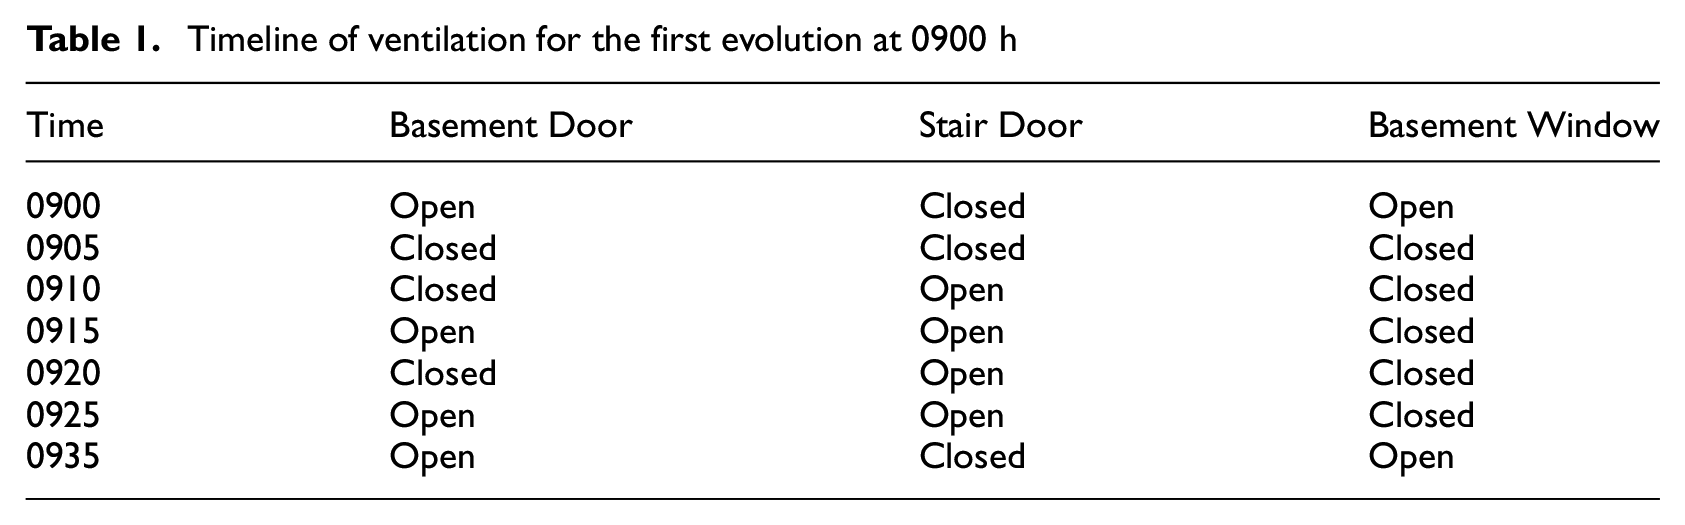
To model the exposure seen by the instructor, a more detailed timeline was required to have the instructor location detailed over time. This detailed timeline used the NIST experiment at the training facility as a basis for the sequence of events. The NIST experiment recorded ventilation status during the various evolutions performed. The general sequence of events for an evolution was closing the interior stair door and opening the basement door and window to provide ventilation, placing the next set of wood pallets on the embers from the prior evolution, closing the basement door and window, opening of the interior stair door for the training team to enter, and opening the basement door for hydraulic ventilation of the basement. For the first evolution starting at 0900 h, the sequence of events is shown in Table 1. This sequence was repeated at 40-min intervals for either four or five evolutions depending on the scenario (the first five evolutions were assumed to be at 0900, 0940, 1020, 1100, and 1140 h). Note that the “Closed” status for 0905 was not a truly closed door. This is the time period with dynamic changes to door position for controlling fire growth. To approximate this in the model, a single column of grid cells was left open.
Timeline of ventilation for the first evolution at 0900 h
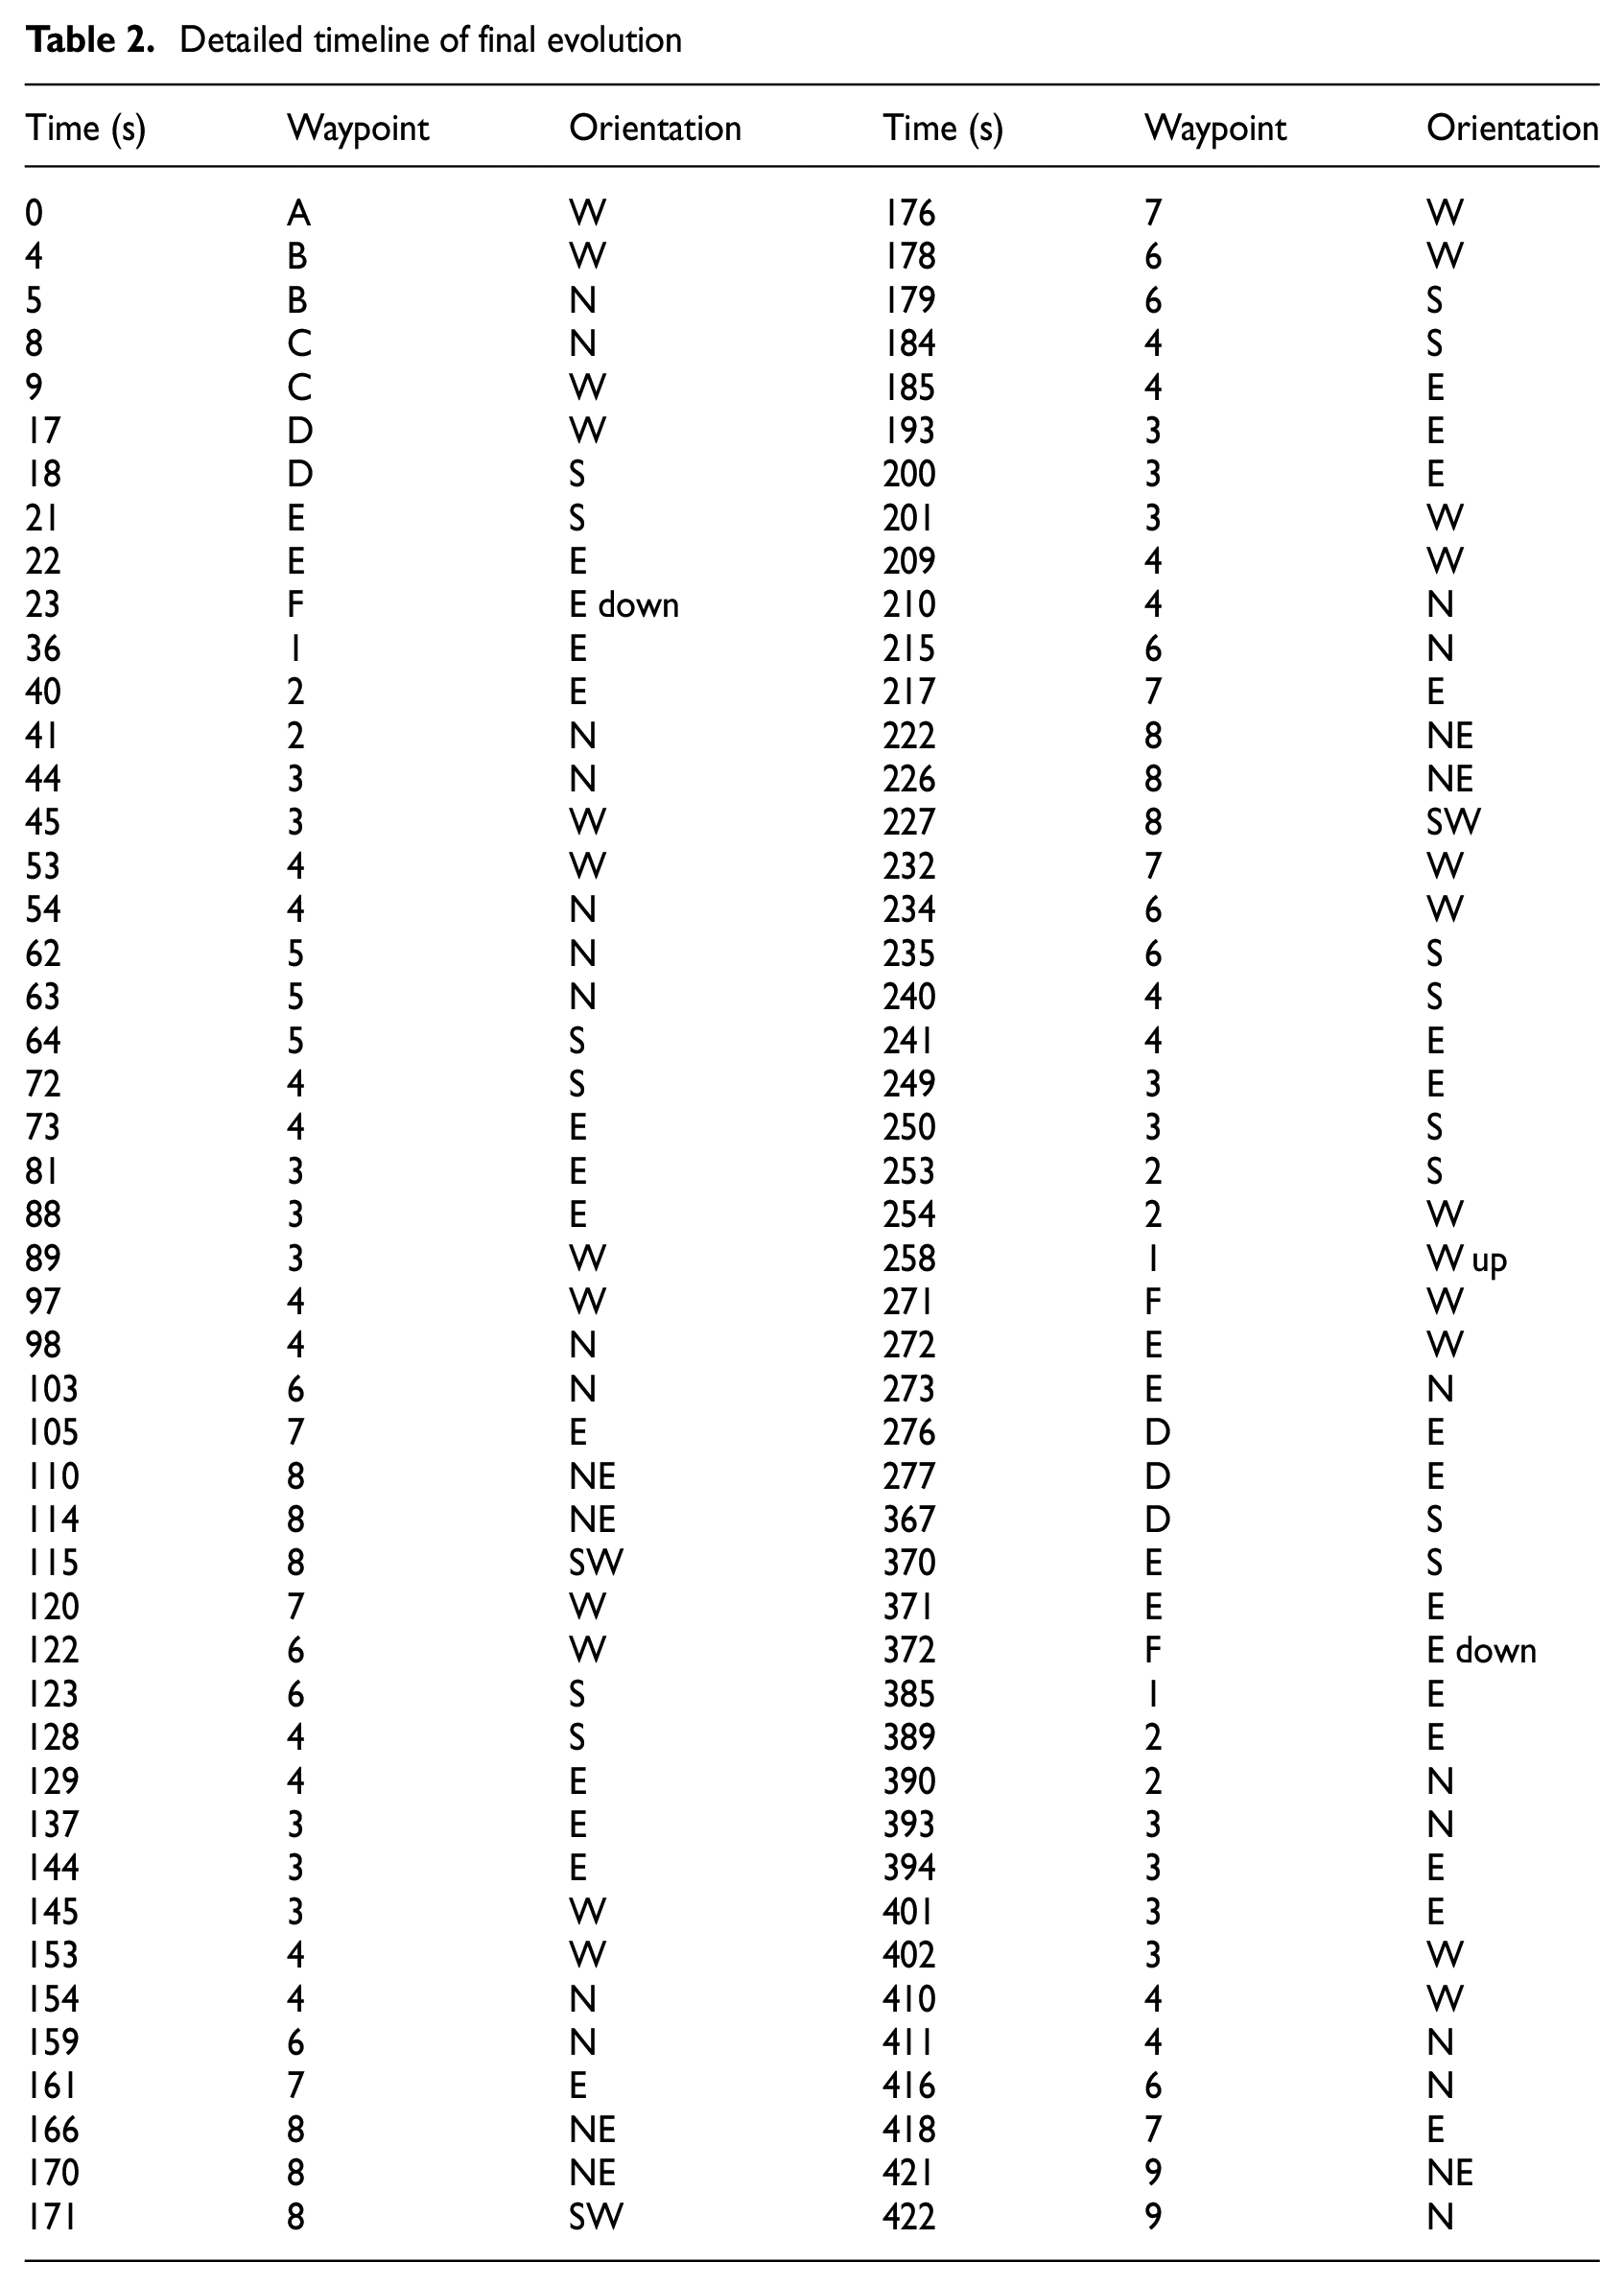
For the final evolution in each scenario, a detailed timeline for the instructor was developed. This was based on the timepoints of the instructor entering the building at 1238 h, having a rest period of 1.5 min after adding some pallets, and the final pallets being added at 1245 h. Interviews indicated that six pallets were added before the break and two more were in the process of being added when the instructor collapsed. Pallets were stored in the basement near the bottom of the interior stairs. The detailed timeline was defined as a series of waypoints (Figure 9) and orientations of the instructor’s head. This timeline was used to define the path and orientation for a particle representing the facemask which allows for a prediction of the facemask time-dependent exposure and temperature. The detailed timeline is shown in Table 2. For the first scenario where no rest break occurred, the block of events from 250 to 393 s was omitted. The timeline assumed 7 s to pickup a pallet from the fuel pile, 4 s to place a pallet in the burn room, and a staircase speed 70% less than the speed over flat ground. Using distances between waypoints, the walking and stair speeds were adjusted to give the correct time (approximately 7 min or 420 s) for adding the final pallets. For the sixth evolution scenario, t = 0 was the start time for the final evolution (1238 h). For the fifth evolution scenario, the waypoint times were offset by 3542 s to the start of the fifth evolution.
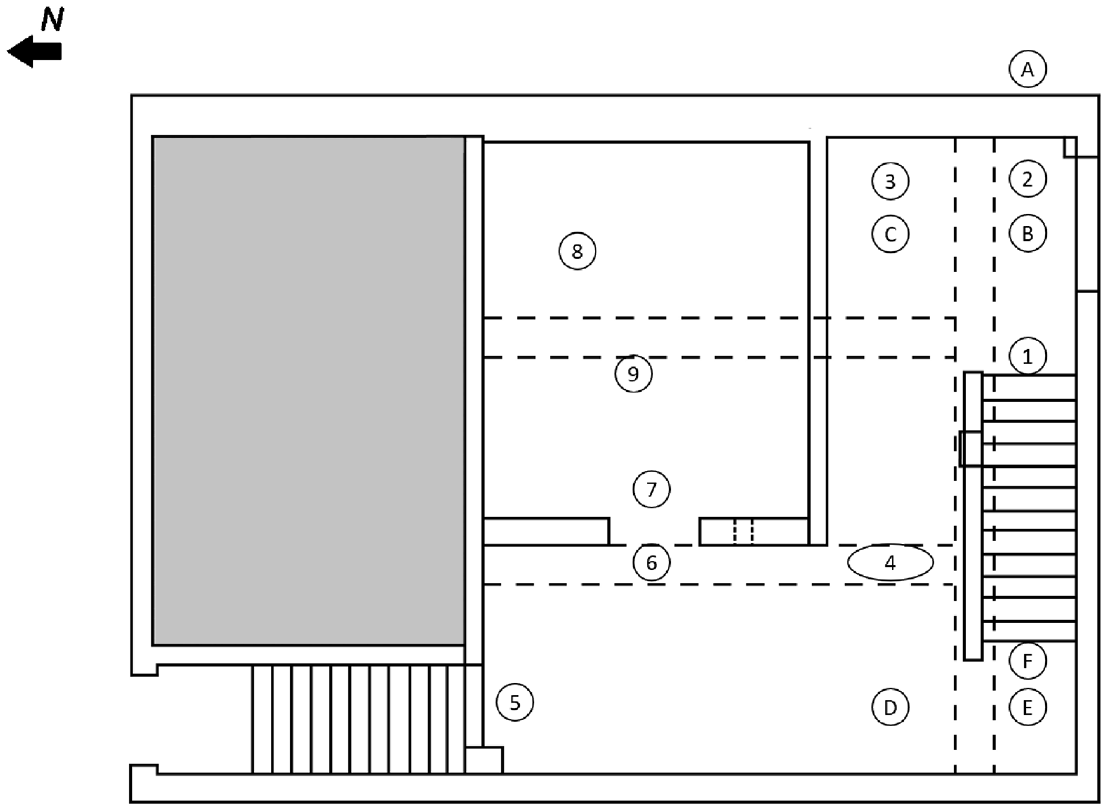
Waypoints for instructor movement. Letters are first-floor waypoints, and numbers are basement waypoints.
Detailed timeline of final evolution
Geometry model
An FDS geometry model was created for the entire training facility. The basement used the floor plan as shown in Figure 2. Similar plans were not available for the above ground floors. Based on photographs, the first floor consisted of two large rooms connected by an east–west hallway leading from the front door to the south stairs to the basement and a garage on the north side. These compartments were included to model smoke leaving the basement via the south stairs and along the hallway leading to the east entrance door. Compartments were not modeled in the upper floors. The floors were included in the model as empty volumes to preserve the free-air volume of the building. Based on the results of the wood pallet pyrolysis model validation simulations discussed later in the paper, a 7.6 cm (3 in) grid was used. The computational domain consisted of the interior volume from the basement floor to the third floor ceiling and the interior surface of the building’s exterior walls plus a volume encompassing the basement-level window well on the southeast corner. The main building was meshed with 48 meshes with an additional mesh used for the window well. Views of the geometry model are shown in Figure 10.
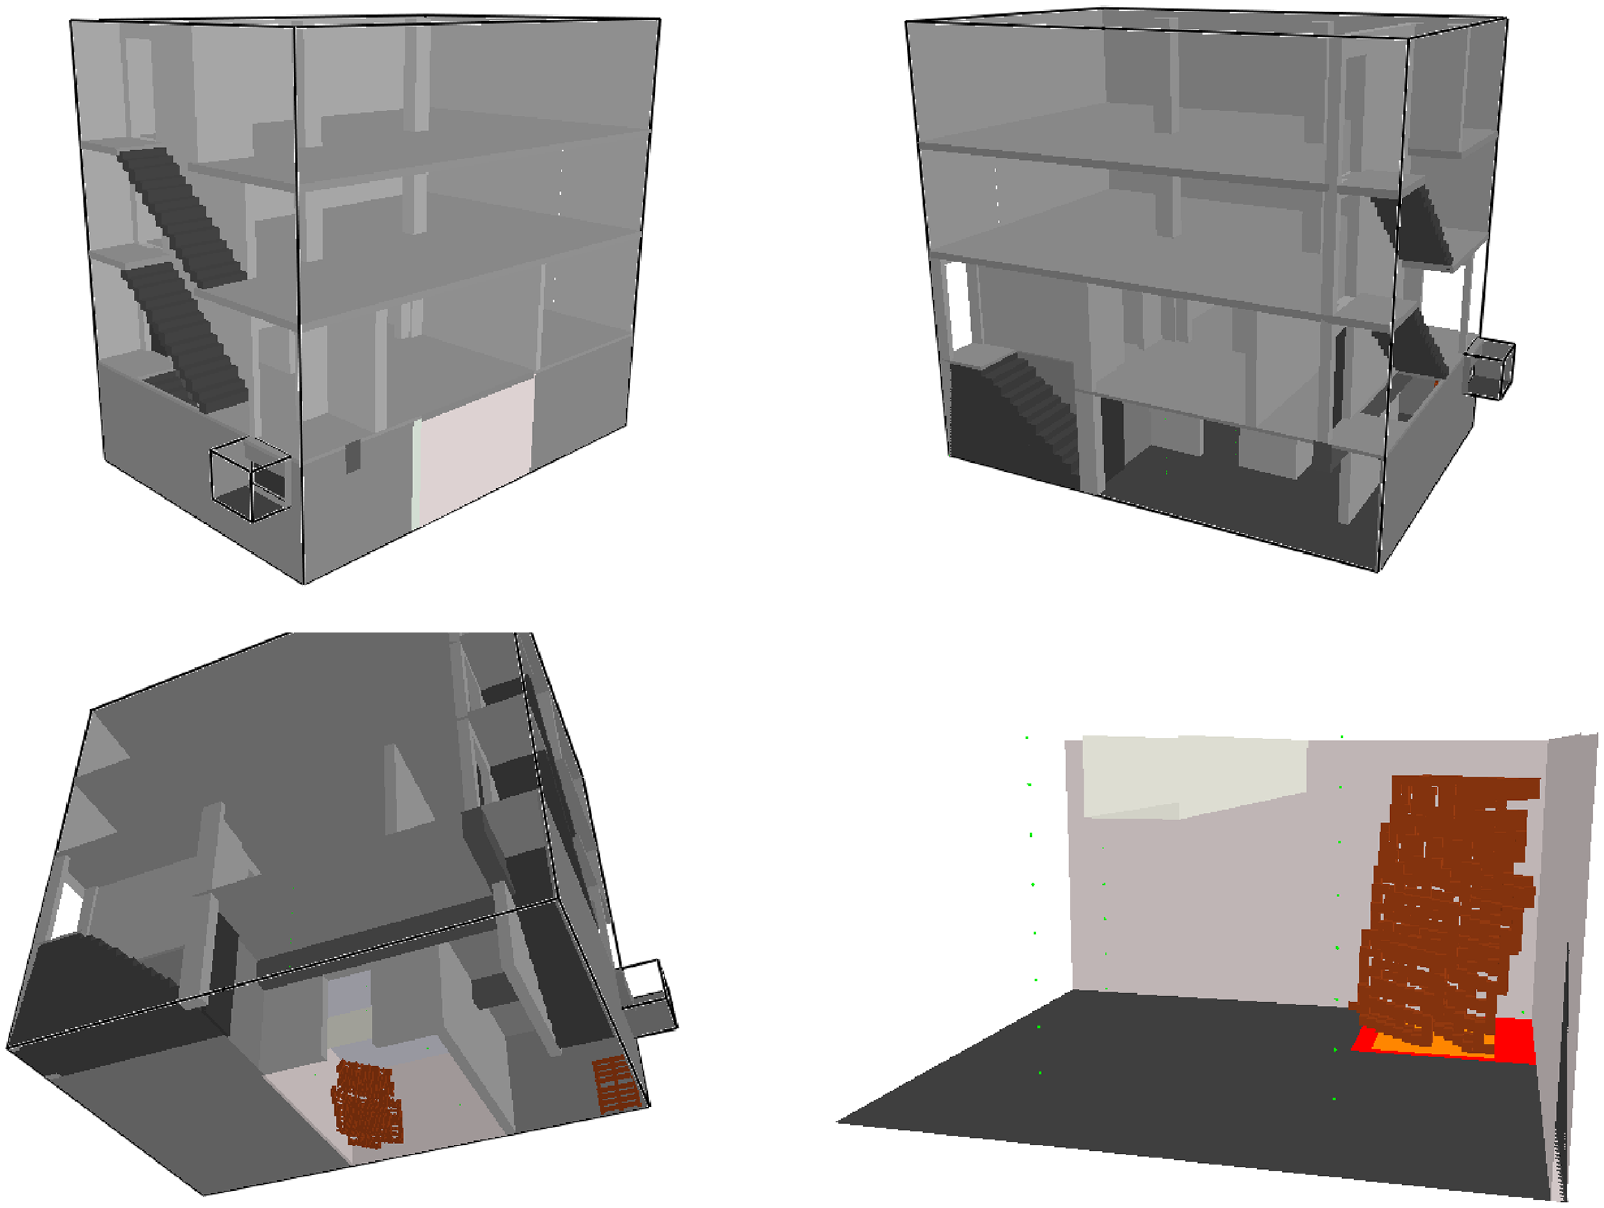
FDS geometry. Clockwise from top left: view looking at SE corner, view looking at SW corner, view looking up at SW corner, and view clipped to burn room.
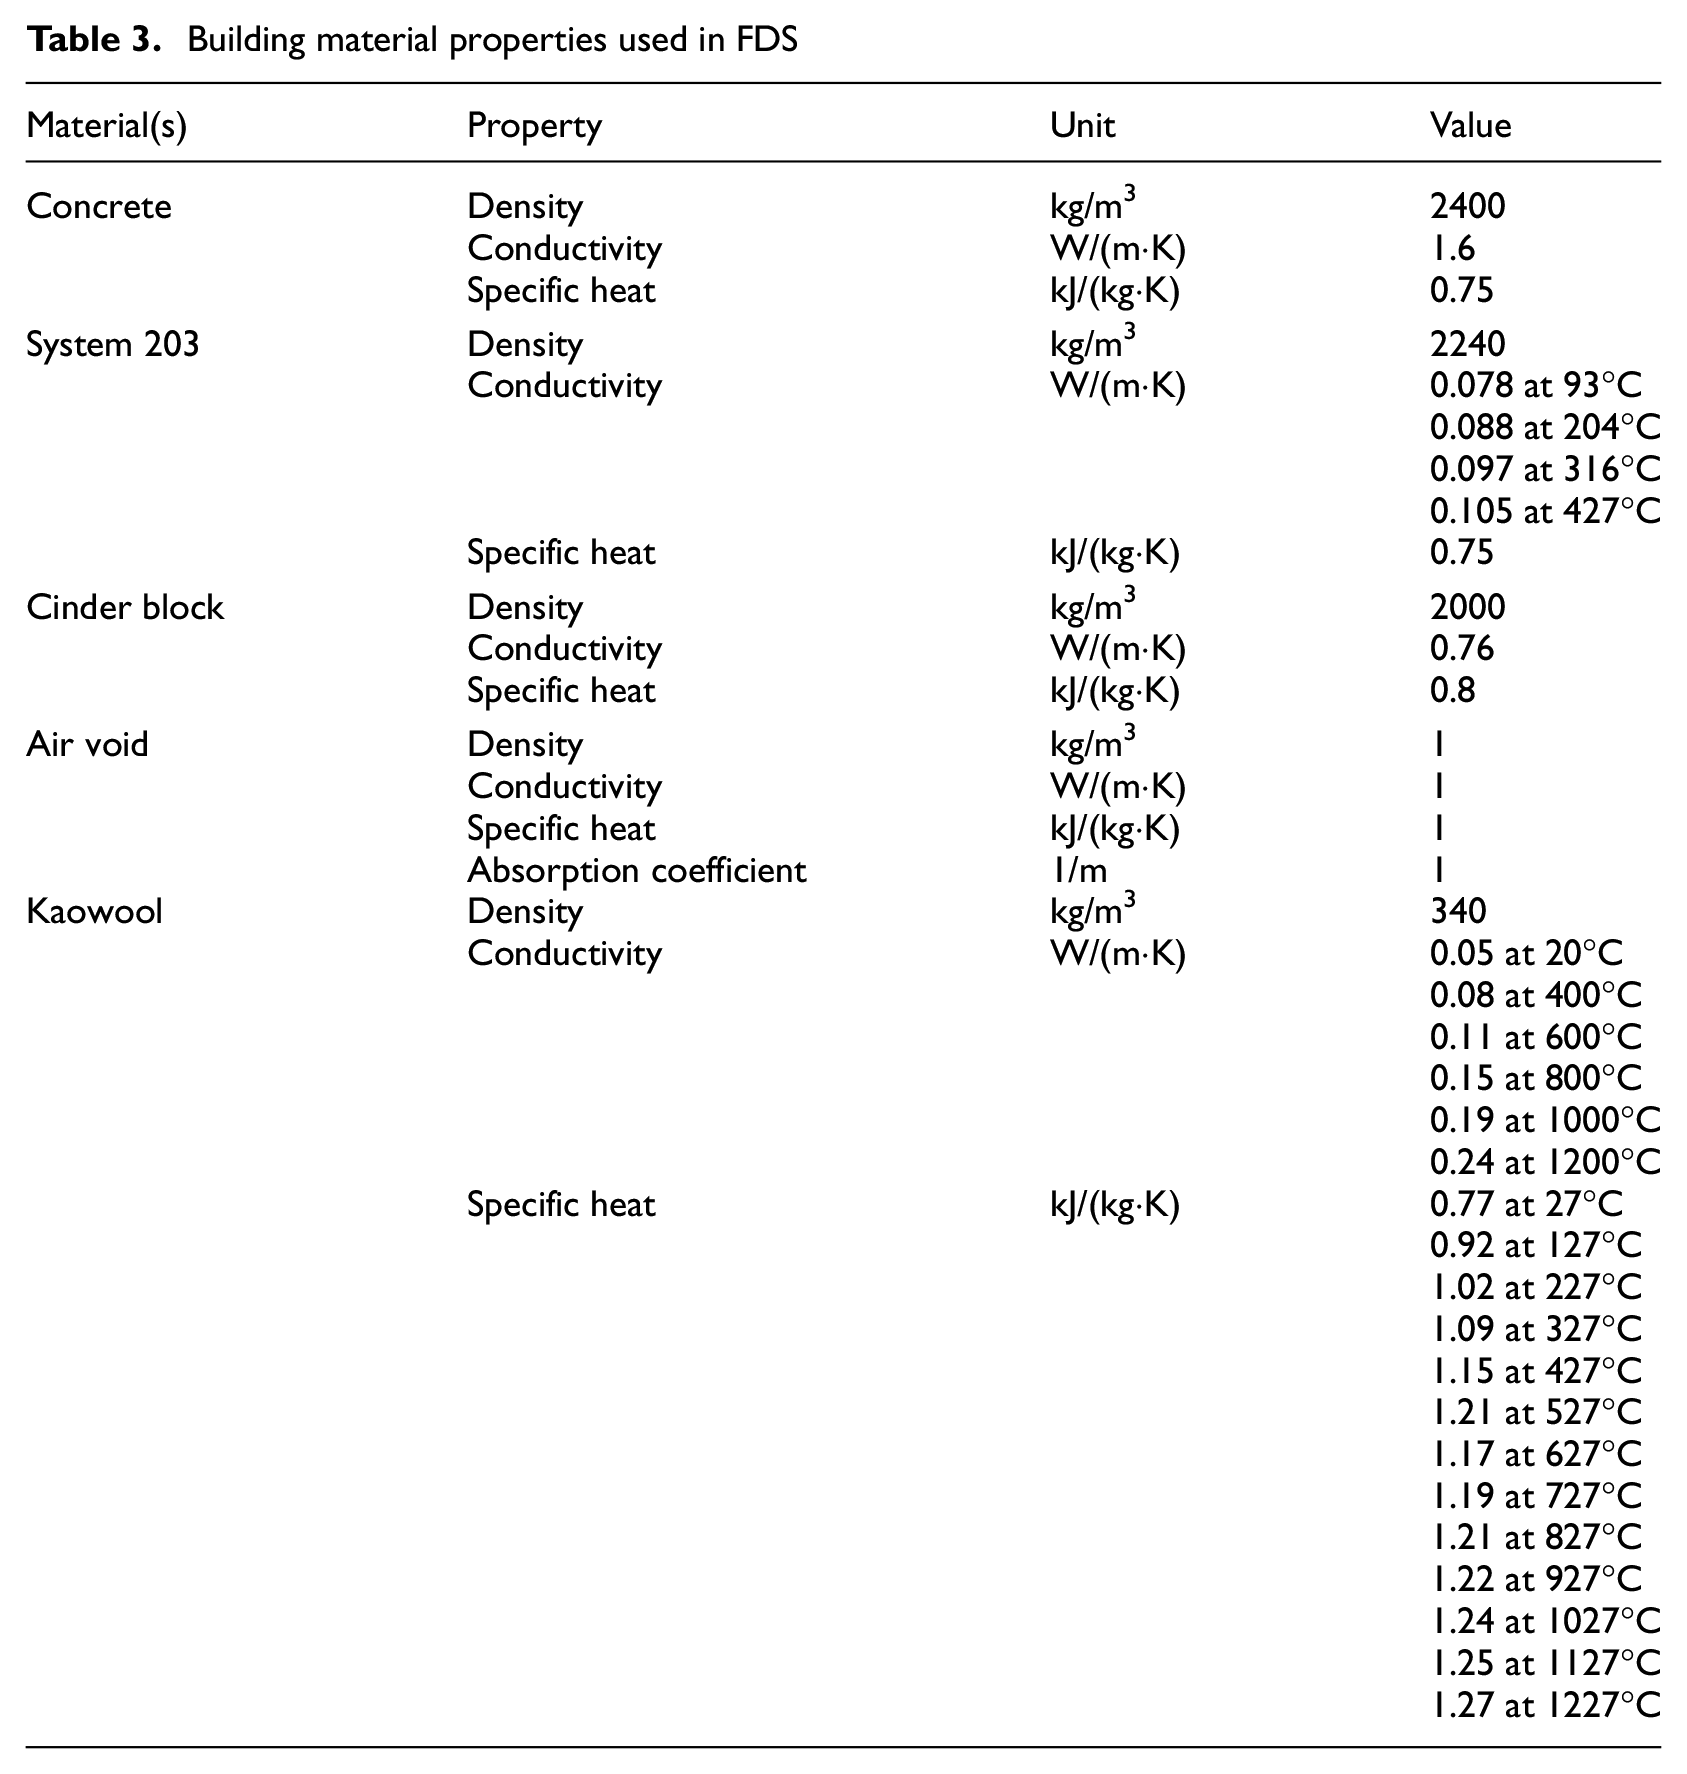
Other than the burn room, the floors and ceilings were modeled as 0.1 m (4 in) of concrete with 2.4 m (8 ft) wall heights, beams were modeled as 0.30 m (1 ft) of concrete, and the walls were modeled as concrete masonry unit (CMU) block (two 3.2 cm (1.25 in) layers of cinder block with an 14 cm (5.5 in) air gap). Subgrade outer walls and floors were given an additional 1 m layer of concrete which effectively provides for a semi-infinite slab representing the ground over the simulation duration. Material properties are provided in Table 3. The burn room was provided with protection against the heat from fires being set in the burn room. This consisted of a 2.5 cm (1 in) layer of Kaowool topped with a 5 cm (2 in) layer of System 203 fire resistant bricks (a product marketed for fire training facilities). This protection was applied to the ceiling, the beam running north–south through the middle of the burn room, the east wall, the north wall, and most of the south wall east of the beam. As a result, the ceiling height in the burn room was slightly lower than the ceiling heights elsewhere in the building.
Building material properties used in FDS
Modeling of the wood pallet fires
Two methods were used for modeling the wood pallet fires. The first method was a prescribed fire that was used for all but the last evolution in each scenario. Prescribed fires were necessary as it is not possible to add and burn away the same obstruction multiple times in FDS, that is, there could only be one evolution where pallets were added to the simulation. The second method was a predictive approach that was applied to the final evolution in each scenario. This was used instead of the prescribed fire to allow FDS to capture the effects on temperature of adding pallets over time especially for the last evolution were the instructor took a break while adding pallets. The pallets for the last evolution were only present for the last evolution as it was not feasible in FDS to have non-combustible obstructions be replaced by combustible obstructions.
The fuel molecule used in FDS was C1H1.8O0.9 which represents a sucrose molecule normalized to one carbon (cellulose, the major component of wood, is a polysaccharide). Fixed yields of 0.8% for CO and 0.4% for soot were used. The heat of combustion was defined as 14,660 kJ/kg based on cone calorimeter data for wood studs contained in the FSRI Materials Database.12,21 Default FDS parameters were used except that the number of radiation angles was increased from the default of 100–200 and the ambient temperature was set to 10°C when modeling the actual event. The FDS input files are provided as supplementary material.
Prescribed fire
The prescribed fires used the HRRs measured in the NIST open corner experiments 4 and 5 (Figure 8). The HRR for both experiments was extrapolated to 4500 s by fitting an exponential decay to the end of each experiment’s measured HRR. The two resulting curves were then averaged together. The averaged curve was used as the prescribed fire for each evolution (Figure 11(a)). The input HRR in FDS took copies of the averaged curve for each evolution and then added them together, offsetting the curves for the start times of each evolution (Figure 11(b)). It is recognized that the training facility does not have the same surface materials or amount of ventilation as the open corner experiments. Both of these would have an effect on the burning with the ventilation likely being the larger effect. However, the purpose of the prescribed fire is to approximate the heating and cooling cycles of the early evolutions to pre-heat the walls of the building prior to the evolutions of interest. The prescribed fire was applied as an HRR 21 per unit area to a 1.2 × 1.2 m2 (4 × 4 ft2) region of the basement floor in the corner where the wood pallets were placed. The region of the floor with the fire prescribed the thermal properties of concrete to allow it to heat up over time.
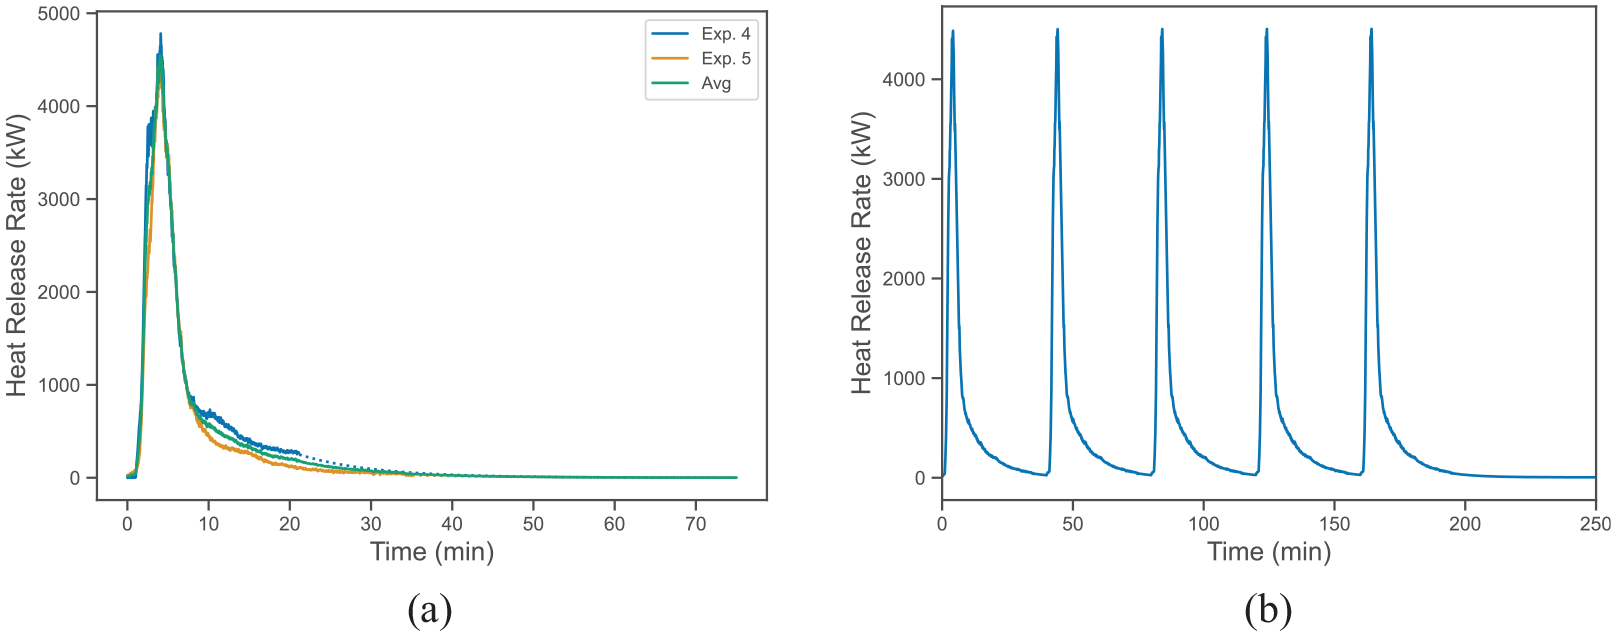
Plots of HRR for a single evolution where dotted lines are (a) extrapolated data and (b) five evolutions.
Predicted fire
For each scenario modeled, the final evolution had a predicted HRR. This required a modeling approach to predict the burning rate of a wood pallet. Wood stud data (a pine “2 × 4” sourced in the Baltimore, MD metro area) from the FSRI Materials Database (https://materials.fsri.org/) 21 were used to develop properties for the pallet model. PyroSim (a commercial graphical user interface for FDS created by Thunderhead Engineering) was used to create the geometry for the pallet model.
The flux-scaling approach was used for the pyrolysis model. This approach starts by modeling heat transfer into a solid. At a user-specified ignition temperature, a predetermined burning rate is applied to the surface. The heat transfer prediction continues with a heat loss term representing the heat of gasification applied. The predetermined burning rate is taken from cone calorimeter tests. In an actual fire of a wood pallet, the heat feedback to the pallet is not going to be identical to the flux imposed in the cone calorimeter test. To account for this, the flux-scaling approach uses the ratio between the FDS predicted heat feedback and the cone calorimeter conditions to scale the measured burning rate curve in both time and magnitude. Higher heat feedback increases the burning rate and decreases the burning time and vice versa. A brief summary of the method is given in the FDS User Guide 2 with full details in a paper from the 14th IAFSS Symposium. 11 The reference flux for the scaling approach was set to the cone flux, that is, no attempt was made to generate a flame-corrected flux.
The FSRI Materials Database was used to obtain the density (540 kg/m3), conductivity (0.76 W/(m·K)), and specific heat (0.8 kJ/(kg·K)) values for a wood stud. Simultaneous thermal analysis data (STA) from triplicate tests at a 10 K/min heating rate were used to obtain the heat of gasification for the wood. Cone calorimeter data from triplicate tests at 50 kW/m2 were used to develop burning rate and ignition temperature inputs for FDS. Wood samples were conditioned at 20°C and 50% relative humidity.
Figure 12 shows the effective specific heat as a function of temperature for the triplicate STA tests. Two peaks can be seen, one near 100°C and one near 350°C. The first peak is moisture being driven off and the second peak is the pyrolysis of the wood. The moisture content was ignored. The wood pallets used for the training evolutions were stored in the basement. By the final evolution, they would have been exposed for hours to elevated temperatures from the earlier evolutions. This would have helped to drive out moisture from the wood. A high moisture content was not likely present by the final evolution. The heat of gasification was estimated by integrating under the second peak for each STA test and averaging the results giving 208 kJ/kg.
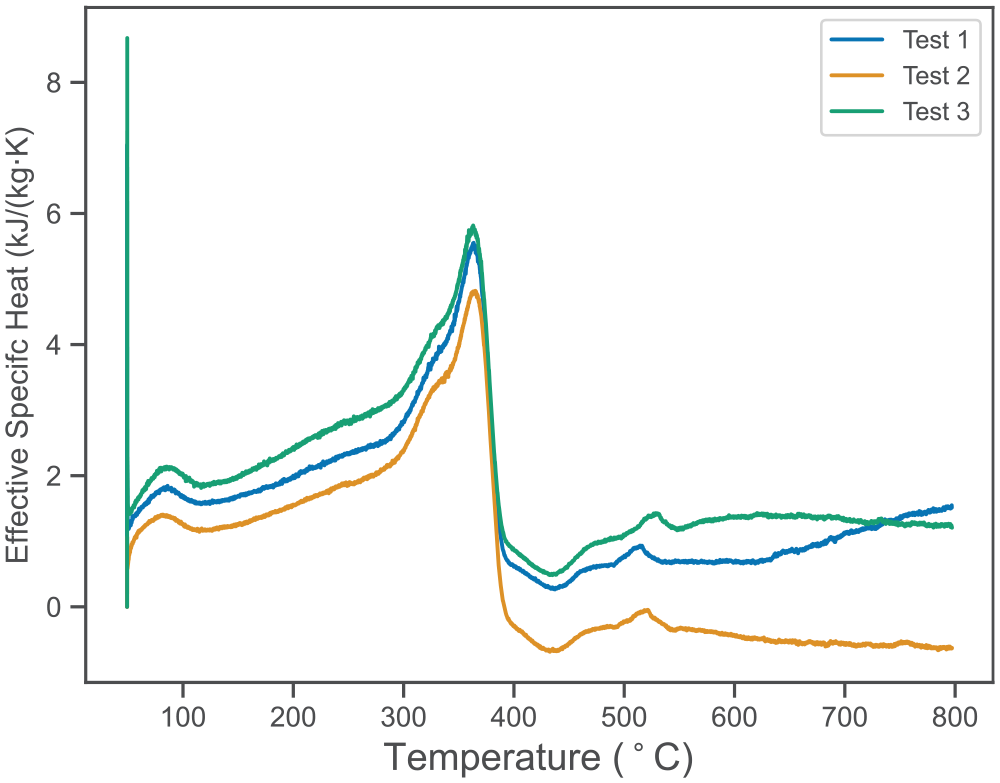
Effective specific heat from STA tests of pine studs.
Figure 13 shows the mass loss rate curves from the triplicate cone calorimeter tests. The reported ignition times for the three tests were 18, 17.5, and 14.25 s giving an average time of 16.6 s. An FDS model of the cone sample was created using the specific heat, density, and conductivity data described previously. A flux of 50 kW/m2 was applied to the surface. The surface temperature at 16.6 s was found to be 370°C. The cone heat release data were converted to the mass loss rate data using the cone test derived heat of combustion. This was done instead of using the measured mass as load cell data can result in noisy mass loss rate curves. The three mass loss rate curves were averaged and multiplied by the average heat of combustion to create an HRRPUA input for FDS (Figure 14).
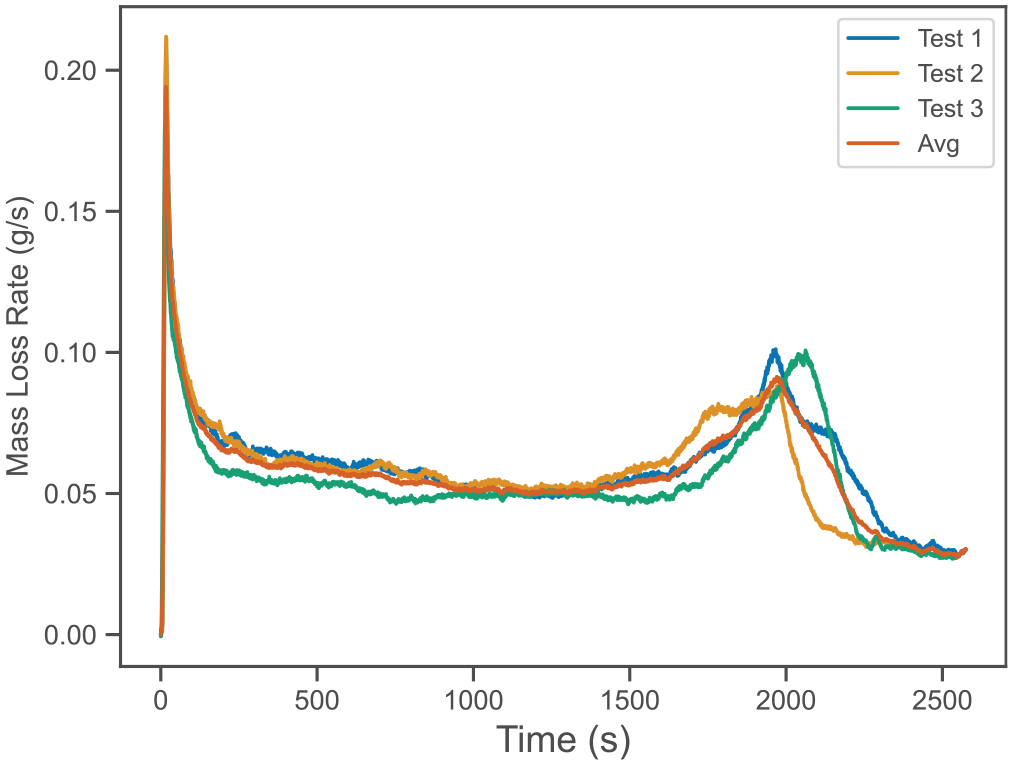
Mass loss data from 50 kW/m2 cone calorimeter tests of pine studs.
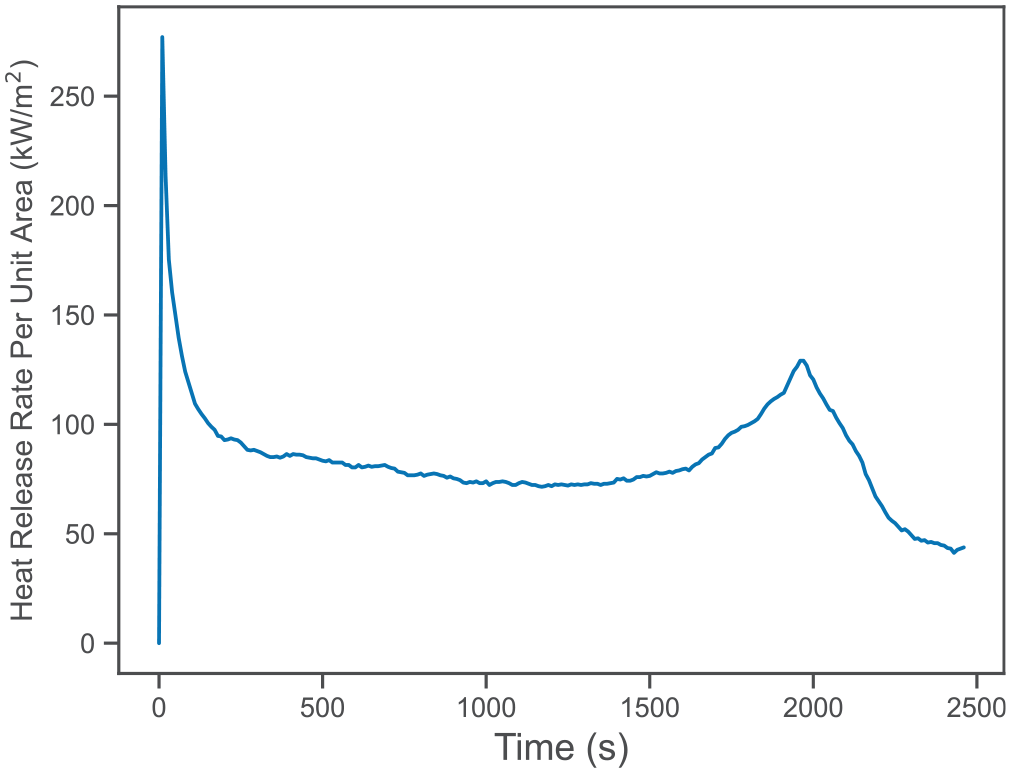
Wood HRRPUA input for FDS.
Exact details of the construction of the various wood pallets burned are not known. The geometry model for the wood pallets considers a notional wood pallet. This notional pallet is shown in Figure 15. The top and bottom boards are 76 × 7.6 × 2.5 cm3 (30 × 3 × 1 in). The stringers are 122 × 7.6 × 3.8 cm3 (48 × 3 × 1.5 in). Six copies of the pallets were made and rotated to a similar arrangement to that used in Tests 4 and 5 in the open corner tests performed at NIST (Figure 16(a)). The FDS voxelization is shown in Figure 16(b). The three types of lumber (top boards, stringers, and bottom boards) were assigned individual surface types in FDS. The FDS-voxelized sum of the volume for each surface type was determined for each pallet. Scaling factors were created for each surface type for each pallet for the FDS-voxelized volume versus the true volume. These scaling factors were used to set the BULK_DENSITY parameter in FDS for each obstruction defining the pallets. FDS performs independent, 1D heat transfer and pyrolysis for each exposed face of a pyrolyzing obstruction. BULK_DENSITY allows for the removal of a blocked grid cell when the sum of mass loss over all the faces results in the BULK_DENSITY times the cell volume. This process ensured that the actual fuel mass per pallet was preserved (this was assumed to be the fuel mass from the open corner tests 4 and 5).
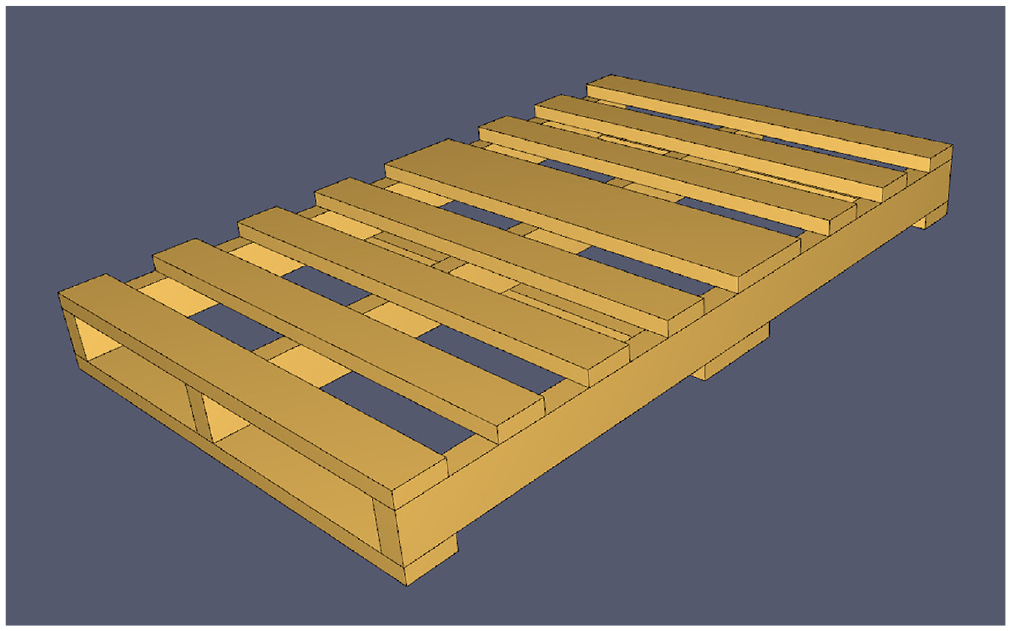
Pyrosim geometry of a single wood pallet.
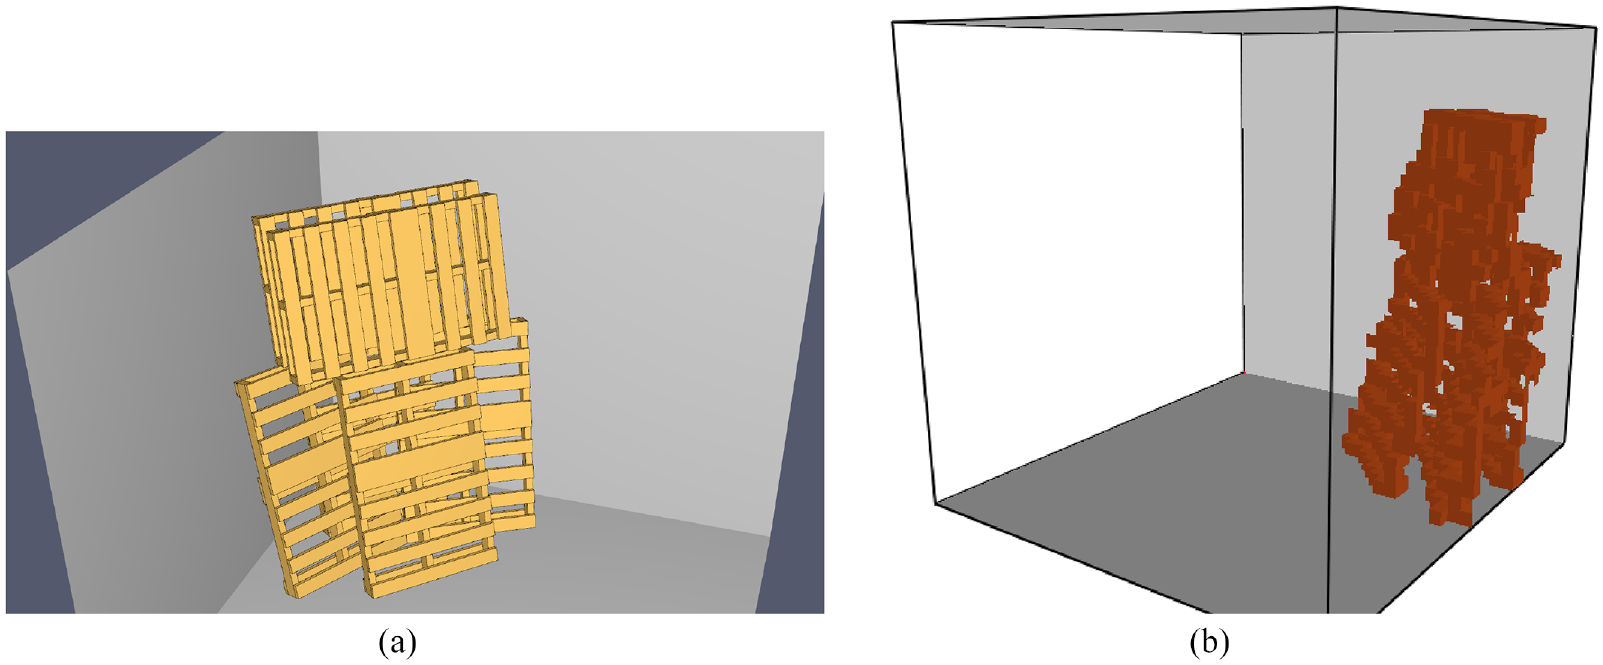
Geometry model of six pallets stacked in a corner as defined in (a) pyrosim and (b) as voxelized for FDS.
This modeling approach was validated by modeling the open corner experiments at NIST. In the NIST experiments, excelsior was packed in and around the pallets to aid in igniting the pallets. This was replicated in FDS by populating a block region with one particle per cell where each particle was assigned a burning rate representing the excelsior. Examination of the NIST data shows a different time to peak behavior for excelsior alone versus the combined excelsior and wood pallet experiments. This is due to the pallets acting as a heat sink and blocking flow through the excelsior which combined to limit the excelsior growth and burning rate. To account for this, the excelsior was assumed to be the dominant factor in the measured HRR up to 50 s where the HRR was 1200 kW. Following this, the excelsior was assumed to decay exponentially to 900 s. The exponential was fit to preserve the total excelsior mass. The pallet model was run at 3.8 cm (1.5 in) and 7.6 cm (3 in) grid resolutions with results shown in Figure 17. Results show little grid dependence. Both results are also similar to the experimental data in terms of peak width. The peak HRR is about 25% low; however, given the uncertainties in the actual fuel load and arrangement during the incident, the results are reasonable. Given the low-grid dependence, incident modeling used a 7.6 cm (3 in) grid.
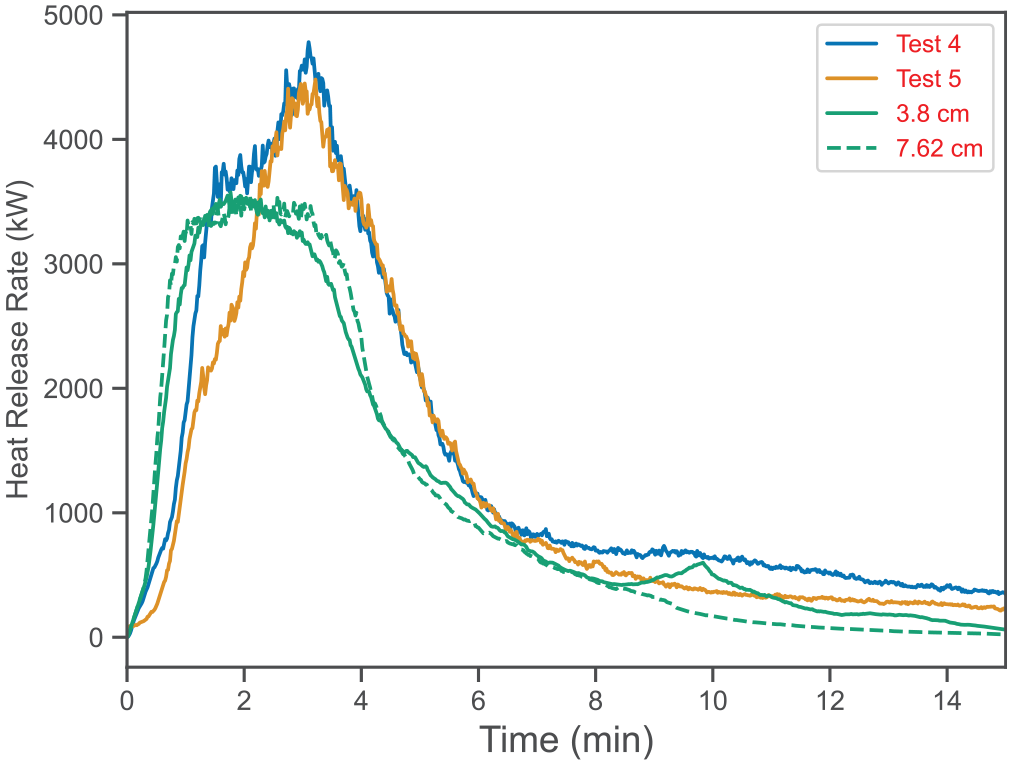
FDS-predicted HRR for an open corner pallet experiment.
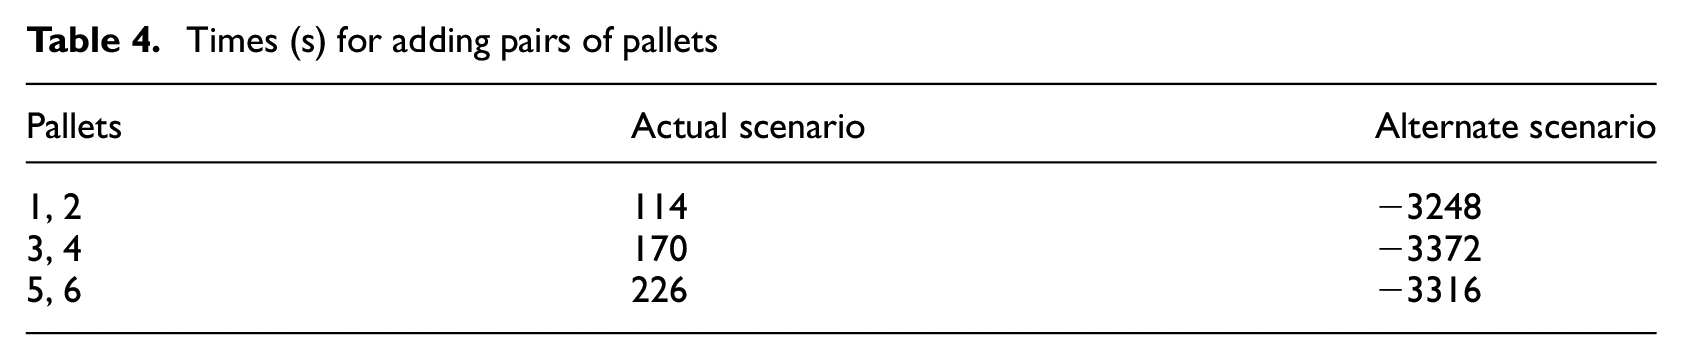
A modified approach was used for the the two evolutions modeled for the incident. At the training facility, only the first evolution started with all the pallets in place prior to ignition. For all other evolutions, pallets were added by hand, typically in pairs, onto the ember pile on the floor from the prior evolution. The timing of loading the pallets reflects the timeline of picking up pallets from the storage location, bringing them into the fire room, placing them in the corner, and repeating for additional pairs of pallets. The pallet addition times for the two scenarios are shown in Table 4. As a reminder, the start times of the fifth and sixth evolutions were respectively −3542 and 0 s. At the start of each new evolution, the FDS-prescribed fire was too low in HRR at these times to ignite the pallet on its own. In reality, there is a bed of embers that served to ignite the pallets; however, that bed was not represented in the FDS model since the fire up to the last evolution was prescribed. To ignite the pallets for the final evolution, 30 s after the first pair of pallets was added a 0.91 × 0.91 m2 (3 × 3 ft2) region of the prescribed fire below the pallets was given a 100 kW fire with a 30-s t 2 ramp that lasted for 14 min before decaying with the same t 2 ramp. This provided sufficient energy to ignite the pallet stack while still being relatively small compared to the peak burning rate of the pallet stack.
Times (s) for adding pairs of pallets
Facepiece model
SCBA facepieces are made of polycarbonate (PC) plastic. PC combines good strength and impact resistance with good optical qualities. As a result, PC is widely used in eye wear and faceshields. PC undergoes glass transition in the range of 140°C–150°C. After glass transition, the material softens, and sufficient continued heating will begin to flow. Note that a PC facepiece does not immediately fail at the glass transition temperature, but at a higher temperature when softening results in the facepiece yielding due to applied forces.
Facepiece properties
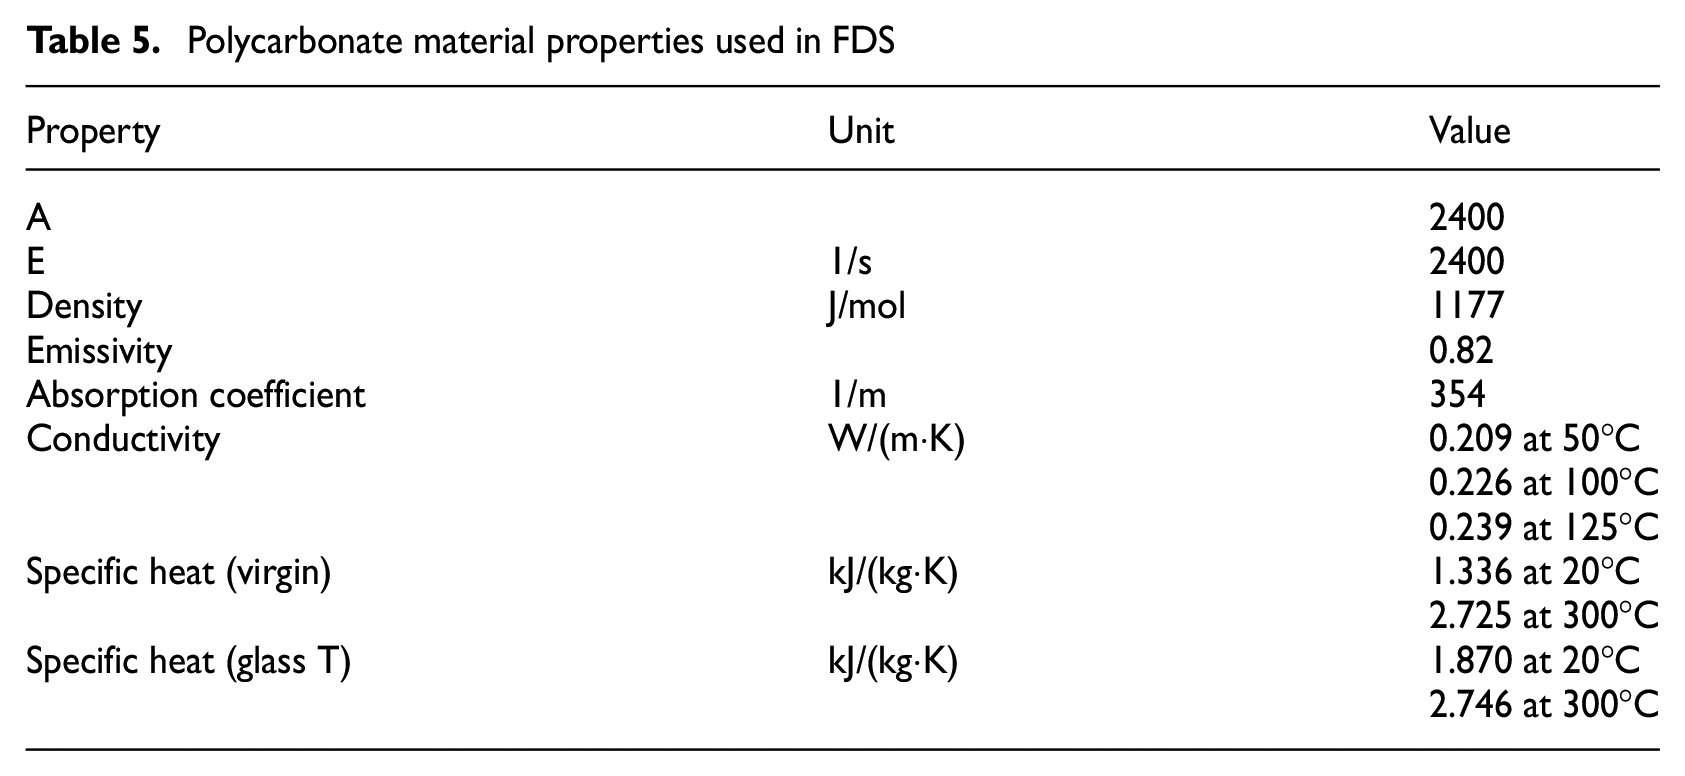
A sample of an NFPA 1981, Standard on Open-Circuit SCBA for Emergency Services, 2007 edition 22 compliant facepiece was tested to obtain properties. This testing provided density and conductivity data (ASTM E1461 Flash Method) for the facepiece. PC data from the FSRI Materials Database were used to determine the absorption coefficient and emissivity for radiation heat transfer. PC STA data from the database were used to determine specific heat and the glass transition reaction parameters. Six STA tests had their effective specific data averaged (Figure 18(a)). A linear fit of specific heat was performed above and below the glass transition peak and the area under the peak was calculated to determine the glass transition energy. The built-in optimizer in Microsoft Excel was used to determine the peak temperature and peak width which were then used to determine the Arrhenius kinetic constants for the glass transition following the formulas in the FDS User Guide. 2 The optimizer looked at the least square error between the measured and calculated differential scanning calorimetry (DSC) signal with results shown in Figure 18(b). The resulting PC properties are shown in Table 5.
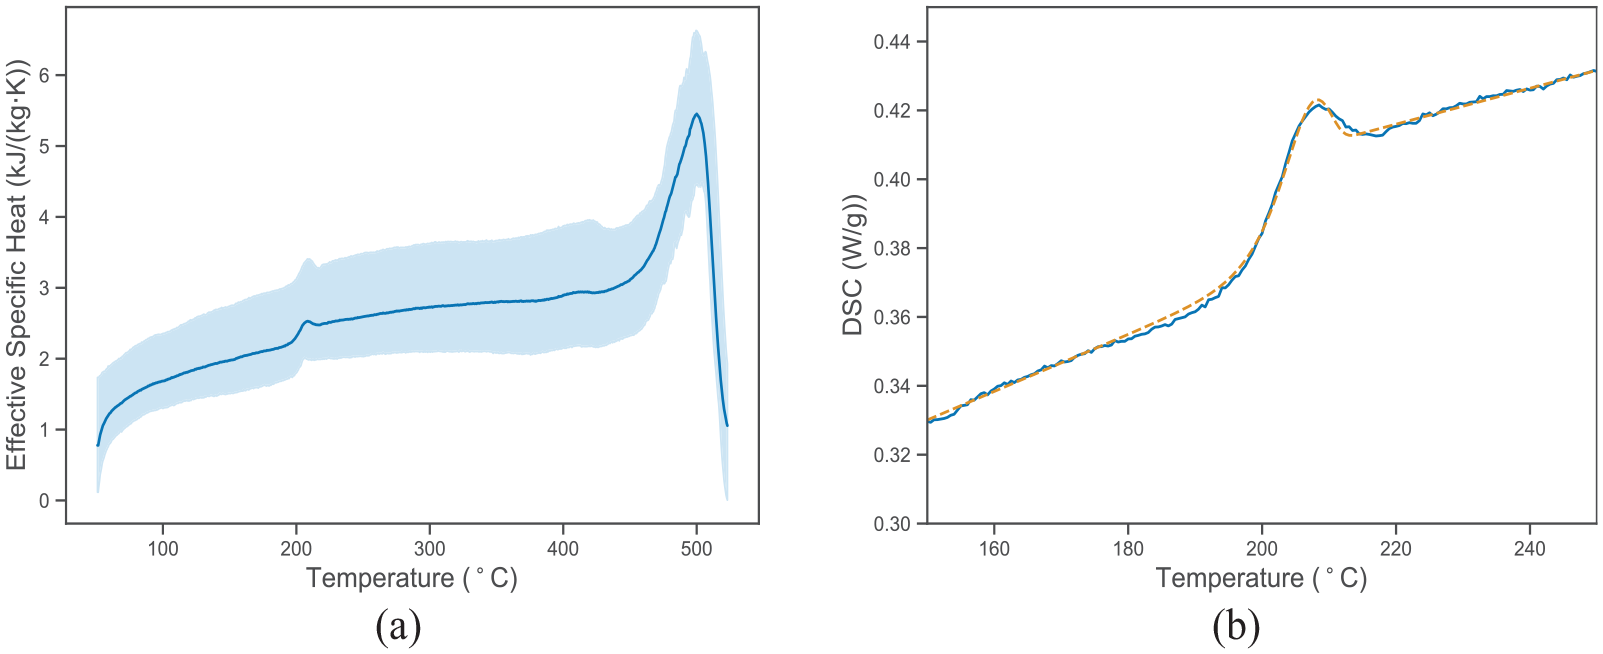
STA data for (a) polycarbonate and (b) result of kinetics fit for gasification.
Polycarbonate material properties used in FDS
Facepiece path and orientation
Assessing the hazard, the fire conditions posed to the instructor’s facepiece involved evaluating the time-dependent exposure of that facepiece and whether or not that exposure had a significant risk of facepiece failure. This was done using Lagrangian particles. In FDS, a Lagrangian particle can be assigned a solid surface boundary condition, in this case, the thickness and properties of the PC faceshield plus the non-fire side conditions. A Lagrangian particle can also be provided both a time-dependent path and a time-dependent orientation. Two Cartesian (e.g. plate) particles were created with one particle having a 2.2-mm thickness representing an NFPA 1981–2007 compliant facepiece and the other a 4.1-mm thickness representing an NFPA 1981–2013 compliant facepiece. The backside boundary condition was set to 30°C with a heat transfer coefficient of 10 W/(m·K). The particle was given the path and orientation in Table 2 with a height of 1.8 m (6 ft) above the floor except for the rest period where the particle was 0.3 m (1 ft) above the floor and post-collapse where the particle was 0.15 m (0.5 ft) above the floor.
Facepiece hole formation
Facepiece hole formation criteria were developed using facepiece tests conducted by Mensch et al. 23 and Kessler. 14
Mensch et al. 23 conducted experiments where NFPA 1981–2007 22 facepieces were exposed to fire-generated exposures from furniture fires in a townhome. In the tests, a headform was outfitted with an SCBA facepiece, nomex hood, and a firefighter helmet. The headform had a mouth opening where air flowed through at a rate of 40 L/min. Thermocouples were attached to the fire side and face side of the the facepiece along with the gas inside and outside the facepiece. Eight facepieces types were exposed during testing with thicknesses between 2 and 3 mm. Exterior temperature measurements show that at peak exterior temperatrures above 265°C, that damage was observed (bubbling or worse). In one test, a facepiece melted. The interior gas thermocouple shows a sharp rise in temperature which is likely due to the facepiece loosing its integrity. The exterior and interior facepiece surface temperatures were, respectively, 270°C and 240°C.
Kessler 14 exposed three facepieces mounted on a breathing headform to constant heat fluxes ranging from 5 to 20 kW/m2 for 30 min. Two were compliant with NFPA 1981–2007 (2.2- and 2.6-mm thick), and one was compliant with NFPA 1981–2013 24 (4.1-mm thick). Facepiece surface temperature was not measured; only gas temperature behind the facepiece and in the airway and pressure behind the facepiece were measured. Three tests for each facepiece were performed at heat fluxes of 5, 10, 15, and 20 kW/m2. Neither the 2007 nor the 2013 facepieces had hole formation at 5 or 10 kW/m2. At a radiant flux of 15 kW/m2, the 2007 facepiece had hole formation at 4.7 min for the 2.2-mm facepiece (incident energy of 4.2 MW/m2) and 3.2 min (incident energy of 2.8 MW/m2) for the 2.6-mm facepiece. The 2013 facepiece did not have hole formation. At a radiant flux of 20 kW/m2, the 2007 compliant facepieces had holes open in the lens at 1.8 and 1.9 min (incident energy of 2.2 and 2.3 MW/m2) and the 2013 at 7 min (incident energy of 8.4 MW/m2).
An FDS solid-phase model was created using the properties identified previously and the facepiece thicknesses from the Kessler study. At the hole formation time for 20 kW/m2 measured in the Kessler study, the FDS-predicted front and backside temperatures for the 2.2-mm thick facepiece were, respectively, 238°C and 219°C. For the 4.1-mm thick facepiece, the front and backside temperatures were, respectively, 272°C and 256°C. At 15 kW/m2, the 2.2-mm FDS-predicted front and backside temperatures were, respectively, 272°C and 256°C. The higher temperatures at 15 kW/m2 are consistent with the higher incident energy given the exposures and times. Failure is not as simple a mechanism as reaching a single threshold temperature; however, since the predicted 2.2-mm temperatures are similar to those measured in the Mensch et al.’s tests, in the LODD modeling, hole formation was assumed at the earlier of the front surface reaching 270°C or the back surface reaching 240°C.
Fire model results and analysis
HRR
Figure 19 shows the FDS-predicted HRRs for the Evolution 5 and Evolution 6 scenarios. During the prescribed fire portion of each simulation, it can be seen that the FDS HRR is a broader, lower peak than the prescribed input. This is not unexpected as the input data came from a well-ventilated, open corner burn unlike the Pennsylvania facility burn room which had a limited flow path for ambient air to reach to fires. The FDS results indicate more vitiated conditions in the fire room of the facility than in the open corner experiments. The predicted portion of the Evolution 6 scenario shows an initial peak HRR of a little over 3 MW followed by a relatively steady burning period at 1.5 MW.
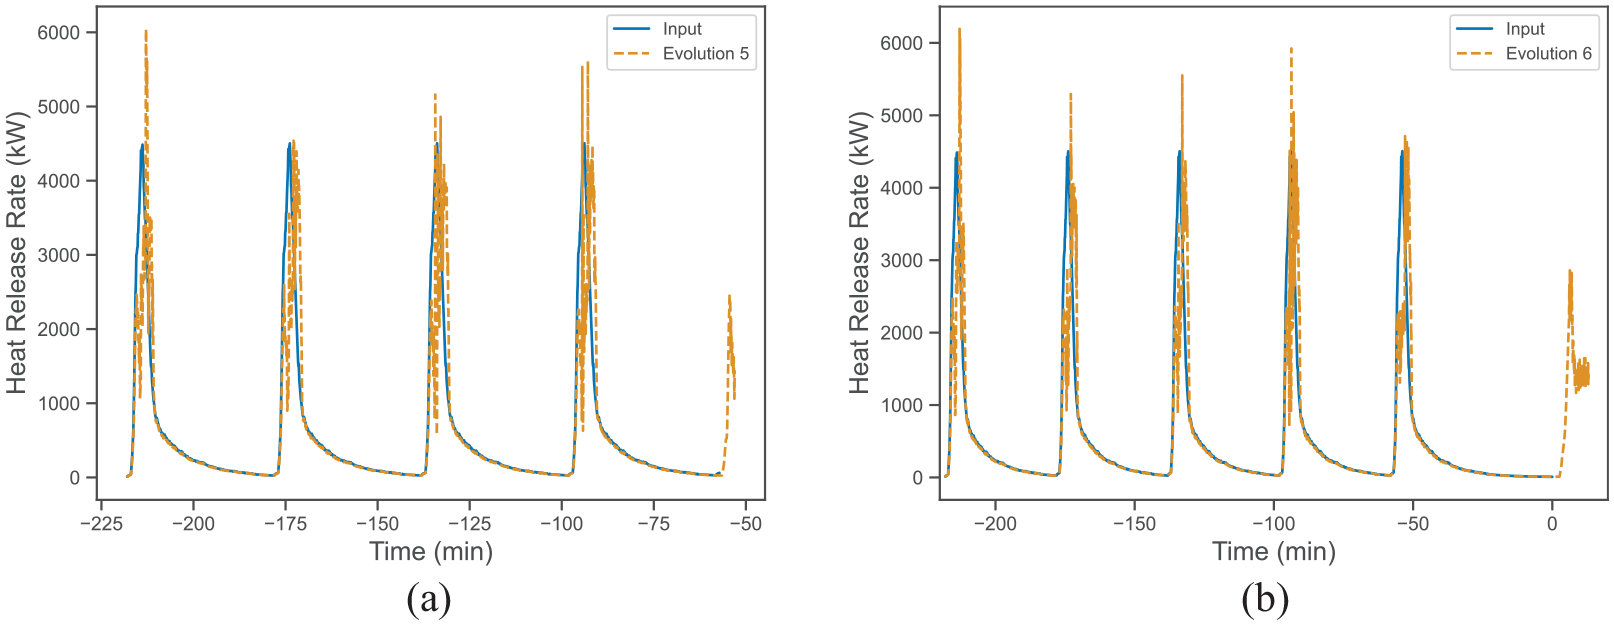
FDS-predicted HRR for (a) Evolution 5 and (b) Evolution 6 scenarios.
Heat fluxes and gas temperatures
Figure 20 shows the FDS-predicted temperatures and heat fluxes at Tree 2. These are the same locations plotted in Figure 6. During the five pre-heating evolutions, FDS predicted higher upper layer temperatures and a much deeper lower layer along with correspondingly higher heat fluxes. This was a result of prescribing the fire using the open burn data. This did not account for any reduction in fire size due to less ventilation in the basement burn room than in the open corner test or the likely slower fire growth for follow evolutions ignited using embers instead of excelsior. However, the simulation goal of the pre-heating evolutions was to create similar thermal conditions at the start of the sixth evolution. The pattern of slowly rising ambient conditions between evolutions was seen in the FDS predictions. Between Evolutions 1 and 5, the initial lower temperatures in the FDS predictions increased by 110°C. In the NIST testing, the temperature rise after a similar total burn time was 80°C.
FDS-predicted (a) temperature and (b) heat flux for the full incident.
For the sixth evolution, temperatures and heat fluxes were initially higher than seen in the NIST data. The approach used to rekindle the fire may have been too strong. After the initial burst of fire growth, temperatures and heat fluxes dropped to similar values as seen in the final evolution in the NIST data.
Wall temperatures and burn patterns
Figure 21 shows the temperatures of the burn room walls at the start of Evolutions 3 through 6. The 200°C contour is highlighted in each image. It can easily be seen that each successive evolution from 3 to 5 had more heat stored in the walls as the highlighted contour shows expanding area. From Evolutions 5 to 6, there was a slight drop in wall temperature at the start; however, a break was taken after Evolution 5 which gave 20 min more time between evolutions. At the start of Evolution 5, ceiling temperature over the fire location ranged 230°C–250°C. At the start of Evolution 6, temperatures were 215°C–230°C.
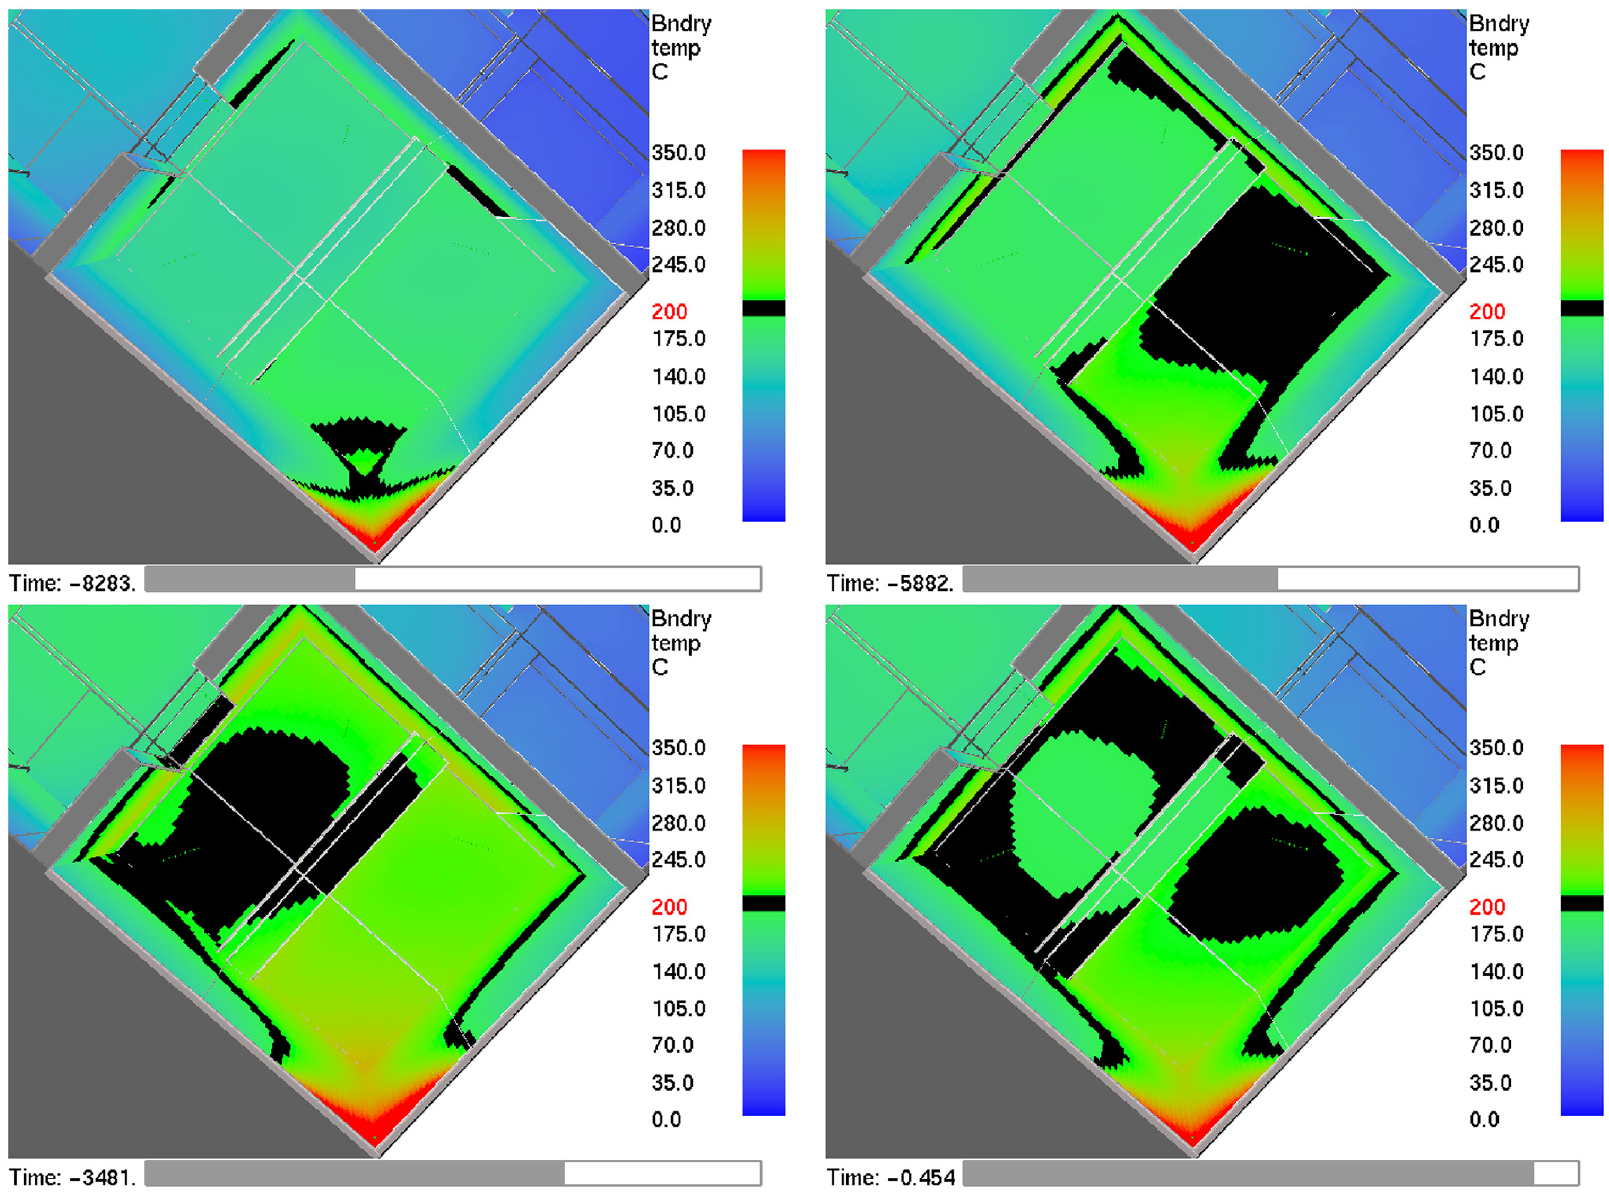
FDS-predicted wall temperatures. View looking up at burn room fire corner. Time points are the start of Evolutions 3–6 (clockwise from top left). Black contour is 200°C.
One of the observations made after the onsite experiment was the presence of a well-defined clean burn area as shown in Figure 22. This area covered the upper half of the walls east of the beam in the burn room and included the ceiling and beam bottom. The region extended west of the beam by distance similar to the width of the beam. As part of soot deposition work performed for the National Institute of Justice, Hartman et al. 25 performed thermogravimetric analysis (TGA) measurements for soot at different oxygen concentrations. At 21% oxygen, clean burn ends at approximately 650°C, approximately 675°C at 10% oxygen, and approximately 730°C at 2%. Figure 23 shows the wall temperatures near the end of quasi-steady burning of the pallets. The temperature range shows temperatures from 500°C to 750°C which corresponds to the range of temperatures with soot oxidation seen in the work by Hartman et al. The figure shows that the region within the range of temperatures needed for oxidation corresponds to the clean burn region shown in the photographs.
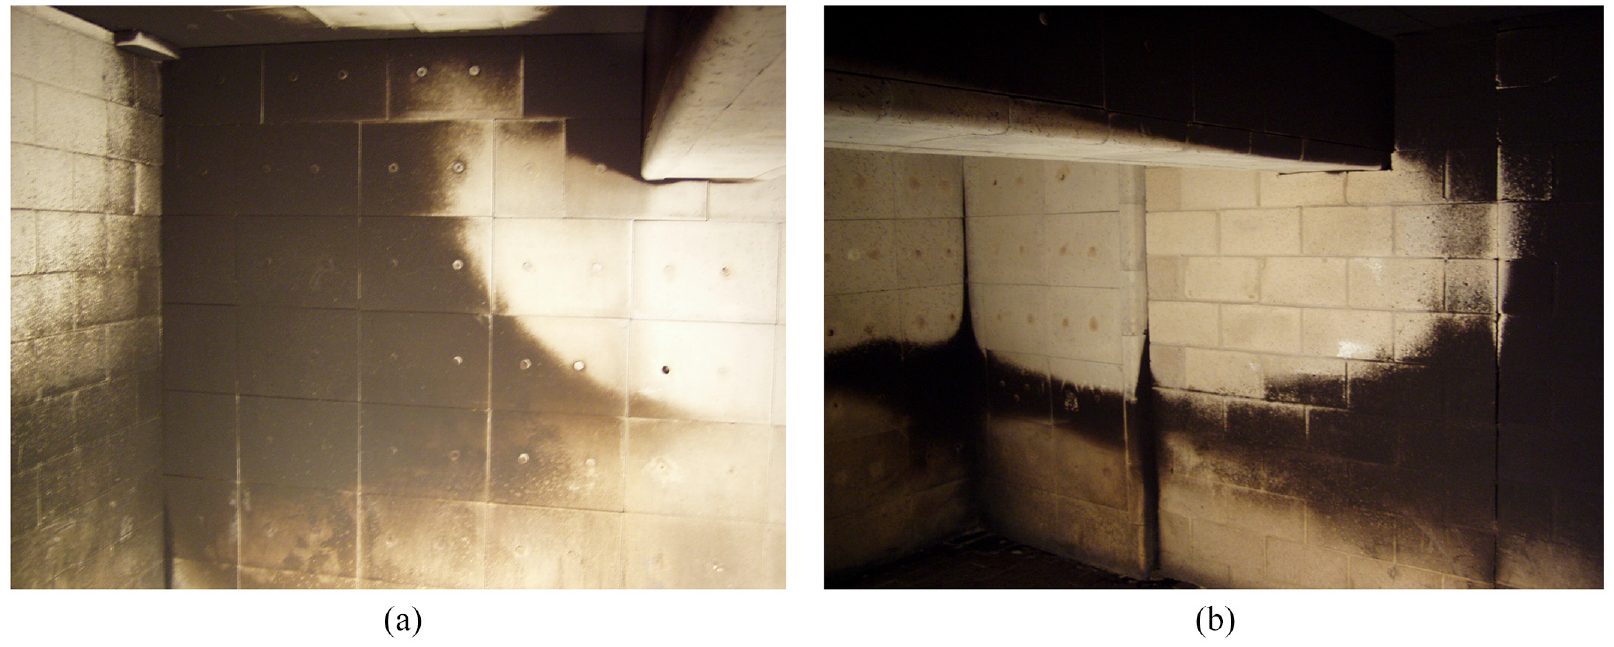
Clean burn patterns in the burn room after NIST onsite experiment (a) North wall (b) South wall.
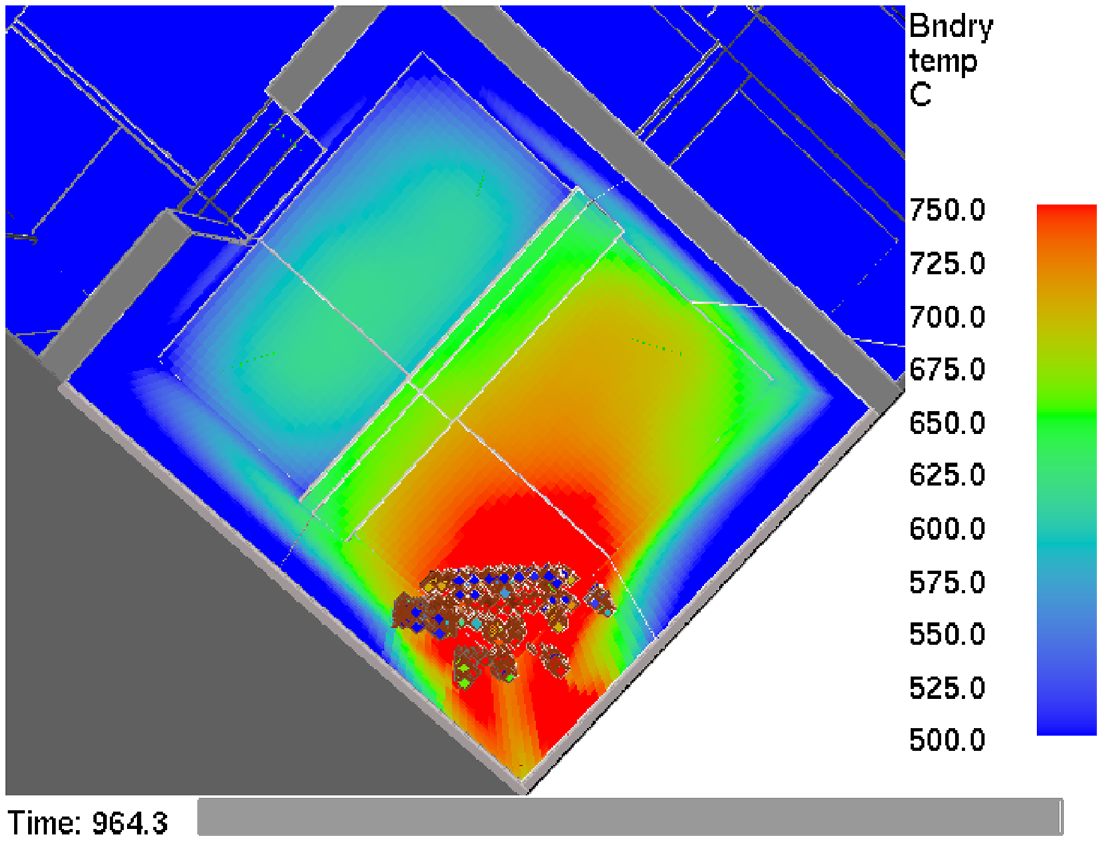
FDS-predicted wall temperatures at the end of quasi-steady pallet burning for Evolution 6.
Facepiece exposure and damage
Figure 24 shows the FDS-predicted heat flux and gas temperature seen by the facepieces. The fifth evolution had its time shifted to start at 0 s. Both evolutions started with a rising exposure as the instructor entered the building and went into the basement. There were spikes in exposure near 2 and 3 min when the first two pairs of pallets are added. The sixth evolution exposure was initially lower due to the longer time between the fifth and sixth evolutions than for the fourth and fifth. For the third pallet pair near 4 min, the fire had started spreading over the first four pallets and the exposure had increased significantly. For the fifth evolution, the instructor left the burn room after placing pallets to await the trainees. There was an initial drop in exposure as the instructor leaves the room followed by spikes as the fire saw periods of growth and decay due to ventilation-limited burning. Some of these spikes are artifacts of the FDS extinction model as the default autoignition temperature in FDS of 0 K was not changed; however, conditions outside the fire room after loading pallets are not the primary objective of the modeling. For Evolution 6, after the third pallet pair, the instructor returned to the first floor for a break. The exposure dropped significantly during the time period. Near 7 min, the instructor entered the burn room for the final time. The fire had continued to grow and sustained high exposures were seen as the instructor entered the room and collapsed shortly after remaining in the room.
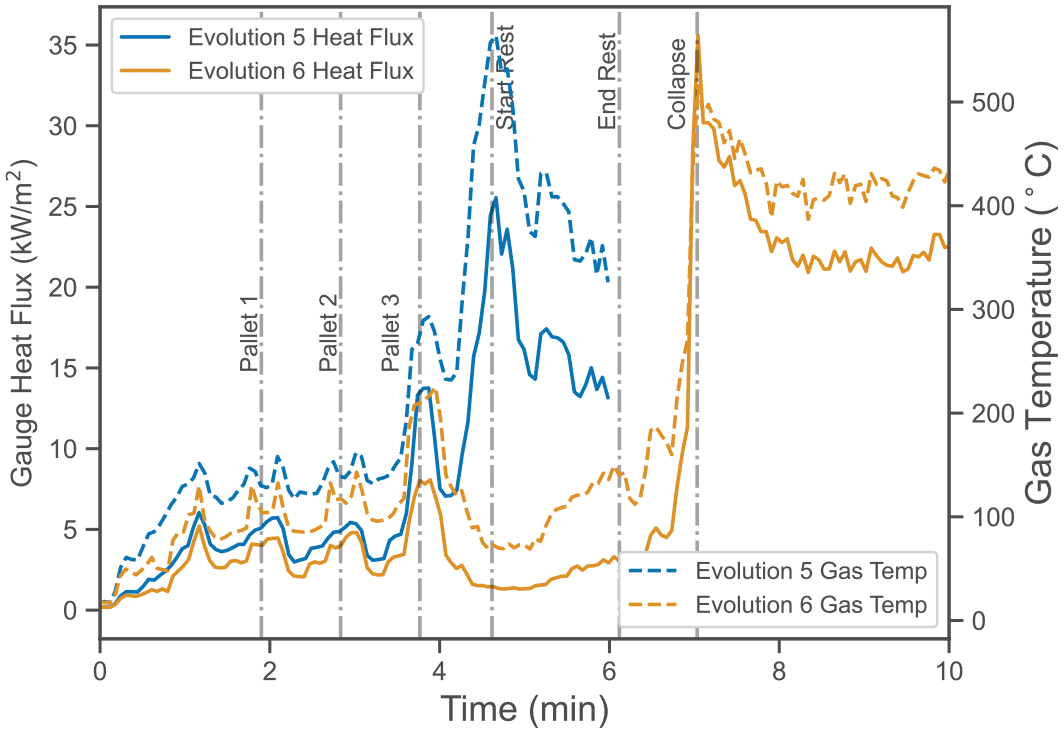
FDS-predicted facepiece gas temperature and heat flux exposure.
The data from Figure 24 were used to generate the thermal exposure classes developed by Weinschenk et al. 13 The exposure classes are 0 = Routine, 1 = Ordinary I, 2 = Ordinary II, 3 = Emergency I, 4 = Emergency II, and 5 = Emergency III. Figure 25 shows the resulting thermal exposure class to the facepieces for both evolutions. As with the prior figure, times shifted so both evolutions start at 0 s. For the first two additions of pallets, the exposure class was low (either Routine or Ordinary). For the third addition, the exposure class had jumped to Emergency II for both cases with a slight delay for the sixth evolution which started at lower temperatures. The fifth evolution saw a brief spike to Emergency III. Emergency III is an exposure beyond the limit to which protective gear is currently tested (the limit is Emergency I). Only brief exposures, seconds, at this limit are tolerable. In the case of adding pallets, there would only be a brief exposure provided there were no delays in quickly entering the burn room, adding a pallet, and leaving. These conditions indicate that training scenarios involving prolonged addition of fuel have an inherent exposure risk. Based on the temperature and heat flux results in Figure 20, these exposures were overpredicted; however, even the NIST onsite experimental data in Figure 6 show Emergency II conditions in the burn room once the pallets are burning and brief peaks to Emergency III.
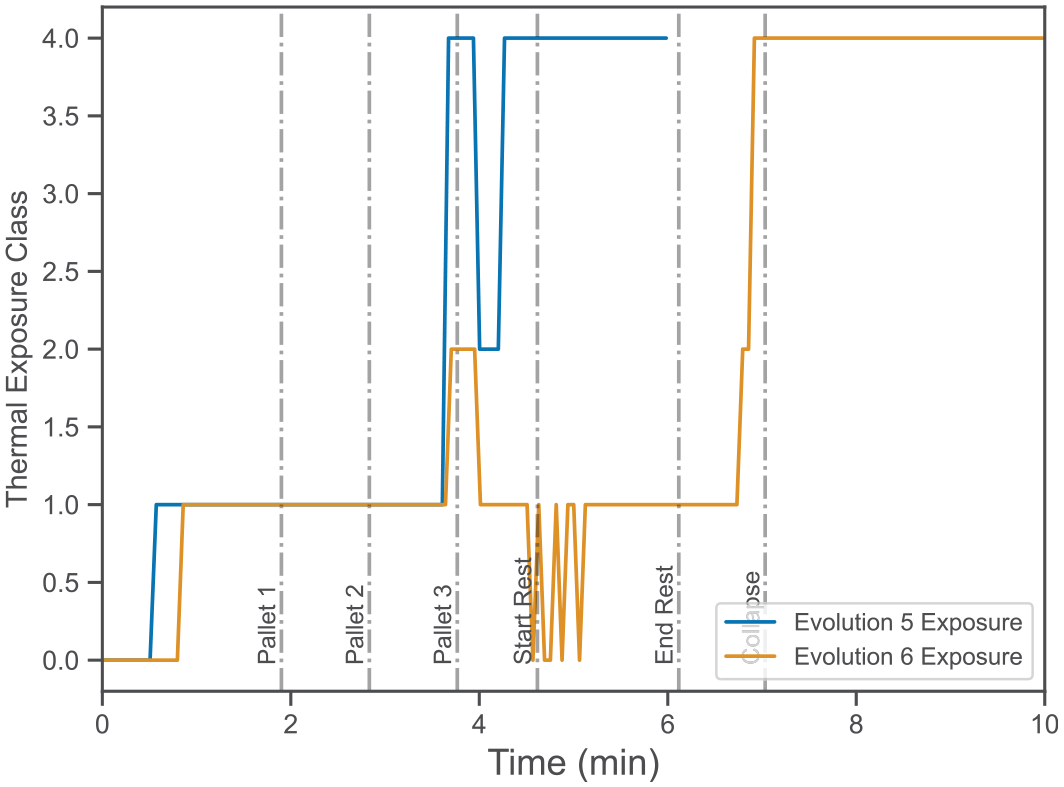
Thermal exposure class based on FDS-predicted conditions.
Figure 26 shows the FDS-predicted front and backside temperatures of the two thicknesses of facepiece. In the fifth evolution scenario, the instructor finished loading pallets and exited the fire room by 4 min. Neither the NFPA 1981–2007 facepiece nor the NFPA 1981–2013 facepiece reached the hole formation criteria during the fifth evolution. This is consistent with the events of that day where the facepiece did not fail during the fifth evolution. In the sixth evolution scenario, neither facepeice reached the hole formation criteria at the estimated time of collapse. The NFPA 1981–2007 reached the criteria 1.1 min later, and the NFPA 1981–2007 reached the criteria in 2.5 min.
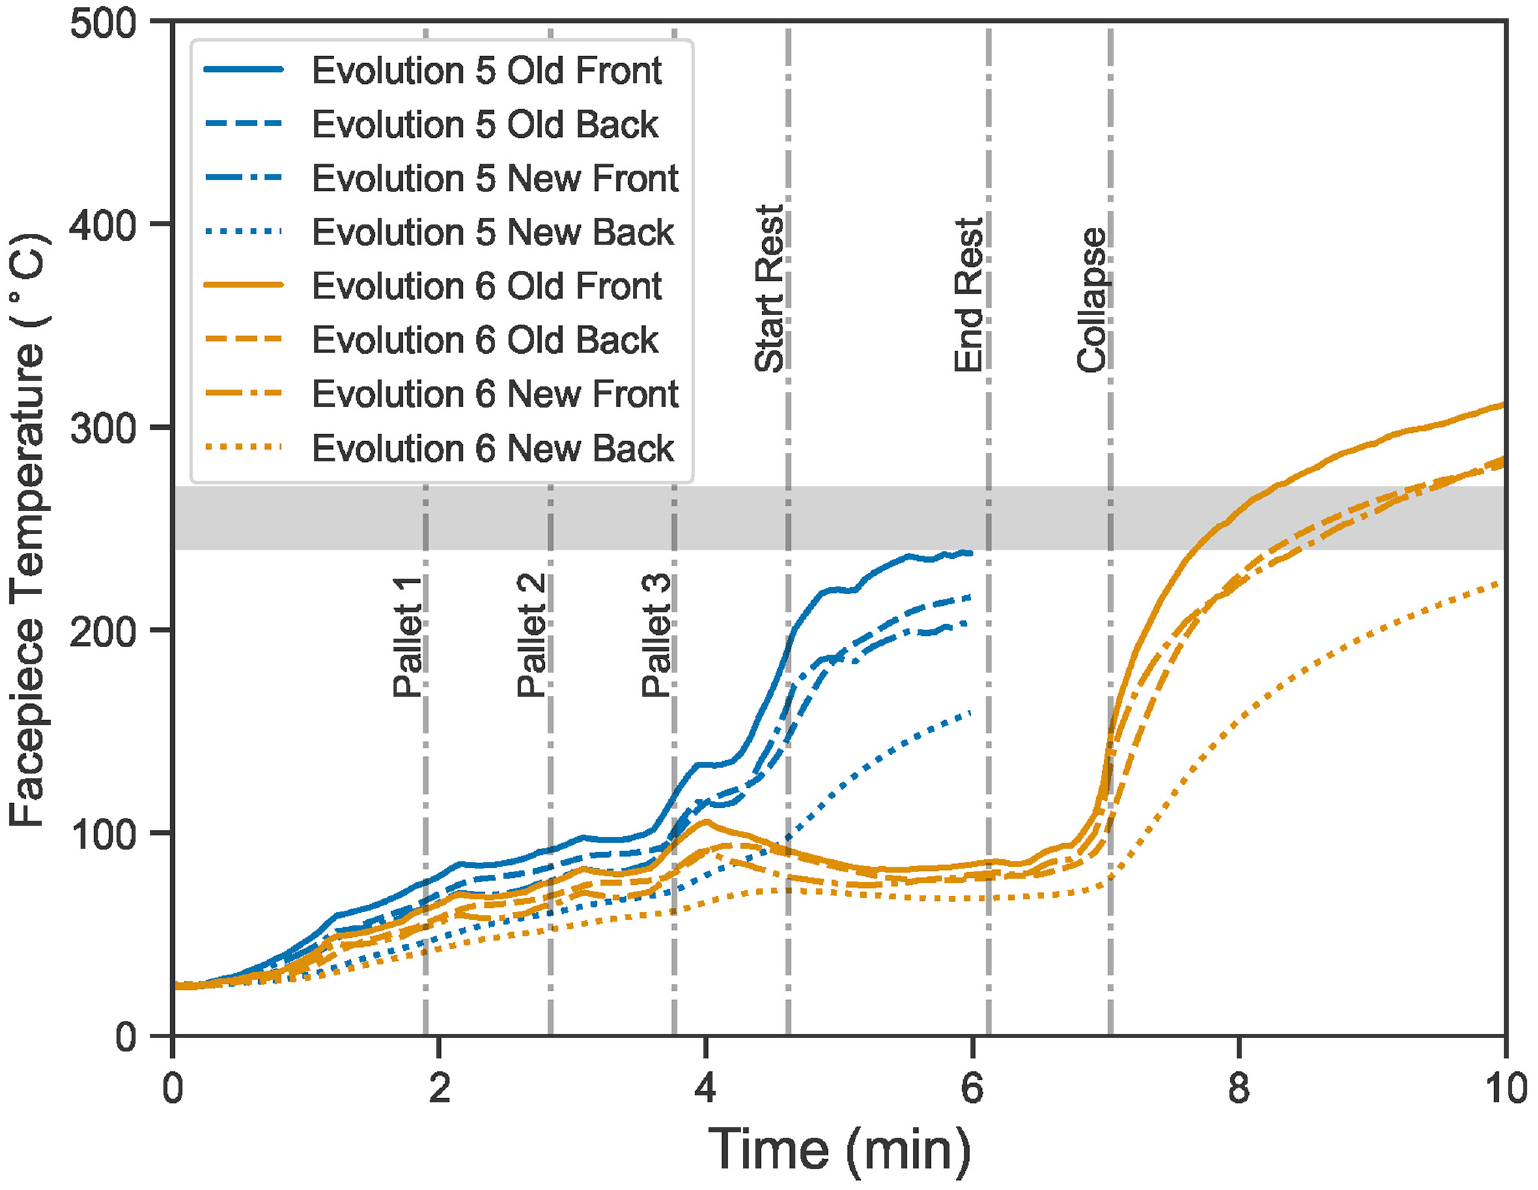
FDS-predicted facepiece front and backside temperatures. Shaded region is between the front (270°C) and back (240°C) hole formation criteria.
The predictions, however, have some uncertainty associated with them. There is the reported predicted uncertainty for temperature and target heat flux of 10% and 55% respectively. 26 There is additional uncertainty from the use of the SBPyro model, which has a reported error of 15%, 11 the exact time the instruction collapsed, and the impact of the existing damage to the facepiece, Figure 4, on the failure criteria.
The predictive uncertainty of FDS was examined by modeling in post-processing alternate exposures to the two types of facepiece. The uncertainty of the SBPyro model was propagated into the temperature and heat flux uncertainties resulting in updated uncertainties of 14% and 68%. These uncertainties were used to create a new set of time-dependent gas temperature and incident radiative flux for the facepieces at various cumulative probabilities for the error distributions. For example, at the 95th percentile, the temperature rise and radiative flux over time would be increased respectively by factors of 1.26 and 2.18. These exposures along with the FDS-predicted front-side heat transfer coefficient were then used in a solid-phase only model of the facepieces at the various cumulative probabilities.
For the fifth evolution scenario, at the 99th percentile, the NFPA 1981–2007 and NFPA 1981–2013 facepiece front-side temperatures were, respectively, 207°C and 177°C at the time the instructor was leaving the room. It would take an additional 30 or 50 s in the room to reach the hole formation criteria. Even accounting for some error in timing and the hole formation criteria, the FDS results are that it was highly unlikely for failure to have occurred during the fifth evolution.
For the sixth evolution scenario, at the 99th percentile, the NFPA 1981–2007 and NFPA 1981–2013 facepiece front-side temperatures were, respectively, 234°C and 224°C at the estimated time of collapse with respective delays of 7 and 8 s. If the estimated collapse time was 30 s early and pre-existing damage reduced the hole formation temperature by 20°C, then the percentiles for hole formation would have respectively been approximately the 40th and 70th. Based on this, it cannot be ruled out that the NFPA 1981–2007 was the proximate cause of collapse. However, if it was not the proximate cause, then both facepieces would likely have failed while the instructor was on the floor before rescue began.
Conclusion
An LODD incident at a firefighter training facility in Pennsylvania, which occurred in 2005, was re-examined with modeling capabilities and data that were not available at the time of the incident. New data include new materials data (the FSRI Materials and Properties Database) for wood pyrolysis, new research into the response of facepieces to fire exposures (This LODD incident served as a catalyst to conduct research to improve the thermal capabilities of SCBA facepiece lenses. New thermal performance tests for SCBAs were incorporated into the NFPA 1981, 2013 edition), and new methods for assessing the hazard to firefighters in a fire environment. New modeling capabilities include the heat flux scaling method for predicting burning rate and improved Lagrangian particle behaviors to model exposure as a function of not just time but space and orientation.
Modeling results show the promise of using the heat flux scaling method to reasonably capture the thermal environment from complex fuel loads. Through a combination of prescribed and predicted fires, FDS could predict the evolution of exposure in the burn room over a multi-hour, multi-evolution training event. Modeling results also demonstrated the potential of assessing clean burn areas from FDS wall temperature predictions.
Modeling was able to confirm the findings of NIOSH investigation that the nature of the below-grade burn room and procedures used resulted in a risky environment for the prolonged exposures seen by the instructor. Model results also indicated that an NFPA 1981–2013 compliant facepiece would have avoided the incident if the proximate cause of collapse was the facepiece failure. However, that conclusion is not definitive. It was definitive that the new facepieces provide significantly more margin of safety at emergency levels of exposure.
Footnotes
Declaration of conflicting interests
The author(s) declared no potential conflicts of interest with respect to the research, authorship, and/or publication of this article.
Funding
The author(s) disclosed receipt of the following financial support for the research, authorship, and/or publication of this article: Work was internally funded via the ULRI endowment.