
Abstract
Fire safety of food grains in storage, transport and processing facilities requires knowledge of their ignition properties some of which have been determined in this study. Cowpea, lentils, millet, soybean, unshelled peanut, flax (linseed), sunflower, shelled peanut and sesame, at 10% moisture content were studied. A cone calorimeter heater was used to impose radiative heat fluxes of 25, 35 and 47.5 kW/m2 on the food grains to determine the time to piloted ignition concurrently with the surface temperature at ignition (Ts,ig). Ignition temperatures (Tig) were calculated from experimentally determined critical heat fluxes. The thermal response parameter and thermal inertia (
Introduction
There is a long history of disastrous fires around the world that involved large quantities of food grains (FGs) in storage, transport and processing (ST&P) facilities. These fires often result in huge financial losses and, sometimes, human lives. Beyond the consequent environmental pollution, there is a potential disruption of business, income, or even a complete loss of it. A number of such facilities with losses and damages upwards of US$1 billion are included in the study by Bhusari et al. 1 As already highlighted in the United Nations Food and Agriculture Organizations 2021 report, 2 the growing world population is facing increasing food shortages. Fires in FGs ST&P facilities are capable of worsening the situation as a consequence. In Africa, where more than 55% of livelihoods depend on agriculture, with grains comprising a huge proportion of it, 3 fire safety in such facilities is critical.
Fire development starts with ignition as its first stage (although some models consider pre-heating before ignition). Ignition of agricultural food grains can be due to self-heating or exposure to external heat. Spontaneous ignition from self-heating has been extensively curtailed as regulations and guidelines based on research are now in use. Hence, interest is shifting to ignition from external sources such as hot objects, electrical faults, glowing nests and processes like drying. 4 Recently, grain dryer fire on 26 February 2023, destroyed 50 tonnes of soybean in Pérola Independente, Brazil. 5 On 13 June 2023, another grain dryer fire in Brazil’s Fazenda Dona Aurora, resulted in the loss of 80 tonnes of corn. 6 It is also estimated that there are 100 grain dryer fires per annum in Germany, 7 and yet literature is quite sparse on food grain fire research. A few studies that exist include the effect of mould on the smouldering of rice grains by Wang et al. 8 The effect of particle size on the smouldering of corn was investigated by Rosa et al., 9 and the combustion of corn with surface temperature measurements by Cai et al. 10 Fire parameters and comparative thermal hazards of food grains were recently investigated by Oguaka et al. 11 These studies have not addressed or compared the ignitability of different types of food grains, which is the focus of this work.
Ignition starts with the temperature rise of a material exposed to heat resulting in physical and chemical changes,
12
with time and temperature as key parameters. Usually, ignition is assumed to occur when a certain criterion or threshold of the material heating process is attained. Such criteria include mass loss rate, time to ignition (TTI), surface temperature, critical char depth, heat release rate, critical heat flux12–14 and thermal response parameter (TRP) introduced by Tewarson and Ogden.
15
The determination and use of time and temperature as criteria seem appropriate and can be used to predict when, and if, ignition can occur in a given circumstance. However, the ignition temperature, Tig, is not necessarily a definitive criterion of fire initiation, nor a fixed value, due to multiple factors that play a role in the ignition.16,17 Interestingly, among four ignition criteria ranked and contrasted in the study by Vermesi et al.,
18
the Tig was ranked the second-best predictor of ignition after the critical mass loss rate. TRP is a composite parameter that combines thermal inertia, (
Each ignition criterion has its disadvantages or difficulties in its determination. For instance, mass loss rate measurement is both difficult and to some extent, apparatus-dependent.14,18 The measurement of heat release rate shares this challenge as it is a product of the mass loss rate and heat of combustion. A similar problem is also faced with surface temperature measurement, in addition to its usual variation with incident heat flux.19,20 In addition, the ignition temperatures of most solids are within the same order of magnitude, 300°C–500°C. 14 However, thermal inertia, which can be calculated from ignition temperature can be different by two orders of magnitude 14 and so it is a more distinguishable ignition criterion. Assuming that ignition temperatures are the same, higher values of thermal inertia imply a longer time required for materials to increase in temperature and ignite. 21
The purpose of this study is to determine, for a range of FGs at 10% moisture content (MC), the ignition criteria namely (1) surface temperature at ignition, Ts,ig, by experimental measurement, and ignition temperature, Tig, from calculations based on critical heat fluxes (CHF), (2) thermal response parameter, TRP and (3) thermal inertia,
Thermal ignition theory for data analysis
Thermal ignition theory is extensively addressed in the literature23,24 and therefore the theoretical development and derivation of the equations will not be repeated here. Only the final correlations used to aid the analysis and interpretation of experimental results are presented in this section. When solids are suddenly exposed to heat, changes that lead to ignition start with heating and a consequent increase in temperature (thermal changes), thermal degradation and decomposition (chemical changes). The ignition of solids can be studied from thermal or chemical perspectives. 12 In the thermal model, which applies just before ignition, the material is considered inert; any degradation or decomposition is ignored. Furthermore, heat generation from chemical energy conversion due to oxidation has yet to occur.
The empirical relationship, typically in the form of equation (1), was first proposed by Buschman
25
as suitable for correlating experimental ignition data –TTI and

A common practical correlation for thermally thick materials is given by equation (2).27,28 Thermally thick materials are resistant to heat transmission and therefore have significant temperature gradients across their thickness. This thickness in a given heating condition of the material is referred to as the thermal penetration depth,
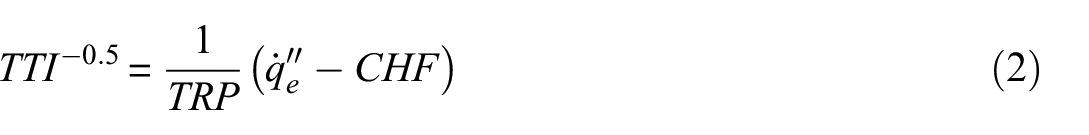
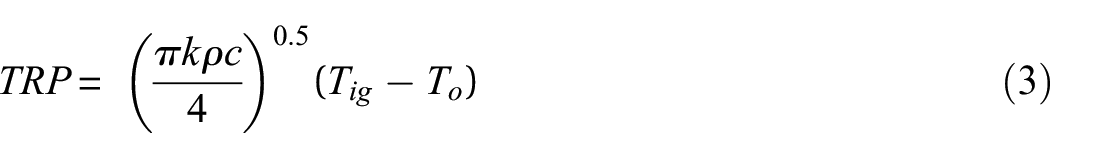
While equation (2) can be used to predict the TTI, it is a straight line, with TRP given by equation (3) being the reciprocal of the slope
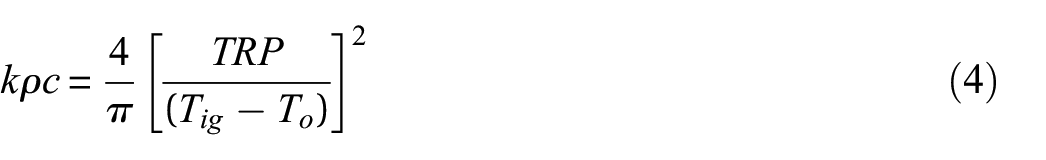
And the thermal inertia can be related according to
The energy balance from the thermal ignition theory also yields equation (5) for the determination of Tig and holds at the moment of ignition with
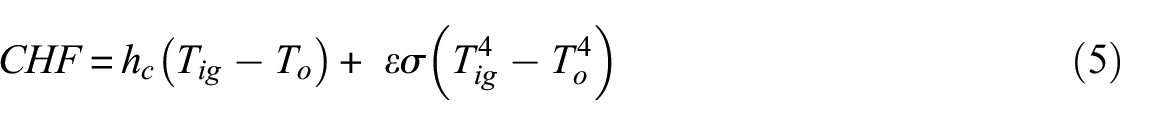
Also, equation (5) can be linearized by introducing the total heat transfer coefficient

The slope and intercept from the plot
Materials and methods
Sample selection and preparation
In this study, FGs were selected to, as much as possible, represent varieties of commonly found FGs in Africa. The range of samples selected considers oil content ranging from 1.8% to 49.7% by mass, bulk density and bulk porosity from 327.4 to 817.0 kg/m3, and 0.38 to 0.51, respectively. 11 The grains as shown in Figure 1 were (1) cowpea (black-eye beans), (2) lentils, (3) millet, (4) soybean, (5) flax (linseed), (6) unshelled peanut, (7) sunflower, (8) shelled peanut, and (9) sesame. Unshelled peanuts are those of which the shells have not been removed, while shelled are those which have the beige fibrous outer coverings removed. All grains were the species grown within the geographical region of South Africa and bought from local shops in Cape Town.
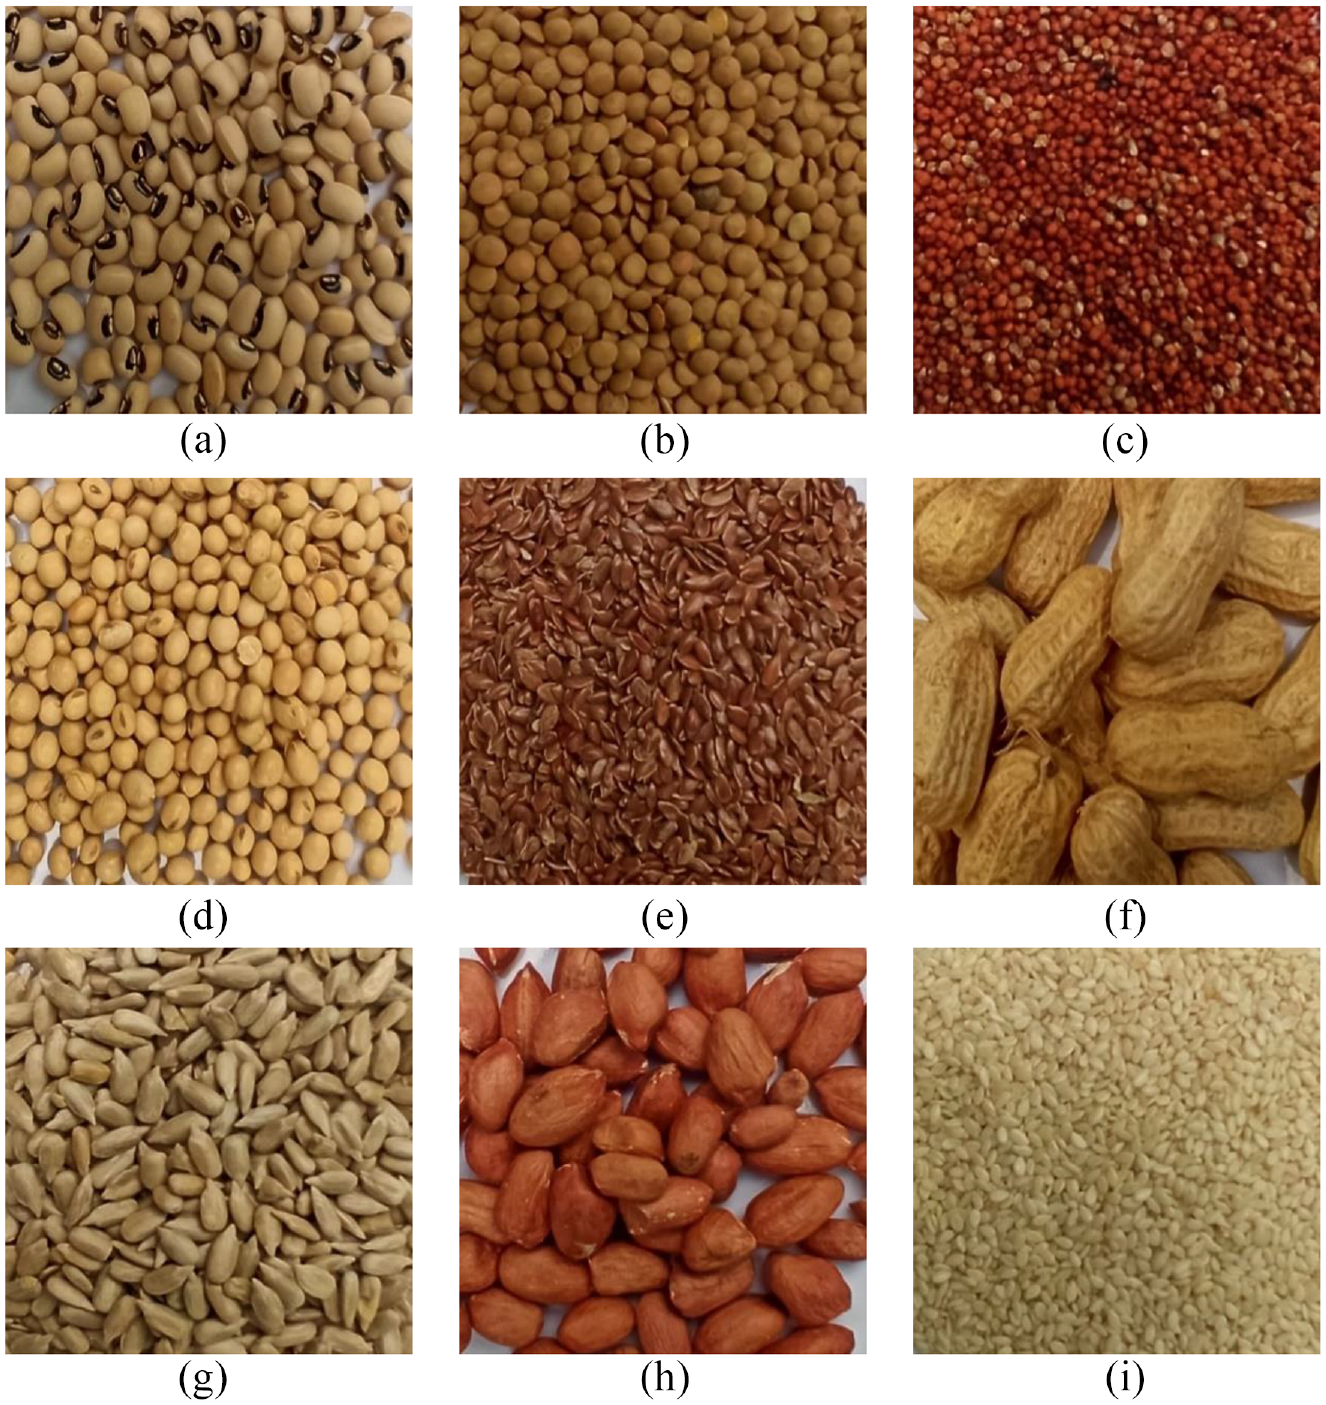
Photos to identify the food grains tested in this study. Further details are in the elemental analysis contained in the study by Oguaka et al. 29 (a) Cowpea, (b) lentils, (c) millet, (d) soybean, (e) flax, (f) unshelled peanut, (g) sunflower, (h) shelled peanut and (i) sesame.
The MC was adjusted to 10% by weight on oven dry basis. This choice of test MC considered the review of FG storage conditions by Ziegler et al. 30 It indicated that most grains are stored at between 10% and 14% MC depending on the desired storage duration and ambient conditions. Also, the as-received MC of some grains used in this study was as low as 4.0%. The MC adjustments were achieved by first determining the as-received MC, and calculating the mass of moisture to be removed or added. The as-received MC was determined by weighing a quantity of the grains received, drying it in a convective oven for 24 h at 104°C and then weighing the dried mass. 31 The MC, in percentage, is the quotient of the lost (moisture) mass divided by the remaining (dried) mass of the grains. 32 Distilled water, which is devoid of any minerals or impurities, was used to make up for the MC. The required amount of water was sprayed onto the grains and completely mixed. The sample was then placed in a heavy-duty Ziploc bag within an outer Ziploc bag. This was kept in the refrigerator at 5°C for 7 days for the grains to absorb the moisture without any deterioration. This is a standard method for biomass or FGs MC adjustment as used in various studies (Bitra et al. 33 and Deshpande et al. 34 ).
The as-received conditions of cowpea, lentils, and millet were 12.9%, 11.4% and 14.7%, respectively. The mass of oven-dried grains, which when mixed with a quantity of as-received grains would result in the required 10% MC was determined. The relative masses of the as-received and oven-dried samples were then mixed and placed in double Ziploc bags. They were kept at ambient temperature for 7 days. On the day of use, the grains stored in the refrigerator were transferred to warm up to the laboratory ambient condition for a minimum of 3 h, while still in the bags. Note also that there was no moisture droplet or condensation noticed when removed from the refrigerator or when warmed up to the ambient temperature.
Experimental apparatus and procedure
The experiments were carried out using a cone heater as shown in Figure 2, similar to the standard cone calorimeter arrangement. The set-up was surrounded on the sides with a mesh screen to shield against any draught of wind. This was done to ensure that the sample surface and surroundings were undisturbed. The hood over the entire ignition apparatus was connected to a variable-speed exhaust fan. This was set so that the smoke was gently extracted and practically avoided any disturbance over the sample surface. Therefore, the flow of pyrolysate and smoke arising from the sample surface was buoyant and considerably free from wind draught interference.
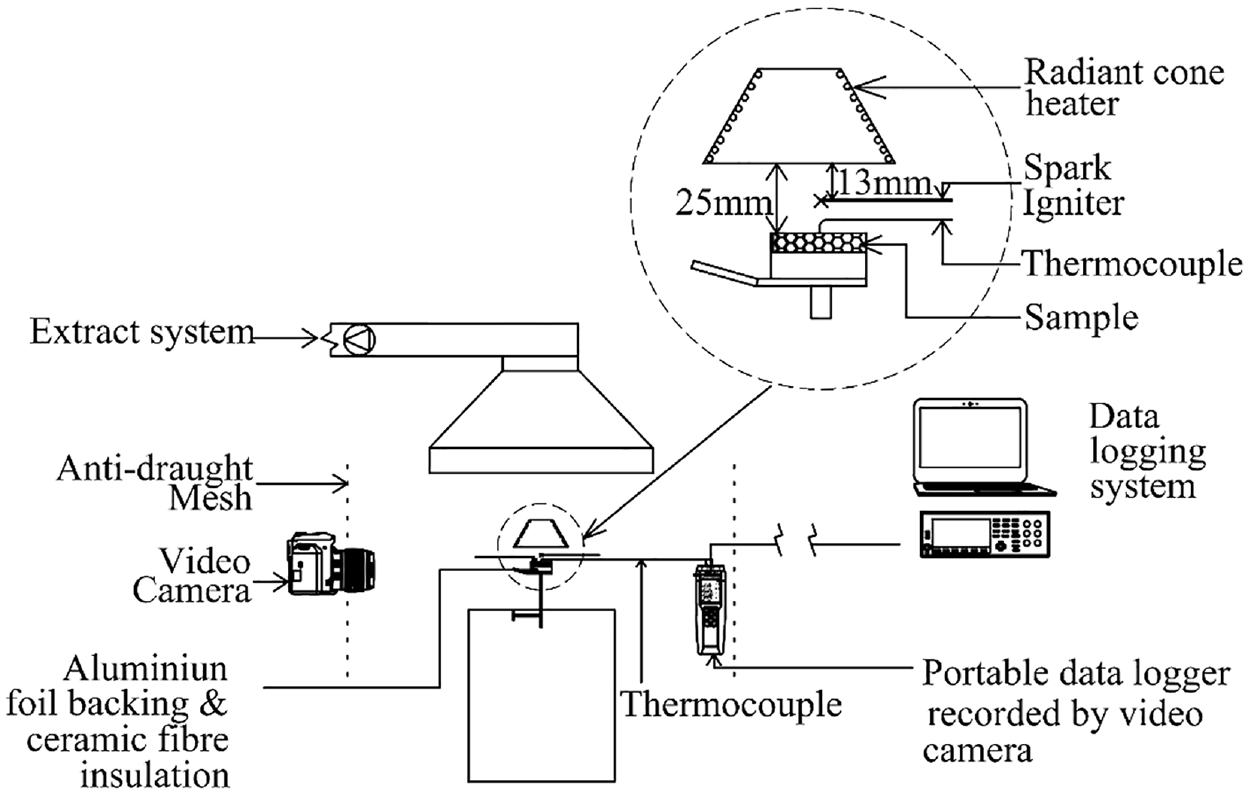
Schematic diagram of the experimental set-up.
In Figure 3, a close-up view of the portable data logger recorded by the video camera, and the typical placements of the thermocouple are shown. Note that a difficulty in measuring surface temperatures is achieving and maintaining perfect thermocouple tip to sample surface contact. To maintain the thermocouple’s tip steady and in contact with the grain surface, a little weight of 11.7 g was suspended and slid on its arm. In addition, visual observation was maintained throughout the experiment. When the placement of the thermocouple was not achieved satisfactorily on the surface, the test was aborted and the test data discarded.
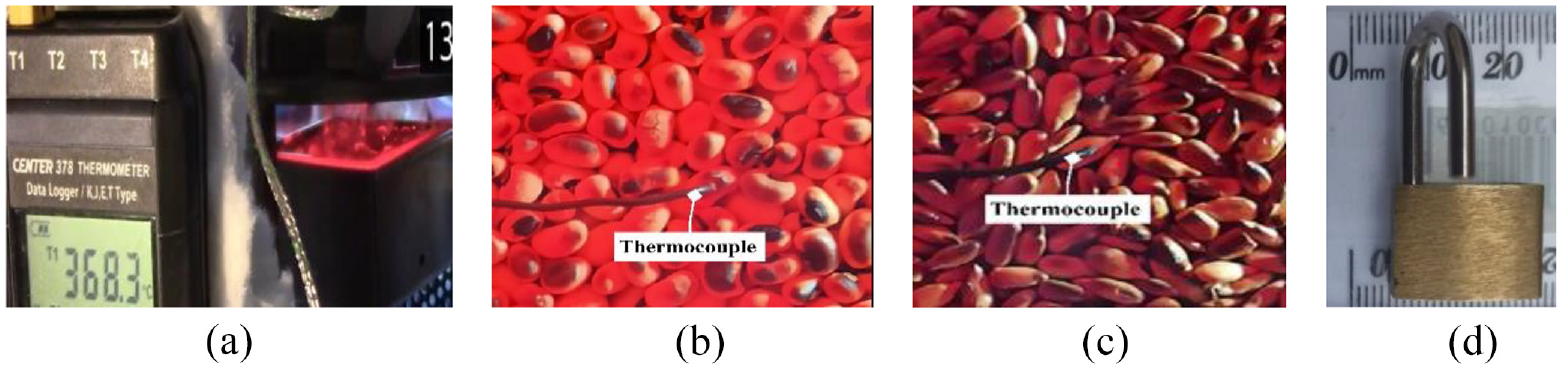
(a) Real-time surface temperature display on portable data logger recorded by video camera, (b) and (c) are typical placement of the thermocouple on test grain surfaces ensuring contact with the grain, (d) 11.7 g weight suspended to slide on thermocouple arm to maintain tip contact with grain surface.
Although not done in this work, an alternative or additional temperature measuring device is infrared camera. 35 It has the advantage of ease of use requiring no contact with the sample and can, therefore, be fixed steady at a location. The disadvantages with this include difficulties with accurate calibration of the infrared camera for the correct emissivity of the sample especially at ignition, camera view obstruction by apparatus, interference of radiation by emitted gas or flame, and possible reflection of incident heat from the sample surface.
Heat flux calibration with a Hukseflux SBG01 water-cooled heat flux gauge was carried out daily or when changing to a different heat flux. A minimum of 30 min was first allowed for the apparatus to warm up to a steady state. A water-cooled heat flux gauge was then used to read and adjust to the required test heat flux. Surface temperature data were measured using a K-type thermocouple with a probe overall diameter of 1.3 mm, although a much smaller diameter thermocouple should be more appropriate to limit heat conduction due to its thermal mass. 36 However, this would be a challenge to fix and be retained on the surface of the grains for accurate measurements unlike on wood 37 or plastic. 38 Temperature data were recorded every 200 ms. The thermocouple was also connected in parallel to a portable data logger with a display recorded by a video camera alongside the sample surface to observe ignition time. The TTI and the surface temperature at ignition were extracted from the video camera records. This provided an accurate match of ignition, ignition time, and surface temperature at the instant of ignition. The data logger records provided the form of the time–temperature history of the ignition process.
The grains were measured in a box of 100 mm
Results and discussions
Important visual observations
The ignition of unshelled peanuts was unique with its distinct ‘2-stage’ ignition, as illustrated in Figure 4(a) to (i). The outer shells first glowed (see Figure 4(b)) and ignited (see Figure 4(c)), flamed (see Figure 4 (d)) and burned off within a short while, less than 8 s, and then extinguished (see Figure 4(e)) and no noticeable pyrolysis was then observed (see Figure 4(f)). Noticeable generation of pyrolysate and smoke restarted (see Figure 4(g)) and continued until a second ignition occurred (see Figure 4(h)), which then remained (see Figure 4(i)). In addition, the unshelled peanut had a glowing ignition that transitioned to established flaming. This behaviour is known to create some uncertainty in determining ignition temperature. 14 It appears this behaviour was due to surface oxidation, which continued until the establishment of flaming ignition. 21 In between, the surface temperature, Ts, rose as heterogeneous combustion progressed and subsequent flaming ignition at an isolated location or local spot, finally spreading over the rest of the sample surface. This behaviour was pointed out by Babrauskas 14 as characteristic of charring materials under low heat fluxes. Heterogeneous combustion refers to the oxidation reaction occurring on the surface of the solid, solid–gas interface, in this case the grains and the oxygen.
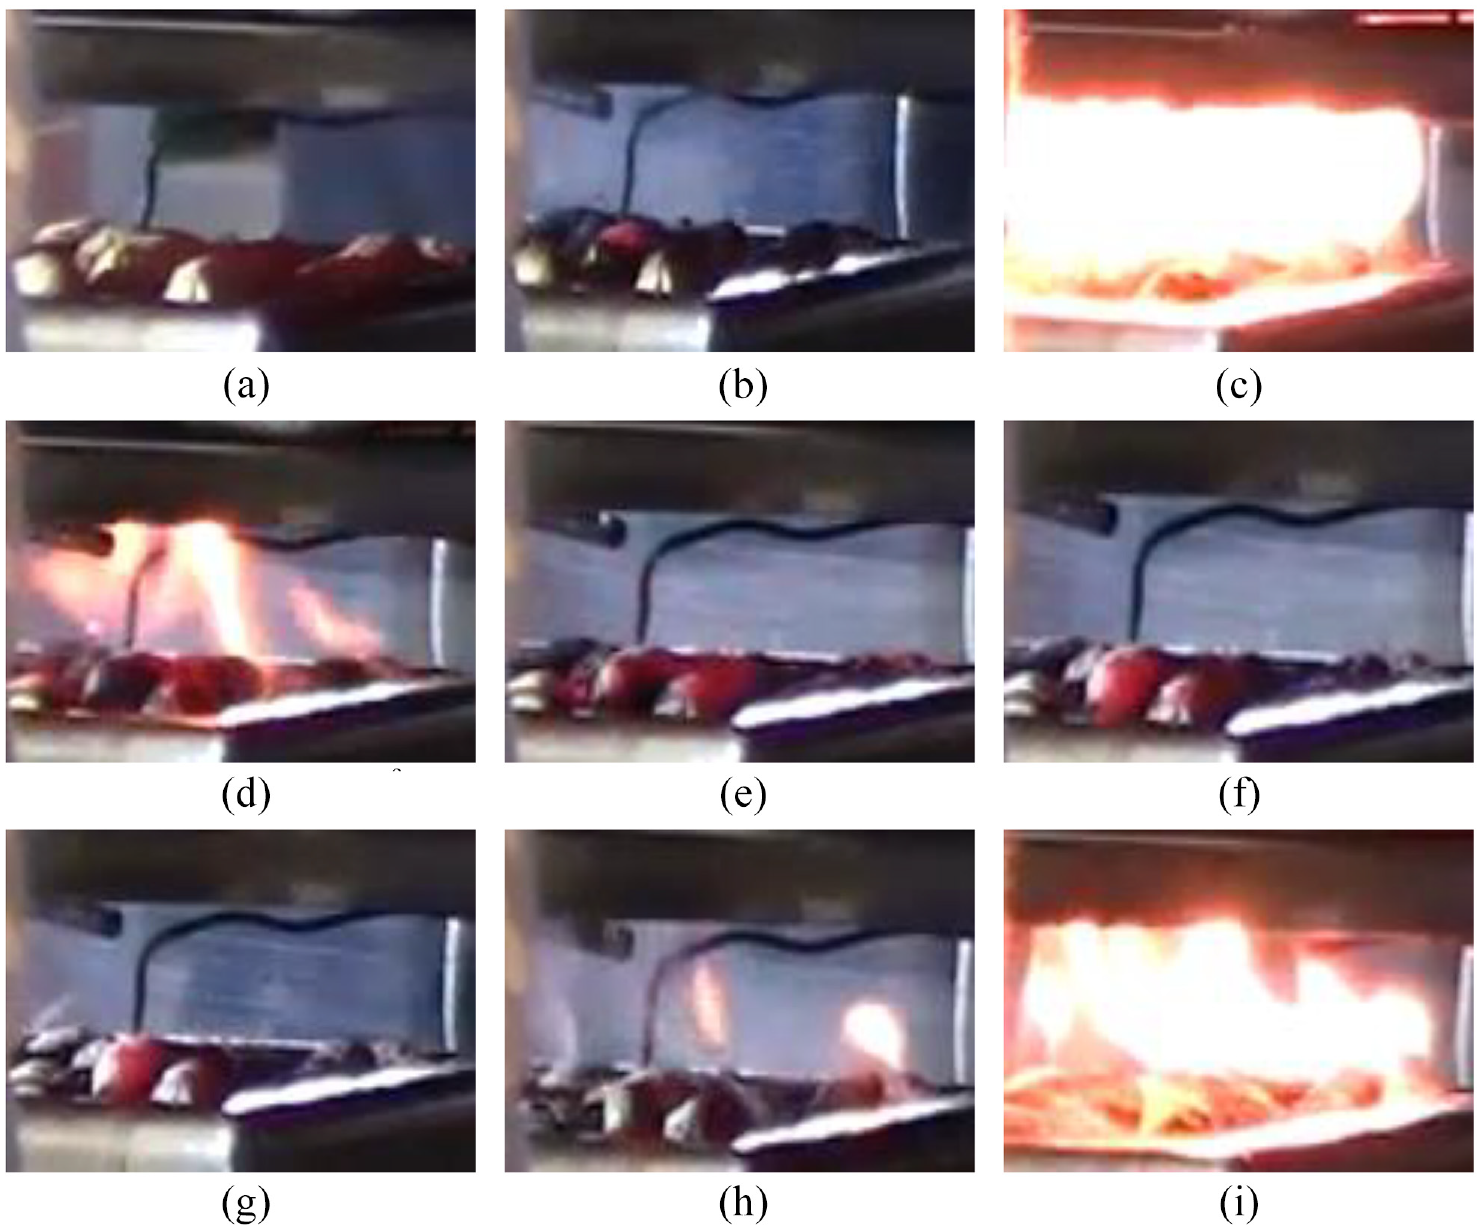
Photos of unshelled peanuts with their typical ignition sequence under 25 kW/m2. They show the appearance of local glowing, ignition of the shells, flaming, and extinguishment followed by spot ignition of kernels and surface-wide flaming ignition with variations of surface temperatures, Ts. (a) Exposure at 0 s, Ts at 20°C; (b) glowing at a local spot at 27 s, Ts at 250°C; (c) ignition of shells at 30 s, Ts at 268°C; (d) flame at 34 s, Ts at 455°C; (e) flame extinguished but continued glowing and surface oxidation at 38 s, Ts at 525°C; (f) no noticeable pyrolysate or smoke at 42 s, Ts at 515°C; (g) the onset of another pyrolysis at 57 s, Ts at 459°C; (h) onset of the second-stage ignition with isolated local spot flaming at 94 s, Ts at 434°C; and (i) sustained surface-wide flaming ignition at 112 s, Ts at 579°C.
Time–surface temperature profile
Exemplary typical time and surface temperature profiles of the ignition tests for all the nine grains under the three different heat fluxes are shown in Figure 5. The profiles generally have a similar shape – a nonlinear temperature rise, which might include the period of intermittent pre-ignition flashes
40
followed by a sudden jump in temperature, which is the surface temperature at ignition,
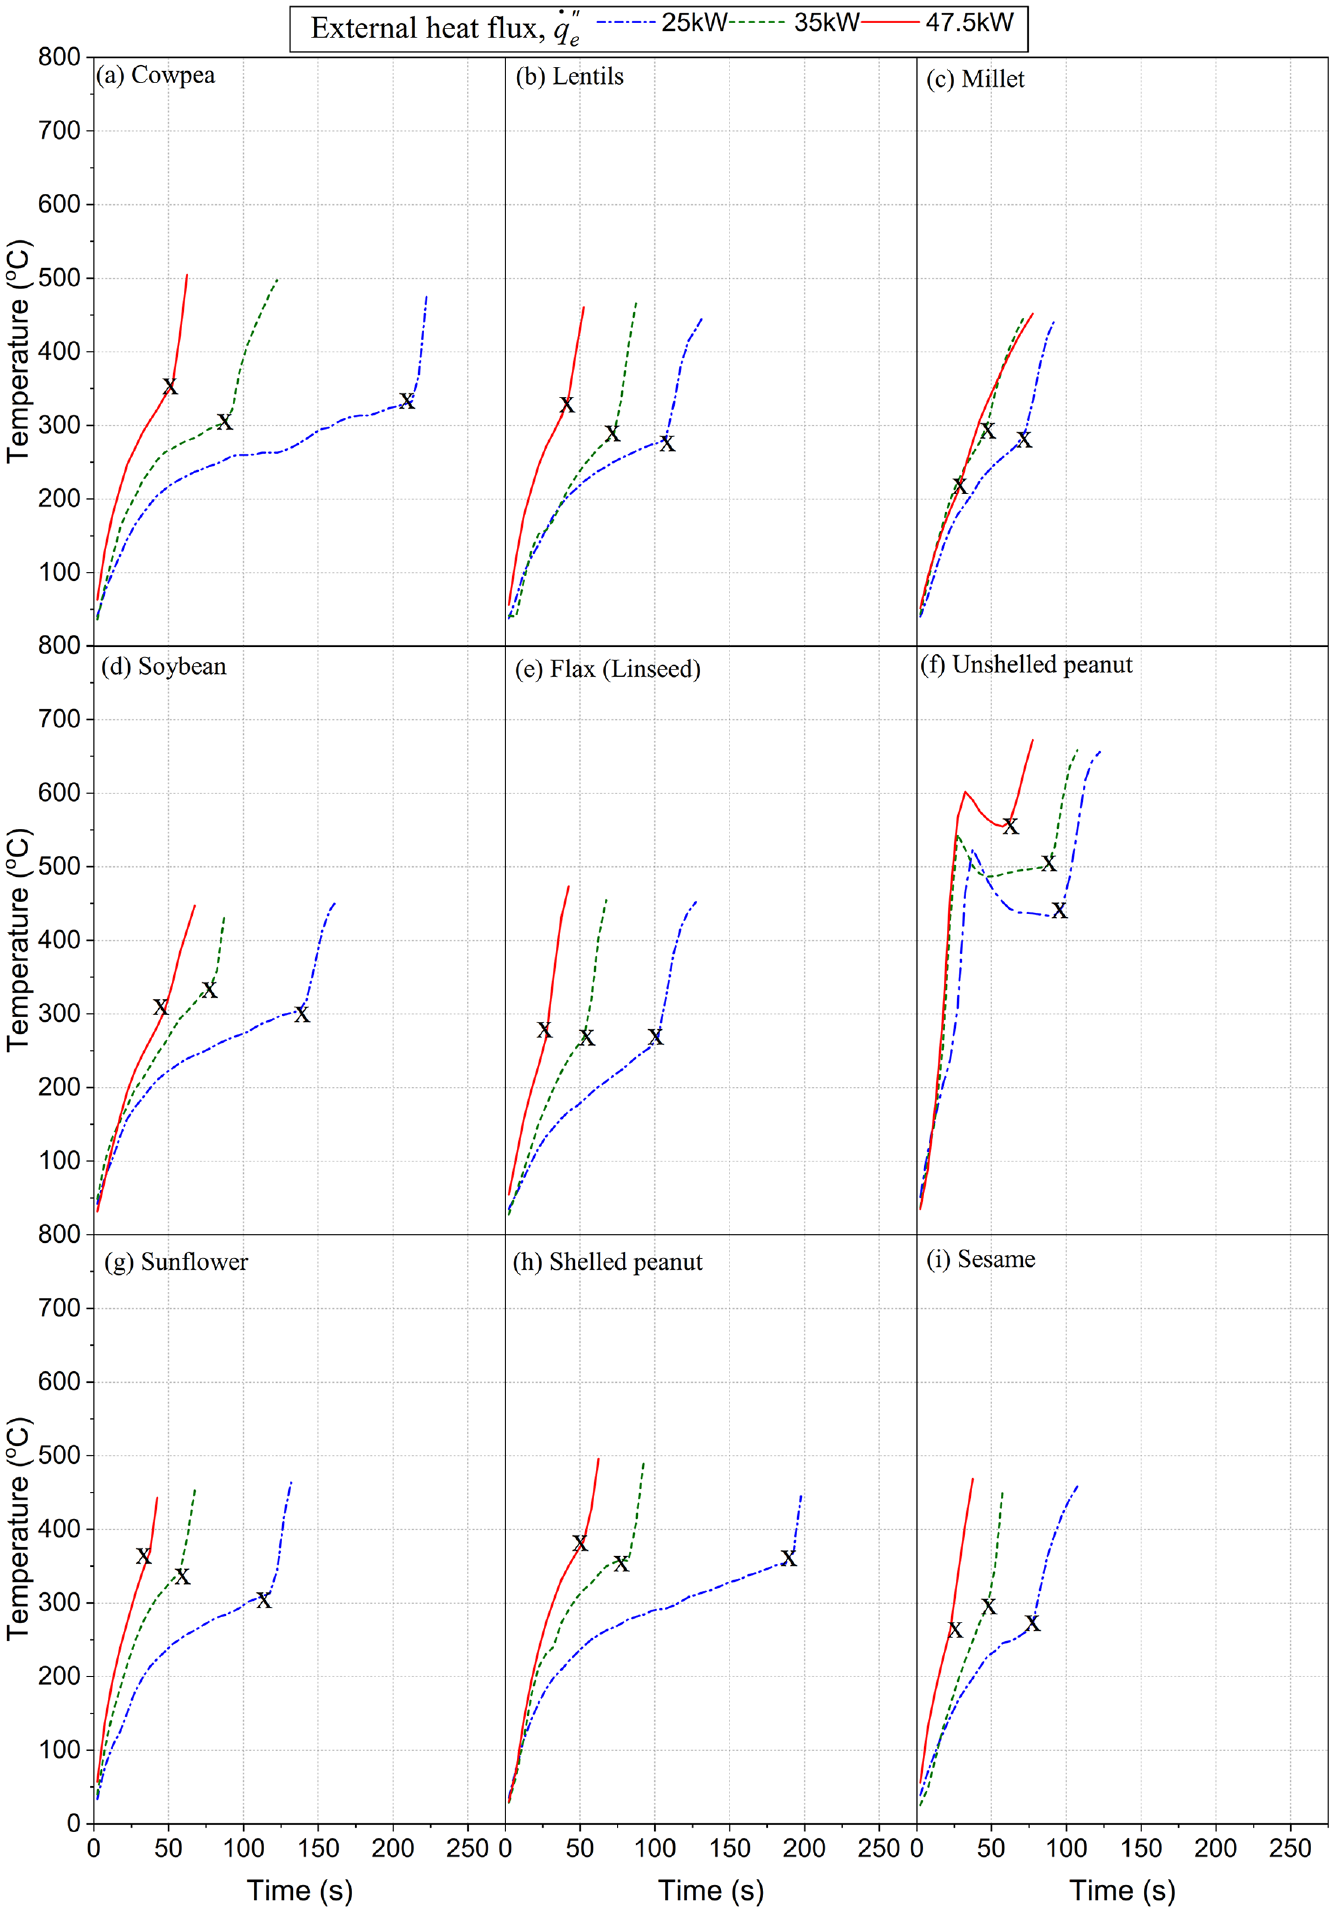
Exemplary typical time–surface temperature history of ignition of food grains under various heat fluxes. X is the surface temperature at the point of flaming ignition.
However, unshelled peanuts (see Figure 5(f)) have a unique profile. As already elaborated in the section on the important visual observations, the first sudden increase in temperature was the flaming ignition of the shells that burnt off in a short while and then extinguished. The second rapid increase involved the ignition of the kernels. As the heat flux increased, there was a shift to shorter ignition times. However, the shift in
Time to ignition
The TTI of the various samples, after exposure to a constant
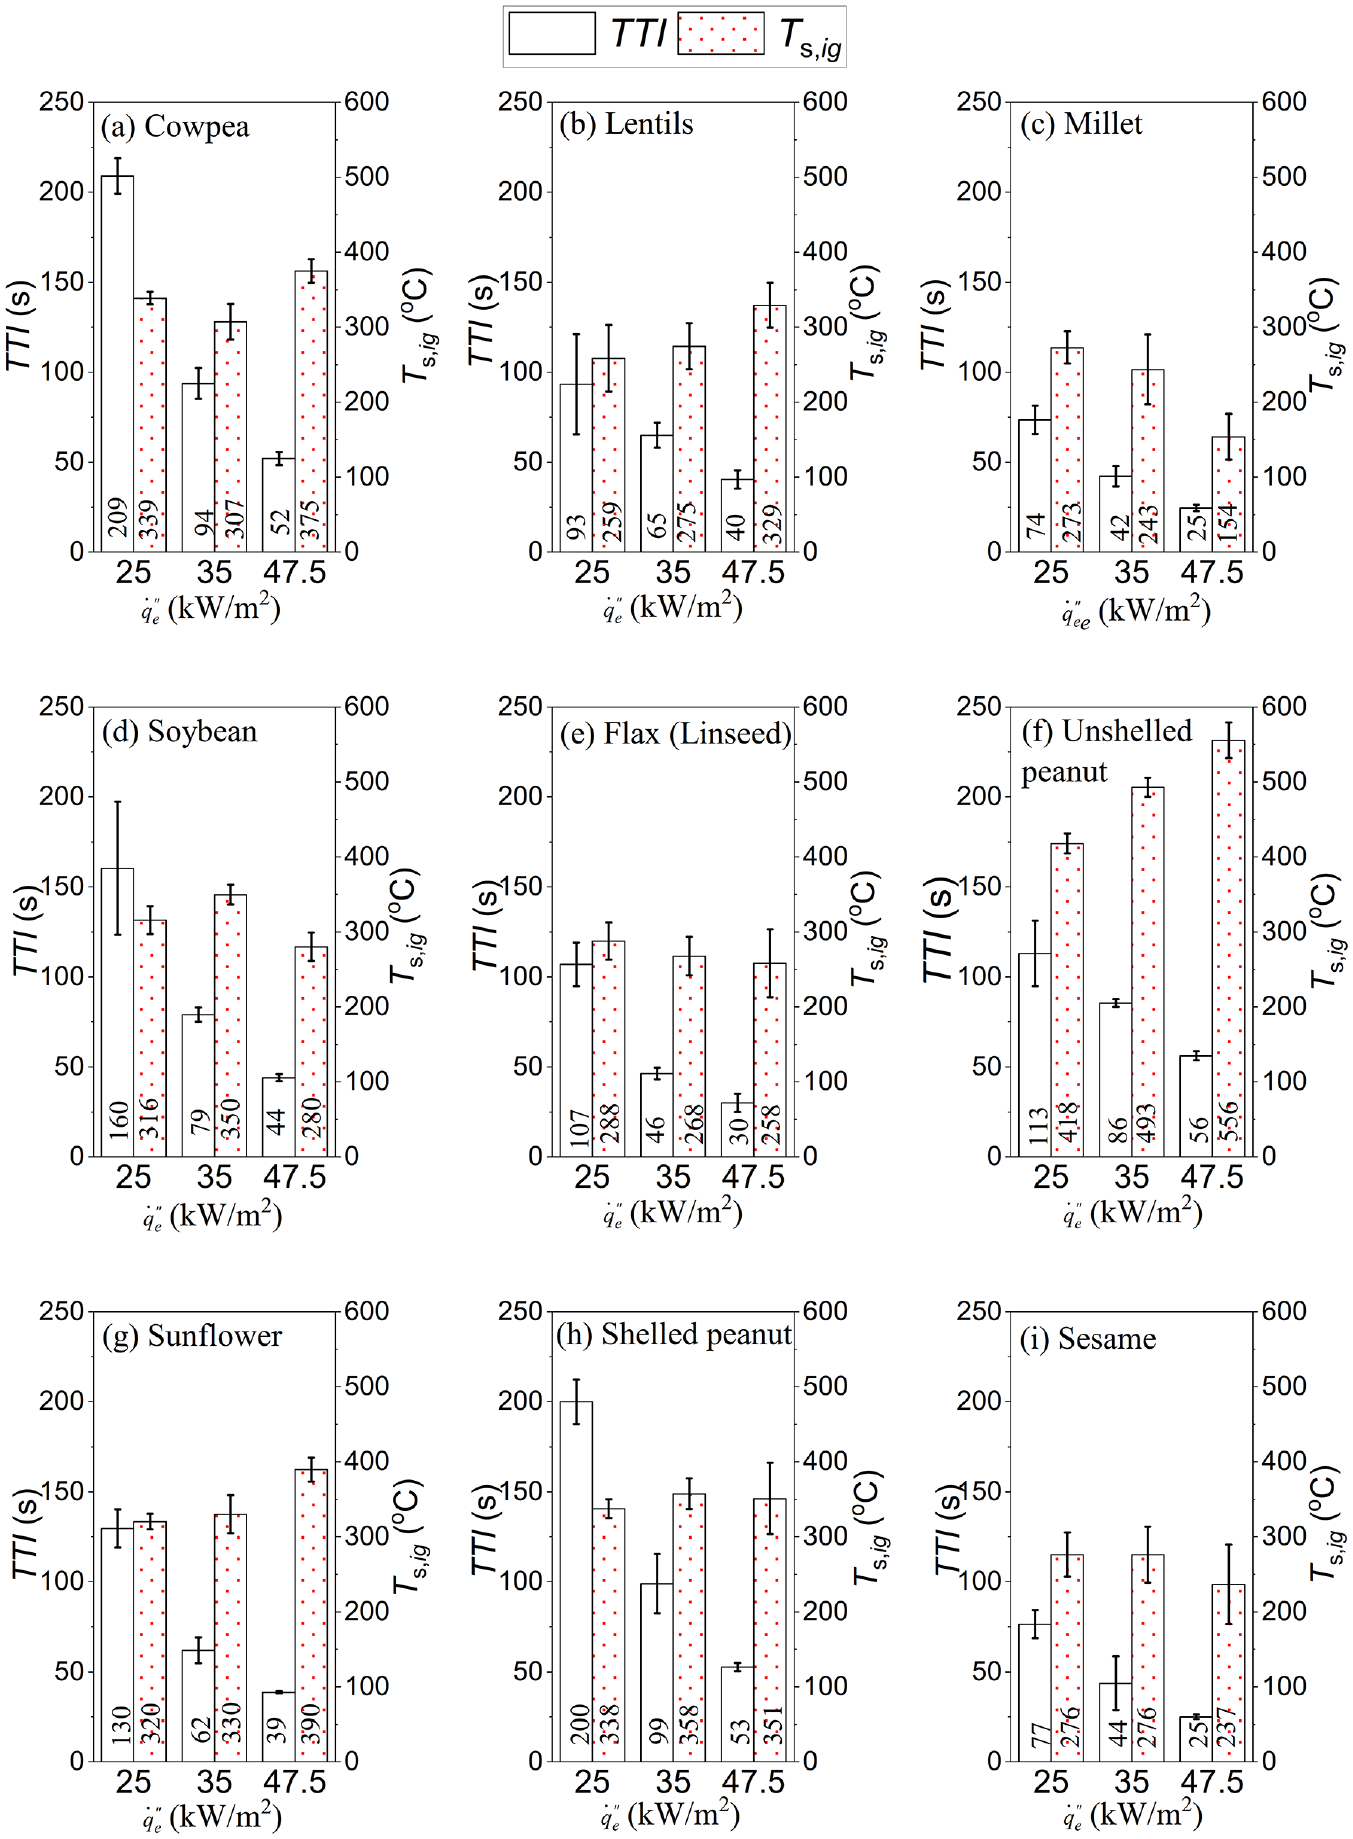
Time to sustained flaming ignition of sample food grains (TTI) and measured surface temperature at ignition (
It should be noted that the unshelled peanut had two-stage ignition, as already detailed in the section on the important visual observations. In this research, the time from heat flux exposure to the second sustained ignition was taken as the TTI for the unshelled peanuts. In all cases, the TTI decreased with exposure to higher heat flux. In addition, compared to previous research on fire behaviour and thermal hazards of FGs that used oven-dried grains, 11 the TTI recorded in this study was higher due to higher MC. For instance, under 35 kW/m2, the previous study had a range of 28–64 s while in this research, the range was 42–99 s. The longer TTI in this study was as expected for two major reasons. First, it took time to dry the sample, although it did not have to be completely dried. 14 Second, the evaporated moisture diluted or reduced the concentration of combustible pyrolysate 41 thereby requiring more decomposition before ignition could occur.
Surface temperature at ignition
The experimental surface temperature at the point of ignition,
Unshelled peanut, as shown in Figure 6(f), shows a clear trend of increasing
The millet
Analysis – resolution of the challenge of thermal thickness
The analysis or correlation of the TTI with the external heat flux,
For the first approach, it is assumed that the correct thermal thickness will have a distinctly higher correlation coefficient between the plots of TTI-1 versus
A second approach is to determine the Biot number, Bi = hcL/k, a dimensionless parameter rooted in conduction heat transfer and is extensively dealt with in standard heat transfer or fundamental fire dynamics textbooks.21,49 For the calculations, L is the characteristic length or the sample test depth, and k is the sample thermal conductivity. It was considered appropriate for this practically draught-free test environment, as detailed in the section on experimental apparatus and procedure, to assume hc as 0.015 kW/m2 K.19,50 The test sample is thermally thin if Bi << 1 or thermally thick if Bi > 0.1.49,51,52 Results from this work are presented in Table 1.
The third approach is to determine the value of the thermal penetration depth (δT). This is based on the same principle as the Biot number. In practice, the δT is given by A√(αTTI) where A is an arbitrary value usually ranging from 1.12 to 4. However, Babrauskas
14
indicates that the appropriate value is 1.13 to 1.2. This notwithstanding, in this work, a more conservative value of 2.0 considered adequate for fire engineering applications by Drysdale
49
was used. It is noteworthy that
The fourth method is to place a thermocouple at the bottom of the sample to read the temperature. The temperature reading at the time of ignition of a thermally thick sample would be close to the ambient or sample temperature prior to the test. This method was, however, not used in this study.
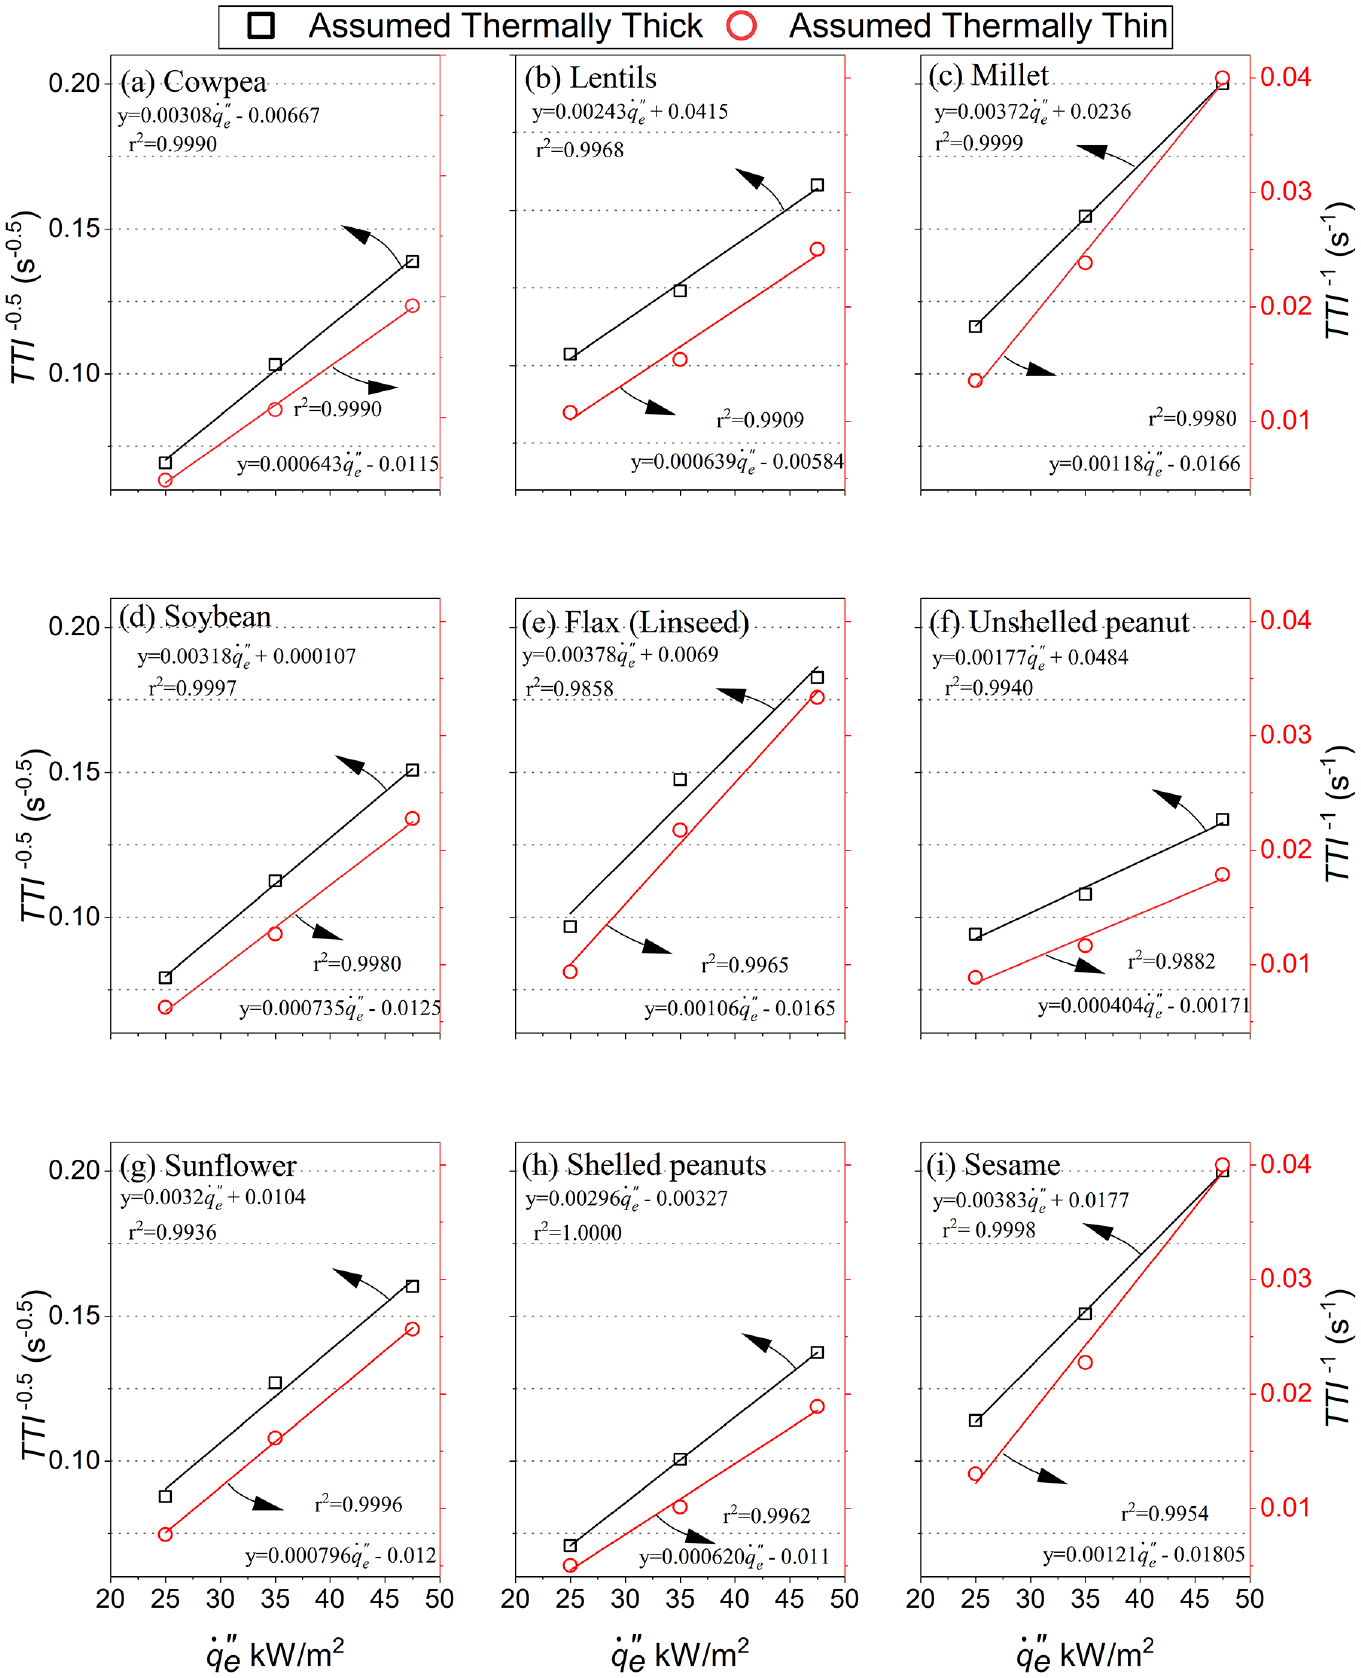
Correlations of the mean times to ignition, TTI, with external heat flux,
Biot numbers, Bi and thermal penetration depths,
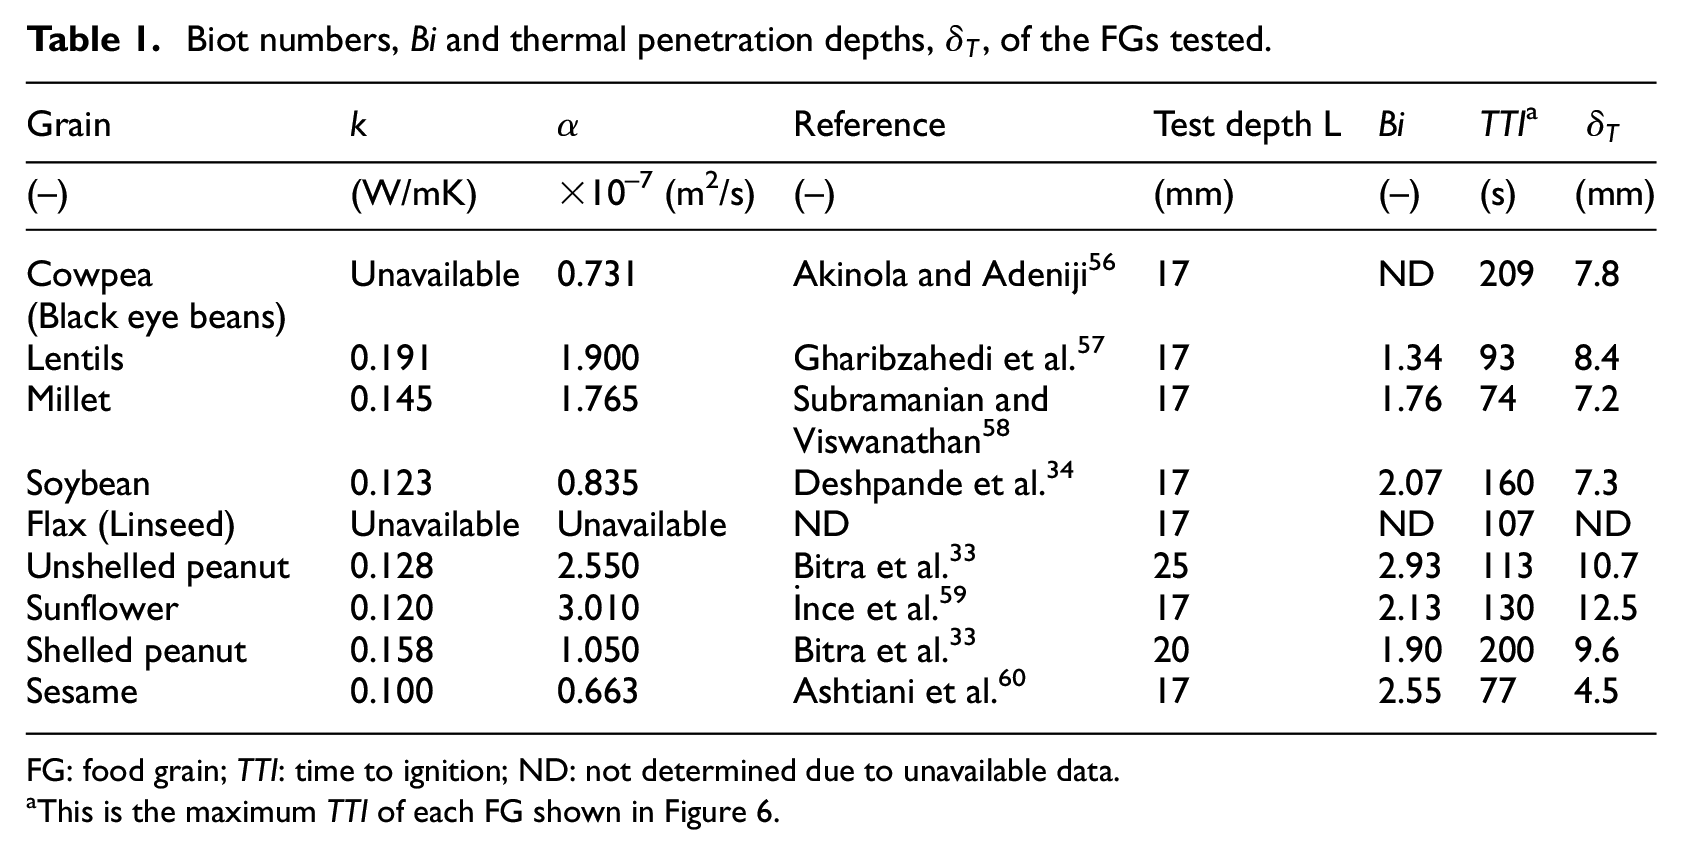
FG: food grain; TTI: time to ignition; ND: not determined due to unavailable data.
This is the maximum TTI of each FG shown in Figure 6.
Specifically, the values of k (except for cowpea and flax) and
Analysis – determination of
The TRP was calculated as the reciprocal of the slope for the thermally thick correlations in Figure 7 described by equation (2). The ignition temperatures, Tig, were calculated from equation (5) using experimentally determined CHF from previous research
11
and values of
Ignition properties of study food grains.
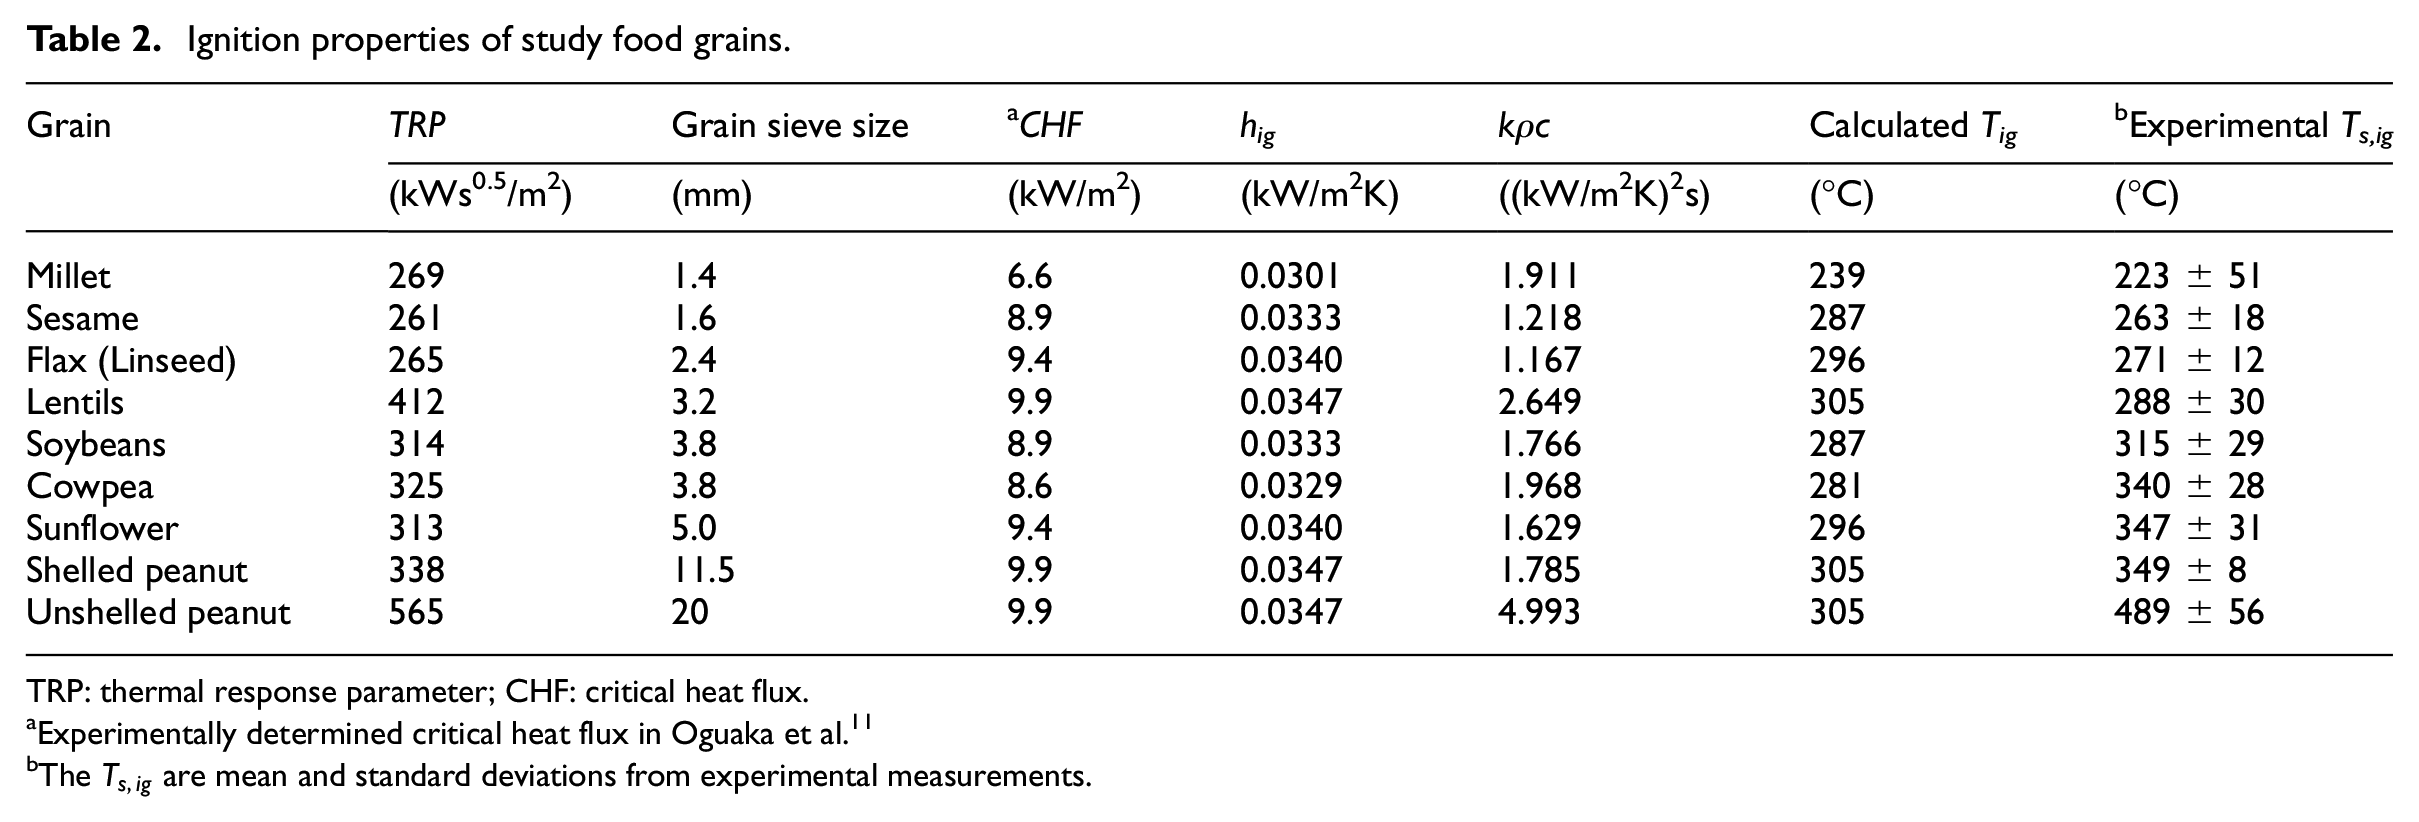
TRP: thermal response parameter; CHF: critical heat flux.
Experimentally determined critical heat flux in Oguaka et al. 11
The
TRP is an indication of the resistance of a material to decomposition and generation of ignitable pyrolysate. Therefore, it is a property that can be considered to be strongly associated with material ignition
62
and fire propagation.
63
The higher the TRP, the more resistant the material is to ignition. Sesame, flax (linseed) and millet have the lowest values at 261, 265 and 269 kWs0.5/m2. These low values are not surprising, as these also had the lowest TTI, Tig and
The calculated values of millet, lentils and soybean are within the bounds of uncertainties of the measured values. Sesame, flax and sunflower are 6°C, 13°C and 20°C, respectively outside the bounds of the uncertainties of the measured values and can be considered satisfactory. 64 Cowpea and shelled peanut are 31°C and 36°C, respectively outside the bounds of the uncertainties of the measured values. Note should be taken that these calculated or theoretical values are based on assumptions of thermal ignition theory as well as assumed values of emissivity and convective heat transfer coefficient. Therefore, the various Tig or Ts,ig obtained for the grains are considered to be largely acceptable. The wide difference in the Tig and the mean Ts,ig of unshelled peanuts is attributable to the adoption of the second-stage ignition data. The deviation for lentils, millet, soybeans, flax and sesame is less than 30°C. In addition, the values of the total heat transfer coefficient, hig of 0.0301–0.0347 kW/m2K are all similar and in the range for different species for woods of 0.0306–0.0359 kW/m2K determined by Janssens. 23
Thermal inertia is a critical property that indicates how readily a material can transmit heat or resist the development of a temperature differential or gradient across it. A material with low thermal inertia will retain heat received or absorbed on the surface and resist transmitting or transferring it into the body of the material. This implies that the surface temperature of such materials exposed to heat will rise fast and attain their ignition temperature and speed up fire spread.
49
It is provided as input in some fire models. The grains in this study have values that ranged from 1.17 to 2.65 (kW/m2K)
2
s, as shown in Table 2, except for unshelled peanuts at 4.99 (kW/m2K)
2
s. This high value is expected as it took a long time for the sustained ignition of the unshelled peanuts because of the two-stage ignition process as discussed in the section on the important visual observations. Apart from unshelled peanuts, based on thermal inertia, the grains are not distinctly dissimilar and their behaviour is relatively consistent. In comparison, the values of
Conclusion
For decades now, fires in FG ST&P facilities in different parts of the world have been known to have caused huge damage or loss of lives and properties. There may not be many of these fires in a year, but whenever they occur their consequences are usually extensive. This is also in addition to the negative impact of smoke and residues on the environment. If these accidents are to be minimized, an understanding of the fire behaviour of these FGs is necessary. A quantitative study on ignition is, therefore, a vital step in limiting the occurrence and extent of damage that these fires can cause.
The ignition properties of nine different food grains at 10% MC have been derived from experimental data under a radiant cone heater. The ignition temperatures Tig varied from 239°C (millet) to 305°C (lentils, unshelled peanut and shelled peanut). Other ignition properties of TRP (261–349, and 565 kWs0.5/m2), and
This study has been limited to FG at 10% MC, which is generally the storage condition of most FGs. The effect of MC on these characteristics is yet to be determined. As with natural materials of this type, variations with different species are expected and could be considered in future studies. Finally, this study was conducted on a bench-scale apparatus with a controlled environment. Large-scale studies are needed to determine how these results scale to real fire situations.
Footnotes
Appendix
Declaration of conflicting interests
The author(s) declared no potential conflicts of interest with respect to the research, authorship, and/or publication of this article.
Funding
The author(s) disclosed receipt of the following financial support for the research, authorship, and/or publication of this article: This work was supported by the Royal Academy of Engineering / Lloyd’s Register Foundation under the ‘Engineering Skills Where They are Most Needed’ grant [Grant ESMN 192-1-141]; and the Society of Fire Protection Engineering (SFPE) Frederick W. Mowrer Global Scholar Award endowed by Kathleen Almand.