
Abstract
Red tape has been viewed as a key concept in public administration for decades and one that can significantly impact the human resource management (HRM) process. Theoretically, red tape is argued to (a) constrain organizational practices, (b) alienate employees from their organization and, ultimately, (c) lower performance. However, there is some debate about how detrimental red tape is, and empirical evidence is mixed. Using a meta-analytic approach, we aggregated findings from previous studies to test the impact of red tape and to assess sources of heterogeneity across studies. The results provide support for the constraining and alienating effects of red tape, although red tape’s impact on performance seems negligible. Furthermore, operationalizations of red tape and study context moderate some meta-analytic correlations. The lack of longitudinal and intervention studies and the use of single respondents remain the key limitations of current research, and therefore, future research is still needed.
Introduction
Since the beginning of public administration as a research field, red tape has been a topic of great interest (Kaufman, 1977). Viewed as an aspect of public organizations that negatively affects organizational practices and employees, numerous studies have investigated the effects of red tape along a wide range of outcomes, such as organizational performance (Brewer & Walker, 2010; Jacobsen & Jakobsen, 2018), employee attitudes (Baldwin, 1990; Scott & Pandey, 2005), and employee behaviors (Quratulain & Khan, 2015; Taylor, 2016). A central facet of red tape is the presence or perception of rules that entail a compliance burden and have no legitimate goal (Bozeman, 1993), which separates it from concepts such as formalization and green tape (DeHart-Davis, 2008; Pandey & Scott, 2002).
In contrast to the claim that red tape has negative consequences for public organizations in all circumstances, some scholars have argued that these consequences are moderated by procedural outcomes and that red tape may not have a significant effect across all outcomes (Brewer & Walker, 2010; Kaufmann & Feeney, 2014). In other words, these scholars contend that red tape has a different impact across stakeholder groups and outcomes (Bozeman, 1993). Furthermore, empirical evidence on the outcomes of red tape is often mixed. For example, Park and Rainey (2012) found that red tape had a significant negative relationship with organizational effectiveness, while Pandey et al. (2007) found no significant results. As a result, red tape might not have the overall detrimental effect it is claimed to possess.
In view of the mixed claims and evidence, a systematic analysis can provide a valuable overview of the effects of red tape and help the knowledge base understand how red tape matters for managing people and organizational performance. Given the bulk of studies that have quantitatively investigated red tape, it is worthwhile to examine, summarize, and aggregate the evidence so far using a meta-analytic approach. Meta-analysis is a powerful approach to aggregate findings from previous studies that can reliably measure the relevance in a wide range of circumstances, including various contexts and measures (Borenstein et al., 2011; Hunter & Schmidt, 2004). In addition to obtaining general effect sizes, meta-analysis allows us to investigate the presence and sources of heterogeneity in these effect sizes.
With our study’s approach, we take up the call by Perry (2012) for more meta-analyses in public administration and we engage with recently published meta-analyses in a public sector context (Cantarelli et al., 2015; Gerrish, 2016; Harari et al., 2017; Homberg et al., 2015). The remainder of the article starts with a discussion of the definitions and operationalizations of red tape and with an overview of the theoretical arguments about the impact of red tape. Next, the method of our meta-analyses is described. This is followed by an overview of the results of our meta-analysis. We conclude with a discussion of the results and suggestions for future research and for practitioners.
Theory
Definition and Measurement of Red Tape
A variety of definitions and operationalizations of red tape have been introduced since the start of the academic literature on red tape. Although red tape was introduced as a concept already in the 1970s (Kaufman, 1977), scholars today are still interested in how to define and measure red tape (Borry, 2016; van Loon et al., 2016). While early scholars considered red tape a relatively neutral occurrence in organizations, being sometimes detrimental and sometimes beneficial (Kaufman, 1977; Waldo, 1964), today, public administration scholars generally agree that red tape is an organizational pathology (Borry, 2016; Bozeman, 2012; Tummers et al., 2016)—detrimental to the organization by definition. Thus, red tape as a phenomenon has been viewed in a variety of ways. Given this, how can we define and measure red tape in a consistent and coherent way?
A good starting point, adopted by many studies since its publication, is the work of Bozeman (1993), who defined red tape as “rules, regulations, and procedures that remain in force and entail a compliance burden but do not advance the legitimate purpose the rules were intended to serve” (p. 283). Thus, according to Bozeman, red tape is characterized by burdensome and ineffective rules. Often termed “general” or “global” red tape, many studies have measured red tape by operationalizing this definition into a single question, asking respondents to indicate the level of red tape in their organization from 0 to 10 (e.g., Jung & Kim, 2014; Kjeldsen & Hansen, 2018; Moon & Bretschneider, 2002; Pandey & Kingsley, 2000). Although commended for its simplicity, this measure of general red tape—often noted as GRT—has been criticized for its lack of multidimensionality and overall validity (Bozeman & Feeney, 2011; Feeney, 2012). Another point of criticism toward the GRT scale is that it directly confronts respondents with the term “red tape,” which has a negative connotation in popular culture, potentially creating bias (Bozeman & Scott, 1996).
Building on these criticisms, scholars have recently developed GRT measures that try to capture red tape’s multidimensional nature. For example, Borry (2016) developed the Three-Item Red Tape (TIRT) scale, including items measuring how burdensome, unnecessary, and ineffective policies and procedures are in organizations. Furthermore, van Loon and colleagues (2016) developed a job-centered red tape scale, which includes the dimensions of lack of functionality and compliance burden of the rules with which respondents have to comply. In addition, they found that people classified rules related to personnel tasks they had to perform more often as red tape or as unnecessary than people did for rules related to their core tasks. Both scales were found to have discriminant validity between their dimensions and in relation to the GRT scale (both scales), a compliance time delay scale (job-centered red tape), and a formalization scale (TIRT scale).
Besides refining the measurement of GRT, scholars have gone beyond GRT and have developed and validated red tape measures for specific management subsystems (Coursey & Pandey, 2007). For instance, studies have examined red tape in the subsystems of personnel, procurement, information finance, and communication (e.g., Hattke et al., 2018; Moynihan 2012; Pandey & Garnett, 2006; Scott & Pandey, 2005; Stazyk et al., 2011). For example, measures related to personnel red tape include rules that make it hard to reward good performance or rules that discourage employees to seek internal job opportunities (Stazyk et al., 2011). Findings from these studies indicate that perceived levels of red tape can differ across subsystems within an organization, and the impact of red tape on organizational and employee outcomes are not necessarily similar across these subsystems (Leisink et al., forthcoming). Personnel red tape in particular may be detrimental to the effectiveness of human resource management (HRM) practices. As red tape alienates employees from their organization, they will view its intentions in the form of HRM practices as less positive, leading to lower HRM satisfaction (Blom, 2019). Thus, there are differences between general and specific red tape measures in an organizational context.
Outcomes of Red Tape in an Organizational Context
As red tape is often framed as a characteristic deeply rooted in all subsystems of an organization, it can have many different consequences (van Loon et al., 2016). Over the years, a wide variety of red tape outcomes has been studied. In the red tape literature, a distinction has been made between macro- (or organization)level and micro- (or employee)level approaches. Whereas an organization-level approach was dominant in early research, more recent studies have argued for an employee-level perspective. In this respect, van Loon et al. (2016) propose to study red tape using a job-centered approach, which contrasts with studies that focus on a manager- or organization-centered approach. Leisink et al. (forthcoming) also make this distinction, but argue that, although the approaches adopt different lenses, the mechanisms through which red tape affects organizations and employees are not necessarily different between these approaches. That is, red tape may impact employees and managers in a similar way, but on different levels. In line with the recent emphasis on micro-level research within the field of red tape, we also make a distinction between organizational- and employee-level outcomes of red tape.
Red tape and organizational-level outcomes
In general, it is claimed that red tape negatively affects organizational performance (Blom et al., 2018; Jacobsen & Jakobsen, 2018). It is commonly held that red tape constrains organizational practices and managerial behavior, resulting in diminished organizational performance. For example, red tape may inhibit managers from providing support for employees, may constrain (human resource [HR]) managers to reward or promote good performers and to punish or layoff poor performers, and may hinder managers to take calculated and productive risks (Hattke et al., 2018; Chen & Bozeman, 2012; Pandey et al., 2007). Moon and Bretschneider (2002) frame this constraining mechanism of red tape using a process-push perspective. According to this perspective, organizations are encumbered by administrative procedures (process) which increase (push) transaction costs that hinder behavior and reduce their performance.
Although the perspective of red tape as a constraining factor has been dominant in research, some scholars have viewed red tape as a facilitating factor with limited negative or sometimes even positive effects (Pandey & Bretschneider, 1997; Moon & Bretschneider, 2002). In this respect, it is argued that red tape may create incentives for (facilitates) change in organizations, motivating managers and employees to innovate organizational processes. Moon and Bretschneider (2002) frame this facilitating mechanism using a demand-pull perspective: red tape generates demand within the organizations to become creative and to find alternative solutions to reduce transaction costs to achieve high performance. In other words, red tape may actually lead to more positive organizational behavior as well as the resulting organizational performance.
Not only did the view on the effects of red tape became more nuanced over time, but also the degree of the negative effects of red tape on organizational behaviors and performance became increasingly scrutinized (Brewer & Walker, 2010). As today a broader array of organizational outcomes are studied, scholars have argued that some outcomes might be more affected than others. Although few studies to date have actually tested the differential effects of red tape on dimensions of organizational performance, their findings indicate that some organizational performance dimensions, such as service quality and equity, might be negatively influenced by red tape, while others, such as efficiency and effectiveness, might not (Brewer & Walker, 2010; Van Loon, 2017). The facilitating mechanism may, for instance, encourage innovation, which means efficiency is not stifled, while equity may be negatively influenced by penalizing those less able to understand and overcome red tape (Brewer & Walker, 2010).
Red tape and employee-level outcomes
The argued negative impact of red tape in the organization-level approach to studying red tape is also predominant within the employee-level approach. Scholars state that red tape constrains the behavioral choices of employees (Jacobsen & Jakobsen, 2018). According to van Loon and colleagues (2016), this negative relationship exists through two mechanisms. On the one hand, red tape ensures a compliance burden for employees, and, on the other hand, it ensures that employees feel a lack of efficacy. This latter component of red tape leads to feelings of powerlessness and meaninglessness through which employees become alienated from their work, illustrated in lower satisfaction, commitment, and engagement, and, hence, lesser performance (Borst et al., 2017; DeHart-Davis, 2005). More recently, scholars have used the Job Demands-Resources (JD-R) model, which states that job characteristics can be classified as either job demands or resources, to explain the negative effects of red tape (e.g., Brunetto et al., 2017; Borst et al., 2019; Cooke et al., 2019; Kjeldsen & Hansen, 2018; Quratulain & Khan, 2015). Based on this model, red tape is often framed as a hindering job demand that negatively affects employee attitudes, behaviors, and performance (e.g., Borst et al., 2019; Cooke et al., 2019).
However, not unlike the organization-level approach, the employee-level approach has also recently become more nuanced in how effects of red tape are perceived. Various recent studies have discussed the possibility that red tape is not necessarily harmful for employee outcomes (Borst, 2018; Cooke et al., 2019). For example, while some dimensions of red tape may indeed have hindering effects, other dimensions may not affect employee attitudes (Cooke et al., 2019). In addition, in their study among public servants, Borst et al. (2019) argue that red tape might have negative consequences for some public servants, such as public teachers and healthcare personnel, but not for others, such as central and local government employees. These arguments are based on the idea that red tape is not always a hindering job demand but could also be perceived as a challenging job demand, to which different individuals could react in different ways (Borst et al., 2019; Taylor, 2016).
Challenging job demands tend to be appraised as demands that have the potential to promote mastery and future gains, and can therefore be opportunities to learn and demonstrate those competences that tend to get rewarded (Crawford et al., 2010). With respect to red tape, Borst et al. (2017) indeed show that public servants might be more socialized in bureaucratic processes and, as a result, try to find a way to deal with red tape by using job resources. In turn, these resources have a motivational effect on work engagement. These employees provide a so-called internal attribution to red tape, meaning that they perceive these rules as a legitimate and necessary part of public sector work (Scott & Pandey, 2005). Thus, while red tape is often presented as a hindering job demand, negatively affecting employee outcomes, recent studies indicate that red tape might also be a challenging job demand that has no or even a positive indirect effect on employee outcomes.
In sum
Both the organization-level and employee-level approach acknowledge that besides constraining/hindering mechanisms, red tape may also offer facilitating/challenging mechanisms that may have positive or less negative effects. In addition, acknowledgment that both the outcomes of red tape as well as red tape itself are multidimensional constructs has led to a more nuanced and complete picture of the red tape–outcomes relationships. In our study, we discuss red tape similarly in a multidimensional way, as described in the next section.
Method
Search Strategy
Meta-analysis relies on a precise search strategy, and to identify relevant studies, we searched for empirical studies in July 2018 and January 2019. No limit for year of appearance was set, as all studies were deemed potentially relevant. Using “red tape,” “compliance burden,” “administrative burden,” “unnecessary rules,” and “ineffective rules” as keywords, we searched Web of Science, PsycINFO, and Business Source Complete for eligible studies. These databases were chosen for their complementary focus. For validation, the reference list of the review by Pandey and Scott (2002) was checked, which identified no additional studies. Finally, Google Scholar was used to identify studies that were available online but were not yet published in a specific issue. In total, 8,886 potentially useful studies were identified using this search strategy.
Inclusion Criteria
Only studies that met the following criteria were included in our meta-analyses. First, studies had to examine the relationship between red tape and one or more outcomes using a quantitative approach. Both objective and subjective measures of red tape were included, regardless of whether existing measures were used or whether new measures were developed. Second, only studies that examined outcomes within an organizational context were included. Thus, studies analyzing the impact of red tape on a country-level (Ciccone & Papaioannou, 2007), studies experimentally testing red tape in a lab-setting (Tummers et al., 2016), and studies focusing on antecedents of red tape were excluded. Third, only studies that provided the necessary statistical information to perform our meta-analyses (i.e., zero-order correlations and sample sizes) were included. If studies met the other inclusion criteria, but did not provide the necessary statistical information, corresponding authors were contacted in an attempt to obtain the missing information. Fourth, if a sample was used in multiple studies, only the study that provided the most information was included. If multiple studies provided the same information, the oldest study was seen as the “original” study, while subsequent studies were seen as “duplicates,” and only the oldest study was included. Finally, due to language barriers and, hence, possible misinterpretation of study findings, only studies that were published in English were included.
Coding Procedure
Study characteristics and all the necessary statistical information were coded using a coding scheme developed by the first author. The coding scheme was cross-validated by the third author. “Method” and “Results” sections of the different included studies were the primary sources of information during the coding process. The first author coded all studies. Furthermore, to assess the intercoder reliability, the third author independently coded a random subset of 18 studies. Only a few small differences were found across the coders, which were resolved after discussions.
The coding scheme contained three sections: (a) study characteristics, (b) the red tape variable(s), and (c) the outcome variable(s). In the first section, we coded for the author names, year of publication, sample size, country in which the data were collected, and the type of organization mentioned in the study. We coded for geographical area using the Global Leadership and Organizational Behavior Effectiveness (GLOBE) study (House et al., 2004) and sector as well. In the second section, we coded for the type of red tape (general or type of subsystem), source of red tape scores, the type of red tape measure (existing or developed), and number of indicators. In the third section, we coded for type of outcome, source of outcome scores, type of outcome measure (existing or developed), and effect size. A list of all the outcomes found in the included studies is shown in the Appendix.
Operationalization of Main Concepts
Red tape
In line with previous studies, we distinguished between general and specific red tape (Borry, 2016; van Loon et al., 2016). GRT refers to those studies that focused on burdensome, unnecessary, and ineffective rules in organizations in general, whereas specific red tape refers to red tape in specific management subsystems (e.g., personnel, procurement, and communication).
Outcomes of red tape
As mentioned before, red tape is deeply rooted in all subsystems of an organization and can have many different consequences. Rather than focusing on a limited set of outcomes, our aim was to test the full range of the effects of red tape in an organizational context found in the literature. Following previous research on red tape, we distinguished between organization- and employee-level outcomes.
For organization-level outcomes, we further specified the effects into organizational performance and organizational behavior. As scholars have argued that red tape may be positively related to innovativeness (Moon & Bretschneider, 2002), we further distinguished organizational performance between effectiveness and efficiency outcomes and innovativeness outcomes. Examples of organizational behavior included organizational communication (Moynihan, 2012) and use of digital services (Wang & Feeney, 2016).
For employee-level outcomes, both effects on employee attitudes and employee behavior were included. Employee attitudes included outcomes such as work satisfaction (Kjeldsen & Hansen, 2018) and organizational commitment (Stazyk et al., 2011). Employee behavior included outcomes such as job performance and absenteeism (Taylor, 2016).
Analytic Procedure
Our final data set contained some interdependent effect sizes, as some studies investigated the effects of red tape on multiple similar outcomes. When ignoring dependency between effect sizes in meta-analyses, standard errors of the effects and their heterogeneity are potentially biased (Cheung, 2014). A common approach to deal with these dependencies is to calculate composites from effect sizes (Borenstein et al., 2011). Although this approach removes the related errors, valuable information from individual effect sizes is lost due to the aggregation. In this study, a three-level meta-analytical approach was used to account for these dependencies without overestimating results (Cheung, 2014). In a three-level approach, sampling variation of each effect size is modeled as a Level 1 factor, variation within studies as a Level 2 factor, and variation between studies as a Level 3 factor (following Van Den Noortgate et al., 2013).
To calculate the effect sizes for the relationship between red tape and outcomes, three-level random effects models were fitted using the meta3 function of the metaSEM package in R (Cheung, 2015). In contrast to fixed-effects models, random-effects models assume that variance in effect sizes depends on both sampling error and differences between studies. In line with the notion that research in social sciences always varies on study characteristics, the random-effects model was deemed most appropriate. Effect sizes were calculated based on zero-order correlations provided in the included studies or calculated if sufficient statistical information was given. In addition, likelihood-based confidence intervals (LBCIs) were calculated to interpret the uncertainty of the effect sizes. Based on Cohen (1988), we interpreted effect sizes of 0.10, 0.30, and 0.50 as small, medium, and large effect sizes.
Publication bias
Due to the possibility that nonsignificant findings go unreported, meta-analyses could present a too optimistic view of the state of the literature (Kepes et al., 2012). To assess this impact of publication bias on the effects of red tape on organizational and employee outcomes, we used Egger’s test of the intercept and Duval and Tweedie’s trim and fill method (Duval & Tweedie, 2000; Egger et al., 1997). Significant Egger’s test statistic may indicate possible publication bias while the trim and fill method provides effect sizes if this bias would not be present.
Moderator analysis
To assess the robustness of the effect sizes, we assessed whether moderators impact the effect sizes by checking several heterogeneity statistics for the amount of variation within and between studies. In a three-level meta-analysis, statistics for the absolute amount of variation on Level 2
Following the debates in the literature (e.g., Bozeman, 2012; Chen, 2012b; Coursey & Pandey, 2007; Moynihan, 2012; Van Loon et al., 2016), we tested the moderating role of context and of the different ways to measure red tape. First, for those relationships with significant heterogeneity on Level 3, we coded and tested contextual moderators related to sector and to geographical area. In particular, we performed subgroup analyses for studies conducted in governmental organizations, subdivided in national and local-level organizations, and semi-public organizations, subdivided in education, security, and healthcare organizations. Furthermore, we performed subgroup analyses based on geographical area. Second, for those relationships with significant heterogeneity on either Level 2 or Level 3, we tried to capture the various approaches to red tape by conducting subgroup analyses. Given the argument that the impact of red tape may differ across organizational areas (Coursey & Pandey, 2007), we tested for differences between general and subsystem red tape. Furthermore, following the debates on how to measure red tape adequately and the recent developments of GRT measure (e.g., Borry, 2016; Van Loon et al., 2016), we tested for differences between measures using single indicators versus multiple indicators.
Findings
Preliminary Analysis
The final data set contained 502 effect sizes from 55 samples in 53 studies with a total unique sample size of 200,855 respondents. Slightly more effect sizes were found for organization-level outcomes (59%) than for employee-level outcomes (41%). Most effect sizes that were found linked to organizational behavior (47%) and employee attitudes (38%), followed by organizational performance (12%) and employee behavior (3%). The included studies were published between 1990 and 2018, with most published after 2010 (69%).
Considering the quality of the studies, almost all reported the response rate (96%), and the majority used existing measures for both red tape (72%) and dependent variables (65%), although the validity of most measures was unclear. However, only a minority of the studies mentioned the use of random sampling (15%), included a time lag between the independent and dependent variables (6%), and used multiple informants (15%).
Study context
Unsurprisingly, most effect sizes were derived from government samples (83%), including national-level government (55%), local-level government (17%), and a mix of governmental levels (11%). Furthermore, some studies focused on semi-public organizations (12%), including education (8%), security (3%), and healthcare (1%), while one effect size from the nonprofit sector was found. Finally, a few studies examined a mix of public, private, and nonprofit sectors (5%). Most studies were conducted in Anglo-Saxon countries (75%), followed by studies in Germanic and Nordic European countries (22%).
Red tape measurement
Concerning the type of red tape, most effect sizes were based on GRT scales (37%), and more than half of these effect sizes were based on scales that included the term “red tape” in the items (22%). Of the red tape types that concerned specific subsystems, effect sizes for personnel red tape were found most (29%), followed by procurement red tape (11%), budgetary red tape (8%), information systems red tape (7%), and communication red tape (7%). The majority of the studies measured red tape using a single indicator (65%), although strong differences exist between types of red tape (communication red tape: 91%; information systems red tape: 91%; budgetary red tape: 76%; GRT: 65%; procurement red tape: 56%; personnel red tape: 50%).
Overall Estimates of the Impact of Red Tape
We start by presenting the results for the organization-level outcomes. Table 1 shows the effects of red tape on organizational performance and behavior, sorted by mean sample-weighted correlation. For organizational performance, red tape has a negative effect on innovation that statistically differs from zero, while the effect on effectiveness/efficiency does not. For organizational behavior, moderate negative effects of red tape are found on risk culture and organizational support, while small to moderate effects are found on leadership, goal clarity, and communication. Finally, a small negative effect is found on innovation culture, while the effects on networking and information technology (IT) use do not statistically differ from zero.
Meta-Analytic Correlations Between Red Tape and Organization-Level Outcomes.
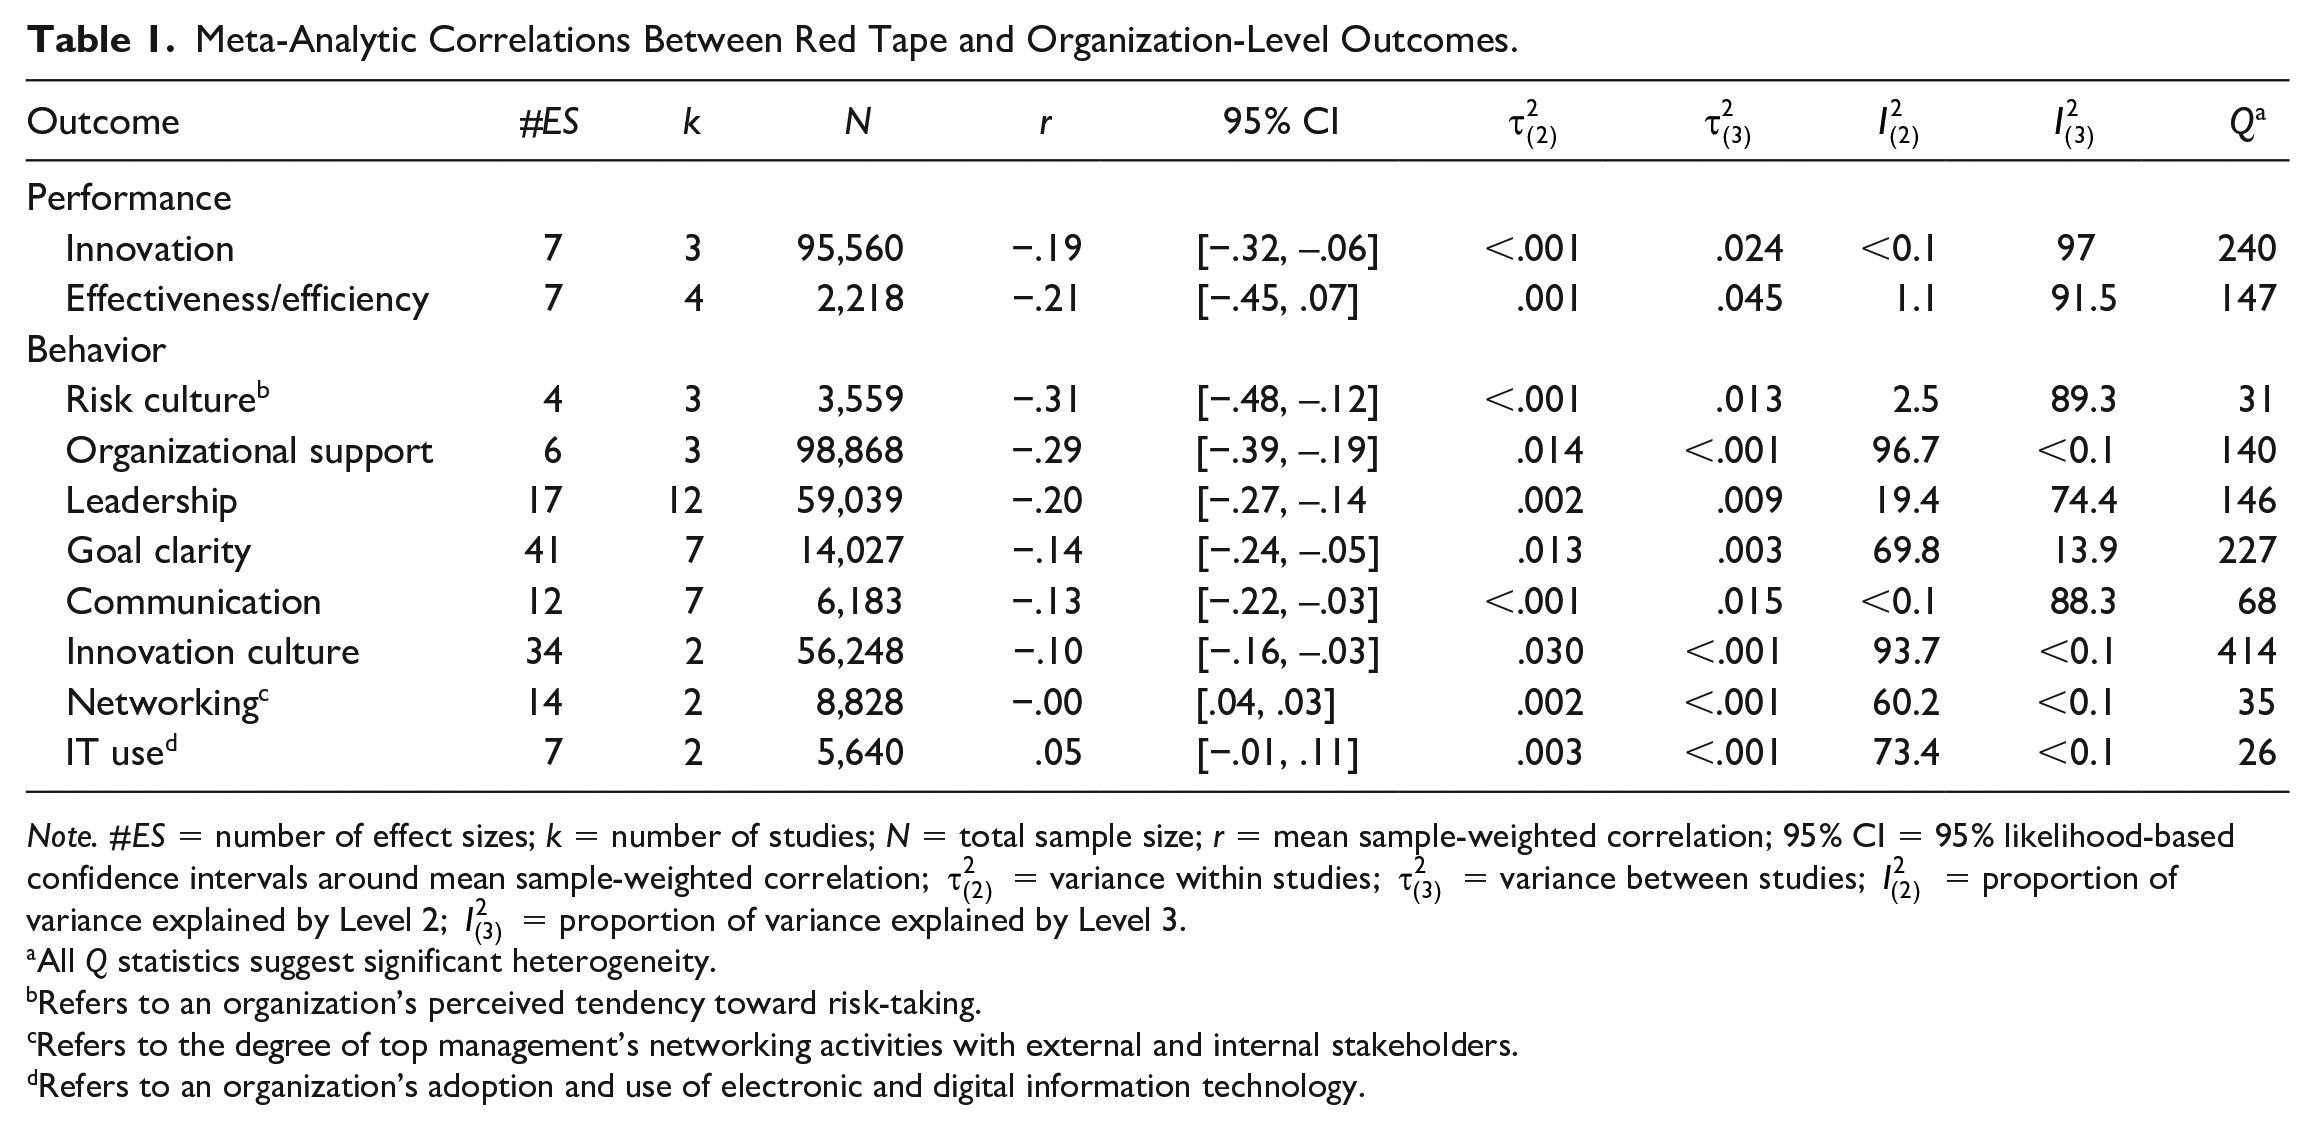
Note. #ES = number of effect sizes; k = number of studies; N = total sample size; r = mean sample-weighted correlation; 95% CI = 95% likelihood-based confidence intervals around mean sample-weighted correlation;
All Q statistics suggest significant heterogeneity.
Refers to an organization’s perceived tendency toward risk-taking.
Refers to the degree of top management’s networking activities with external and internal stakeholders.
Refers to an organization’s adoption and use of electronic and digital information technology.
Next, Table 2 presents the effects of red tape on employee attitudes and behavior. Red tape has a moderate to large negative effect on health-related well-being, while small to moderate negative effects are found on role clarity, perceived autonomy, commitment, work satisfaction, work motivation, and intention to stay. A small negative effect is found on work engagement, while the effects on job involvement and public service motivation (PSM) do not statistically differ from zero. For employee behavior, the effect on employee performance does not statistically differ from zero.
Meta-Analytic Correlations Between Red Tape and Employee-Level Outcomes.
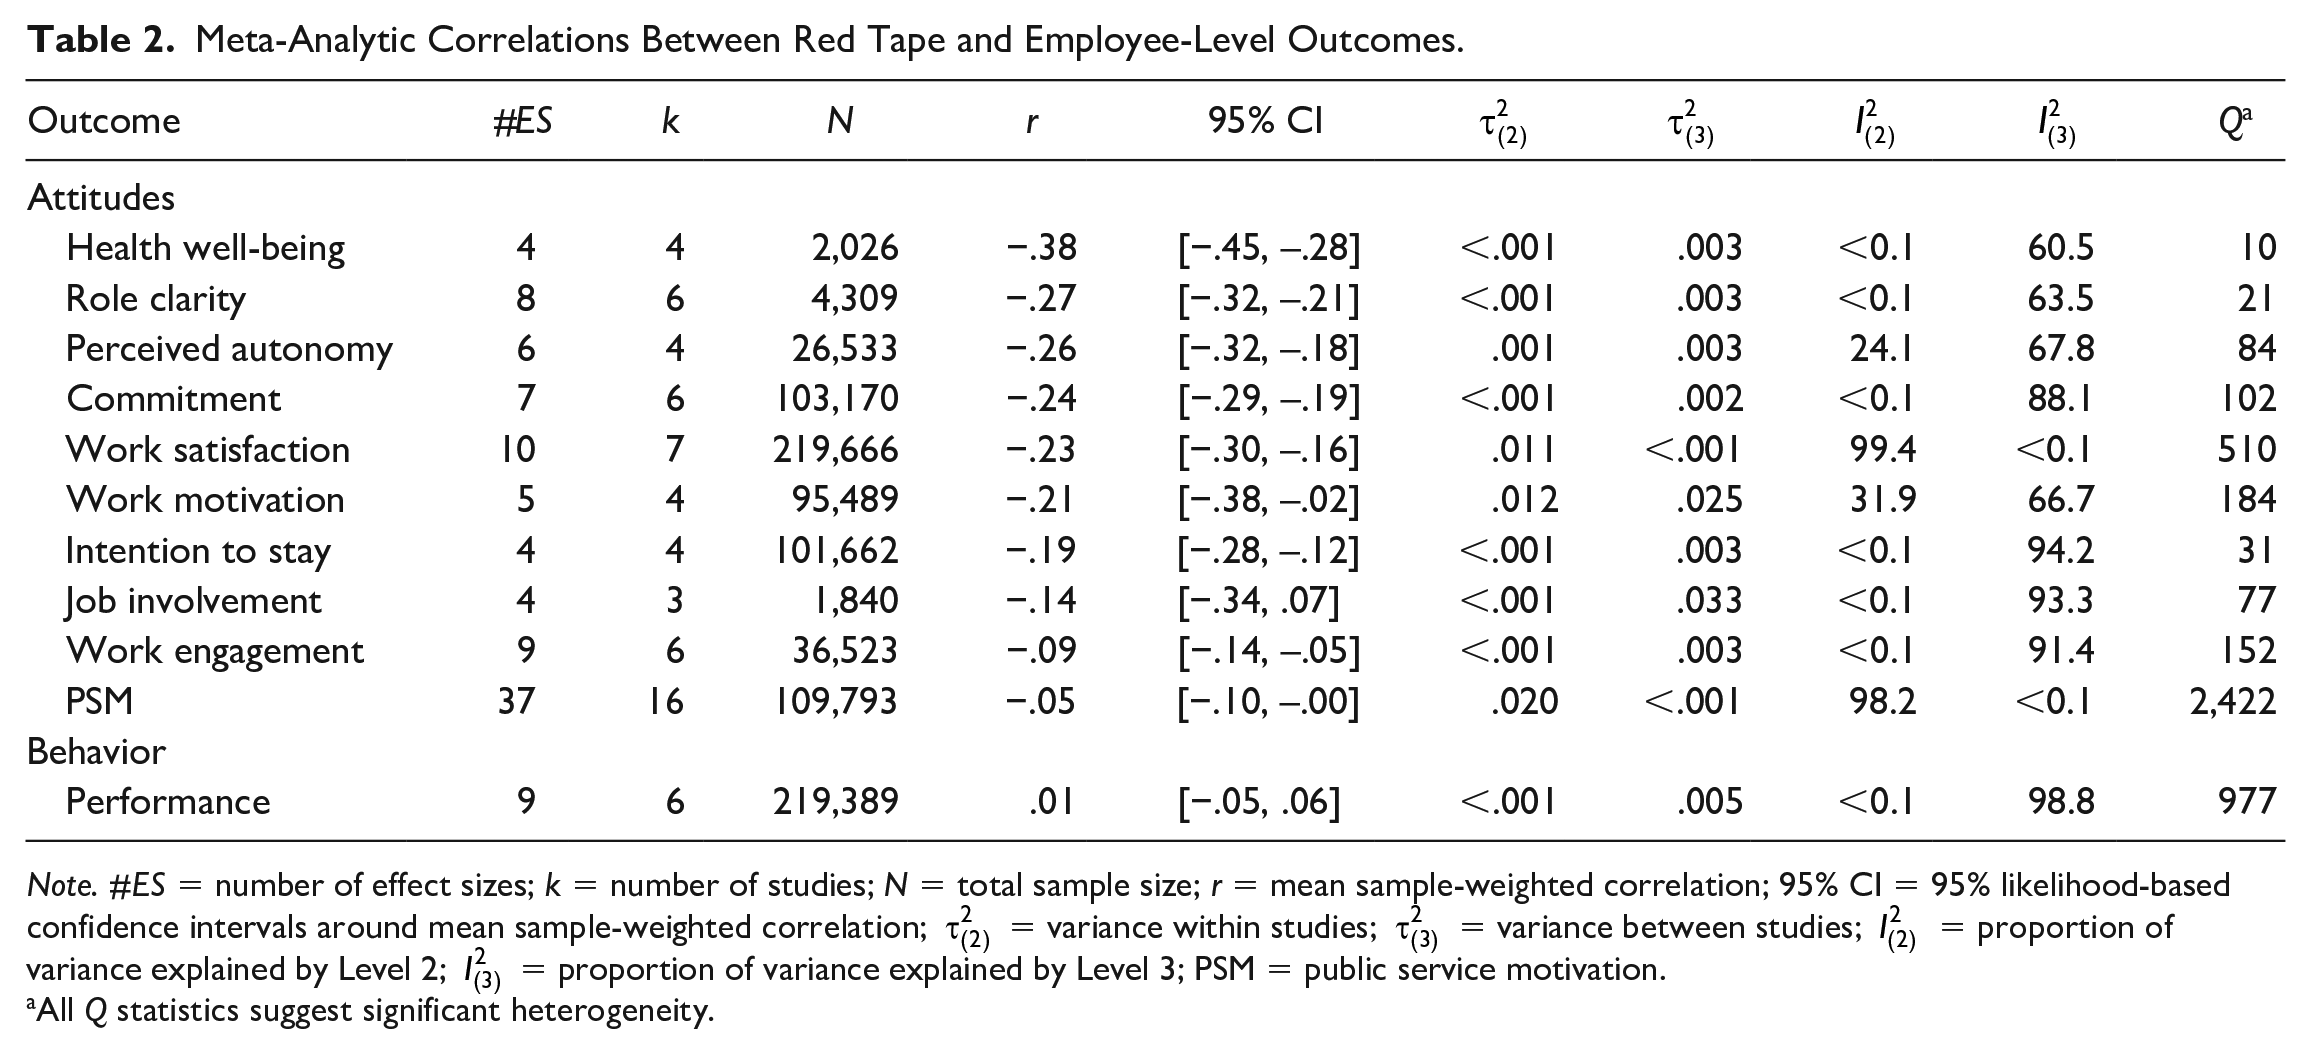
Note. #ES = number of effect sizes; k = number of studies; N = total sample size; r = mean sample-weighted correlation; 95% CI = 95% likelihood-based confidence intervals around mean sample-weighted correlation;
All Q statistics suggest significant heterogeneity.
Publication Bias
In Table 3, the results from Egger’s test of the intercept and Duval and Tweedie’s trim and fill method, used to assess the potential impact of publication bias, are shown. For most effect sizes, both measures show that the presence of publication bias is unlikely. Although Egger’s test statistic is significant for risk culture, role clarity, and intention to stay, the trim and fill method indicates that the confidence intervals of the trim-and-fill-adjusted correlations are not statistically different from the confidence intervals from the mean sample-weighted correlation. This indicates that the possible bias in risk culture, role clarity, and intention to stay has little impact on the effect sizes.
Measures of Publication Bias.
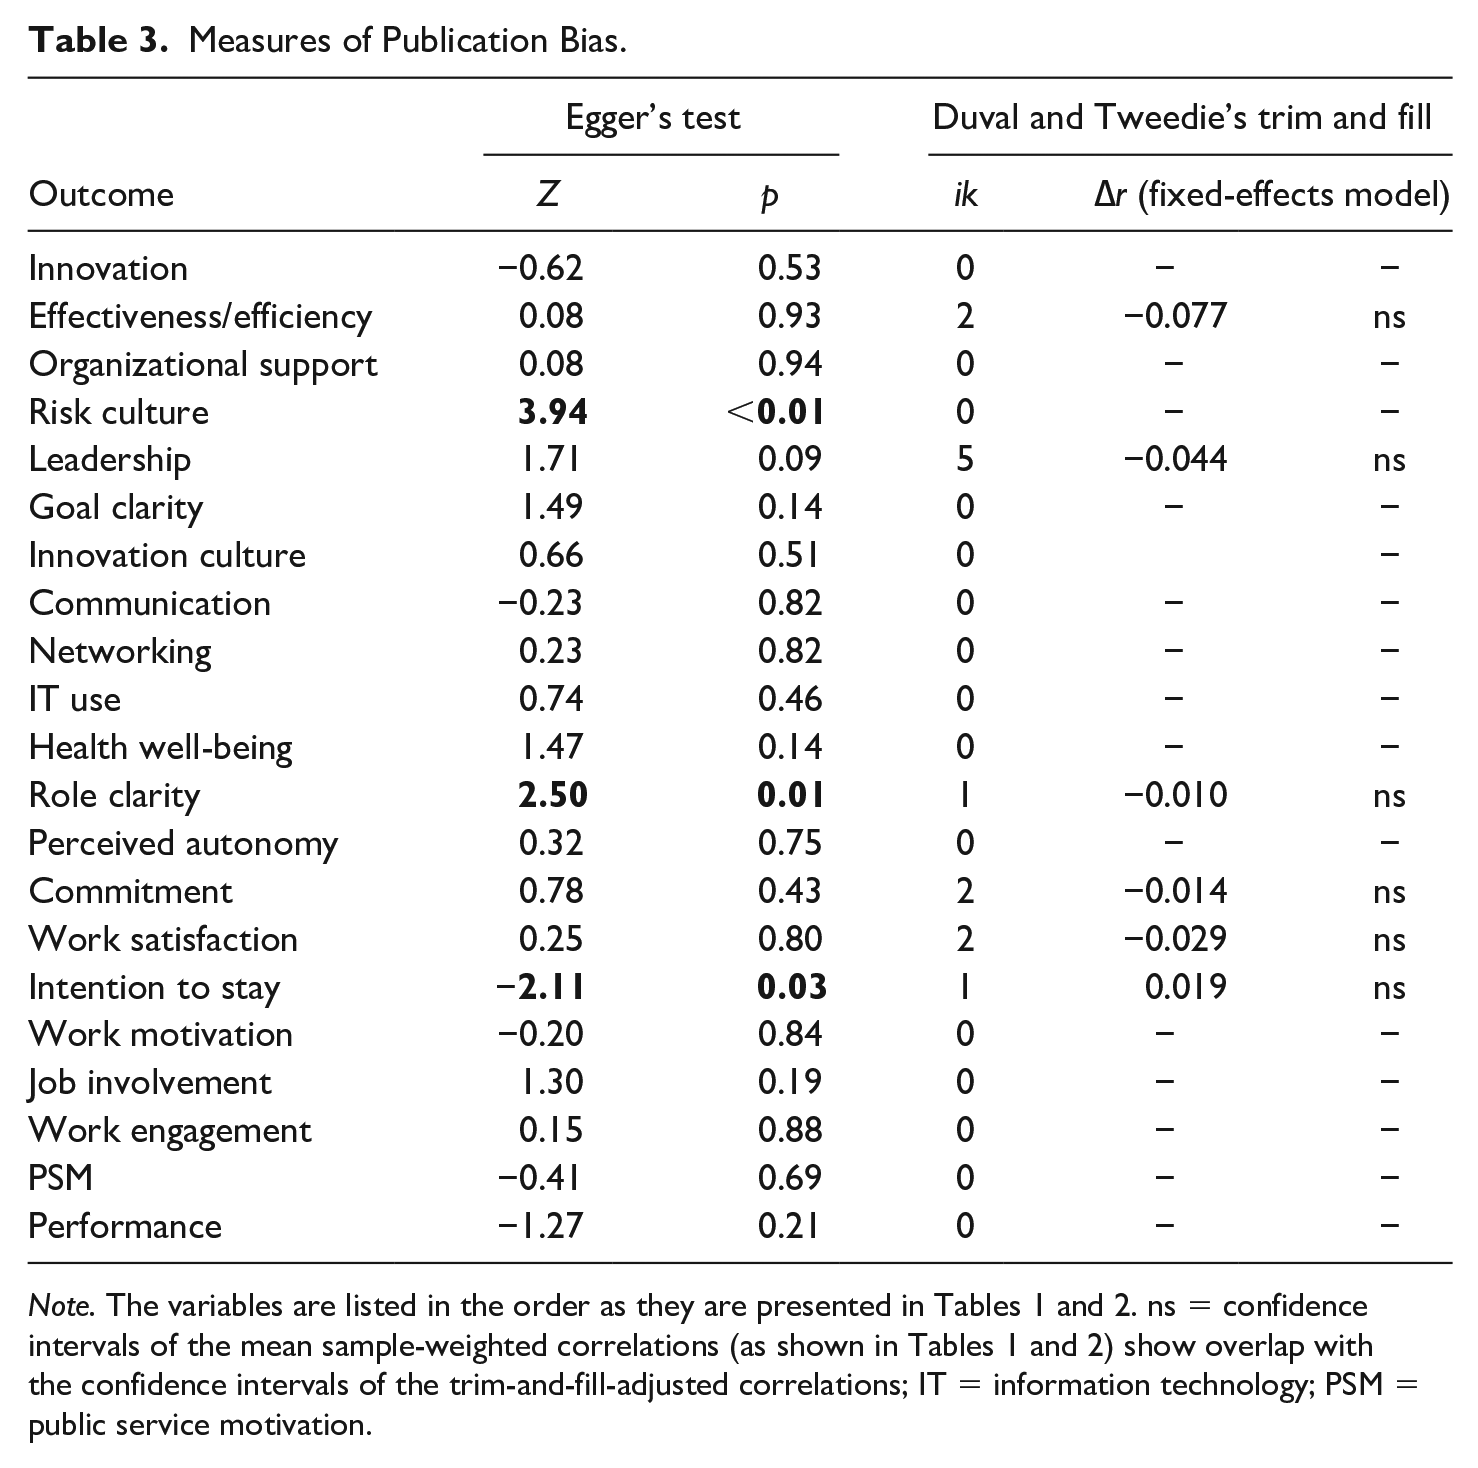
Note. The variables are listed in the order as they are presented in Tables 1 and 2. ns = confidence intervals of the mean sample-weighted correlations (as shown in Tables 1 and 2) show overlap with the confidence intervals of the trim-and-fill-adjusted correlations; IT = information technology; PSM = public service motivation.
Moderating Role of Context and Measurement
To assess whether the impact of red tape differs across contexts, we conducted moderator analyses. As most of the meta-analytic correlations are based on a relatively small number of effect sizes, we followed Schmidt (2017) and performed subgroup analyses instead of meta-regression. To be able to compare effect sizes, subgroup analyses were only performed if at least two studies for at least two subgroups were present.
In Table 4, the results of the subgroup analyses for those relationships that showed considerable variation on Level 3 (i.e., between-study variation) are presented. Comparing the effect sizes across sectors and geographical areas, there are two noteworthy findings, although they should be interpreted with caution. First, red tape seems to affect organizational performance differently in “bureaucratic” government organizations than in semi-public organizations. Whereas a moderate effect is found in government organizations, the effect in semi-public organizations does not statistically differ from zero. Moreover, the confidence intervals for government organizations and educational organizations do not overlap. A similar trend is shown for work engagement, although the confidence intervals show considerable overlap between the sectors. Second, geographical area seems to influence the effects of red tape on organizational performance. Organizational performance seems more strongly affected by red tape in organizations based in Anglo-Saxon countries than in organizations based in Germanic and Nordic European countries.
Results of Subgroups Analyses for Contextual Moderators.
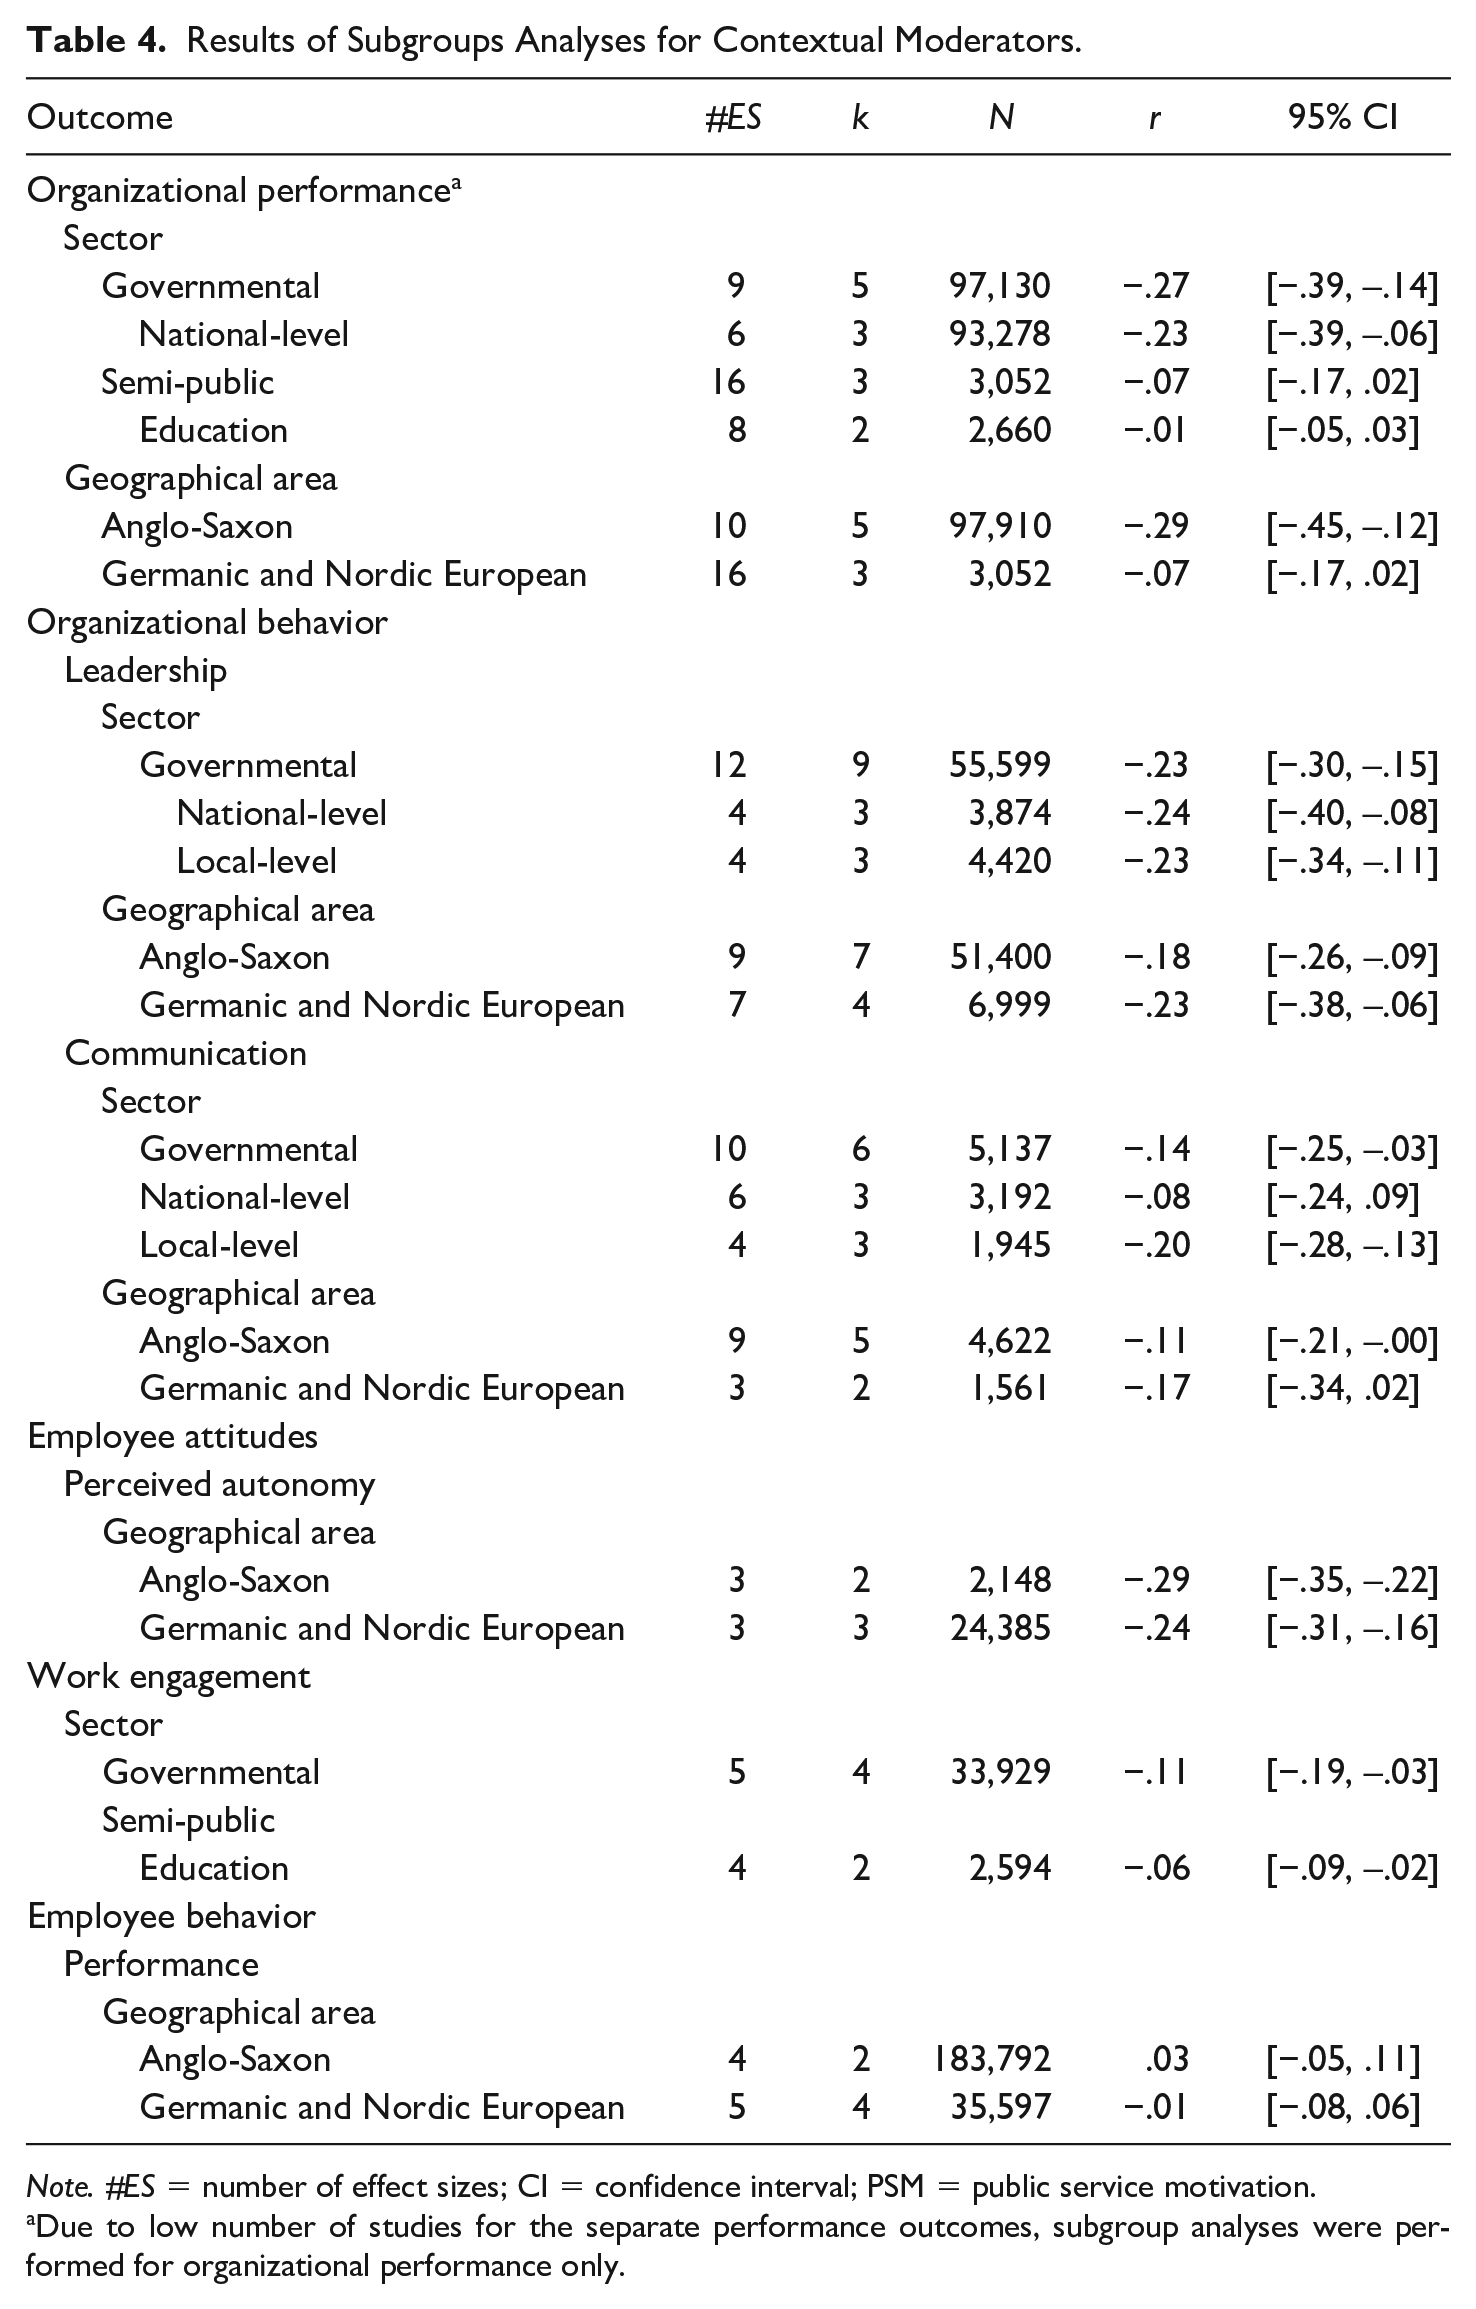
Note. #ES = number of effect sizes; CI = confidence interval; PSM = public service motivation.
Due to low number of studies for the separate performance outcomes, subgroup analyses were performed for organizational performance only.
In Table 5, the results of the subgroup analyses related to the measurement of red tape are shown for those relationships that showed considerable variation on either Level 2 or 3. Because the effect sizes for procurement, budgetary, information systems, and communication red tape are derived from just five studies and are scattered across outcomes, only the subgroups related to general and personnel red tape were analyzed.
Results of Subgroup Analyses for Red Tape Measurement Moderators.
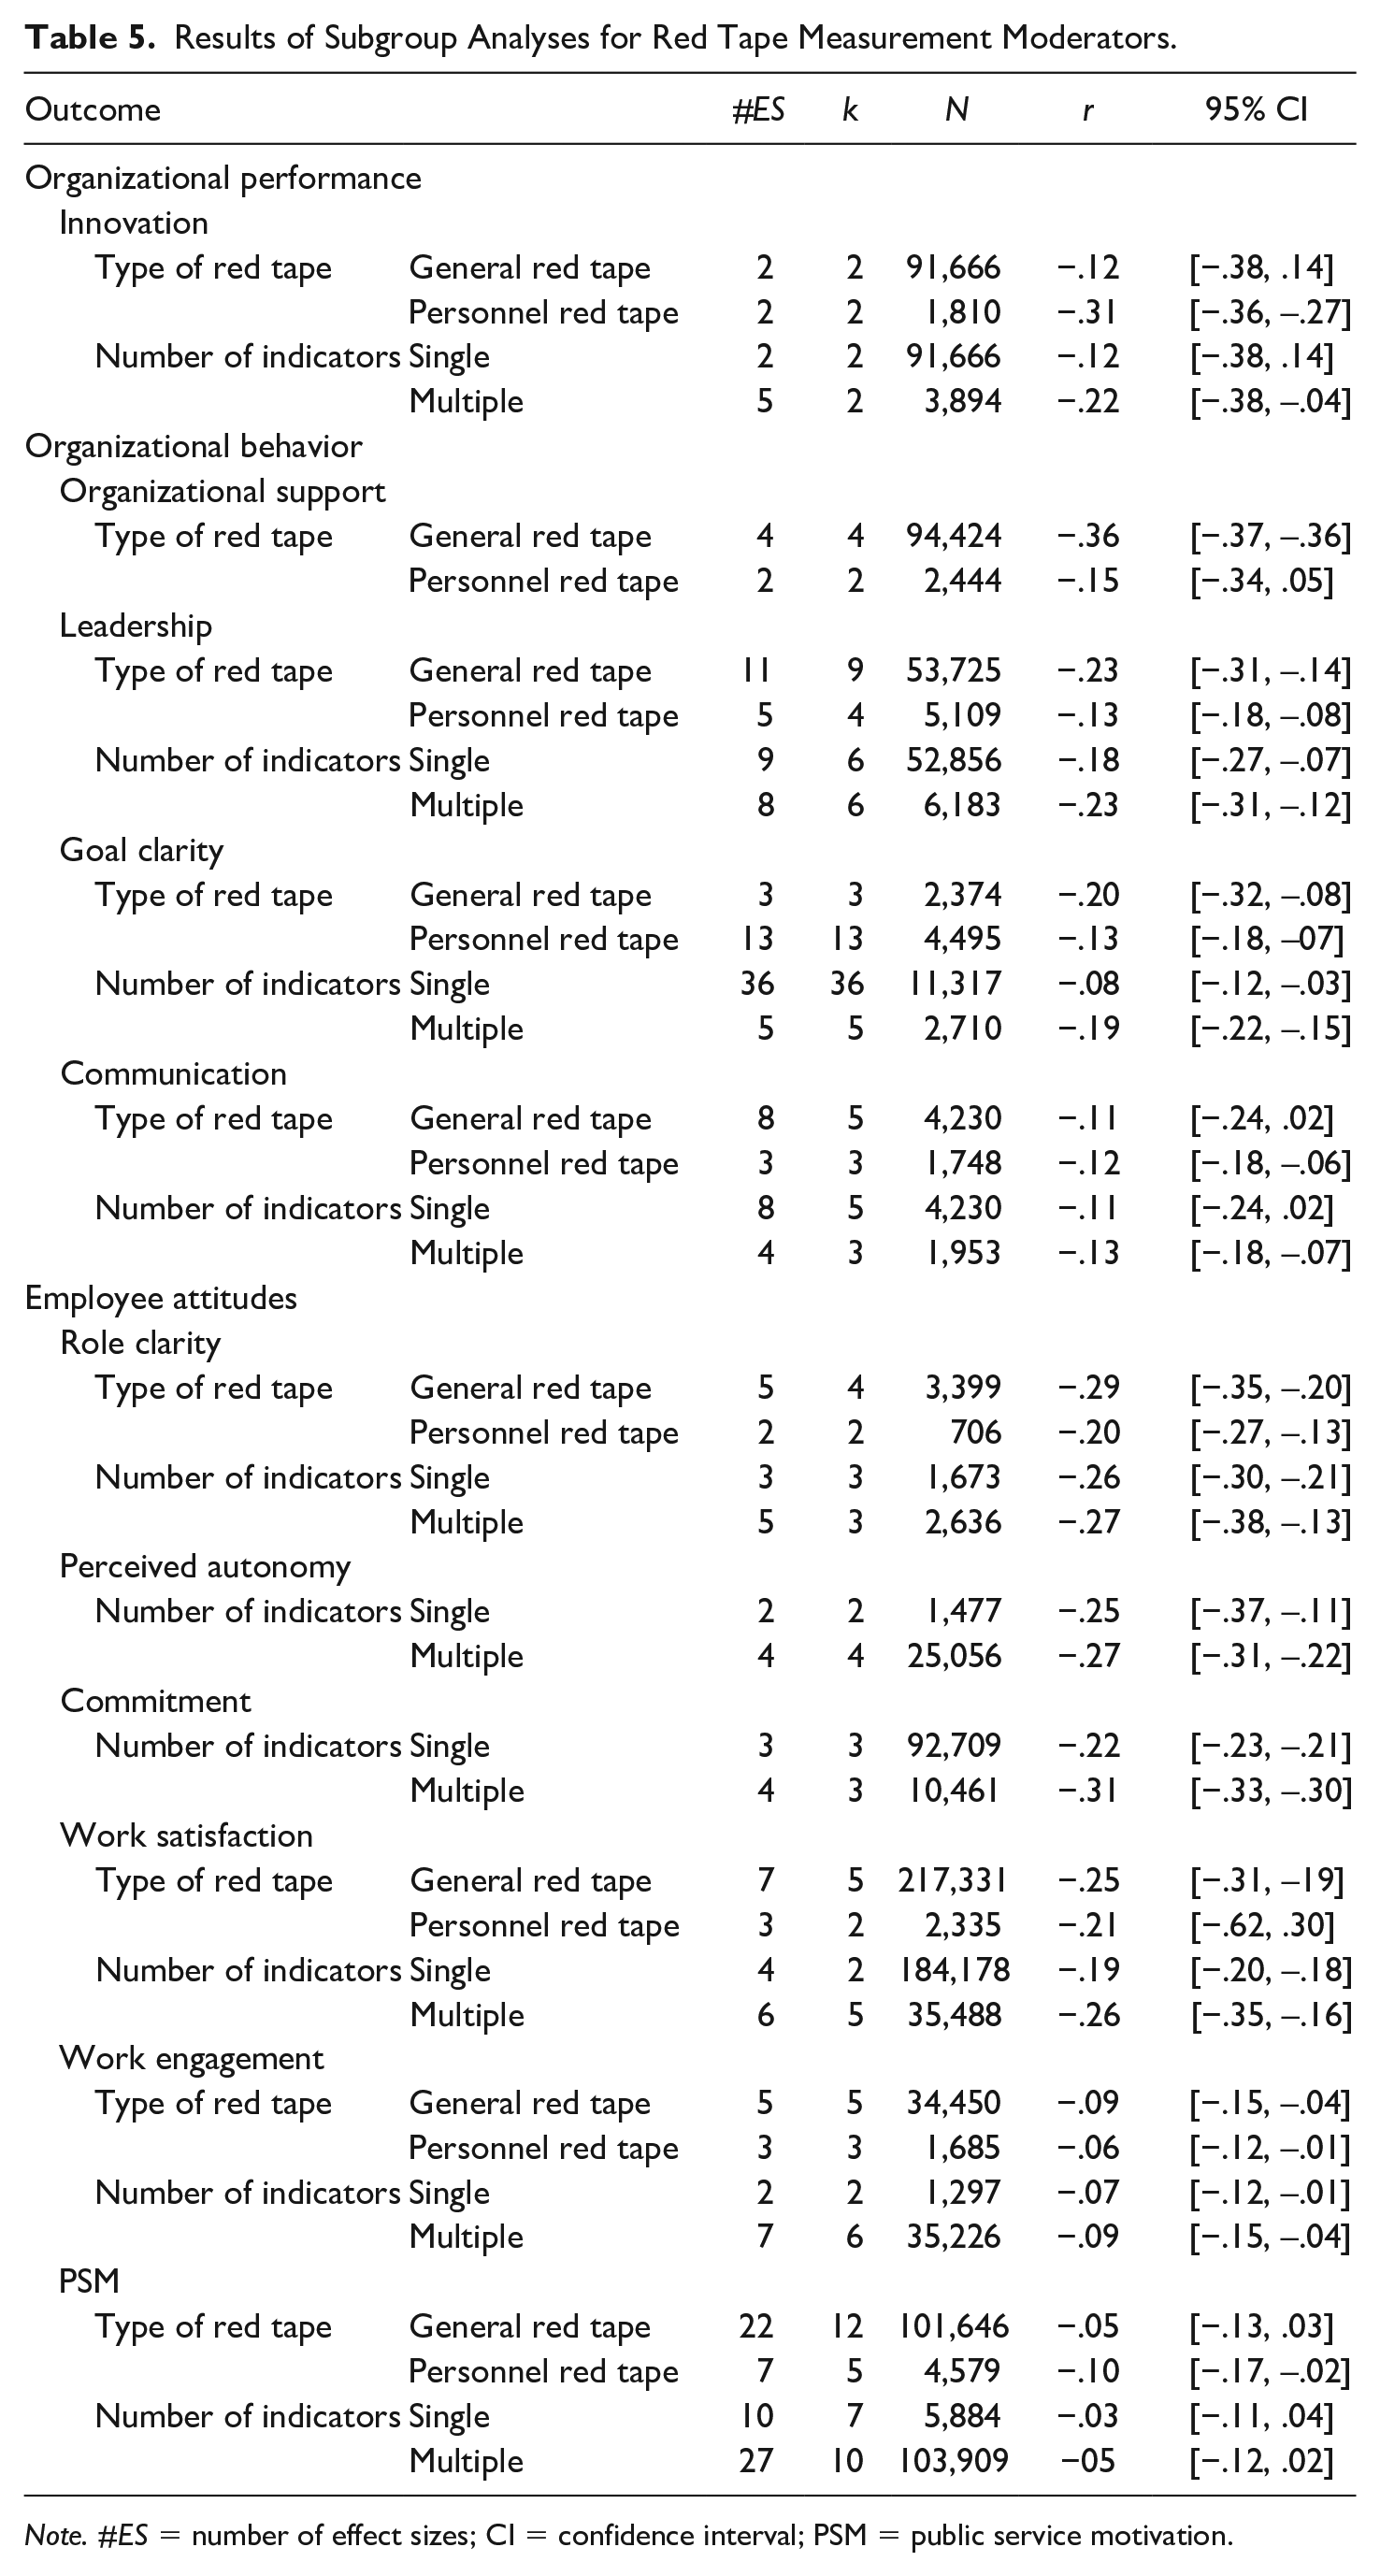
Note. #ES = number of effect sizes; CI = confidence interval; PSM = public service motivation.
Overall, general and personnel red tape seem equally detrimental, although GRT seems to have a stronger effect in some outcomes. In particular, GRT seems more detrimental for organizational support and leadership behaviors than personnel red tape. In contrast, personnel red tape seems to negatively impact organizational innovation more than GRT. Regarding the number of indicators, no strong differences between red tape scales using single and multiple indicators were found, although scales using multiple indicators showed slightly stronger effects.
Discussion
The goal of this study was to examine the effects of red tape in an organizational context using a meta-analytic approach. Given the debate in the red tape literature on how detrimental red tape is to an organization, this approach allowed us to contribute to the literature on the impact of red tape by (a) aggregating findings of previous studies by estimating general effect sizes and (b) assessing sources of heterogeneity by testing the impact of contextual and measurement moderators. In line with the general consensus in red tape literature (Borry, 2016; Bozeman, 2012), we find support for the claim that red tape is detrimental to the organization, although large negative effects are rare, and the effects differ across types of outcomes. The lack of evidence for publication bias further enhances our confidence in the robustness of our results. In addition, our results indicate that certain effects are moderated by context and by the operationalization of red tape.
Our results support the notion that red tape has negative organizational consequences in various ways (Blom et al., 2018; DeHart-Davis, 2005; Jacobsen & Jakobsen, 2018). In particular, the negative relationships with organizational support, leadership, and perceived autonomy demonstrate that red tape hinders managerial behavior aimed at providing employees with opportunities and support to perform (Hattke et al., 2018), while the negative relationships with innovation and risk culture show that this constraining effect is also noticeable in an organization’s culture (Chen & Bozeman, 2012). Second, the negative impact of red tape on perceptions of goal and role clarity indicates that it is difficult for employees to distill organizational values: perhaps, administrative constraints create another set of goals in addition to existing organizational goals (Pandey & Wright, 2006).
In addition to this impact on the organizational level, our results show that red tape has a negative impact on the individual level as well, such as on work satisfaction, organizational commitment, work motivation, job involvement, and intention to stay. These findings illustrate that red tape is not only a hindering or constraining factor for how employees perform their job, but also, or perhaps especially, a factor associated with alienation, as it can lead to feelings of powerlessness and meaninglessness among employees (DeHart-Davis, 2005).
In contrast to the negative impact on employee attitudes, work engagement and PSM, both viewed as key resources playing an important role in employee behavior (Borst et al., 2019; Harari et al., 2017), seem at most only slightly related to red tape. One explanation is that the level of engagement and PSM of employees is not dependent on organization-related factors or on the attributes employees provide to the presence of red tape (Scott & Pandey, 2005), but more on work- and personal-related factors.
Although our study confirms the negative impact of red tape on organizational behavior and employee attitudes, it also shows that red tape is not detrimental to organizational effectiveness and efficiency, and employee performance. Thus, while red tape may constrain the use of organizational practices and may alienate employees from their organization, the resulting performance does not seem directly affected by red tape. This is interesting, as one of the key ideas of New Public Management–inspired reforms was to reduce bureaucracy to increase the efficiency and effectiveness of the public sector (Alford & Hughes, 2008). Perhaps coping cultures are present in many public organizations, where strategies are developed to work around burdensome rules and mitigate their impact (Pandey et al., 2007). In a similar vein, employees may adopt coping strategies by perceiving red tape as a challenging demand that provides opportunities for mastery and growth (Borst et al., 2017; Crawford et al., 2010). However, while working around burdensome rules may enable employees to perform effectively, this may come at the cost of increased work stress and, hence, lower health-related well-being.
Our results show that specific study characteristics influenced only a few effect sizes, although we admit that, given the presence of heterogeneity, there are other potential moderators, such as organizational size, job type, and industry. As the information provided in the studies in our meta-analysis was insufficient to test a broader range of moderators, future research is needed to test the moderating effects of other situational and contextual factors. For example, as indicated by some studies taking an organizational echelons approach (Campbell, 2017; Walker & Brewer, 2008), factors related to the job context, such as occupation and hierarchical position, may impact perceptions of red tape and, hence, also the effects of red tape. In addition, the effects of red tape may also be moderated by organizational and managerial practices, such as HRM practices and transformational leadership, as these factors can reduce employee perceptions of red tape by increasing their understanding of and aligning individual goals with organizational goals (Moynihan et al., 2012).
In line with the increased attention for the operationalization of red tape, our findings indicate that it matters in some instances if GRT or red tape in a specific management subsystem is measured, especially on the organizational level. Noteworthy is the finding that personnel red tape has a stronger effect on organizational innovation. Red tape in personnel management is typically argued to impede managers’ ability to provide employees autonomy and does not allow them to reward outstanding employees. These issues are particularly important in situations that require innovative ways of thinking. Alternatively, personnel red tape may also create ambiguity in the procedures for how to adequately reward and punish employees. This ambiguity may, in turn, induce managerial favoritism as the manager is inclined to reward friends and punish foes to strengthen his or her position. Since innovative ways of thinking may affect the status quo, managers are not likely to reward innovation.
Despite support for the idea that red tape is detrimental to the organization through constraining and motivational mechanisms, it is still important to be cautious about the findings. Although we have learned a great deal from the bulk of literature studying the effects of red tape and the overall quality of studies can be considered adequate, there are several remarks to be made about the methodology adopted by many studies, which also act as constraining factors for this meta-analysis.
First, only one of the identified studies included a time lag between the independent and dependent variables (Burke et al., 1996). Although including a time lag does not establish causal effects nor excludes endogeneity, it does act as a prerequisite for causal attribution. Therefore, longitudinal studies, using for example diaries, and intervention studies using a pre- and posttest design are needed to gain further understanding in the causal effects of red tape. In this respect, a noteworthy development is the rise of studies employing an experimental approach (Kaufmann & Feeney, 2014; Kaufmann & Tummers, 2017; Tummers et al., 2016). In contrast to most cross-sectional research, these studies use vignettes to expose participants to scenarios varying in red tape. Given its ability to test for causal effects and eliminate most confounding causes, the experimental design has “much to contribute to knowledge of red tape” and may “prove useful in testing more complex hypotheses about red tape” (Bozeman, 2012, p. 260).
Second, most of the studies measured red tape and outcomes using a single respondent, potentially introducing common source bias (see for some exceptions Jacobsen & Jakobsen, 2018; Park & Hassan, 2018; van den Bekerom et al., 2017). As common source bias generally creates an upward bias in the correlations, the impact of red tape may in fact be less strong than often argued. Although the perception of red tape is an important factor influencing employee attitudes and a single-source design can have value in this regard, more objective sources for outcomes are needed, especially when measuring organizational performance. To accurately assess the impact of actual red tape on outcomes, but also on perceptions of red tape, future studies need to adopt multi-source designs.
Finally, the studies included in our meta-analysis seem to be only representative for certain types of organizations and respondents. For example, among the studies we identified, there seems to be an overrepresentation of Western, Educated, Industrialized, Rich, and Democratic (WEIRD) respondents (Henrich et al., 2010). As a result, we know little about the workings and levels of red tape in developing countries, and among respondents that are less educated and less wealthy. As most studies were conducted in only a few countries, one could even question the generalizability of the findings to unresearched WEIRD countries as well.
Conclusion
The effects of red tape have attracted the attention of many studies in the past decades, investigating red tape’s impact in an organizational context. Nevertheless, so far, no attempt has been made to quantitatively assess the empirical evidence. This study addressed this issue by using a meta-analytic approach. For public and HRM research, our study shows support for the constraining and hindering mechanisms of red tape, as a wide variety of outcomes are negatively affected, although large effects are rare, and some effects seem negligible. In addition, we found a considerable amount of heterogeneity between and within studies that could be partially explained by differences in sectoral and geographical context and differences in red tape measurement.
For practitioners, our findings confirm the notion that red tape is detrimental to an organization and that interventions aimed at reducing its effects should be considered seriously. Although the small effects of red tape on performance (i.e., organizational effectiveness and efficiency and employee performance) may reduce the sense of urgency for organizations to deal with red tape, red tape’s negative impact on organizational practices and employee attitudes indicate that measures aimed at reducing red tape in organizations can have far-reaching positive consequences.
Footnotes
Appendix
List of All Organizational- and Individual-Level Outcome Variables Found, Sorted by Number of Studies.
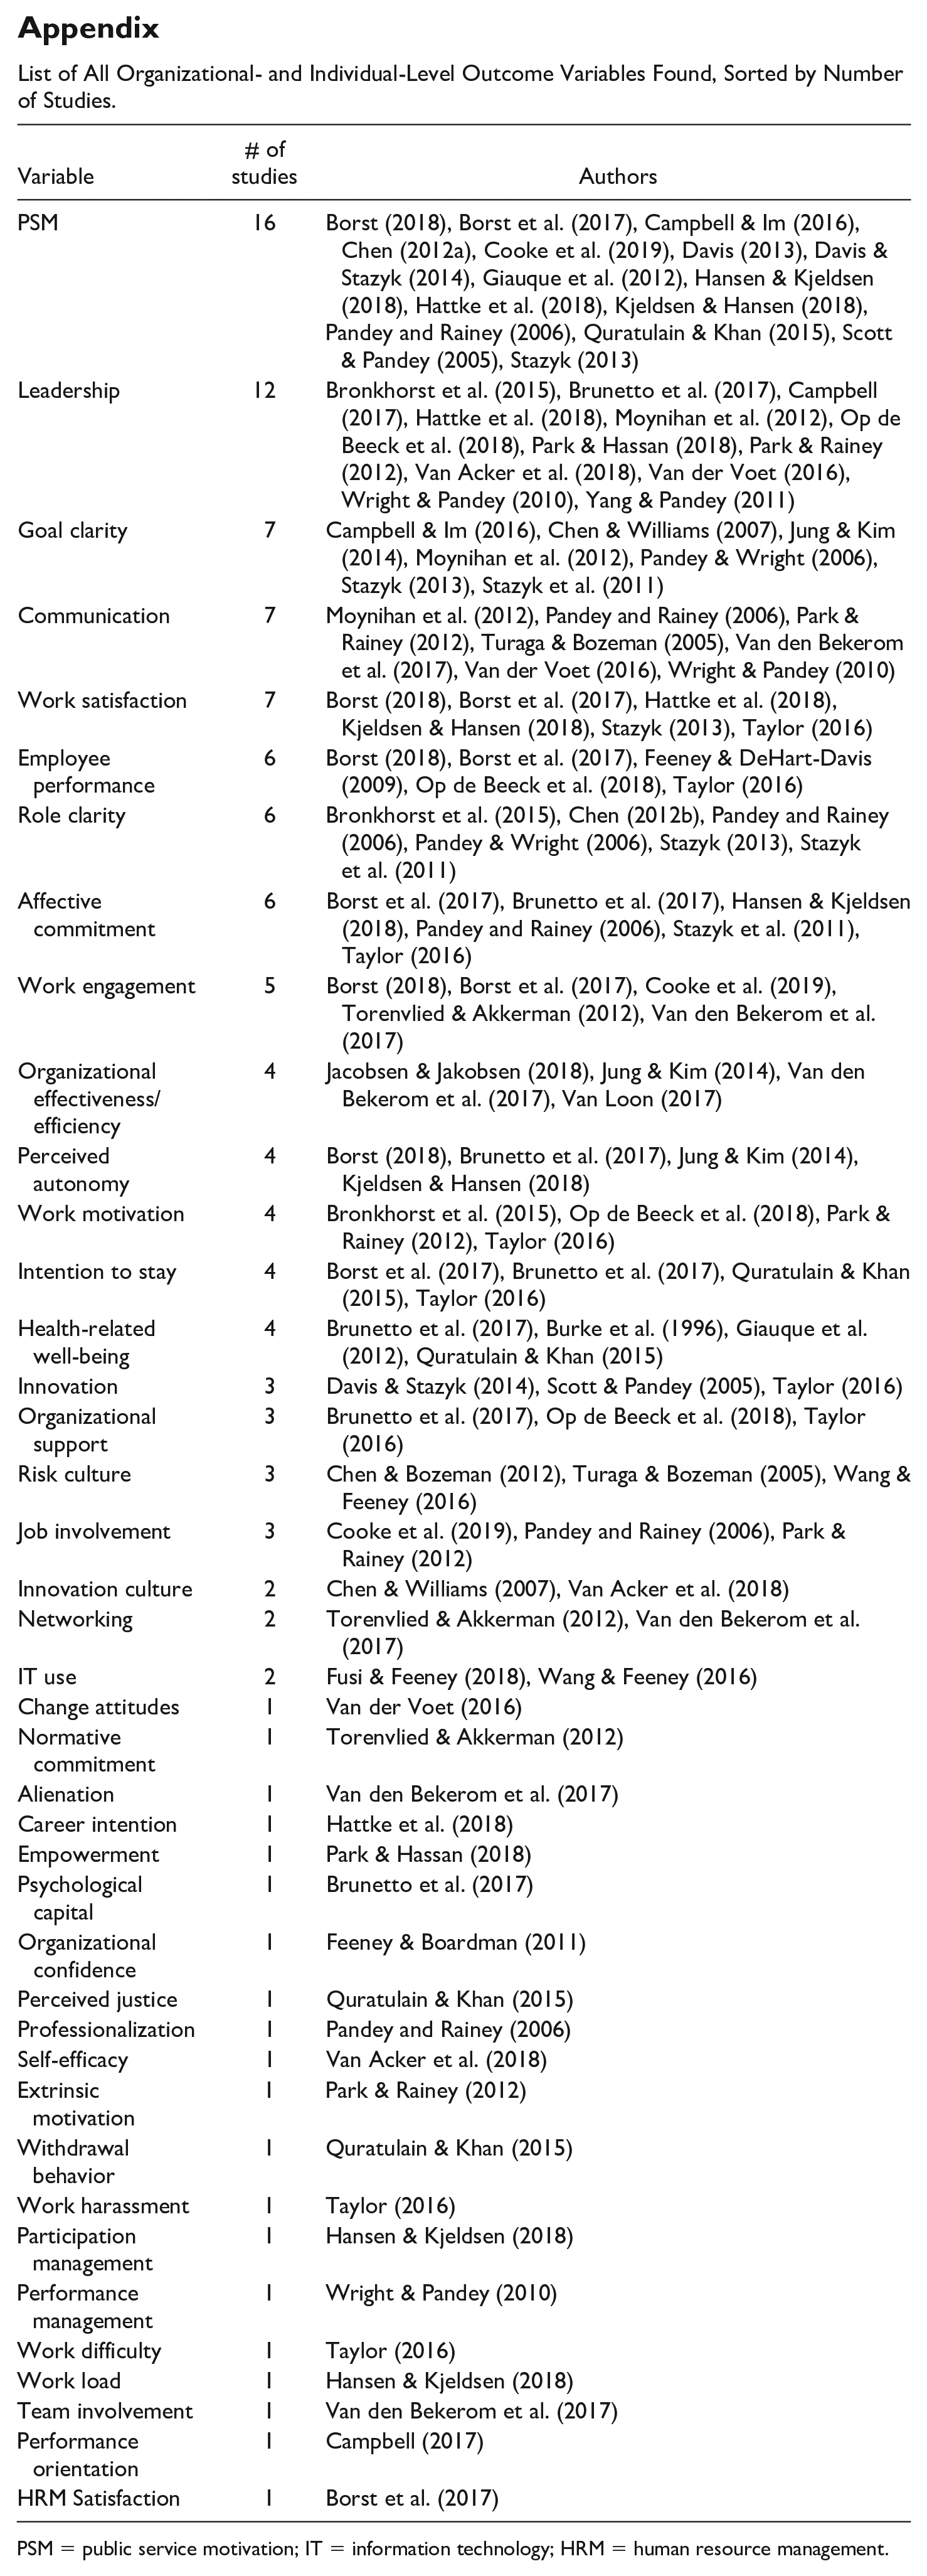
PSM = public service motivation; IT = information technology; HRM = human resource management.
Declaration of Conflicting Interests
The author(s) declared no potential conflicts of interest with respect to the research, authorship, and/or publication of this article.
Funding
The author(s) received no financial support for the research, authorship, and/or publication of this article.