
Abstract
Student populations in higher education have diversified internationally. Enhancing students’ sense of belonging is linked to educational success; yet, the applicability of existing measures in the diversified context is questioned. We developed and validated a sense of belonging measure in a population of students with and without a migration background. Study 1 involved creating the measure and testing its factor structure, reliability, and measurement invariance with 374 students from a large urban university. Study 2 confirmed the factor structure and examined construct validity with 151 students from a technical university. The “University Belonging – Acceptance, Recognition, Commonality and Support” (UB-ARCS) scale comprises 16 items across four dimensions. Metric invariance was found between students with and without a migration background. Strong correlations with “belongingness” and “academic efficacy” demonstrated convergent validity, while divergent validity was demonstrated with “conscientiousness.” Therefore, we found preliminary evidence of the validity and reliability of the UB-ARCS scale. Additional research is necessary for refining the suitability of the UB-ARCS for minoritized student groups and revealing the stories behind the numbers, offering deeper insights into the complex nature of belonging and marginalization in HE.
In higher education (HE), sense of belonging plays an important role in students’ decision to drop-out as it relates to students’ intention to persist and reduces student dropout likelihood in the first year (Gehringer et al., 2022; Ishitani & Kamer, 2024). Sense of belonging in HE has previously been described as feeling accepted, supported, and valued by the HE community alongside a feeling of connectedness to this community (Dias-Broens et al., 2024; Hausmann et al., 2007; Hurtado & Carter, 1997; Pittman & Richmond, 2008). Differences were found in experienced sense of belonging and educational pathways between minoritized students and students from historically privileged social identity groups (Luciano-Wong & Crowe, 2019; Stebleton et al., 2014; Vaccaro & Newman, 2016). Minoritized students experience less sense of belonging (Gopalan & Brady, 2020; Hausmann et al., 2009; Husbands et al., 2025) and have lower completion rates in certain countries such as the Netherlands (OECD, 2024). “Minoritized” refers to social identity groups that have historically been a numerical minority in HE and experience ongoing marginalization or exclusion resulting from historical and contemporary discrimination or racism. In comparison, “minority” only refers to groups that historically are a numerical minority in the student population (Chase et al., 2014; Gillborn, 2005).
Since early 2000, sense of belonging in HE has been measured with a large number of instruments (Dias-Broens et al., 2024). Responding to reoccurring calls for re-operationalization (Ribera et al., 2017), Slaten et al. (2018) developed the University Belonging Questionnaire (UBQ), validated with predominantly White undergraduates in the United States of America (USA). While the UBQ meets earlier demands for instruments applicable to first-year bachelor students (Hausmann et al., 2009; Kane et al., 2014), Slaten et al. (2018) emphasized the need for further research involving minoritized students. The 24-item UBQ, while valid and reliable, was tailored to the US context, including a “University affiliation” factor that does not fit non-US settings like the Netherlands, particularly regarding university pride (e.g., “I take pride in wearing my university’s colors”). In the Dutch context, university pride in terms of university colors or merchandise is not something Dutch-speaking students are particularly concerned with or that is meaningful to them, nor is attending university sports events part of the culture.
In the Netherlands, “migration background” is a central demographic indicator used in research, policy, and national statistics to describe population diversity and monitor social inequality. The term refers to individuals with at least one parent born outside the Netherlands (Statistics Netherlands, n.d). Whereas it differs from race- or ethnicity-based classifications used in other countries, it identifies the groups that experience minoritization in the Dutch context. The Netherlands has a long history of migration and a significant influx followed World War II, especially by migrants from Indonesia in the late 1940s and 1950s. The 1960s and 1970s brought labor migrants from Southern Europe, Turkey, and Morocco, alongside a significant wave from Suriname around its independence in 1975. In the 1980s asylum seekers and refugees came from Vietnam, Iran, and the former Yugoslavia. During that time, large groups of migrants also came to the Netherlands as a result of reunification. Since the 2000s, migration from Eastern Europe, notably Poland, has risen following EU expansion in 2004. Recent years have seen diverse migration, including highly skilled workers, international students, and refugees from Syria and Afghanistan (Statistics Netherlands, 2025).
In current Dutch society, groups such as those with Moroccan, Turkish, or Surinamese migration backgrounds (i.e., three of the five largest migrant-origin communities in the Netherlands; Statistics Netherlands, 2024b) are frequently positioned as culturally “other” and face disproportionate structural disadvantages in society, including differential treatment based on ethnicity, appearance, and religion (Andriessen et al., 2020; Statistics Netherlands, 2024a). Even groups that may appear more similar to the majority population, such as Polish migrants from Eastern Europe, experience discrimination relatively often (Van Den Broek, 2021). Discrimination and inequality occur in education, the labor market, sports, and financial or official institutions (Statistics Netherlands, 2024a). In education, children with a migration background are disadvantaged early on due to the Dutch stratified and selective early tracking educational system. Their academic potential may not be fully realized by the time students transition to secondary education, and these inequalities persist throughout their educational careers (Van De Werfhorst, 2019). Consequently, in Dutch HE, substantial differences in completion rates exist between students with and without a migration background (OECD, 2024). These patterns illustrate how “migration background,” although not ideal due to the heterogeneity of countries of birth, operates as a socially consequential category that structures inequality in Dutch HE. Therefore, in this study, we aimed to develop and validate a new sense of belonging instrument suitable for students with and without a migration background in the Dutch HE context.
Theoretical Background
Sense of belonging is a basic human need (Baumeister & Leary, 1995). In HE, it was initially viewed as part of broader constructs like institutional fit, commitment, and habitus (Bean, 1985; Cabrera et al., 1992; Cabrera & Nora, 1996; Hausmann et al., 2009; Nora & Cabrera, 1993; Thomas, 2002). Later, studies showed that students’ sense of belonging is distinct from social aspects of students’ persistence and involvement such as social integration or mattering (Hausmann et al., 2009; Tovar & Simon, 2010) and distinct from academic aspects such as institutional commitment, intrinsic motivation, and task value (Freeman et al., 2007; Hausmann et al., 2009), affirming its distinct role in student persistence (Hurtado et al., 2007). Despite this evolving understanding, large differences in used definitions and measures of students’ sense of belonging in HE exist, alongside more fundamental differences about its nature and how it is understood, and the specific groups (e.g., ethnically diverse) whose sense of belonging is being addressed (Dias-Broens et al., 2024; Gravett & Ajjawi, 2021).
Recently, common beliefs about sense of belonging in HE as uniform for all students were critiqued in light of the diversified student population and how HE institutions and research have responded to this change (Dias-Broens et al., 2024; Gravett & Ajjawi, 2021). Through widening participation initiatives, which target the increase of student groups who are underrepresented in HE, enrollment of minoritized students has grown and student populations are diversifying (Gravett & Ajjawi, 2021). While strengthening students’ sense of belonging is often addressed in these initiatives, questions arise about the uniformity of belonging understandings or expectations of the changed student population as a result. This uncertainty is supported by findings from Dias-Broens et al. (2024). Elements of students’ belonging definitions (e.g., “experiencing diversity” or “experiencing similarities”) in recent qualitative studies were not included in the most used and longstanding definitions and measures of sense of belonging in quantitative studies (e.g., Bollen & Hoyle, 1990; Goodenow, 1993; Strayhorn, 2019). These definitions were often from perspectives of minoritized students (Dias-Broens et al., 2024).
Current definitions of belonging in HE can be excluding for minoritized students as they are often the result of power dynamics in HE (Gravett & Ajjawi, 2021; Thomas, 2015). Sense of belonging definitions are often based on outdated experiences of students with historically privileged identities such as middle or upper class and white. When longstanding definitions and aligning measures are re-used and remain unchallenged, the “norm” of a typical or privileged student in HE is reproduced (Gravett & Ajjawi, 2021; Thomas, 2015). Minoritized students such as ethnically minoritized students or students with a migration background can experience incongruence between their understanding of what it means to belong and the understanding of privileged groups. For example, Stebleton and Aleixo (2016) found that African American students saw belonging in a predominantly white institution as the presence of diversity or seeing other minoritized students. This understanding of belonging, alongside other conceptualizations of belonging by ethnically minoritized students (such as “feeling safe” and “experience similarities”), was not found in used definitions and operationalizations of sense of belonging in quantitative studies. Some of the most used conceptualizations in quantitative studies were acceptance, connectedness, support, valuation, and respect (Dias-Broens et al., 2024). To test whether different student identity groups interpret a construct in a similar way, an analysis of measurement invariance (MI) can be used (Byrne & Watkins, 2003). MI has only recently been tested across students’ race for one of the multidimensional sense of belonging measures used in HE in the last 20 years (Dias-Broens et al., 2024; Maghsoodi et al., 2023). Maghsoodi et al. (2023) found strict MI for the use of the four-factor sense of social fit scale (Walton & Cohen, 2007) with Asian American/Pacific Islander and White students in the USA. MI across students’ migration background has not been tested internationally thus far.
Moreover, Gravett and Ajjawi (2021) plead for a situated and more nuanced understanding of belonging. For instance, studies show the relevance of specifying social groups (e.g., peers or teachers) and the HE environment (e.g., a major or the university campus) as they relate to different students’ experiences of belonging (Dias-Broens et al., 2024; Parsaiyan & Karimi, 2023; Ribera et al., 2017). We think the call for a more nuanced understanding of belonging (Gravett & Ajjawi, 2021) should include further research into the possible multidimensional structure of this construct. While the majority of existing quantitative studies on sense of belonging used a unidimensional approach (Dias-Broens et al., 2024), several authors, who also reported on minoritized students’ sense of belonging, used a multidimensional approach (O’Brien et al., 2020; Ribera et al., 2017). Furthermore, a large variety of combinations of underlying dimensions such as acceptance, connectedness, and support was used to define belonging (Dias-Broens et al., 2024), which suggests multidimensionality.
The Present Study
After reviewing the literature, we could not find a multidimensional measure resulting from extensive psychometric analyses, that includes items that sufficiently specify both the social groups and the HE environment, where experiences of ethnically diverse students or students with and without a migration background are considered. Using such an instrument can lead to more valid insights in the needs of all students, and eventually, these results can then be used to strengthen students’ educational pathways (Nuñez, 2009; Vaccaro & Newman, 2016). Therefore, we have developed and examined a sense of belonging in HE measure in two studies. We aimed to answer the following research questions: (1) What constitutes a valid measure of sense of belonging in higher education across a diverse first-year student population (study 1)? (2) What items show evidence for addressing this concept among students with and without a migration background (study 1)? (3) To what degree does the resulting instrument provide initial evidence of a replicable structure, reliability, and convergent and divergent validity in a different student population (study 2)?
Method Study 1: Scale Development, Exploratory Testing, and MI
To answer research questions one and two, we (a) developed a sense of belonging measure with underlying dimensions and accompanying items, (b) explored the measure’s most suitable factor structure, (c) tested the measure’s reliability, and (d) tested the MI across students’ migration background.
Procedure and Participants
First-year, full-time Dutch-speaking bachelor students in law, social sciences, and business administration at a large urban research university in the Netherlands during the 2022–2023 academic year were invited to participate. Participants received a QR code or survey link via faculty emails, classroom distribution, or a research participation hour system (for social sciences students). This system requires students to engage in research for course credits, allowing them to choose projects. A follow-up email was sent a week after initial distribution. As an incentive, participants could enter their email in the survey for a chance to win a €50 e-voucher.
Study 1: Information regarding students’ migration background
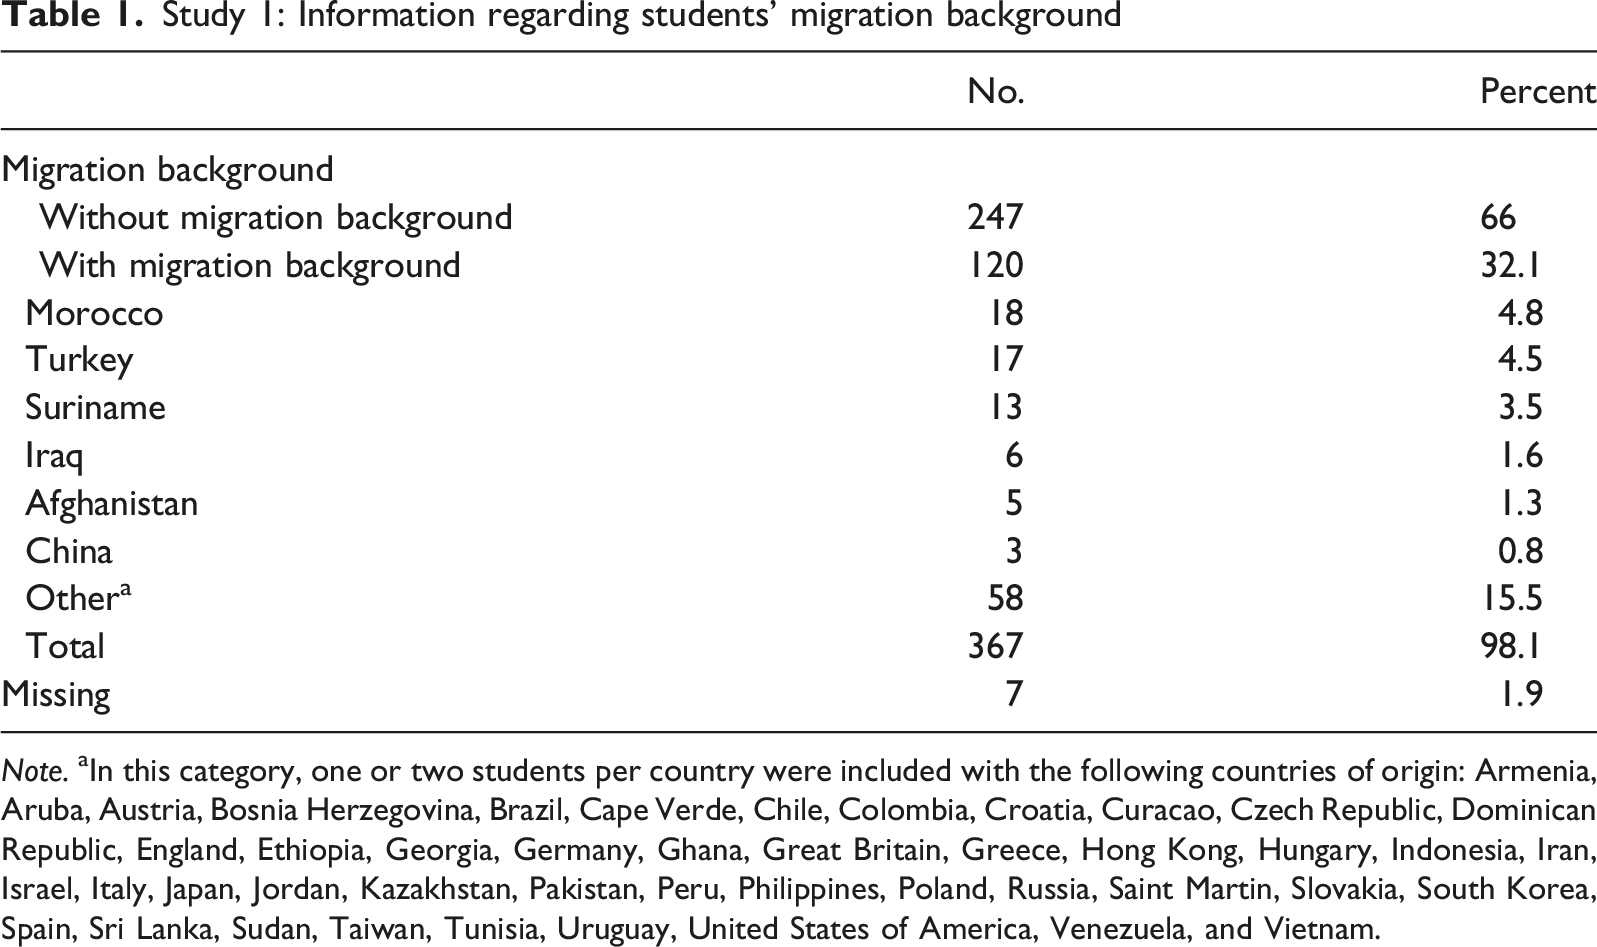
Note. aIn this category, one or two students per country were included with the following countries of origin: Armenia, Aruba, Austria, Bosnia Herzegovina, Brazil, Cape Verde, Chile, Colombia, Croatia, Curacao, Czech Republic, Dominican Republic, England, Ethiopia, Georgia, Germany, Ghana, Great Britain, Greece, Hong Kong, Hungary, Indonesia, Iran, Israel, Italy, Japan, Jordan, Kazakhstan, Pakistan, Peru, Philippines, Poland, Russia, Saint Martin, Slovakia, South Korea, Spain, Sri Lanka, Sudan, Taiwan, Tunisia, Uruguay, United States of America, Venezuela, and Vietnam.
Scale Development
We started our scale development process by selecting items from existing measures identified in a literature review (Dias-Broens et al., 2024). To ensure content validity (Worthington & Whittaker, 2006), we conducted focus group interviews with 26 bachelor students with and without migration backgrounds and across different years, and we extracted underlying dimensions of the descriptions of sense of belonging given by these students. We then held brainstorming sessions with a selection of these students and with teachers to explore these dimensions further. Next, we matched items from existing measures to the focus group dimensions, identifying key aspects of sense of belonging in HE (i.e., acceptance, respect, acknowledgment, inclusion, value, support, connectedness, contribution, diversity experience, and peer similarities). Additional items were formulated for dimensions with few existing items, resulting in 84 items in total with at least three items per dimension. The majority of the pool of items within each key aspect consisted of program and university-level references in combination with references to teachers and fellow students. Also, if possible, we included multiple versions of an item with varying social groups or contexts. Details of this process are available from the first author upon request.
Before administering the sense of belonging in HE measure, a cognitive pretest was carried out with seven students and this strategy was used to pilot the items for the purpose of gathering information on student perceptions of the comprehensibility of the items (Lenzner et al., 2016). Accordingly, 13 items were deleted due to ambiguous or unintended interpretation. Consequently, the first version of the sense of belonging in HE measure that was administered to students for factor analyses consisted of 10 dimensions operationalized by 71 items.
Results of Study 1
Exploratory Factor Analysis
To explore the structure of the initial sense of belonging measure, we conducted an exploratory factor analysis (EFA) using principal factor analysis with maximum likelihood in SPSS, applying oblique rotation (direct oblimin) due to anticipated intercorrelated dimensions. The data was suitable for factor analysis, indicated by a high KMO value (0.948) and significant Barlett’s Test of Sphericity (p < .001; Field, 2013). Factors were retained based on Cattell’s scree test (Field, 2013; Floyd & Widaman, 1995; Worthington & Whittaker, 2006), which showed shifts between factors 4 and 5, and 7 and 8, while parallel analysis suggested a five-factor solution (Horn, 1965). Following Costello and Osborne’s (2005) strategy, we tested factor structures ranging from three to eight factors. We assessed item loading tables from the pattern matrix across 3–8 factors to identify the structure that (a) aligned with our theoretical expectations, (b) minimized items with loadings below 0.298 (based on our sample size; Field, 2013; Stevens, 2002), and (c) reduced cross-loadings of 0.298 or higher on multiple factors (Floyd & Widaman, 1995; Worthington & Whittaker, 2006). Both four-factor and five-factor structures were viable. Items failing to meet loading criteria were removed, resulting in the exclusion of 16 items for the four-factor structure and 19 for the five-factor structure. Further analysis led to additional removals, ensuring no problematic loadings remained. After thorough comparison and discussion, the four-factor structure was chosen for its stronger theoretical coherence, as it grouped items by underlying theoretical dimensions rather than contextual ones, unlike the five-factor structure which included a university-level factor.
Study 1: Dimensions and items of the 32-, 17- and final 16-item version of the UB-ARCS (N = 374)

Note. Translation procedures differed by item origin. Items adapted from existing English measures were translated into Dutch for the survey and back-translated into English by external translators. Items originally developed in Dutch were translated into English for this manuscript and back-translated into Dutch by external translators. Review of the back-translations indicated preservation of the core meaning of all items. Differences were limited to minor linguistic features (e.g., prepositions or word order) and did not alter item content. Where such differences were identified, wording was adjusted following discussion among the authors. Notably, for items originating from existing English measures (i.e., item 16, 17, 30, 31, and 32), only incidental and negligible differences were observed.
aAs discussed in an earlier paragraph, these items were excluded during model refinement in Amos and therefore do not appear in the 25-item version of the UB-ARCS.
bThese items were excluded from the 25-item version based on our final conceptual and empirical considerations and therefore do not appear in the 17-item version of the UB-ARCS.
cThis item was excluded from the 17-item version to achieve metric invariance and therefore does not appear in the final 16-item version of the UB-ARCS.
“Acceptance” was defined as being embraced and treated in a respectful, attentive, and equitable way by peers and teachers. We defined “recognition” as feeling seen, heard, and understood within an educational setting together with the feeling that one’s contributions and background are validated. “Commonality” was defined as experiencing comparability with peers in terms of experience, background, and appearance. Finally, “peer support” was defined as the experience of being able to turn to a peer for personal or academic needs. Resulting from the four dimensions of sense of belonging that we extracted from our data and their meaning, we now define sense of belonging in HE as the extent to which a student feels respected and treated in an attentive and equitable way, feels supported by peers, and experiences comparability with others in a study program and/or on campus.
Model Refinement, Multidimensionality, and MI Testing Across Migration Background
Before assessing whether students with and without a migration background conceptually interpreted the sense of belonging items similarly through MI testing, it was necessary to achieve an acceptable model fit for the configural model (Byrne, 2010). Consequently, we engaged in a process of model refinement for the 32-item version of the UB-ARCS using Amos (Arbuckle, 2021), which involved steps similar to confirmatory factor analysis (CFA). 1 We then compared the four-factor model with a one-factor model to evaluate multidimensionality. Model fit was assessed using several indices: (1) chi-square/df ratio, (2) Root Mean Square Error of Approximation (RMSEA; Browne & Cudek, 1993), (3) Comparative Fit Index (CFI; Bentler, 1990), (4) Tucker-Lewis Index (TLI; Tucker & Lewis, 1973), and (5) Akaike Information Criterion (AIC). A chi-square/df ratio below 3.00 indicates good model fit (Kline, 1998), RMSEA values between 0.05 and 0.08 indicate acceptable fit, and values below 0.05 indicate good fit (Byrne, 2010). CFI and TLI values of 0.90 or higher are considered acceptable (Byrne, 2010). The AIC was used solely to compare the four-factor model with a one-factor model, where smaller values suggest a better fit (Hu & Bentler, 1995).
Study 1: Model fit statistics for model refinement of the UB-ARCS (N = 374)

Study 1: UB-ARCS MI testing across migration background (N = 367)
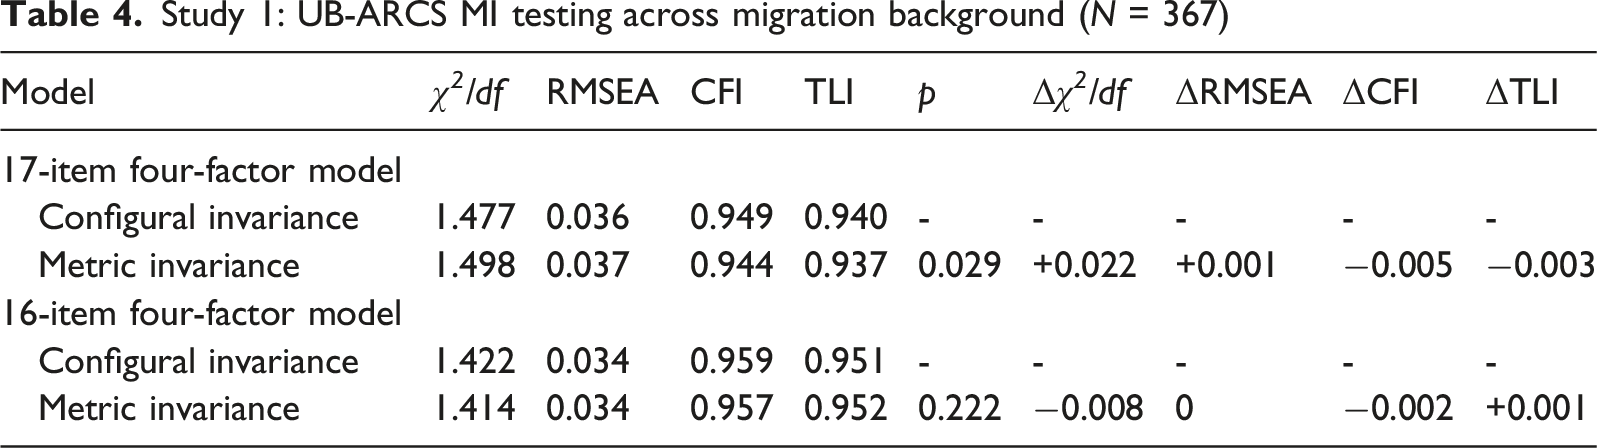
After removing item 4, as presented in Table 2, from the factor acceptance, sufficient reliability remained (a = 0.73). In hindsight, after deleting item 4 (see Table 2) we believe the remaining items are even more closely in line with our description of acceptance, as item 4 (see Table 2) is more ambiguous than the other items in the scale because it remains unclear if this statement relates to directly observable behavior by others or an estimation that the participant makes or idea that they have. When we compared the one-factor 16-item model with the four-factor 16-item model, the former showed a poor fit to the data (see Table 3). Contrary to the 17-item model, for the 16-item model, metric MI could be established (see Table 4 and see Appendix A for the path models). This means that each item loaded onto one of the four latent factors in a similar way and with similar strength for students with and without a migration background (see Appendix B for the sense of belonging scores in each group). This indicates that the 16-item version of the UB-ARCS was interpreted in a conceptually similar manner by students with and without a migration background (Byrne, 2004).
Method Study 2: Confirmatory Factor Analysis and Construct Validity Evaluation
To answer research question three, we conducted a CFA on the four-factor, 16-item UB-ARCS structure (acceptance, recognition, commonality, peer support) from study 1 using a sample from a technical university. Our first hypothesis was that this four-factor model would fit the data better compared to the one-factor model (Hypothesis 1). To assess construct validity, we examined convergent and divergent validity using measures conceptually related and unrelated to the UB-ARCS. For convergent validity, we used the 6-item belongingness scale by Godwin et al. (2018), chosen for its prior use with engineering students and inclusion of university- and class-level items. Despite having only six items, it shares constructs like support and course integration with UB-ARCS. We also used the Academic Efficacy scale by Blom and Severiens (2008) as self-efficacy in HE is conceptually linked to sense of belonging. Self-efficacy, the belief in one’s ability to achieve goals (Bandura, 1997), can enhance confidence and academic capability when students feel they belong (Holloway-Friesen, 2021). Previous studies found correlations between self-/academic efficacy and sense of belonging (Graham et al., 2023; Lytle & Shin, 2020; Saroughi & Kitsantas, 2021). Thus, we anticipated positive relationships between the UB-ARCS, the belongingness scale, and academic efficacy (Hypothesis 2).
To assess divergent validity, we used the conscientiousness scale from the Big Five Inventory (BFI; John & Srivastava, 1999), which includes competence, order, dutifulness, achievement striving, self-discipline, and deliberation. In HE, conscientiousness relates to individual academic achievement, while sense of belonging involves interactions between external (social) contexts and the (affective state of an) individual (Hagerty et al., 1992). We view these as distinct aspects of the student experience. Among Big Five traits, extraversion and agreeableness consistently show positive links to sense of belonging in HE (Anistranski & Brown, 2023; Stubblebine et al., 2024). However, findings on conscientiousness vary: a positive link at the end of the first year in HE (Stubblebine et al., 2024), a weak significant correlation with general belongingness outside education (Checa & Oberst, 2022), and a significant correlation between general belongingness (not in education) and conscientiousness that did not contribute uniquely in a simultaneous regression with other Big Five personality traits (Malone et al., 2012) were found. Altogether, we anticipated no relationship between sense of belonging in HE and conscientiousness (Hypothesis 3).
Procedure and Participants
Study 2: Information regarding students’ migration background

Note. aIn this category, one or two students per country were included with the following countries of origin: Austria, Bosnia Herzegovina, Canada, Czech Republic, Denmark, former Yugoslavia, France, Germany, Great Britain, Hungary, Mexico, Mozambique, Panama, Portugal, Romania, South Africa, Soviet-Union, Spain, and Vietnam.
Measures
Sense of belonging in HE was measured with the 16-item UB-ARCS (see Table 2 for included items in English and Appendix C for the original Dutch items), consisting of the subscales acceptance (5 items; α = 0.68), recognition (4 items; α = 0.72), commonality (4 items; α = 0.73), and support (3 items; α = 0.75). The Cronbach’s alpha for the complete measure in study 2 was 0.85 (N = 151).
Belongingness was measured with the 6-item belongingness scale (α = 0.88 in study 2) by Godwin et al. (2018). This measure was slightly adapted, “engineering class” was replaced by “study program” or “the classes in my study program.” The first author translated the items to Dutch and then the remaining three authors critically assessed these translations and necessary adaptations were made. Furthermore, external translators did a back-translation of these items from Dutch to English to ensure the measure can be used in a similar and reliable manner in both English and Dutch. 2 An example item is “I feel that I am part of my study program.” Respondents indicated to what extent they agreed with each statement on a 5-point rating scale ranging from 1 (strongly disagree) to 5 (strongly agree).
Academic efficacy was measured with an adapted version of the Dutch Self-Efficacy for Learning and Performance scale of the Motivated Strategies for Learning Questionnaire (Blom & Severiens, 2008; Kickert et al., 2019; Pintrich et al., 1993) (α = 0.91 in study 2). In consultation with the program director of the study program, the items were slightly adapted to fit the specific context of the program by adding the equivalent of “this semester” if necessary. Also, the Dutch items of this measure were back-translated to English by external translators in a similar manner as the belongingness scale 2 . An example item is “I expect that I’ll easily pass the courses I’m taking this quarter.” Respondents indicated to what extent they agreed with each statement on a 5-point rating scale ranging from 1 (strongly disagree) to 5 (strongly agree).
Conscientiousness was measured with the 9-item (α = 0.74 in study 2) scale from the Big Five Inventory (John & Srivastava, 1999) that was translated into Dutch and validated by Denissen et al. (2008) across different age groups. An example item from conscientiousness is “I am someone who is easily distracted.” Respondents indicated to what extent they agreed with each statement regarding their perceptions of themselves on a 5-point rating scale ranging from 1 (strongly disagree) to 5 (strongly agree).
Results of Study 2
Confirmatory Factor Analysis
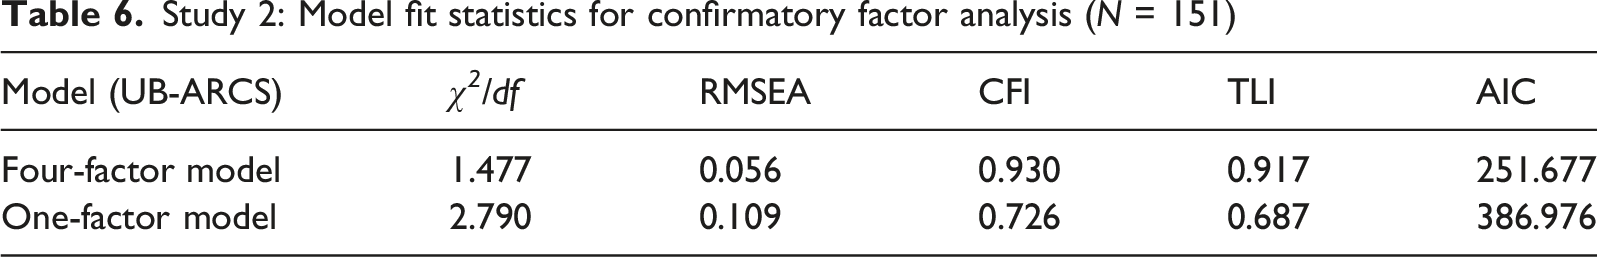
Study 2: Model fit statistics for confirmatory factor analysis (N = 151)
Construct Validity
Study 2: Bivariate correlations (r) between the 16-item UB-ARCS and (un)related variables
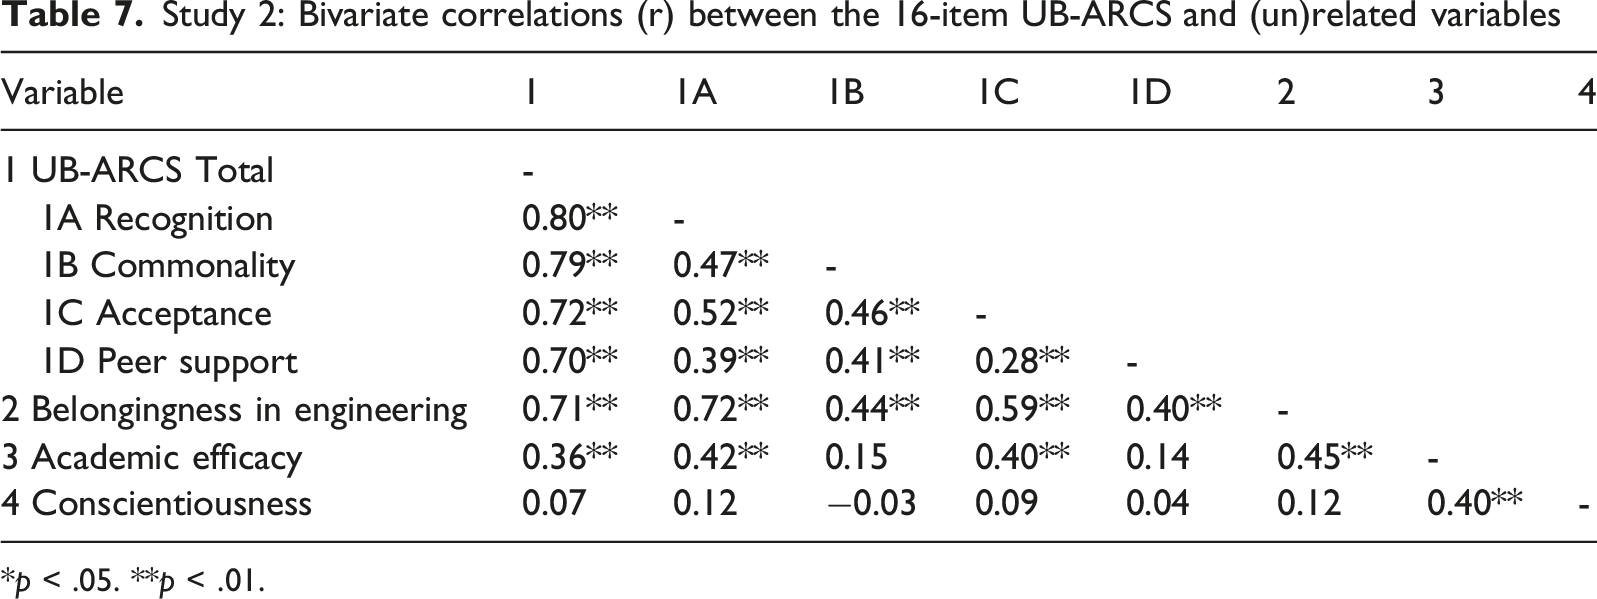
*p < .05. **p < .01.
Discussion
Because students spend a large amount of time in HE, HE institutions have an essential role in students’ development and wellbeing. Given the important role that sense of belonging plays in students’ first year in HE, and the differences in belonging experienced among various social identity groups (Gopalan & Brady, 2020; Hausmann et al., 2009; van der Zanden et al., 2018), it is necessary to use a valid, reliable, and appropriate measure to assess the sense of belonging of all students in order to appropriately support the sense of belonging of those in need. Therefore, we aimed to develop and examine a valid and reliable instrument to measure the sense of belonging in a student population of students with and without a migration background in HE.
In study 1, we combined input from qualitative sessions with students and teachers and a literature review to develop a preliminary version of the UB-ARCS. After performing an EFA and subsequent model refinement, the final 16-item version of the UB-ARCS consisted of four dimensions (i.e., acceptance, recognition, commonality, and peer support). Configural and metric MI were established across students’ migration background. In study 2, a CFA conducted in a new sample demonstrated acceptable fit of the UB-ARCS and provided support for the multidimensional structure of the UB-ARCS, thereby confirming Hypothesis 1. Positive correlations between the UB-ARCS and both an alternative belongingness scale and academic efficacy indicated initial evidence of convergent validity, confirming Hypothesis 2. Finally, with no significant correlation between the UB-ARCS and conscientiousness, initial evidence of divergent validity was found, and Hypothesis 3 was confirmed.
Remarkably, although the UB-ARCS had a positive significant correlation with academic efficacy, two of the four underlying dimensions (i.e., commonality and peer support) did not correlate significantly with academic efficacy. Both dimensions are exclusively focused on peers, either in the extent to which a student experiences compatibility with peers in terms of experience, background, and appearance or their supportive relationship with peers. Finding a solid and thorough explanation for this result goes beyond the scope of our research. Therefore, we recommend further investigation of this result. We recommend studying correlations of the UB-ARCS altogether and its underlying dimensions, with concepts that distinguish between different variations of (academic) efficacy or underlying dimensions, or concepts in the academic environment that are slightly different from academic efficacy such as academic satisfaction or college gratitude (all indicators of college-specific wellbeing behavior; Renshaw, 2018).
The results of our studies uncovered the multidimensionality of sense of belonging (e.g., from focus groups output and model fit analyses) and as such gave further supporting evidence of insights from previous research that were used in the instrument development (Dias-Broens et al., 2024). The multidimensionality remains one of the complicating factors of studying sense of belonging in HE, as was also indicated by its “messiness” and the multitude of very similar yet slightly differing definitions and underlying concepts that have been used to describe it (Dias-Broens et al., 2024). Through our studies, we hope to have reduced some of this messiness by providing initial evidence for a valid and reliable multidimensional measure that captures this essential aspect of first-year students’ experiences in HE in the Netherlands.
Moreover, what resulted from our studies is that careful attention needs to be paid to what different aspects of the HE context and the different dimensions of sense of belonging are relevant when studying this construct in a diversified student population. Our results further substantiate the need to re-examine longstanding definitions and measures of sense of belonging in light of the diversified student population in HE (Dias-Broens et al., 2024; Gravett & Ajjawi, 2021). One finding that signals this reconsideration is the dimension “commonality” of the UB-ARCS, which was not found in existing sense of belonging measures but arose from qualitative input from students. Our findings provide initial support for the validity and reliability of this dimension of sense of belonging in our sample of students with and without a migration background in the Netherlands.
Strengths and Limitations
A strength of this study is that through the combination of input from a literature review, qualitative sessions with students, and cognitive pretesting, it became clear that an added value of a new sense of belonging in HE measure would be to make item-wording concrete in terms of educational context and social groups. Consequently, it becomes easier to translate results to future actions such as interventions or policy. In most items of the UB-ARCS, the educational context and social groups are specified, such as “In my study program there are fellow students who have the same norms and values as me,” but not too specific so that the measure is only useable in the Dutch HE context. We do advise future researchers to critically examine the useability, reliability, and validity of the UB-ARCS in contexts different from Dutch HE.
A different strength of this study was the embeddedness of students’ experiences and evaluations of the gathered input. Initially, we mainly aimed to gather input from students about their definitions of sense of belonging through focus group interviews. However, as our research unfolded, we realized more steps were necessary to understand this input. Therefore, we organized more follow-up discussions with students (and staff) to do their input justice and to transform it into valid dimensions or items for distribution. We think the extensive involvement of students in the analysis of the data strengthens our study and honors the role we think students should have in the development of a measure that is intended for use in a population they are part of.
The primary limitation of our study regards the use of migration background as a classification for minoritized and privileged groups in HE. While this approach helps explore diverse experiences of belonging, it may overlook the nuanced differences within the group due to its heterogeneity. Although classifications like ethnicity, culture, or race might seem more appropriate for classification of student groups in relation to marginalization, they are less applicable in the Dutch context given its unique history and migration dynamics. The classification of migration background serves as an important initial step in better understanding students’ sense of belonging experiences in HE and assessing the suitability of current measures. However, it should be supplemented with further MI tests involving other relevant categorizations, such as generation status, religion, and sexual preference, alongside qualitative studies. These additional approaches are crucial for refining the suitability of belonging measures for minoritized students groups and revealing the stories behind the numbers, offering deeper insights into the complex nature of belonging and marginalization in HE.
The second limitation of our study concerns constraints in our validation design, including sample reuse in study 1 and the small CFA sample in study 2. Initially, we intended to conduct a CFA and MI testing across students’ migration background with the sample from study 2. However, due to the importance of the MI testing for migration background, we needed large enough groups of students with and without a migration background, and this was only the case in study 1. We have now situated the steps necessary for model fit in study 1 as “model refinement” although our strategy was similar to conducting a CFA, and we position the CFA in study 2 as the “true” CFA. We find it promising that the UB-ARCS’s 16-item, 4-factor structure was confirmed in study 2. Nevertheless, the relatively small sample size in study 2 limits the stability and generalizability of the CFA results, underscoring the need for replication with larger samples. Furthermore, although we selected conscientiousness because it is part of the well-established and validated BFI (John & Srivastava, 1999) and a known predictor of academic success (Verbree et al., 2023), this choice did not meet the ideal standard for discriminant validity testing, as conscientiousness is not conceptually similar yet empirically dissimilar to sense of belonging (Shaffer et al., 2016). Altogether, we recommend that future research using the UB-ARCS with a larger sample conduct a CFA for further discriminant and predictive validation, include reliability testing given that one subscale in study 2 showed only marginally sufficient internal consistency, and also examine the five-factor structure suggested by the parallel analysis (Horn, 1965).
The third limitation we want to discuss concerns the replicability of our research. Despite our best intentions to describe the research process in as much detail as possible, we think it might be challenging to replicate some of our findings due to many (small) steps that were taken to come to our results and the complexity of the process. Parts of the transformation of output from students into useable information for our instrument development resemble analysis processes used in qualitative studies. This process is relative by nature and based on the interaction between the researcher(s) and the research output (Bailey, 1997) and cannot be captured completely. Therefore, to ensure methodological integrity, we used different strategies such as consensus building among team members and member checking. Although we recognize the complexity and opaqueness of this process, we do believe that every step that was taken was necessary and worthwhile to come to an optimal sense of belonging measure for a student population of students with and without a migration background.
Implications for Research and Educational Practice
Our studies have several theoretical implications for the field of HE research. Importantly, we think it is necessary to critically assess the suitability of a prospective definition and measure of sense of belonging in HE in light of the university context and student population one wishes to study. Across both the development phase and the empirical results, it became evident that including a diverse student population with respect to migration background was essential, as the input and subsequent analyses differed from earlier definitions and operationalizations of sense of belonging in HE. Also, we encourage concrete references to the HE context and social groups in items when operationalizing sense of belonging. For example, in the UB-ARCS the dimension “commonality” mostly concerns university-wide experiences, and the other dimensions concern the study program. When this is not mentioned, it remains unclear if students relate the content of an item to a teacher or a peer. Consequently, when the HE context and the social groups are mentioned in items, a more accurate picture can be drawn concerning the results on sense of belonging experiences. Furthermore, our research has shown the importance of conducting a multigroup analysis in discovering if and how a measure can be used and understood in a similar way for different social identity groups. As MI has not been determined for many relevant background indicators of minoritized groups in HE research such as LGBTQIA + status or first-generation in HE status, we encourage future researchers to continue the exploration of the useability of sense of belonging measures for these and other relevant background indicators.
Concerning implications for HE practice, we encourage HE institutions to continue the involvement of a representative student body when further steps are taken by HE institutions in response to research results. When the operationalization of a multidimensional construct aligns with how students understand this construct, the results will be representative and therefore more likely to be valid and useable. Institutions should be critical towards the influence of the relations of power in further actions and policy concerning the translation of results into practice (Hermansen & Mausethagen, 2023). To further strengthen the useability of sense of belonging results, we encourage HE institutions to pay detailed attention to how and where this then translates into practice. If an institution wishes to study sense of belonging with the UB-ARCS with the goal of positively impacting students’ sense of belonging, close attention needs to be paid to the results on the different dimensions and what contexts it entails. We found that representation matters (i.e., through the “commonality” items) and that most sense of belonging items concern peers (and not faculty or other staff). These could already be two concrete focus points in further translation of our results into practice. Importantly, as we did not establish predictive validity of the UB-ARCS in this study, this should first be addressed before informing HE practice.
Conclusion
In summary, through analyzing input from the literature and focus groups, we found preliminary evidence of the validity and reliability of the UB-ARCS scale, consisting of the dimensions acceptance, recognition, commonality, and peer support, to measure students’ sense of belonging in an HE population of students with and without a migration background. Paying attention to the dimensionality of the measure, concreteness in terms of context and social groups, and suitability for a diverse student sample regarding migration background was found to be important during the developmental process. By using the UB-ARCS, studying the sense of belonging needs of all students can be improved, and results from such studies can then be used to design interventions that could strengthen all students’ educational pathways.
Footnotes
Acknowledgments
The first author has used the Generative AI tool of their university (Erudite) as an inspiration for reducing the word count to meet the word limit guideline of the Journal of Psychoeducational Assessment after the first draft of the paper was written.
Ethical Considerations
On 22 February 2021, the Ethics Review Committee DPECS gave ethical approval for the activities that were described in our ethics review application (#21-018). Also, written informed consent was given by all participants whose data has been used in this study.
Funding
The authors received no financial support for the research, authorship, and/or publication of this article.
Declaration of Conflicting Interests
The authors declared no potential conflicts of interest with respect to the research, authorship, and/or publication of this article.