
Abstract
Mixed-worded questionnaire scales, containing both positively and negatively phrased items, are intended to encourage thoughtful responses, but may result in inconsistent responses and wording effects and can reduce reliability and validity. This study examined the prevalence and predictors of inconsistent responding to a mixed-worded scale in the 2022 Programme for International Student Assessment (PISA) across seven countries. Using factor mixture analysis, findings revealed a low but variable rate of inconsistency (2–8%) across countries. Separate confirmatory factor analysis models on the effective and on filtered samples of consistent respondents showed improved fit and reliability indices for the filtered samples for all countries, suggesting that inconsistent respondents had unexpected response patterns. In logistic regression models, inconsistent responding was associated with lower PISA reading scores and often with reduced self-reported effort, suggesting that inconsistent responses may stem from lower reading ability and/or carelessness. The results contribute to ongoing discussions about the use of mixed wording in questionnaires and highlight the need to account for respondent behavior when analyzing survey data.
Large-scale assessment studies comprise achievement tests and contextual questionnaires, to assess students’ learning conditions and outcomes. The questionnaires consist of individual questions and multi-items scales to measure students’ demographics, learning environments, past experiences, beliefs, attitudes, feelings, etc. To ensure the quality of self-reported data, techniques such as including neutral items, ensuring respondent anonymity, and using mixed-worded scales have conventionally been employed to mitigate response biases, promote more attentive responding, and enhance construct validity (Benson & Hocevar, 1985; Nunnally, 1967).
“I make friends easily at school” and “I feel lonely at school” are two items phrased in opposite valence and administered within the PISA Sense of Belonging scale, using the same response scale. Respondents have to either agree with “I make friends easily at school” and disagree with “I feel lonely at school”, or vice versa, to make a consistent statement. Agreeing or disagreeing with both items is, by contrast, an inconsistent statement. Despite established recommendations about incorporating mixed-worded items in scale construction, there is scarce empirical evidence supporting the use of positively and negatively worded items within a scale to measure an underlying construct. Baumgartner and Steenkamp (2001) reported reduction in variance due to acquiescence in balanced scales with equal numbers of positively and negatively keyed items. A recent experimental study has shown that respondents dedicate more time and revisit more often survey items that are negatively worded (Koutsogiorgi & Michaelides, 2022). This may suggest higher attentiveness to those items but does not demonstrate reduction in response bias. However, mixed wording has been shown to inadvertently introduce measurement problems, including reduced internal consistency, inflated factor structures, and overestimation of scale dimensionality (e.g., Arias et al., 2020; Podsakoff et al., 2024; Steinmann, Sánchez, et al., 2022).
In surveys with mixed-worded scales, students may not answer consistently across all items (Steinmann, Strietholt, & Braeken, 2022) because they sometimes respond to positively and negatively worded items as if they were phrased in the same valence. Such inconsistent responses raise concerns regarding the reliability and validity of results (e.g., Chen et al., 2024; Steinmann, Sánchez, et al., 2022). Factor analyses of mixed-worded scales often result in artifactual or “method” factors beyond the intended substantive factors (e.g., Marsh et al., 2010; Michaelides et al., 2017) and thus jeopardize the scale’s construct validity. Consequently, previous studies highlighted the importance of identifying inconsistent responding and its impact on psychometric scale properties, factorial structures, and the nomological network of mixed-worded scales (e.g., Bulut & Bulut, 2022; Steedle et al., 2019; Steinmann, Sánchez, et al., 2022).
Different approaches for detecting inconsistent responses to mixed-worded scales have been suggested (e.g., Bolt et al., 2020; Hong et al., 2020). Two prevalent methods are (a) the mean absolute difference method (Hong et al., 2020; Steedle et al., 2019), which measures the alignment between responses to positively and negatively worded items with the use of threshold values, and (b) the constrained factor mixture analysis (FMA) method (Steinmann, Strietholt, & Braeken, 2022), stemming from factor analysis (e.g., Lubke & Muthén, 2005; Masyn et al., 2010). The FMA has the advantage of modeling the latent factor structure of the scale under investigation and simultaneously classifying participants into groups to reflect the heterogeneity in theoretically specified response patterns. Although computationally complex, FMA avoids the arbitrariness of thresholds based on observed mean score differences.
The prevalence of inconsistent responding, identified by different empirical methods, ranges from very low (e.g., Hong et al., 2020) to substantial (e.g., Swain et al., 2008) across studies. This variation is more salient in international large-scale assessments conducted on different topics and across many countries. Recent studies highlighted the large international variation in inconsistent responding, ranging from 2 to 36% across educational systems (Steinmann, Sánchez, et al., 2022) and from 1 to 21% across countries and grades (Steinmann et al., 2024).
What Causes Inconsistent Responding to Mixed-Worded Scales?
There are different explanations for why some respondents might respond inconsistently to mixed-worded scales. One hypothesis is that they respond inconsistently due to a lack of reading and/or cognitive skills to answer consistently. Some respondents might struggle to fully understand the item wording and response categories, and/or to adjust their responses in accordance with the opposite item wording, for example, disagreeing with negative statements to express a positive attitude (e.g., Alessandri et al., 2015; Gnambs & Schroeders, 2020; Marsh, 1986; Swain et al., 2008).
An alternative hypothesis, originally proposed by Schmitt and Stuits (1985), proposes carelessness and inattention to explain why some respondents respond inconsistently to mixed-worded scales. When individuals put insufficient effort into completing a survey, whether by providing random responses to items, selecting the same response across a series of items irrespective of their content (straight-lining), or reading some but not all items of a scale while responding similarly to all, one would also expect inconsistent patterns of responding to mixed-worded scales. Furthermore, it is possible that respondents both lack cognitive and/or reading skills and are careless.
Importantly, however, the two explanations for inconsistent responding behavior, the lack-of-skills and the carelessness hypotheses, have very different implications. If carelessness was the (only) explanation for inconsistent responding, including mixed-worded scales in questionnaires would allow analysts to detect and remove them to obtain “clean” datasets that only contain compliant respondents (Hong et al., 2020; Patton et al., 2019). If a lack of skills was the cause of inconsistent responding, at least partly, including mixed-worded scales in questionnaires would increase the difficulty to answer properly, at least for some respondents. This would conflict with the guiding design principle that questionnaires should be as easy and straightforward to fill out, as possible (Schulz & Carstens, 2020). To determine whether to use mixed scales, it is therefore important to try to determine the factors that cause inconsistent responses.
Moreover, inconsistent responding may also arise from response styles, such as acquiescence, the tendency to agree with items regardless of content (Bentler et al., 1971; Buchholz, 2022). Personality traits, particularly conscientiousness, have also been shown to be correlated with response consistency: individuals low in conscientiousness are more likely to respond carelessly, especially in low-stakes assessments (Ward & Meade, 2023). However, an argument can be made that lower self-reported conscientiousness might be a proxy for careless responding (Chen et al., 2024; Steinmann, Strietholt, & Braeken, 2022).
Individual Characteristics Associated With Inconsistent Responding
One way to disentangle the factors contributing to inconsistent responding is to compare characteristics of consistent and inconsistent respondents. A number of studies showed that inconsistent responding was associated with low cognitive ability or reading comprehension test scores (e.g., Alessandri et al., 2015; Bulut & Bulut, 2022; Gnambs & Schroeders, 2020; Marsh, 1986; Steedle et al., 2019; Steinmann, Strietholt, & Braeken, 2022; Swain et al., 2008). Marsh (1986) even referred to inconsistent responding as a cognitive-developmental phenomenon as it is more likely for young children with poorer reading ability to respond inconsistently to mixed-worded scale items than older children. An alternative interpretation for this association could be that careless respondents to mixed-worded questionnaire scales might also answer carelessly to tests and thus score lower. Therefore, the association between inconsistent responding and lower ability scores can be explained by both hypotheses. However, experimental studies with university students support that negative wording requires more resources for comprehending an item; it was associated with longer response times, more revisits, and more item-viewing time (Koutsogiorgi & Michaelides, 2022, 2023). These findings support the lack-of-skills hypothesis.
Several demographic variables have been examined in relation to inconsistent responding. Inconsistent respondents were more prevalent among children than adolescents (Konstantinidou & Michaelides, 2025; Marsh, 1986; Steinmann, Striethot, & Braeken, 2022; Steinmann et al., 2024) possibly due to lower cognitive or reading skills. Furthermore, males were overrepresented among inconsistent respondents in one study (Steinmann, Strietholt, & Braeken, 2022). This gender gap can be explained with both hypotheses. According to the lack-of-skills hypothesis, males might be more likely to respond inconsistently because they typically have lower reading abilities (Mullis et al., 2017), and according to the carelessness hypothesis, they might be more likely to respond inconsistently than females because they are often found to have lower conscientiousness levels (De Bolle et al., 2015) and exhibit less effort to complete surveys (Anaya & Zamarro, 2024).
Compared to students from families with higher socioeconomic status, disadvantaged students had higher rates of disengagement with a survey, indicated by non-response behavior and lack of internal consistency in responding to all scale items, in most of the countries participating in PISA 2018 (Buchholz et al., 2022). Conflicting results come from studies examining the effect of socioeconomic status on test-taking effort in the PISA cognitive test, where a positive relationship between the two variables was also found when student performance was not included (Azzolini et al., 2019; Rios & Soland, 2022), while the association becomes insignificant or negative (Azzolini et al., 2019; Ivanova, 2024) when incorporating achievement scores in a multilevel regression model. A weak positive association between the two variables was observed in Dutch low-stakes tests, when controlling for past achievement (Borghans et al., 2024).
Some variables can help to directly investigate the carelessness hypothesis. Self-reported survey effort can help identify disengaged students (Zamarro et al., 2019) who read the scales in a superficial way, do not notice the mixed item wording, and thus respond inconsistently (e.g., Schmitt & Stuits, 1985). Bulut (2021) reported that during the questionnaire session in PISA 2015, 40% of students were disengaged, as indicated by rapid responding across multiple scales. This points to the importance of screening for effort in large-scale surveys, so that low-effort respondents can be filtered out to increase the validity of the data. Response time indicators have been used a lot for understanding student’s behavior (e.g., via very rapid responses) in low-stakes assessments (e.g., Anghel et al., 2024; Michaelides et al., 2020; Wise, 2017), but less so in surveys (e.g., Lundgren & Eklöf, 2023; Soland et al., 2019). A relationship between response time and inconsistent responses in mixed-worded scales was observed by Soland et al. (2019): when students gave very rapid responses on a scale, they tended to exhibit inconsistent responding behavior more often.
Aim of the Study
The present study aimed to identify inconsistent respondents in the mixed-worded Sense of Belonging scale in PISA 2022 across seven countries and to compare their characteristics with those of the consistent respondents. Two hypotheses were tested:
Earlier studies with students found prevalence from as low as 1% up to 36%, with higher estimates in samples of young children. In the PISA samples with adolescents, we predicted that the prevalence of inconsistent respondents would be at the lower end of that range, and variable across countries.
Inconsistent respondents will be more often male, report lower self-reported effort put into the survey completion, complete the scale in less time, and have lower reading achievement scores. Furthermore, we explored socioeconomic status as a predictor of inconsistent responding.
Although there is some previous evidence regarding the prevalence of inconsistent responding and individual correlates of this prevalence, we extend the existing body of research by considering not only background characteristics and reading ability as important predictors of inconsistent responding, but also the students’ self-reported questionnaire response effort and the time taken to respond to the scale. PISA data allow for cross-cultural comparisons based on representative samples of student populations. Among several scales administered in 2022, the Sense of Belonging scale was the only one in the 2022 questionnaire that was sufficiently unidimensional, and mixed-worded, with multiple positively and negatively phrased items.
Methods
Sample
Initial and Effective Student Sample Sizes and Demographics by Country
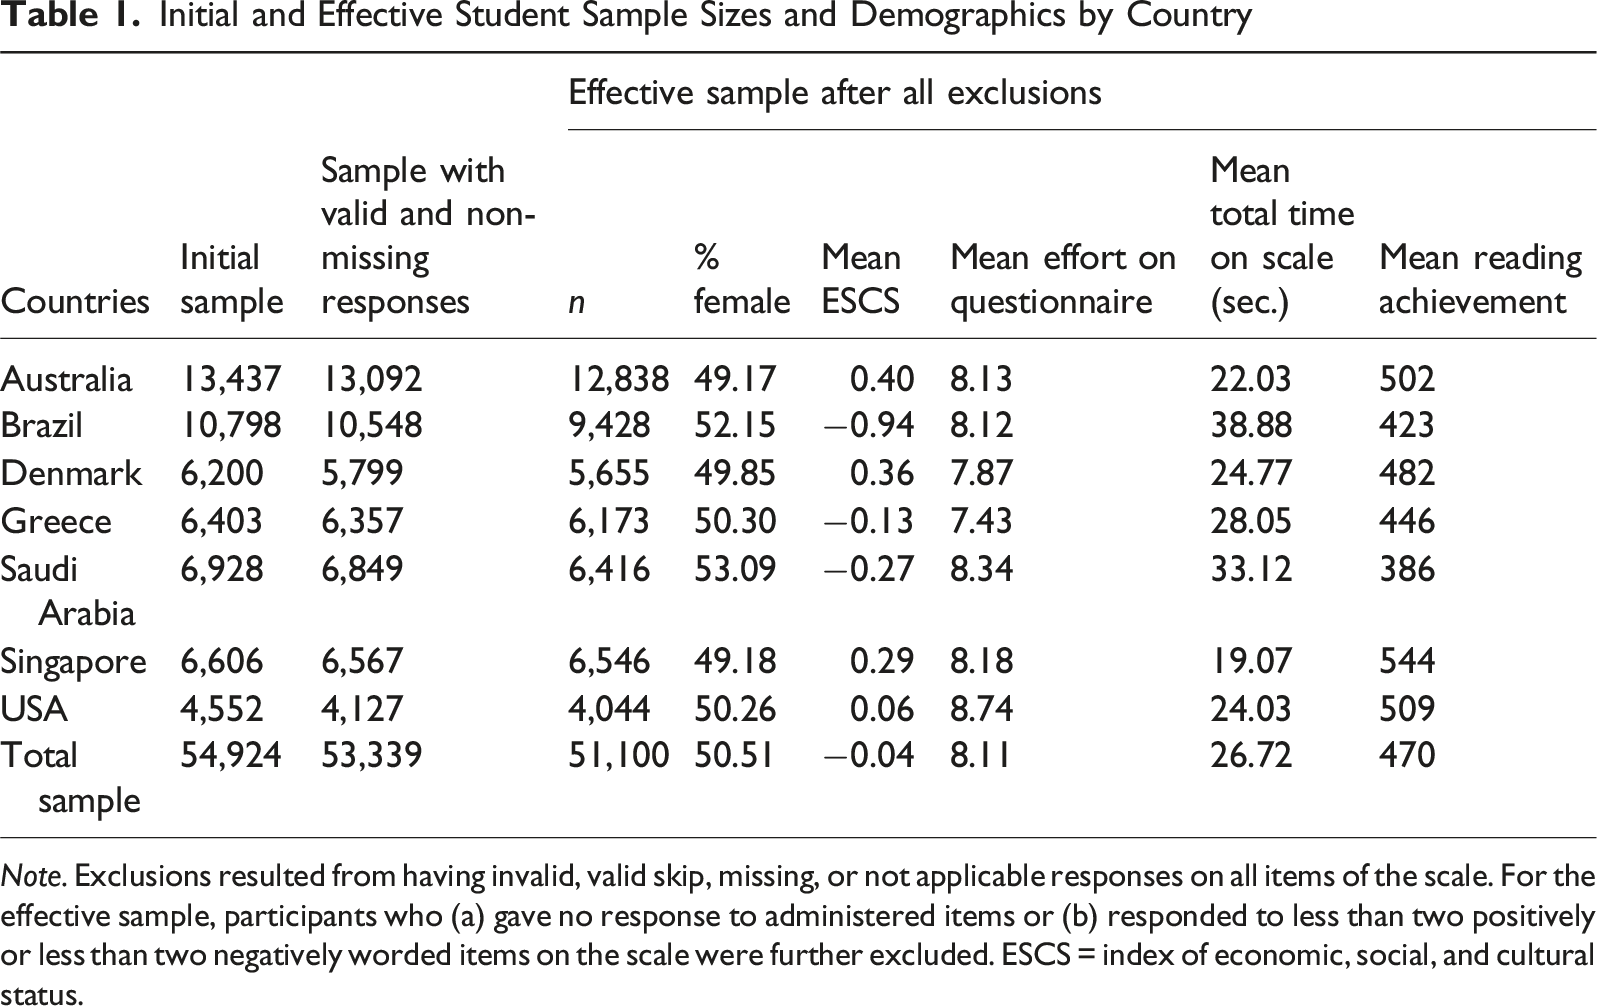
Note. Exclusions resulted from having invalid, valid skip, missing, or not applicable responses on all items of the scale. For the effective sample, participants who (a) gave no response to administered items or (b) responded to less than two positively or less than two negatively worded items on the scale were further excluded. ESCS = index of economic, social, and cultural status.
Measures
Mixed-Worded Scale
Item Wording and Item Names of the Sense of Belonging Scale
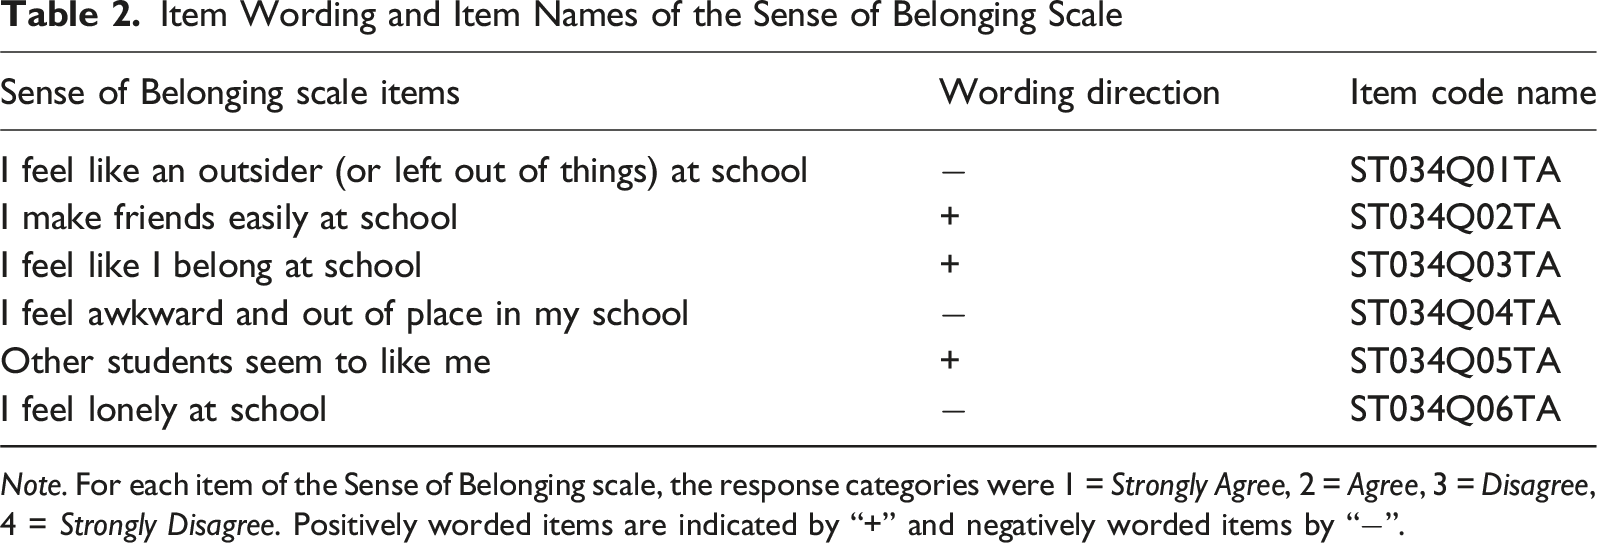
Note. For each item of the Sense of Belonging scale, the response categories were 1 = Strongly Agree, 2 = Agree, 3 = Disagree, 4 = Strongly Disagree. Positively worded items are indicated by “+” and negatively worded items by “−”.
The questionnaire was administered after 2 hours of cognitive tests. To minimize the burden on students, while also including as many scales and items as possible (OECD, 2024), a within-construct matrix sampling design was applied in the questionnaire in which each respondent received a subset of items from each scale. Specifically, the respondents were randomly administered only five out of six items of the Sense of Belonging scale. Since this study aimed to identify inconsistent respondents based on their responses to mixed-worded items, we only included students who randomly received and responded to at least two positively and two negatively worded items per scale by design.
Covariates of Inconsistent Responding
To investigate the association between inconsistent responding and student characteristics within countries, we included five sets of student-level variables: (1) Gender (1 = female, 2 = male), (2) ESCS, a standardized composite index of economic, social, and cultural status calculated from the family background measures highest parental education, highest parental occupation, and home possessions, with a mean of zero and a standard deviation of 1, (3) the self-reported effort students put into giving accurate answers on the context questionnaire (response to “How much effort did you put into giving accurate answers?” on a scale of 1 to 10), (4) the total time they used to answer the items on the scale (in seconds), and (5) reading achievement scores (10 plausible values which are scaled to an approximately normal distribution with an international average of about 500 and a standard deviation of about 100 points).
Statistical Analysis
We applied the constrained factor mixture analysis (FMA) that was developed by Steinmann, Strietholt, and Braeken (2022) to classify respondents as consistent or inconsistent based on their responses to mixed-worded items of the scales. This model is designed to determine respondents’ most likely membership in one out of two latent classes, consistent and inconsistent respondents, who respond to items of one underlying factor. In contrast to the consistent class, where the factor loadings are constrained to be of opposite directionality for positively and negatively worded items, the item loadings are constrained to be of the same directionality in the inconsistent class, reflecting the fact that the inconsistent respondents are characterized by either agreeing or disagreeing with both positively and negatively worded items. We estimated the FMA models for the mixed-worded scale and for each country with Mplus 8.5 (Muthén & Muthén, 1998-2017). The estimation method was robust maximum likelihood (MLR) with adjustments for sampling (sampling weight W_FSTUWT) and students’ clustering in schools. 2 A posterior probability for belonging in each class was estimated for each student, and class membership was determined by the highest posterior probability.
To study which students were more likely to respond inconsistently to the mixed-worded questionnaire scale, binary logistic regression analysis was conducted for each country separately. Specifically, we ran student-level, multivariate logistic regression models to investigate the associations between inconsistent responding (0 = consistent response, 1 = inconsistent response) and gender, ESCS, self-reported effort, time spent on the scale, and reading scores. This analysis was conducted in the IDB Analyzer (IEA, 2022) accounting for the final student weights and replicate sampling weights, and applying Rubin’s (1987) rules to the repeated analyses across the 10 plausible values of reading performance. Variance estimates for parameters of interest are calculated with multiple imputation methodology.
Results
Prevalence of Inconsistent Respondents Across Countries
Prevalence of Inconsistent Respondents on the Sense of Belonging Scale per Country (%)
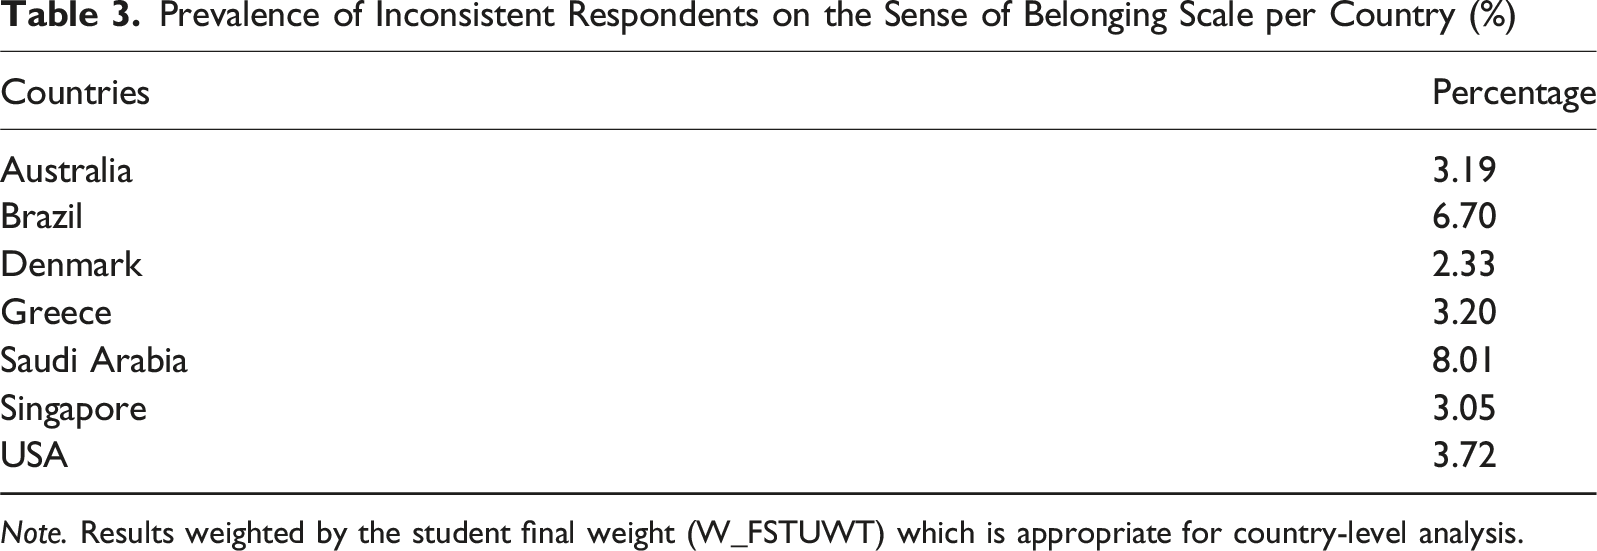
Note. Results weighted by the student final weight (W_FSTUWT) which is appropriate for country-level analysis.
Approximate Fit and Reliability Indices for the Effective and Consistent Respondent Samples by Country
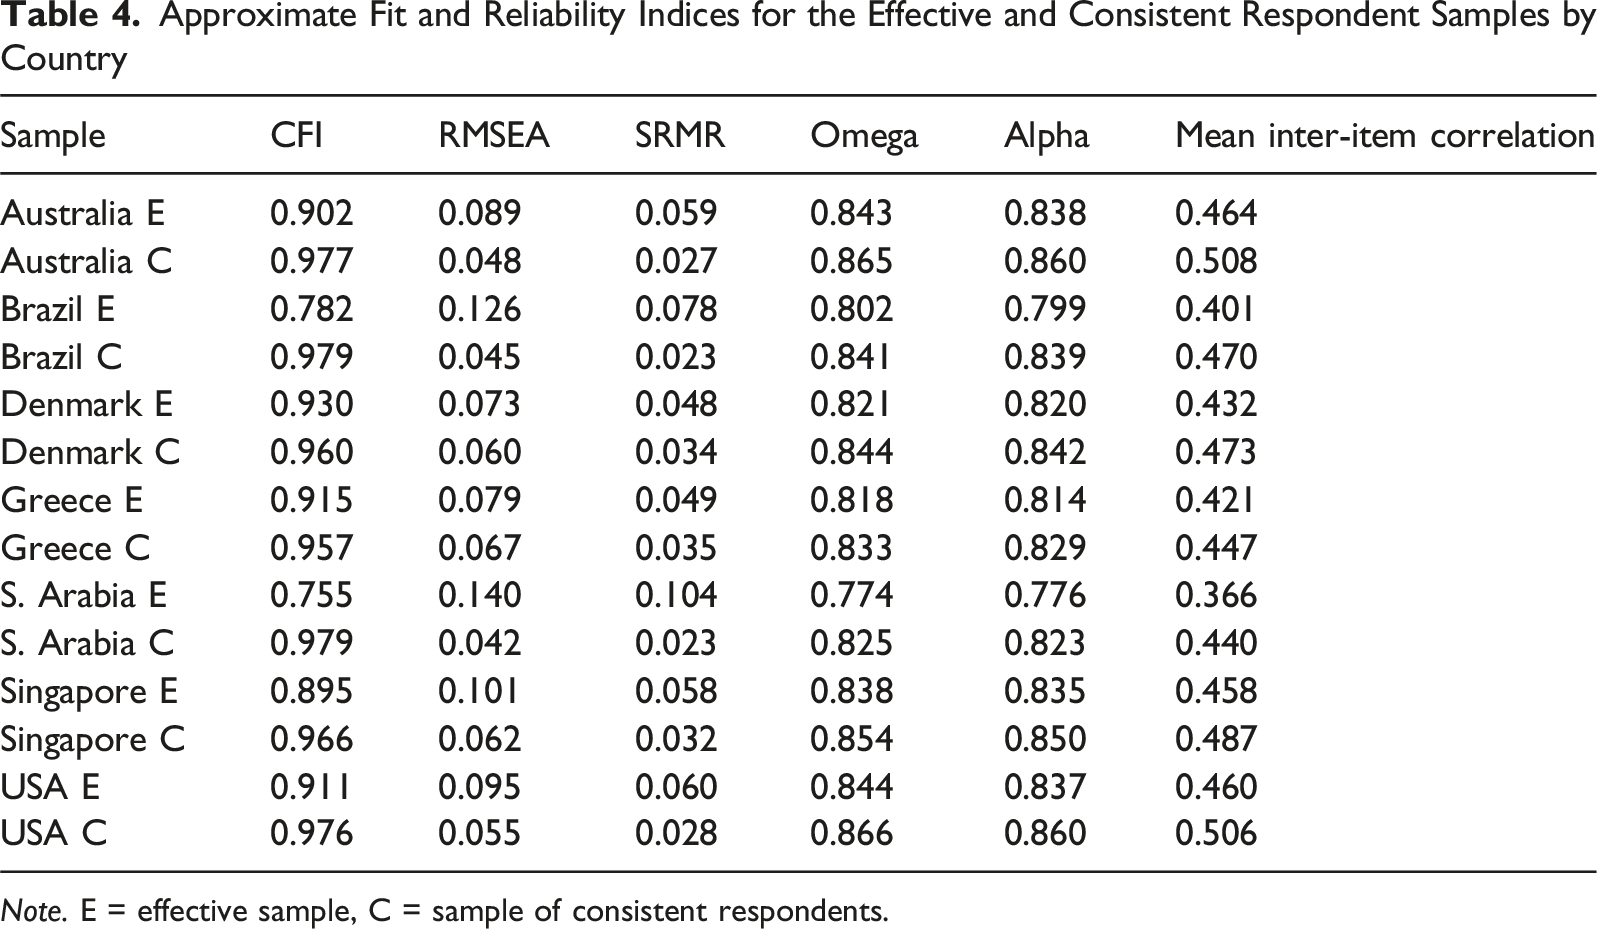
Note. E = effective sample, C = sample of consistent respondents.
Correlates of Inconsistent Responding
Results of Logistic Regressions of Inconsistent Responding on Student Predictors by Country
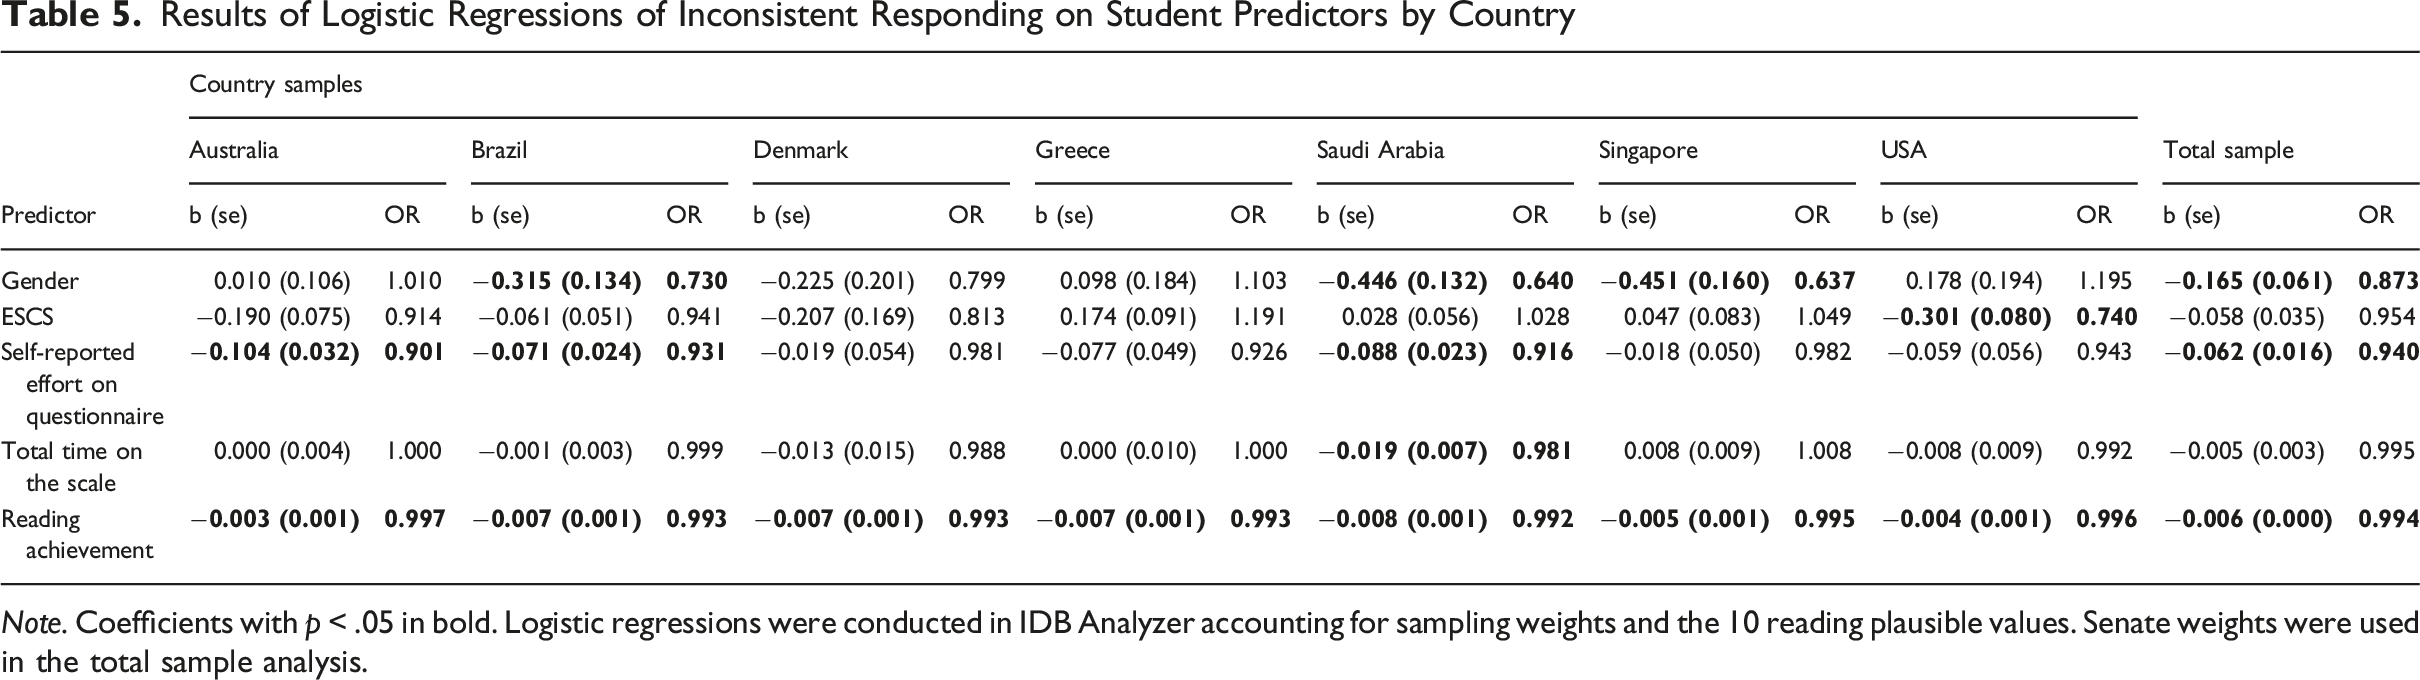
Note. Coefficients with p < .05 in bold. Logistic regressions were conducted in IDB Analyzer accounting for sampling weights and the 10 reading plausible values. Senate weights were used in the total sample analysis.
Females were more likely to be identified as inconsistent respondents in Brazil, Saudi Arabia, Singapore, and in the total sample, while in the other countries the association was not statistically significant. ESCS was a significant, negative predictor of inconsistent responding only in the USA after controlling for all other variables.
The self-reported effort put into answering the questionnaire was significantly and negatively associated with inconsistent responding on the Sense of Belonging scale in the overall sample and for three of the country samples. The time invested on the scale was a statistically significant negative predictor of inconsistent responding in the Saudi Arabia sample only.
Reading achievement was the student-level covariate that systematically had a significant, negative association with inconsistent responding across all countries. Better readers were less likely to give inconsistent responses to the scale. The effect sizes appear small but must be interpreted in light of the scaling of the reading scores with an international standard deviation of about 100. For example, in the total sample, a 100-score increase in the PISA reading achievement scale is associated with 45% lower odds to be classified as inconsistent respondent adjusting for other variables.
Discussion
This study investigated the prevalence and characteristics of inconsistent respondents to the mixed-worded scale of Sense of Belonging in PISA 2022 across seven heterogeneous countries. Specifically, it examined two hypotheses about the prevalence and the variation of prevalence of inconsistent responding across countries, and about student characteristics associated with this response behavior.
Conforming with hypotheses and previous research (Steinmann, Sánchez, et al., 2022; Steinmann et al., 2024), we found small percentages of inconsistent respondents with some variation among the seven countries. Saudi Arabia and Brazil had relatively higher percentages of inconsistent respondents—despite having the highest average time spent on completing the Sense of Belonging scale and moderate self-reported effort on the questionnaire—which can arguably be attributed to the fact that both countries have lower country-average achievement scores in PISA (Steinmann, Sánchez, et al., 2022). In previous research on cognitive tests, rapid guessing, a form of careless responding, was also observed in countries with lower average achievement scores (Ivanova, 2024; Michaelides & Ivanova, 2022). However, Singapore, a top performer in PISA 2022, did not have the lowest percentage of inconsistent respondents in our study. The reasons for inconsistent responding can differ between contexts, beyond different levels of student achievement. For example, negative wording might be more common or easier to understand in some languages than others.
For the cognitive and demographic predictors of inconsistent responding, the results mostly confirmed the lack-of-skills hypothesis. Low reading performance was the most robust predictor of inconsistent responding compared to the indicators for carelessness (low self-reported effort put into answering the questionnaire and a very fast response time to the scale items) and the demographic variables (socioeconomic index, gender) in the multivariate models. Low PISA reading score systematically emerged as a significant correlate of inconsistent responding in all country samples. The results on the systematic association between low cognitive test scores and inconsistent responding align with previous research (e.g., Bulut & Bulut, 2022; Chen et al., 2024; Gnambs & Schroeders, 2020; Marsh, 1986; Michaelides, 2019; Steedle et al., 2019; Steinmann, Sánchez, et al., 2022; Steinmann et al., 2024) and the notion that processing mixed-worded items is cognitively demanding (Baumgartner et al., 2018; Koutsogiorgi & Michaelides, 2022). However, it is conceivable that careless respondents give inconsistent responses to mixed-worded questionnaire items and score low on the tests. The carelessness hypothesis can therefore also explain this finding.
Low self-reported effort was significantly associated with inconsistent responding in three out of seven countries and in the total models. In contrast, a faster response time was significantly associated with inconsistent responding in only one of the country models. A possible explanation may be that while students’ self-reported effort is a more general evaluation and may be influenced by their behavior at certain parts of the survey, behavioral indications of engagement, such as response time, may become more relevant later in a questionnaire. This may be the case if effort diminishes toward the end of an assessment, and respondents become less attentive or careful, as has been demonstrated in the case of achievement tests (Debeer et al., 2014; Nagy et al., 2019; Pools & Monseur, 2021). These are potentially interesting avenues for future research, since this is the first study that looked into these effort and time variables and inconsistent responding.
The coefficients of the ESCS indicators for inconsistent responding were not significant in most samples possibly due to the inclusion of reading performance in the model, in agreement with previous non-significant results of ESCS with rapid responding in cognitive test items in multivariate models (Azzolini et al., 2019; Ivanova, 2024). Only in the USA sample, higher socioeconomic level was associated with lower inconsistent responding. Contrary to our hypothesis that males are more likely to be flagged as inconsistent (Steinmann et al., 2024), the effect of gender on response behavior was not significant most of the times, suggesting no systematic differences in inconsistent responding between males and females. In three countries and in the total sample, females were more likely to be classified as inconsistent than males. This unexpected finding may be a result of including other covariates in the model, where gender differences in favor of females have been reported, like effort and time, and especially reading performance, where females tend to perform higher than males (Mullis et al., 2017).
Limitations
The current study selected seven countries participating in the computerized PISA 2022 survey. Even though PISA provides extensive international data and administers comprehensive questionnaires with many attitude scales, it follows specific administration procedures and focuses on a population of 15-year-old students. We acknowledge the possibility that the study results may be influenced by the specific administration procedures or the age of the students. Furthermore, the seven country samples were selected based on their diversity in mean performance, geographic location, language, culture, and socioeconomic level. Results may have been different, had other countries been selected, considering that there are further differences in testing cultures with higher or lower emphasis on standardized testing programs. To enhance the generalizability of the findings, future research may replicate the results using different survey data, populations, a larger sample of nations, as well as alternative statistical approaches to classify inconsistent respondents (e.g., Arias et al., 2020, 2024; Kam & Cheung, 2024; Konstantinidou & Michaelides, 2025) which might lead to somewhat different classifications (García-Batista et al., 2021) and capture different response patterns in the “careless response” classes in addition to inconsistent responses.
We were constrained by availability of non-missing data and mixed-worded unidimensional scales in the PISA database. Due to the PISA matrix sampling design and the provision of randomly administering only five items to each student, the FMA was conducted on a small number of items. We selected examinees who responded to at least two positively and two negatively worded items because we considered this the minimum data points for a reliable classification. Future research should consider using scales with more positively and negatively worded items and with other response scale anchors to reduce sensitivity to specific item characteristics and to improve the robustness of the classification.
Answering questions on the actual causes of inconsistent responding to mixed-worded scales would require other types of data sources such as experimental data, not cross-sectional data and self-reported measures as in the present case. Thus, we would like to emphasize again that we cannot disentangle many of the assumed mechanisms with the data at hand. The fact that inconsistent respondents scored on average lower on the reading test can, for example, go back to poor readers struggling with the mixed wording (i.e., lack-of-skills hypothesis), or to unengaged, careless respondents giving both inconsistent responses and scoring low on the test. However, the fact that inconsistent responding did not coincide with rapid responding (as an indicator for carelessness) systematically seems to weaken the carelessness hypothesis.
Implications
Studies like PISA include questionnaires which are low-stakes and often long, and the validity of responses is a concern when analyzing data from such studies. As in previous studies, we found a rather low prevalence of inconsistent respondents to mixed-worded scales, but there is variability across countries. As a result, the validity of scale score comparisons across countries in multi-national surveys may be jeopardized if some country samples are more affected by inconsistent responding than others.
While the primary motivation in retaining scales with positively and negatively worded items is to promote thoughtful responding and to make careless respondents detectable, the psychometric consequences of using mixed-worded scales raise validity and fairness concerns, such as contaminated factor structures and suboptimal reliability indices. Even though responses flagged as inconsistent were not many, their removal resulted in better model fit for the anticipated unidimensional structures of the scale. Reliability coefficients were also improved after these exclusions.
The question whether to continue using mixed-worded scales depends on the assumed cause of inconsistent responding. If all inconsistent respondents were inattentive and careless, their responses could be considered invalid, and researchers would be able to detect and remove them from analyses, which would justify the inclusion of mixed-worded scales. Mixed wording would thus function as a built-in data quality check for analysis purposes when aggregate results are of interest and individual measurements are not required for all participants. If, however, (part of) the inconsistent responding is attributable to a lack of skills necessary to detect and handle the mixed wording appropriately, the conclusion would be to reconsider the use of mixed-worded scales; in such cases, researchers may opt for positively worded items only (cf. Greenberger et al., 2003) to make sure that all respondents manage to give valid responses. This recommendation is particularly relevant in large-scale, low-stakes surveys and in studies that include populations with lower levels of reading proficiency. While more research on the causes of inconsistent responding is necessary, by considering multiple predictors, the present study provides new and vital evidence that support both hypotheses, the carelessness as well as lack-of-skills hypotheses. If carelessness was the only explanation for inconsistent responding, we would have expected to find systematically faster response times to the mixed-worded scales among the inconsistent respondents, and systematically lower self-reported effort in responding to the questionnaire. Considering experimental findings which show more inconsistent responding in low-stakes contexts (Michaelides & Konstantinidou, 2026), we recommend that international large-scale assessments reconsider the use of mixed-worded scales in their questionnaires.
Footnotes
Acknowledgements
We thank Valentina Ierotheou for research support at the early stages of this project. Minor language editing was made using OpenAI’s ChatGPT. The authors take full responsibility for the content of the manuscript.
Ethical Considerations
This study is based on secondary analysis of publicly available, anonymized data.
Funding
The authors would like to acknowledge funding support to Michalis Michaelides by the University of Cyprus (Internal Funding Program).
Declaration of Conflicting Interests
The authors declared no potential conflicts of interest with respect to the research, authorship, and/or publication of this article.