
Abstract
Respondent behavior in questionnaires may vary in terms of attention, effort, and consistency depending on the survey administration context and motivational conditions. This pre-registered experimental study examined whether motivational context influences response inconsistency, response times, and the role of conscientiousness in survey responding. A sample of 66 university students in Cyprus completed five psychological scales under both low-stakes and high-stakes instructions in a counterbalanced within-subjects design. To identify inconsistent respondents, two index-based methods were used: the mean absolute difference (MAD) index and Mahalanobis distance. Results showed that inconsistent responding was somewhat more frequent under low-stakes conditions, although differences were generally small and significant only for selected scales when using a lenient MAD threshold. By contrast, internal consistency reliability was slightly higher, and response times were significantly longer under high-stakes instructions, indicating greater deliberation. Conscientiousness predicted lower inconsistency only in the low-stakes condition. Overall, high-stakes instructions did not substantially reduce inconsistent responding but fostered longer response times and modest gains in reliability, suggesting enhanced behavioral engagement. Implications for survey design and data quality in psychological and educational research are discussed.
Survey questionnaires typically consist of individual questions and multi-item scales, including instruments like psychological inventories that measure traits, beliefs, attitudes, behaviors, emotions, but also prior experiences, demographic and contextual characteristics. Data from these instruments help researchers examine research hypotheses, understand individual differences, and inform practice.
However, a growing body of evidence suggests that self-report surveys are vulnerable to various forms of careless or insufficient-effort responding; participants provide answers that do not reflect a thoughtful reaction to the item content (Arias et al., 2024; Huang et al., 2012; Meade & Craig, 2012). Responses unrelated to the item content can introduce measurement bias, undermining the validity of individual scores and potentially distorting key findings, especially when analyzing latent traits or drawing conclusions for policy and practice (Arias et al., 2024). As such, understanding and addressing careless responding has become critical for safeguarding data quality in survey-based research. A particularly common manifestation of careless responding is inconsistent responding, in which participants provide answers that do not logically align across similar or highly correlated items, creating response patterns that contradict theoretical expectations or data trends (Ward & Meade, 2023).
Mixed-worded scales which combine positively and negatively phrased items have long been used in survey design to minimize response biases and promote more attentive responding (Podsakoff et al., 2003). While mixed-worded scales are intended to enhance response validity, studies show that the prevalence of inconsistent responding varies widely, ranging from 1% to 41% across cross-cultural samples, educational systems, and age groups (Konstantinidou & Michaelides, 2025; Steinmann et al., 2024; Steinmann, Sánchez et al., 2022). Even a small proportion of inconsistent responses can have a substantial impact on psychometric properties of the measured constructs. Respondents may misinterpret or ignore item valence, produce inconsistent response patterns resulting in measurement problems, including reduced internal consistency, inflated factor structures, and overestimation of scale dimensionality (e.g., Arias et al., 2020; Podsakoff et al., 2024; Steinmann, Sánchez, et al., 2022).
Respondent Motivation and Data Quality in Low-Stakes Surveys
Survey questionnaires are widely used in national and international research across education, psychology, and other social science domains (Sturgis & Luff, 2021). They are typically administered under low-stakes conditions with minimal or no direct incentives or consequences for respondents. As a result, participants often exhibit reduced motivation (Alahmadi & DeMars, 2024) and are more prone to careless or insufficient-effort responding (Huang et al., 2012; Rios et al., 2017). A notable concern arises when a survey is low stakes for the individual respondent but high stakes for institutions that depend on the data for critical decisions about placements, rankings, policies, or accountability (e.g., Hopfenbeck et al., 2018).
A consistent finding across the literature on assessments and testing is that stakes significantly affect both motivation and performance. Wolf and Smith (1995) compared two groups of college students completing a standardized exam. Students told their scores would count toward course grades reported significantly higher motivation and outperformed those in the no consequence condition. The effect size for self-reported motivation was substantially larger than that for performance, indicating that stakes primarily affect effort investment. Similarly, Cole et al. (2008) found that students performed significantly better on the CollegeBASE exam when it was administered under high-stakes conditions than when it was presented as low-stakes. Hoyt (2001) reported that up to 22% of college students admitted to putting little or no effort into a low-stakes general education test. Sundre and Kitsantas (2004) further found that in low-stakes contexts, motivation was a significant predictor of test performance—a relationship that disappeared under high-stakes conditions, likely due to uniformly high levels of motivation across participants.
Effort during low-stakes assessments—often measured by time spent on task—strongly predicts the extent of performance improvement when stakes are increased. Students who were less engaged in a low-stakes condition tended to show larger gains once the assessment became high stakes (Attali, 2016). Wise and DeMars (2005), in a meta-analysis of 12 empirical studies, reported that students who were offered incentives or informed that their results would carry consequences consistently outperformed peers in no-stakes conditions, with performance differences reaching up to 0.59 standard deviations. Similarly, Goodman et al. (2015) showed that both point-based incentives (e.g., extra credit) and non-point-based rewards (e.g., gift cards, certificates) can be equally effective in promoting effort, whether applied at the individual or group level. Taken together, these findings highlight how raising assessment stakes can strengthen student motivation and, in turn, improve the validity and reliability of the data collected.
While the primary focus is often on test performance, similar response behavior may occur in surveys, undermining data quality, increasing nonresponse and careless responding, thus resulting in inaccurate inferences about the measured constructs (e.g., Huang et al., 2012). Research has further highlighted not only the prevalence of insufficient effort in surveys (Hong et al., 2020; Steinmann, Sánchez, et al., 2022; Steinmann, Strietholt, & Braeken, 2022), but also its specific types (e.g., straightlining), as the impact on survey data can vary differentially (DeSimone et al., 2018). For example, Zamarro et al. (2019) conducted a study analyzing large-scale international assessment data and found that students’ disengagement from the background survey, specifically when they skipped questions (item nonresponse), was strongly related to how well countries performed on the accompanying test. A meta-analysis by Loy et al. (2025) on personality tests, found that validity coefficients were different in employee assessment (low-stakes) compared with applicant testing (high-stakes) settings, possibly due to differential faking.
Methods for Detecting Careless and Inconsistent Responding
Detection methods can be classified as either a priori or post hoc (Meade & Craig, 2012). A priori methods, such as attention-check items, timers, or mixed-worded scales, are incorporated into the design of the study to promote more attentive and conscientious responding. Post hoc methods, by contrast, rely on statistical analysis after data collection. Among these, Mahalanobis distance is widely used to flag respondents whose overall response patterns deviate from the multivariate center of the sample (Meade & Craig, 2012). The Mean Absolute Difference (MAD) method detects inconsistency between positively and negatively worded items of a scale measuring a construct, with larger values suggesting greater inconsistency (Steinmann, Sánchez, et al., 2022). Both are index-based approaches, which calculate a numerical index for each respondent that reflects the degree of deviation or inconsistency in their response patterns, and by applying cut-off values to flag potential careless or inconsistent responders. In addition to these techniques, more complex statistical modeling, such as factor mixture models, has been applied to classify differential response patterns by modeling latent classes within the data, though this approach requires larger sample sizes (Arias et al., 2020; Steinmann, Strietholt, & Braeken, 2022).
In addition to statistical and modeling approaches, researchers have also employed behavioral and self-report methods to detect low effort responding. Self-report items assessing test-taking effort or motivation are often included in large-scale assessments and can help identify disengaged participants (Finn, 2015; Knekta & Eklöf, 2015). For example, Berry et al. (1992) found that 50%–60% of college students admitted to randomly answering one or more items on a standardized psychological test. However, self-report data must be interpreted cautiously, as participants may lack insight into their own behavior or may respond in socially desirable ways, especially in low-stakes contexts (Meade & Craig, 2012).
To complement these subjective measures, response time data has emerged as a reliable behavioral indicator of effort. Studies show that motivated respondents typically take more time to answer, while careless respondents tend to rush through items (De Boeck & Jeon, 2019; Wise & Kong, 2005). Hosch (2012) reported that students who scored higher on a low-stakes assessment spent significantly more time on the test. Analyzing response times can reveal low-effort behaviors such as rapid guessing or speeding, which are frequently observed in low-stakes contexts (Anghel et al., 2024; Michaelides et al., 2020). Unlike self-reports, these measures provide objective, unobtrusive evidence of cognitive engagement, enhancing the accuracy of inferences drawn from survey data (Lundgren & Eklöf, 2023; Soland et al., 2019).
Factors Influencing Inconsistent Responding
Inconsistent responding is influenced by a variety of factors including individual personality traits and response styles. In particular, individuals with lower conscientiousness are more likely to engage in careless or inconsistent responding (Bowling et al., 2016; Ward et al., 2017), especially in low-stakes contexts where external motivation is limited (Ward & Meade, 2023). Conscientious respondents tend to provide more thorough and consistent answers, regardless of the assessment conditions.
Due to social desirability bias, respondents answer items in a way that portrays them in a favorable or socially acceptable light, rather than responding truthfully (Krumpal, 2013). However, to our knowledge it has not been empirically studied in inconsistent responding behavior. A positive attitude toward research has not been studied either, even though participants who personally value research and respond to questionnaires thoroughly may indeed exhibit more attentive and consistent responding.
Other factors such as test length, test anxiety, age, and cognitive ability have also been found to affect response consistency. For instance, longer tests may increase fatigue and reduce attentiveness (Meade & Craig, 2012), while inconsistent responses tend to be more common among younger respondents and those with lower reading comprehension or cognitive abilities (Bulut & Bulut, 2022; Marsh, 1986). Gender differences have also been observed, with male students often reporting lower motivation and exhibiting faster, potentially less careful responding than female students (DeMars et al., 2013; Eklöf, 2007).
The Present Study
This study aims to experimentally investigate response patterns on mixed-worded scales administered under low-stakes and high-stakes motivational conditions. Specifically, we examined the prevalence of inconsistent responding, variations in response time, and the role of personality characteristics, particularly conscientiousness, in predicting response inconsistency.
Prior research on inconsistent responding has predominantly relied on observational secondary data, collected from young student samples under low-stakes conditions. The use of observational data prevents causal claims, while results based on young student populations may not generalize to adults or other demographic groups. Also, low-stakes settings do not necessarily reflect real-world contexts in which motivation can significantly vary (DeMars, 2007). The present study extends existing literature in three critical ways: (a) employing an experimental design to directly examine differences in response patterns, (b) explicitly comparing high- with low-stakes conditions, where motivation is expected to differ, and (c) using university rather than school student samples. By focusing on these aspects, this study offers new insights into how motivational contexts influence response behavior on surveys with mixed-worded scales, with potential implications for survey design and the interpretation of self-report data. The study is guided by three hypotheses:
Method
Sample and Study Design
Participants were 66 students from a public university in Cyprus. Fifty were women and 16 men, with a mean age of 20.53 (SD = 2.56) who received either course credit or a voucher for their research involvement. They completed five scales in Greek under both a high-stakes and a low-stakes condition under a within-participants design. To control for potential order effects, they were systematically assigned to one of the two counterbalanced orders (high-stakes first, followed by low-stakes; or low-stakes first, then high-stakes). The study design was approved by the Cyprus National Bioethics Committee (EEBK EΠ 2025.01.58) and was pre-registered at OSF (https://doi.org/10.17605/OSF.IO/AFQJX) on March 11, 2025.
Procedure and Materials
After scheduling an appointment, participants entered the laboratory, received a unique number by the researcher, read and signed the consent form. They were assigned to a condition (order: high-low or low-high) and individually completed a questionnaire on a computer consisting of five parts:
(a) A session collecting data on personal characteristics,
(b) A section that included five personality scales administered under the high-stakes (or low-stakes) condition,
(c) A distractor task designed to provide a break and reduce carryover effects between conditions,
(d) A section that included five personality scales administered under the low-stakes (or high-stakes) condition, and
(e) A final brief session collecting data on personal characteristics and demographics.
The experimental manipulation consisted of survey instructions describing a high- and a low-stakes condition. The instructions for both conditions were adapted from research paradigms of faking on personality questionnaires, for example, McFarland and Ryan (2000). The high-stakes instruction read as follows: Please respond to the following scales. While answering, consider that your responses are extremely important! Assume that they will be evaluated by someone making a critical decision about you, such as selection for a job position or admission to a university program. Take your time to carefully consider each question and provide accurate answers that truly represent yourself.
The low-stakes instruction read as follows: Please respond to the following scales without worrying about the accuracy of your choices. For example, think about how you would answer a questionnaire in which you have no interest in the questions or the subject matter. No one will judge your answers, and those will not affect any important decision concerning yourself.
Primary Measures
Five scales were administered in both conditions and participants were asked to respond to the same 63 items. To ensure completeness of responses, the survey required participants to answer every question before continuing to the next page.
The 5-item Satisfaction with Life scale is designed to measure global cognitive judgments of one’s life satisfaction (Diener et al., 1985). Participants indicate how much they agree or disagree with each of the items using a 7-point scale that ranges from 7 (strongly agree) to 1 (strongly disagree). The Greek version of the scale used in this study was retrieved from Diener’s online archive, http://labs.psychology.illinois.edu/~ediener/SWLS.html, and was validated in a Cypriot sample by Anthimou et al. (2021).
The 20-item Revised UCLA Loneliness Scale (Russell et al., 1980) was developed to provide a detailed description of the experience of loneliness. Each item is rated on a 4-point scale ranging from 1 (never) to 4 (often). The scale was adapted in Greek by Anderson & Malikiosi-Loizos (1992) and includes nine reverse-coded items.
The 10-item Rosenberg Self-Esteem Scale (Rosenberg, 1965) is designed to measure global self-esteem. Responses are recorded on a 4-point Likert-type scale ranging from 1 (strongly agree) to 4 (strongly disagree). The scale was translated into Greek using a forward and backward translation method and has been utilized in Cyprus for data collection by Panayiotou and Papageorgiou (2007). The scale is balanced, consisting of five positively worded items and five negatively worded items.
The Self-regulation scale (Schwarzer et al., 1999) assesses post-intentional self-regulation, focusing on the stage where individuals pursue their goals but encounter challenges in sustaining their action. In these situations, it is essential to maintain attention on the task and preserve a positive emotional state. As a result, the scale’s items capture aspects of both attention regulation and emotion regulation. The scale consists of 10 items and responses were recorded on a 4-point Likert-type scale from 1 (not at all true) to 4 (exactly true). The Greek adaptation of the scale was conducted by the first author and his research team after receiving permission and specific guidelines by the second author of the Self-regulation scale. The scale contains seven positive and three negative items.
Need for cognition refers to an individual’s tendency to engage in and enjoy effortful cognitive endeavors (Cacioppo et al., 1984). The short version of the Need for Cognition scale with 18-items was used: nine items indicating a high need for cognition and nine reverse-scored items indicating a low need for cognition. Responses are recorded on a 4-point Likert-type scale ranging from 1 (extremely uncharacteristic of me) to 4 (extremely characteristic of me). The option “uncertain” was not presented. The Greek translation of the scale was conducted by Diakidoy et al. (2015).
Covariates
IPIP Big Five Factor Marker
The 50-item International Personality Item Pool representation of Goldberg’s (1992) markers for the Big-Five factor structure consists of 10 items for each personality dimension: Extraversion, Agreeableness, Conscientiousness, Emotional Stability, and Intellect/Imagination. Participants respond to the items on a 5-point ordinal scale ranging from 1 (very inaccurate) to 5 (very accurate). The Greek translation (Vakola, n.d.) of the scale was downloaded from https://ipip.ori.org/Greek50-itemBigFiveFactorMarkers.htm. Cronbach’s alpha coefficients for the five subscales in the current study were 0.878, 0.809, 0.781, 0.839, and 0.734, respectively.
Social-Desirability Scale
The Marlowe-Crowne Social Desirability Scale (Crowne & Marlowe, 1960) is a 33-item scale which reflects the tendency of individuals to seek approval or avoid disapproval by responding in a culturally appropriate way (Crowne & Marlowe, 1960; Paulhus & Reid, 1991). The 13-item shorter version of the scale was used as developed by Reynolds (1982). Responses were binary, with participants selecting either “true” or “false.” The scale has been translated and adapted in Greek (Koutsogiorgi, 2020). Cronbach’s alpha was very low, .549.
Personal Norm in Research Participation
This self-report scale was developed by the authors according to the norm activation model (Schwartz, 1977) to measure individuals’ personal norms for research participation. By capturing their attitudes toward engaging in research activities without reliance on external rewards or incentives, the scale reflects internalized feelings of responsibility, obligation, and commitment to contributing responsibly to scientific data collection. Cronbach’s alpha was 0.790.
Manipulation Checks
Two methods were employed to assess the extent to which participants adhered to the instructions in each condition. First, instructed response items were used as a straightforward method of detecting careless responses. The item “To ensure data quality, please choose ‘not at all true’ for this item” was included twice near the middle of one of the focal scales: once in the high-stake and once in the low-stake condition. Self-report items were also administered twice, at the end of each condition. The two questions were: “In the previous five scales, I was very focused on my responses” and “In the previous scales, I did not pay much attention.” These questions measured participants’ self-reported levels of attention and focus during their responses in the preceding scales on a 4-point Likert-type scale.
Data Analysis
To identify inconsistent respondents, we employed two methods to compare their prevalence across the two conditions. First, the mean absolute difference (MAD) method was applied by reverse-coding the mean score of negatively worded items and subtracting it from the mean score of positively worded items. Respondents with an absolute difference of ≥1.75 were classified as inconsistent (Steinmann, Sánchez, et al., 2022); this arbitrary threshold essentially implies a change in endorsement from the agreement to the disagreement side of the 4-point scale (or vice versa). We also considered a more lenient threshold of ≥1.00 which implies a one-unit difference in the responses to positively and negatively worded items of the ordinal scale.
Second, we used Mahalanobis distance, a statistical approach for detecting multivariate outliers by assessing how far a respondent’s data deviates from the overall sample distribution. Response time differences across the two conditions were also compared with a paired samples test. If statistical assumptions were violated, a non-parametric test was used instead of a parametric one. For hypothesis three and the prediction of inconsistent response status a negative binomial model was employed because the outcome was a count variable. 1 Finally, for the manipulation checks we compared each method across the two experimental conditions with paired tests. The dataset and analysis code can be found at https://osf.io/r93jg/overview?view_only=a04a24a680344512a9b23eabafc7bc21 on OSF.
Results
Participants’ Background Characteristics
Participants were 66 university students, of whom 75.8% were women. The mean age was 20.53 years (SD = 2.56) and the majority (72.7%) were Psychology students. Regarding their year of study, 47.0% were in their second year, 21.2% in their third year, 19.7% in their first year, and 12.1% were either in their final undergraduate year or enrolled in a postgraduate program.
To ensure that the counterbalance-order groups were comparable, we conducted independent samples t-tests and chi-square tests on key demographic and background variables (e.g., age, gender, year of study). These analyses confirmed that the two groups did not differ significantly, supporting the assumption of randomly equivalent groups.
Manipulation Checks
The results from the instructed response items (e.g., “To ensure data quality, please choose ‘not at all true’ for this item”), indicated that under the high-stakes condition 65 of the participants (98.5%) complied with the instruction compared with 61 in low-stakes (92.4%) condition. This manipulation suggests that participants remained generally attentive in their responses with a small difference in the two conditions in the expected direction which was not significant (McNemar’s test p = .219).
The second manipulation check involved two self-report items. After the high-stakes condition, all participants reported being at least somewhat focused on their responses and disagreed (somewhat or completely) about being inattentive. In the low-stakes condition, the corresponding percentages were 69.6% and 66.7% suggesting that the majority self-reported being focused and attentive in completing the scales, with only about a third of the sample responding they were not. A one-sided paired samples t-test revealed that participants reported significantly greater focus in the high-stakes condition, t(65) = 6.246, p < .001, d = 0.769, and were significantly less likely to agree with the reversed item indicating inattention, t(65) = −6.347, p < .001, d = −0.781, compared with the low-stakes condition. Wilcoxon’s non-parametric tests concurred with the results of the t-tests.
The manipulation checks yielded mixed results. While the self-report items indicated that participants perceived the high-stakes condition as more engaging by reporting greater focus and less inattention, the results were less consistent in the low-stakes condition. About one-third of participants reported lower concentration and acknowledged inattention, aligning with the expected disengagement under low-stakes conditions. However, the majority still reported being focused. Moreover, the instructed response item was correctly answered by nine out of 10 participants in the low condition, contrary to expectations that disengaged participants in the low-stakes condition would fail to comply.
Hypothesis Testing
To examine the prevalence of inconsistent responding (H1) we conducted a series of pairwise comparisons. After calculating the mean absolute difference (MAD) score between responses on the positively and negatively worded items of each scale, the one-sided t-test comparisons for the high and low conditions were significant only for the Rosenberg Self-Esteem scale, t(65) = −2.736, p = .004, d = −0.337; for the remaining scales results were as follows: UCLA Loneliness scale, t(65) = 0.730, p = .234, d = 0.090, Self-Regulation scale t(65) = −0.855, p = .198, d = −0.105, Need for Cognition scale, t(65) = −0.992, p = .162 d = −0.122. When combining all MAD scores across the four scales, separately for each condition, the mean comparison was marginally significant, t(65) = −1.714, p = .046, d = −0.211.
Participants were classified into the inconsistent respondent category if their MAD ≥1.75, or consistent otherwise. Very few cases were classified as inconsistent: in the high-stakes condition, three participants on just one scale each; in the low-stakes condition five students were classified as inconsistent in at least one scale (Table 1). Because of the binary outcome variable (being inconsistent or not), a paired non-parametric test comparison was carried out for each scale, with all results being not significant. Comparing the number of occasions of inconsistent response classification under the high versus the low-stakes conditions, was also not significant (Z = −1.414, p = .157).
Number of Scales for Which a Participant Was Classified as Inconsistent by Threshold and Condition
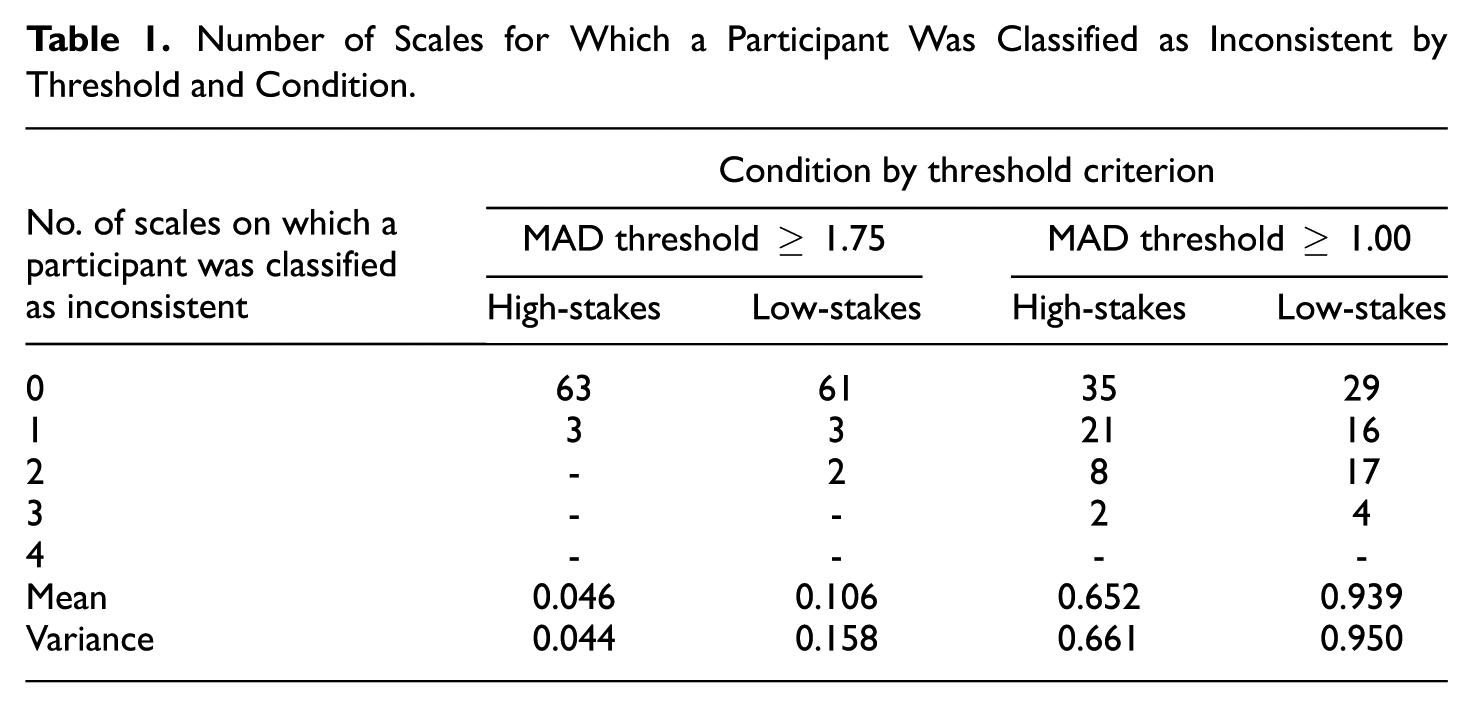
We also adopted a less strict criterion of MAD ≥1.00 as an indication of inconsistent behavior. As anticipated, this identified many more inconsistent respondents. Across all scales, 31 were inconsistent in the high-stakes and 37 in the low-stakes condition (Table 1). Among those participants, more tended to be classified as inconsistent in multiple scales in the low-stakes condition. The difference in the prevalence of inconsistent respondents between the two conditions was significant for the two shorter scales, the Rosenberg Self-Esteem (Z = −2.496, p = .013) and the Self-Regulation (Z = −2.714, p = .007) scales. Across all scales, the comparison of the number of occasions of inconsistent response classification under the high-stakes versus the low-stakes conditions, was significant (Z = −2.495, p = .013).
Mahalanobis distance was an alternative way to compare the high-stakes and low-stakes conditions for outlying response patterns on each scale separately. In separate linear regression models, we predicted a random uniform variable with the items of a scale as predictors. Mahalanobis distances were saved and those exceeding the critical value of the upper 5% of the chi-square distribution with the number of items as degrees of freedom were flagged as outliers. The results on Table 2 illustrate that the number of outliers based on Mahalanobis distances does not systematically vary across the two conditions. There are small differences (if any) with slightly more outliers occasionally in the high and other times in the low-stakes condition.
Results of the Mahalanobis Distance, and Reliability Analysis by Condition
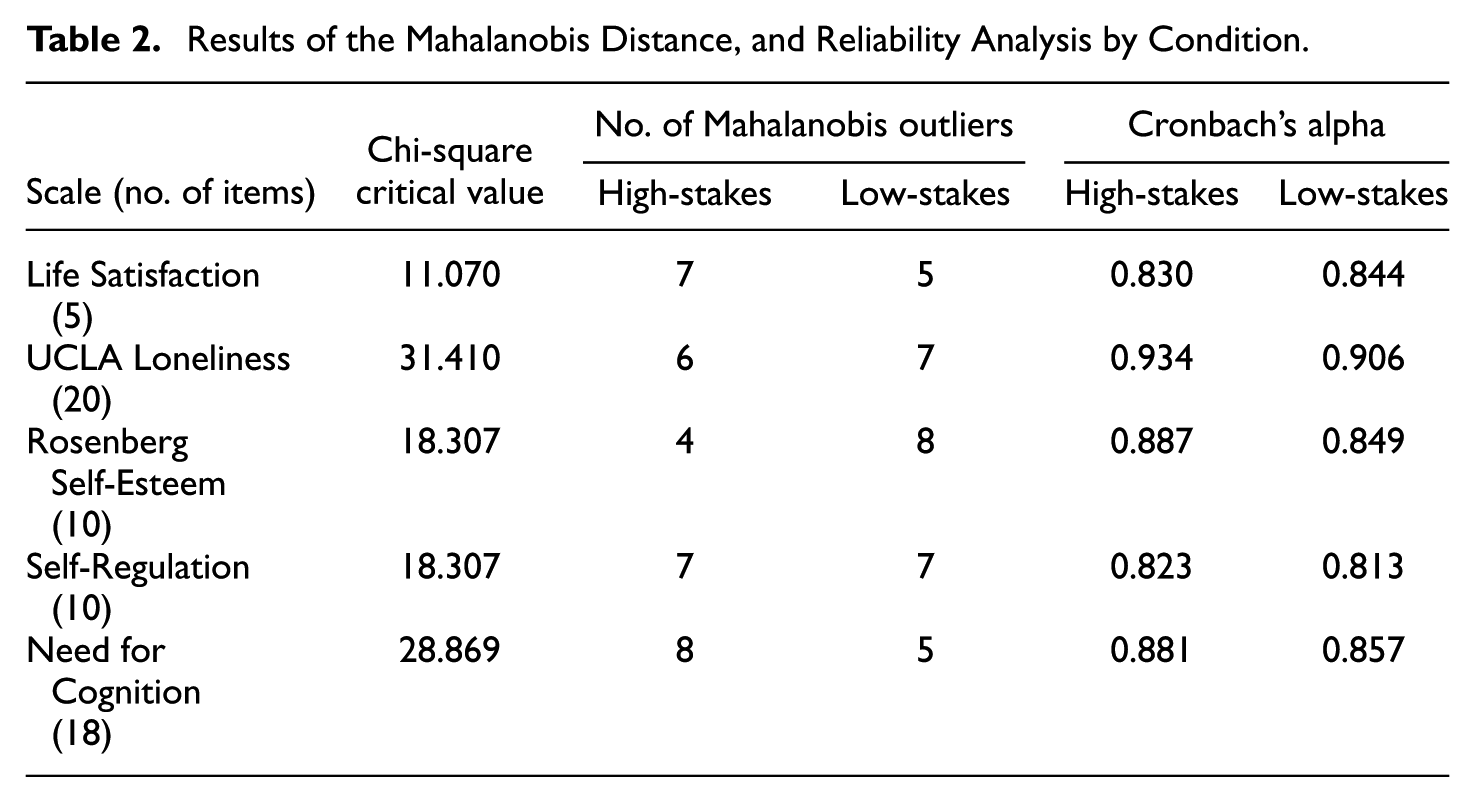
In Table 2 the Cronbach’s alpha reliability coefficients for each scale by condition, suggest that for the four mixed-worded scales, the alphas were slightly increased in the high-stakes compared with the low-stakes condition.
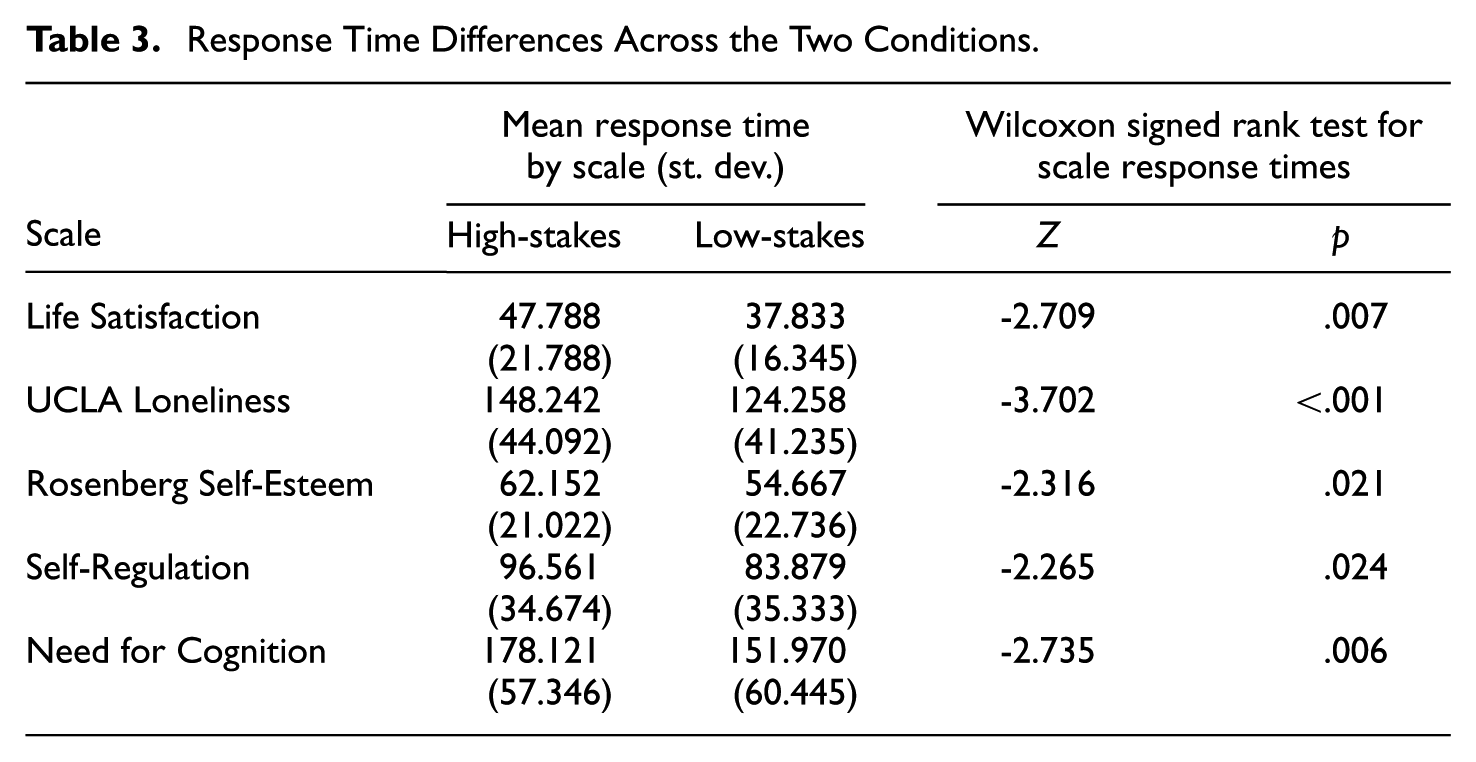
To test Hypothesis 2, the distributions of the response time variables of the five scales were inspected and were found to have positive skewness less than 2. In four cases, the Kolmogorov–Smirnov tests suggested violations of normality; therefore, Wilcoxon signed rank tests were conducted to compare response times between the low-stakes and high-stakes conditions for each scale (Table 3). Participants took significantly more time to complete a scale in the high-stakes compared with the low-stakes condition, supporting the hypothesis that increased stakes are associated with longer and more deliberate responding.
Response Time Differences Across the Two Conditions
To examine the third hypothesis—conscientiousness as a predictor of being classified as inconsistent—we used the dependent variable “number of times classified as inconsistent across the four mixed-worded scales” in each of the two conditions. As this is a count variable, a negative binomial regression model was employed. The conscientiousness score from the IPIP was specified as the main predictor. We considered the personal norms for research as a covariate, but social desirability was not included due to its very low reliability coefficient. The results of fit indices and predictor coefficients appear in Table 4. The overall model fit was not significant. The coefficients for conscientiousness were also nonsignificant, with the exception of the low-stakes condition when the strict criterion (1.75) of identifying inconsistent respondents was applied. The negative unstandardized coefficient implies that participants with higher conscientiousness score are less likely to be classified as inconsistent respondents across four mixed-worded scales completed under low-stakes instructions; this result accounts for personal norms about involvement in research, a covariate that was non-significant. With the lenient threshold of MAD ≥ 1.00 conscientiousness and personal norms were not significant predictors in either of the experimental conditions.
Fit Indices and Unstandardized Coefficients From the Negative Binomial Models with the Number of Inconsistent Response Classifications as Outcome
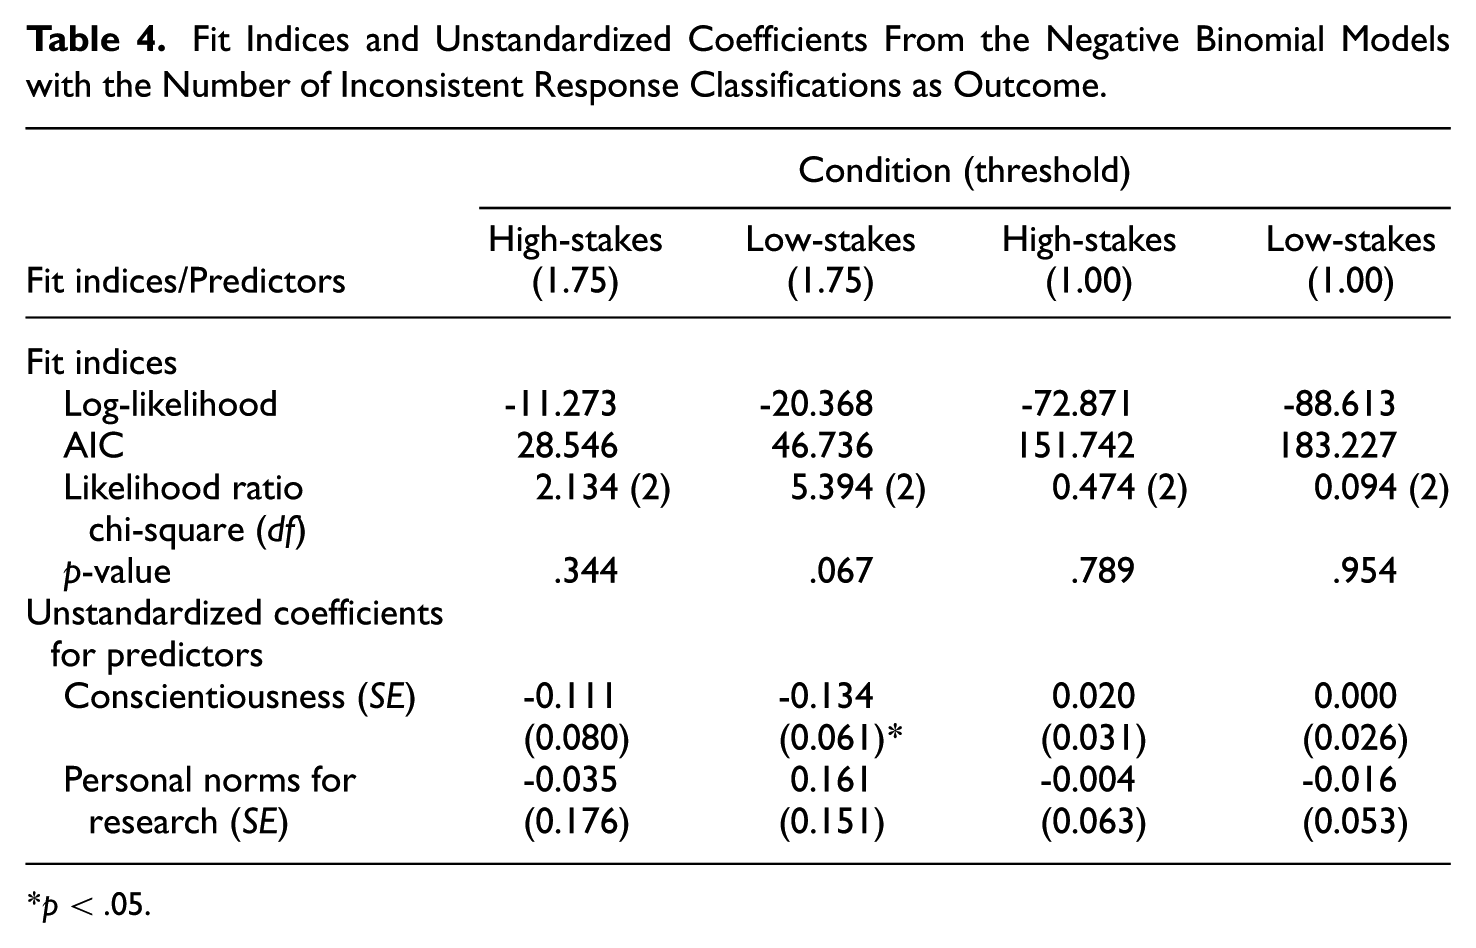
p < .05.
Discussion
A validity concern in survey research is the degree to which respondents engage thoughtfully and attentively with questionnaire items, particularly when there are no direct consequences for the responses they provide. Low motivation in such settings increases the risk of careless or insufficient-effort responding (Huang et al., 2012) which can compromise data quality and bias research findings (Rios et al., 2017). The present pre-registered study experimentally manipulated the motivational context by comparing responses provided under low- and high-stakes instructional conditions. This design allowed us to test whether increasing perceived stakes reduces inconsistent responding observed in mixed-worded psychological scales. Mixed-worded scales are often used in social science research (Podsakoff et al., 2003; Steinmann, Sánchez, et al., 2022) to mitigate acquiescence bias and improve validity, but they also provide an opportunity to detect non-content-based responding by comparing answers to positively and negatively worded items.
Previous research has suggested that no single approach can reliably identify all forms of careless and insufficient-effort responding with a recommendation to combine multiple indicators (Hong et al., 2020; Meade & Craig, 2012). In this study, we applied the mean absolute difference and Mahalanobis distance as complementary detection methods for inconsistent responding, providing a novel experimental test of whether response inconsistency differs by survey stakes.
The first hypothesis predicted that inconsistent responding would be more prevalent under low-stakes compared with high-stakes survey instructions. Using multiple detection methods, we observed slightly more instances of inconsistent responding in the low-stakes condition. However, the magnitude of this difference was small. When using the strict MAD threshold (≥ 1.75) and the Mahalanobis distance approach, the differences were not statistically significant. The more lenient MAD threshold (≥1.00) flagged a higher number of inconsistent respondents overall, and for two scales and in the overall comparison the difference between low- and high-stakes conditions reached statistical significance. These results indicate that manipulating survey stakes instructions had only a weak effect on response consistency.
We further examined internal consistency reliability to explore whether differences in response patterns were reflected at the scale level. Cronbach’s alpha coefficients were slightly higher in the high-stakes condition compared with the low-stakes condition across all mixed-worded scales. These small but consistent differences suggest that increased stakes may have promoted more deliberate responding. Although the differences were not large enough to indicate substantial shifts in measurement quality, they show that motivational context can have a subtle influence on the psychometric properties of self-report scales.
One possible explanation for the weak effect relates to the nature of our sample and the experimental setting. Prior studies on inconsistent responding have often been conducted with younger students and in observational, low-stakes contexts (e.g., Konstantinidou & Michaelides, 2025; Steinmann, Sánchez, et al., 2022). In contrast, our study implemented an explicit high-stakes condition and used adult students who participated voluntarily in a controlled laboratory setting, in most cases for course credit. Such participants are generally motivated and familiar with research participation, which is likely to promote engagement even in a low-stakes condition. Consistent with this interpretation, previous multinational studies also report relatively low levels of inconsistent responding in low-stakes conditions in some cultures (e.g., Steinmann, Sánchez, et al., 2022), suggesting a potential floor effect that may limit the detectability of differences induced by experimental manipulations of stakes.
The manipulation check analysis also aligns with this explanation. Self-report items confirmed significantly greater attentiveness and focus under high-stakes instructions; yet a substantial proportion of participants still reported being attentive in the low-stakes condition. The instructed response items demonstrated slightly lower compliance under low-stakes instructions, but the overall compliance rates were high in both conditions. Taken together, these findings suggest that most participants remained engaged and consistent, even when explicitly instructed to adapt in low-stakes condition.
Mahalanobis distance did not identify systematically more outliers in the low-stakes compared with the high-stakes condition. This result is consistent with recent methodological discussions on the limitations of index-based detection methods (Vogelsmeier et al., 2025). While indices such as Mahalanobis distance are attractive because they are easily computed, a central challenge lies in the freedom researchers have when defining cutoffs that separate attentive from careless respondents. Vogelsmeier et al. (2025) emphasized that the numerical values such as Mahalanobis distance do not lend themselves to straightforward interpretation or applicable cutoffs. Classifications end up being sample-dependent, because identical percentile thresholds behave differently across individuals; small deviations from average patterns may be flagged as extreme within low-variability respondents, while larger deviations may be overlooked in high-variability respondents. In contrast, the MAD index is specifically tailored to mixed-worded scales, and its cutoffs, although arbitrary, can be defined in relation to the response scale itself. In our study, we employed thresholds of 1.75 and 1.00, which correspond to meaningful shifts in endorsement on a 1 to 4 ordinal scale, making the method both more targeted and interpretable for detecting inconsistent responding.
Hypothesis two predicted that participants would spend more time responding under high-stakes instructions than under low-stakes instructions, reflecting greater engagement and deliberation. The findings supported this expectation: participants required significantly more time to complete the scales when responding under high-stakes instructions, indicating that the motivational manipulation successfully encouraged more deliberate and careful responding. This result aligns with research from cognitive testing showing that rapid responding, often conceptualized as “rapid guessing,” is a strong indicator of reduced effort and inattentive responding (Michaelides & Ivanova, 2022; Wise & Kong, 2005). The observed effect emerged in a context where the overall prevalence of inconsistent responding was relatively low, suggesting that even among generally motivated participants, increasing perceived stakes can further enhance engagement. This finding underscores the value of using behavioral indicators, such as response time, as a complement to inconsistent responding indices when assessing data quality.
The final hypothesis predicted that conscientiousness would be negatively associated with inconsistent responding, particularly under low-stakes conditions where external motivation is limited. The findings provided partial support for this hypothesis in the case of the strict method of detecting inconsistent respondents only. Participants with higher conscientiousness scores were less likely to be classified as inconsistent responders when completing mixed-worded scales under low-stakes instructions, even after accounting for personal norms regarding participation in research. Conscientious individuals were more likely to maintain attentive and deliberate responding even when the task carries little consequence. As expected, the association was not found in the high-stakes condition. This finding is consistent with previous research showing that conscientiousness is linked to greater effort investment (Bowling et al., 2016; Ward et al., 2017).
Taken together, these results suggest that motivational stakes influence data quality primarily by enhancing behavioral engagement, as reflected in longer response times and slightly higher reliability, rather than by substantially reducing inconsistent responding. While the present study provides new insights into how motivational context influences response consistency on mixed-worded scales in university students by introducing a high-stakes condition, its experimental manipulation may be limited in ecological validity. Participants were given instructions to consider that their responses carried high stakes rather than actually experiencing tangible consequences. Future research could address this limitation by implementing designs where identical assessments are administered under ecologically valid high- and low-stakes contexts. For example, the same test could be used for both employment selection purposes and for research purposes, allowing direct comparisons of response behavior under authentic motivational conditions. Such designs could offer stronger external validity and further clarify the extent to which stakes influence engagement, response consistency, and overall data quality in real-world applications. Extensions could also incorporate the mode of administration as a factor (Konstantinidou & Michaelides, 2025), because response behavior in computerized versus paper-and-pencil administration may differ.
Footnotes
Acknowledgements
Not applicable.
Ethical Considerations
The study was approved by the Cyprus National Bioethics Committee (approval no. EEBK EΠ 2025.01.58) on February 12, 2025.
Consent to Participate
All participants provided written informed consent prior to participating in the experiment.
Consent for Publication
Not applicable.
Funding
The authors disclosed receipt of the following financial support for the research, authorship, and/or publication of this article: The authors would like to acknowledge funding support to Michalis P. Michaelides by the University of Cyprus (Internal Funding Programs).
Declaration of Conflicting Interests
The authors declared no potential conflicts of interest with respect to the research, authorship, and/or publication of this article.