
Abstract
This study describes the development and validation of the PSCP Social Presence Scale, created to assess students’ perceived social presence in learning environments. The scale was tested with 446 pre-degree university students studying English as a foreign language. A pilot study with 117 students was first conducted to examine item performance and explore the preliminary factor structure. A second study with 329 students was subsequently conducted to confirm this structure. The final version of the scale includes nine items organized into two factors—Social Interaction and Social Connectedness. The findings suggest strong evidence of content (S-CVI = .96), convergent, and construct validity (CFA fit indices: χ2/df = 2.3, RMSEA = .06, SRMR = .03, CFI = .98, TLI = .97), and the reliability analyses indicate high internal consistency (α = .91) for the overall instrument. Overall, the findings support the PSCP Social Presence Scale as a valid and reliable measure of social presence for use in educational research.
Keywords
Introduction
In educational settings, fostering meaningful connections among students is essential, and one factor that plays a central role in shaping interpersonal relationships is social presence. Early work on intimacy (Argyle & Dean, 1965) and immediacy (Wiener & Mehrabian, 1968) helps clarify this concept. Intimacy refers to behaviors such as eye contact, physical proximity, and facial expressions that create a sense of closeness, while immediacy captures the verbal and nonverbal behaviors that signal psychological distance or connection. Together, these foundations illustrate how communication cues support interpersonal closeness. Building on this background, social presence is considered a key element in learning environments, shaping how students relate to and engage with one another.
Since its initial definition by Short et al., in 1976 as the degree of salience of the other person in the interaction and the consequent salience of the interpersonal relationship, numerous definitions of social presence have emerged. Walther (1993) defined social presence as the degree to which users can feel others’ presence in the result of interpersonal interactions during the communication process. Gunawardena and Zittle (1997) expanded on this by characterizing it as the degree to which a person is perceived as a “real” in mediated communication. Additionally, many researchers have contributed to the understanding of social presence in educational context. Picciano (2002) defined it as a student’s sense of being in and belonging in a course and the ability to interact with other students and an instructor. Garrison (2009) described social presence as the ability of participants to identify with the community (e.g., course or study), communicate purposefully in a trusting environment, and develop interpersonal relationships by projecting their individual personalities. Similarly, Sung and Mayer (2012) defined it as the subjective feeling of being connected and together with others during computer-mediated communication. Whiteside et al. (2023) described it as a critical literacy for cultivating emotions and relationships, which ‘serves an influential role in advancing and sustaining successful, meaningful learning experiences.
A large and growing body of research has also highlighted the critical role of social presence in shaping students’ learning experiences and academic outcomes. Specifically, students with higher levels of perceived social presence tend to participate more actively, share ideas more openly, and build stronger interpersonal relationships (Rourke et al., 1999). Prior work has also linked social presence to motivation (Tasir & Al-Dheleai, 2019), knowledge-sharing behavior (Yılmaz, 2017), learning outcomes (Hostetter, 2013), and satisfaction in both online and face-to-face contexts (Richardson & Swan, 2019; Zhan & Mei, 2013). Additional research shows that social presence supports affective and cognitive dimensions of learning (Russo & Benson, 2005; Yamada, 2009) and that instructional tools and environments can substantially shape how students experience social presence (Lomicka & Lord, 2007; Yıldız, 2009). Taken together, these studies suggest that when students feel socially present, they are more likely to engage, persist, and learn.
Overview of Social Presence Scales Reported in the Literature
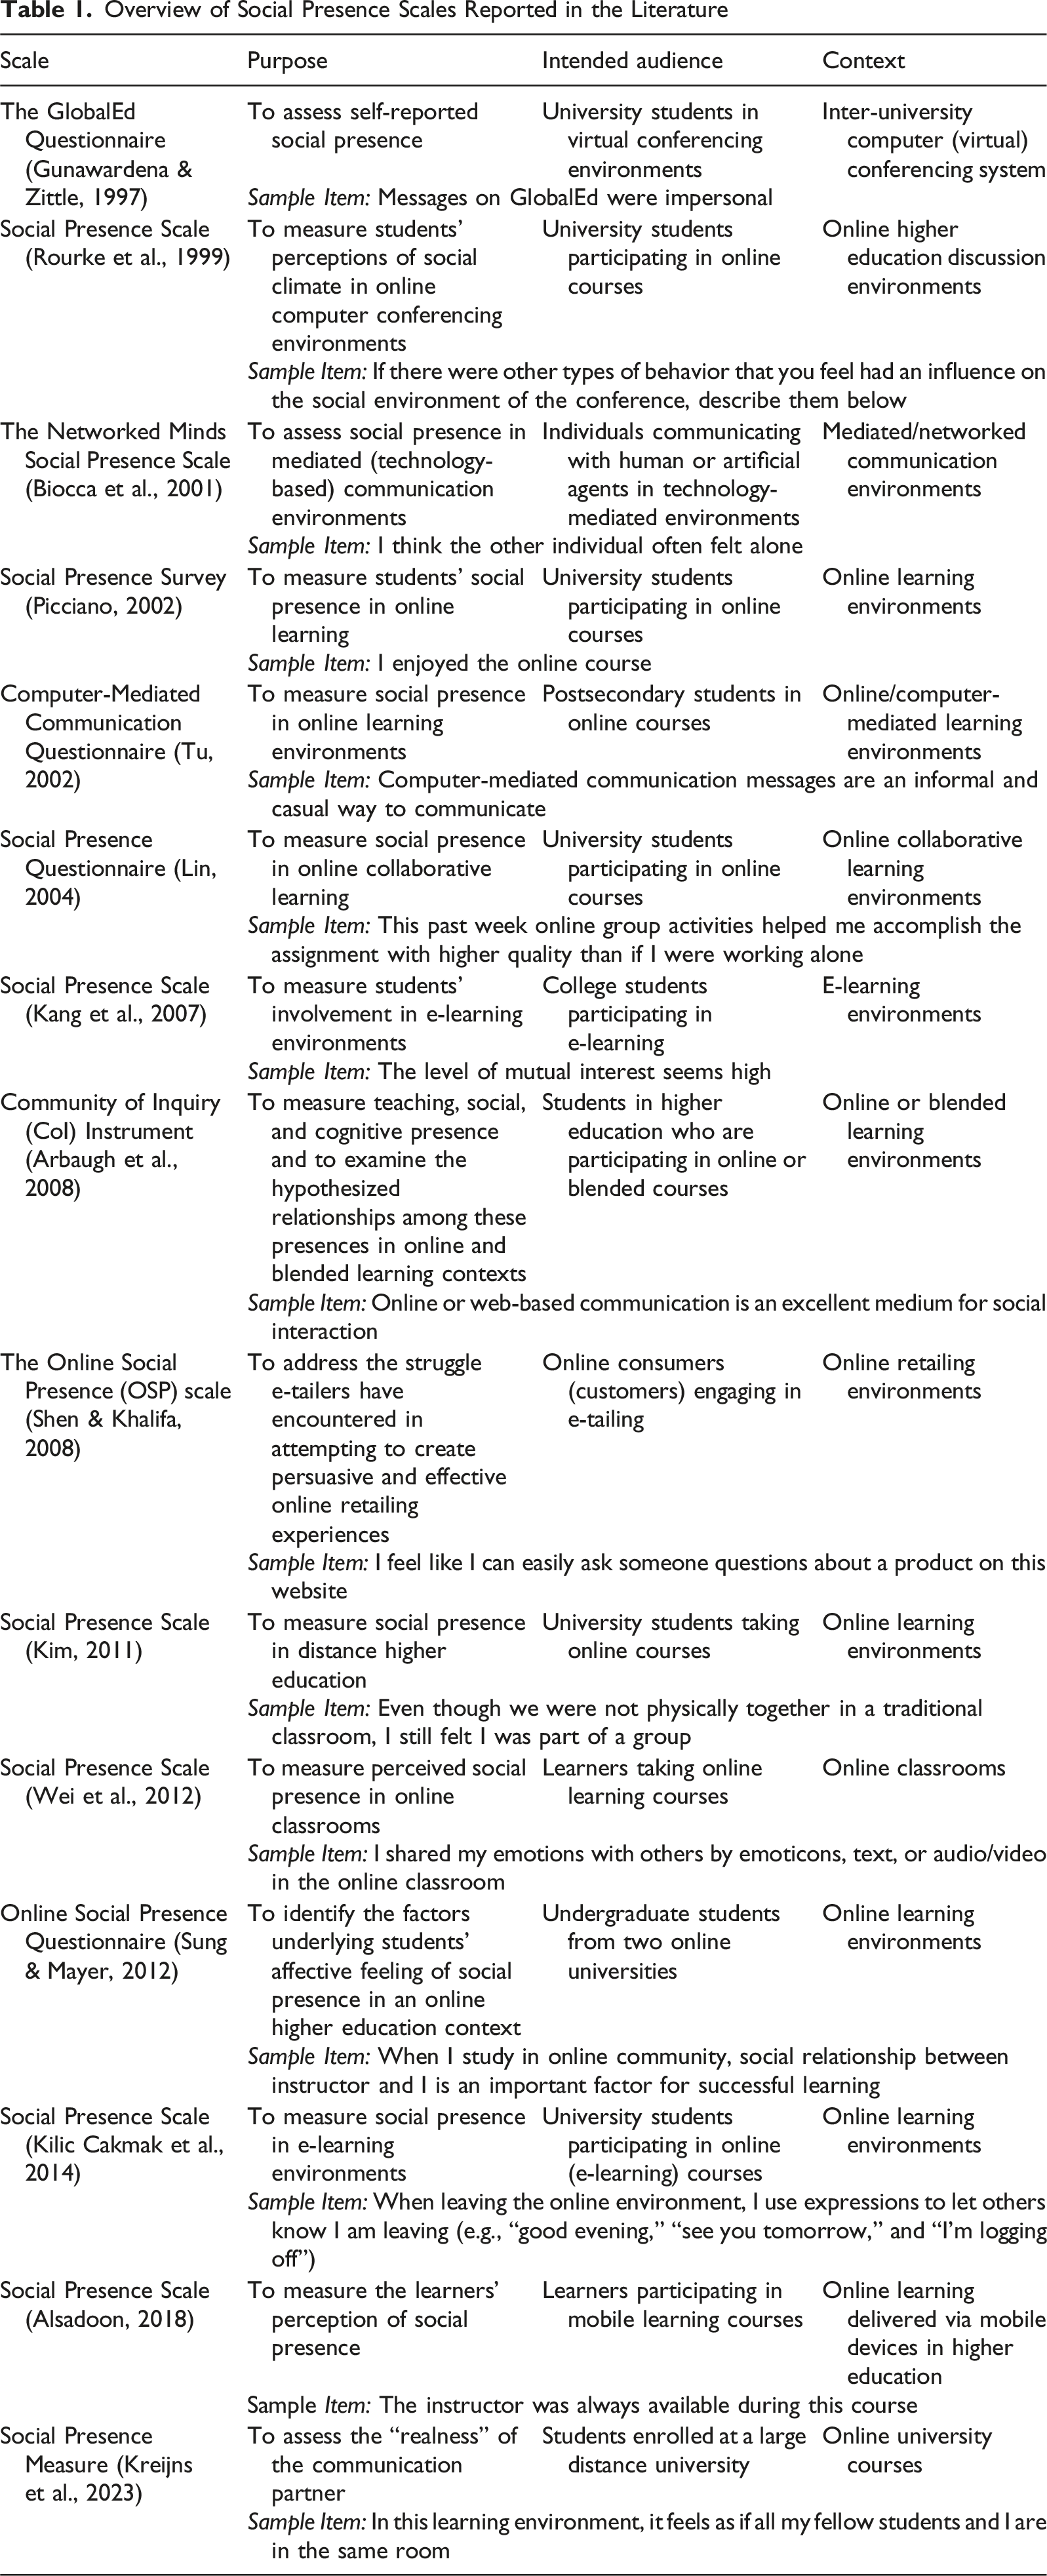
As Table 1 shows, existing social presence measures were designed for online learning environments, which limits their applicability beyond those settings. Similarly, several widely used scales (e.g., Kreijns et al., 2023) were validated exclusively with online learners, leaving a gap in tools that assess students’ social presence across diverse instructional contexts. Moreover, some existing scales include items that may measure constructs other than social presence, such as instructor responsiveness (e.g., Alsadoon, 2018) or perceptions of classmates’ isolation (e.g., Biocca et al., 2001).
By focusing on social interaction and connectedness, the PSCP Social Presence Scale is intended for use in studies that examine social presence as a standalone construct across diverse learning environments, including in-person classroom settings. Accordingly, the scale was developed to understand how students experience social presence across different instructional contexts. The study therefore addressed the following research questions: • How does the PSCP Social Presence Scale demonstrate content validity? • How does the PSCP Social Presence Scale demonstrate construct validity? • How does the PSCP Social Presence Scale demonstrate convergent validity? • How does the PSCP Social Presence Scale demonstrate discriminant validity? • How does the PSCP Social Presence Scale demonstrate item discrimination? • How does the PSCP Social Presence Scale demonstrate internal consistency? • How does the PSCP Social Presence Scale demonstrate criterion-related validity?
By developing a social presence scale tailored to any class setting, we hope to provide valuable insights into learners’ social presence.
Method
Research Design
This study employed a quantitative survey design to develop and validate a measure of students’ social presence. Consistent with scale development procedures, the study involved item generation, expert review, content validation, and psychometric evaluation through exploratory factor analysis (EFA), confirmatory factor analysis (CFA), and reliability testing.
Study Group
The initial sample consisted of 450 volunteer students enrolled in English language programs at the Schools of Foreign Languages of the participating universities. In terms of faculty representation, the largest group came from the Faculty of Engineering (n = 153), followed by the Faculty of Arts and Sciences (n = 80) and the Faculty of Economics and Administrative Sciences (n = 66). The sample included 180 male and 265 female students, with five participants choosing not to report their gender. Age distribution showed that most students were between 18 and 19 years old (n = 334), with additional groups aged 20–21 (n = 92) and 22 or above (n = 24). Students also varied in their prior English learning experience. 128 had studied English for 1 year, 147 for 2 to 3 years, and 80 for more than 10 years. While 344 participants reported enjoying learning English, 71 indicated that they did not, and 35 did not provide an attitude response.
After reviewing participant characteristics, an outlier analysis was conducted. Four cases were removed, resulting in a final sample of 446 students. Of these, 117 students participated in the initial scale development phase, and 329 completed the refined instrument used for the confirmatory factor analysis.
Development Process
The instrument developed in this study is part of a broader framework examining four interrelated constructs in learning environments: psychological safety (P), social presence (S), cognitive engagement (C), and perceived learning (P). The acronym PSCP reflects the initials of these constructs and serves as the naming convention for the family of scales developed within this project. Although the PSCP Social Presence Scale was developed to measure social presence within this framework, it was not tested or validated as a subscale of the framework. Instead, each construct was measured independently and subsequently modeled to examine their theoretical relationships. The present study therefore focuses on validating the social presence component as a standalone measurement instrument. Accordingly, scale development followed the methodological steps outlined by DeVellis (2003).
Determining Clearly What to Measure
The development process began with establishing a clear conceptual definition of the construct. A comprehensive review of the literature on social presence across communication and educational contexts was conducted to delineate its boundaries. Drawing on this synthesis, social presence was defined as a learner’s genuine social interaction and sense of connectedness with others in any class setting, even when technological distractions, such as smartphones, are present in the learning environment. This definition served as the basis for identifying the dimensions to be represented in the scale and guided subsequent item development efforts within the scale.
Generating an Item Pool
To assemble an extensive pool of potential items, existing instruments were reviewed (Alsadoon, 2018; Arbaugh et al., 2008; Biocca et al., 2001; Gunawardena & Zittle, 1997; Kang et al., 2007; Kilic Cakmak et al., 2014; Kim et al., 2011; Kreijns et al., 2020; Lin, 2004; Picciano, 2002; Rourke et al., 1999; Shen & Khalifa, 2008; Sung & Mayer, 2012; Tu, 2002; Wei et al., 2012). Although these instruments were developed for technology-specific communication contexts, they provided conceptual foundations for item generation in this study. Additional items were drafted to capture behavioral and experiential indicators of varying levels of social presence among learners. The initial pool included 146 items.
Determining the Format for Measurement
The format of existing scales in the literature was reviewed to determine the format for the PSCP Social Presence Scale. To make it easy for the participants to understand, we selected a 5-point Likert scale that ranged from strongly disagree to strongly agree.
Having Initial Item Pool Reviewed by Experts
In accordance with DeVellis’s (2003) recommendations, the preliminary item pool was subjected to an extensive review process. An initial screening, conducted by the researchers, removed items that were redundant, too similar to existing statements, applicable only to online environments, unsuitable for the characteristics of the target population, or conceptually misaligned with the construct definition.
This screening resulted in a pool of 53 items. A subsequent read-aloud procedure conducted by the research team and a language education specialist helped evaluate clarity, interpretability, and alignment with the construct. Based on this review, 22 items were retained for content validation.
Assessing Content Validity
Content validity was examined using the Lawshe (1975) procedure with evaluations from eight experts. Items not meeting the minimum content validity ratio (CVR ≥.75) were removed. Two items fell below the threshold (CVR = .65), producing a 20-item draft with a strong overall content validity index (CVI = .94).
Administering Items to a Development Sample
The 20-item draft scale was administered to 118 participants as part of Study 1. Data were collected online through Google Forms and screened prior to analysis.
Evaluating the Items
Item refinement proceeded through a series of psychometric analyses consistent with recommendations by DeVellis (2003).
Initial Examination of Item’s Performance
According to DeVellis (2003), for a scale to be reliable, it is crucial for individual items within a scale to demonstrate strong correlations with other items in the scale. In this study, a correlation matrix was employed to examine inter-item correlations, and positive relationships were observed across all items. Two items (Items 2 and 13) showed weak inter-item correlations with the rest of the pool (<.30) and were flagged for closer examination during factor analysis.
Item-Scale Correlations
Item–total correlations were then examined as another indicator of item quality. As DeVellis (2003) emphasizes, items that correlate well with the total score contribute meaningfully to internal consistency. In this study, item–total correlations ranged from .54 to .78, with Item 2 showing the lowest value and Item 20 the highest. All items exceeded the commonly accepted threshold of .50, indicating that each item contributed adequately to the reliability of the overall scale. Although Item 2 had the weakest item–total relationship, its value remained within an acceptable range, and the item was therefore retained at this stage of the development process.
Item Means
As recommended by DeVellis (2003), item means and variances were examined as an additional check after the initial screening based on correlations. In this study, item means ranged from 3.45 (Item 2) to 4.10 (Item 20). Although Item 20 had the highest mean in the set, it was retained for exploratory factor analysis because it also demonstrated satisfactory inter-item and item–total correlations, indicating that its relatively high response level did not undermine its contribution to the construct.
Exploratory Factor Analysis
Before conducting the exploratory factor analysis (EFA), the dataset (n = 118) was screened for entry errors, missing values, and outliers. One outlier was identified and removed, resulting in 117 cases for analysis. Sampling adequacy was supported by a Kaiser–Meyer–Olkin (KMO) value of .91, exceeding the recommended minimum of .60, and Bartlett’s test of sphericity was significant (χ2 = 1781.36, df = 190, p < .05), confirming that the correlation matrix was appropriate for factor analysis.
First, EFA was conducted using maximum likelihood extraction. The initial analysis with 20 items suggested a two-factor structure based on the Kaiser criterion. As Figure 1 shows, the scree plot indicated a clear break after the second factor. Together, the two factors accounted for 60.23% of the total variance, demonstrating strong structural coherence and substantial explanatory power. Scree plot of the PSCP Social Presence Scale factors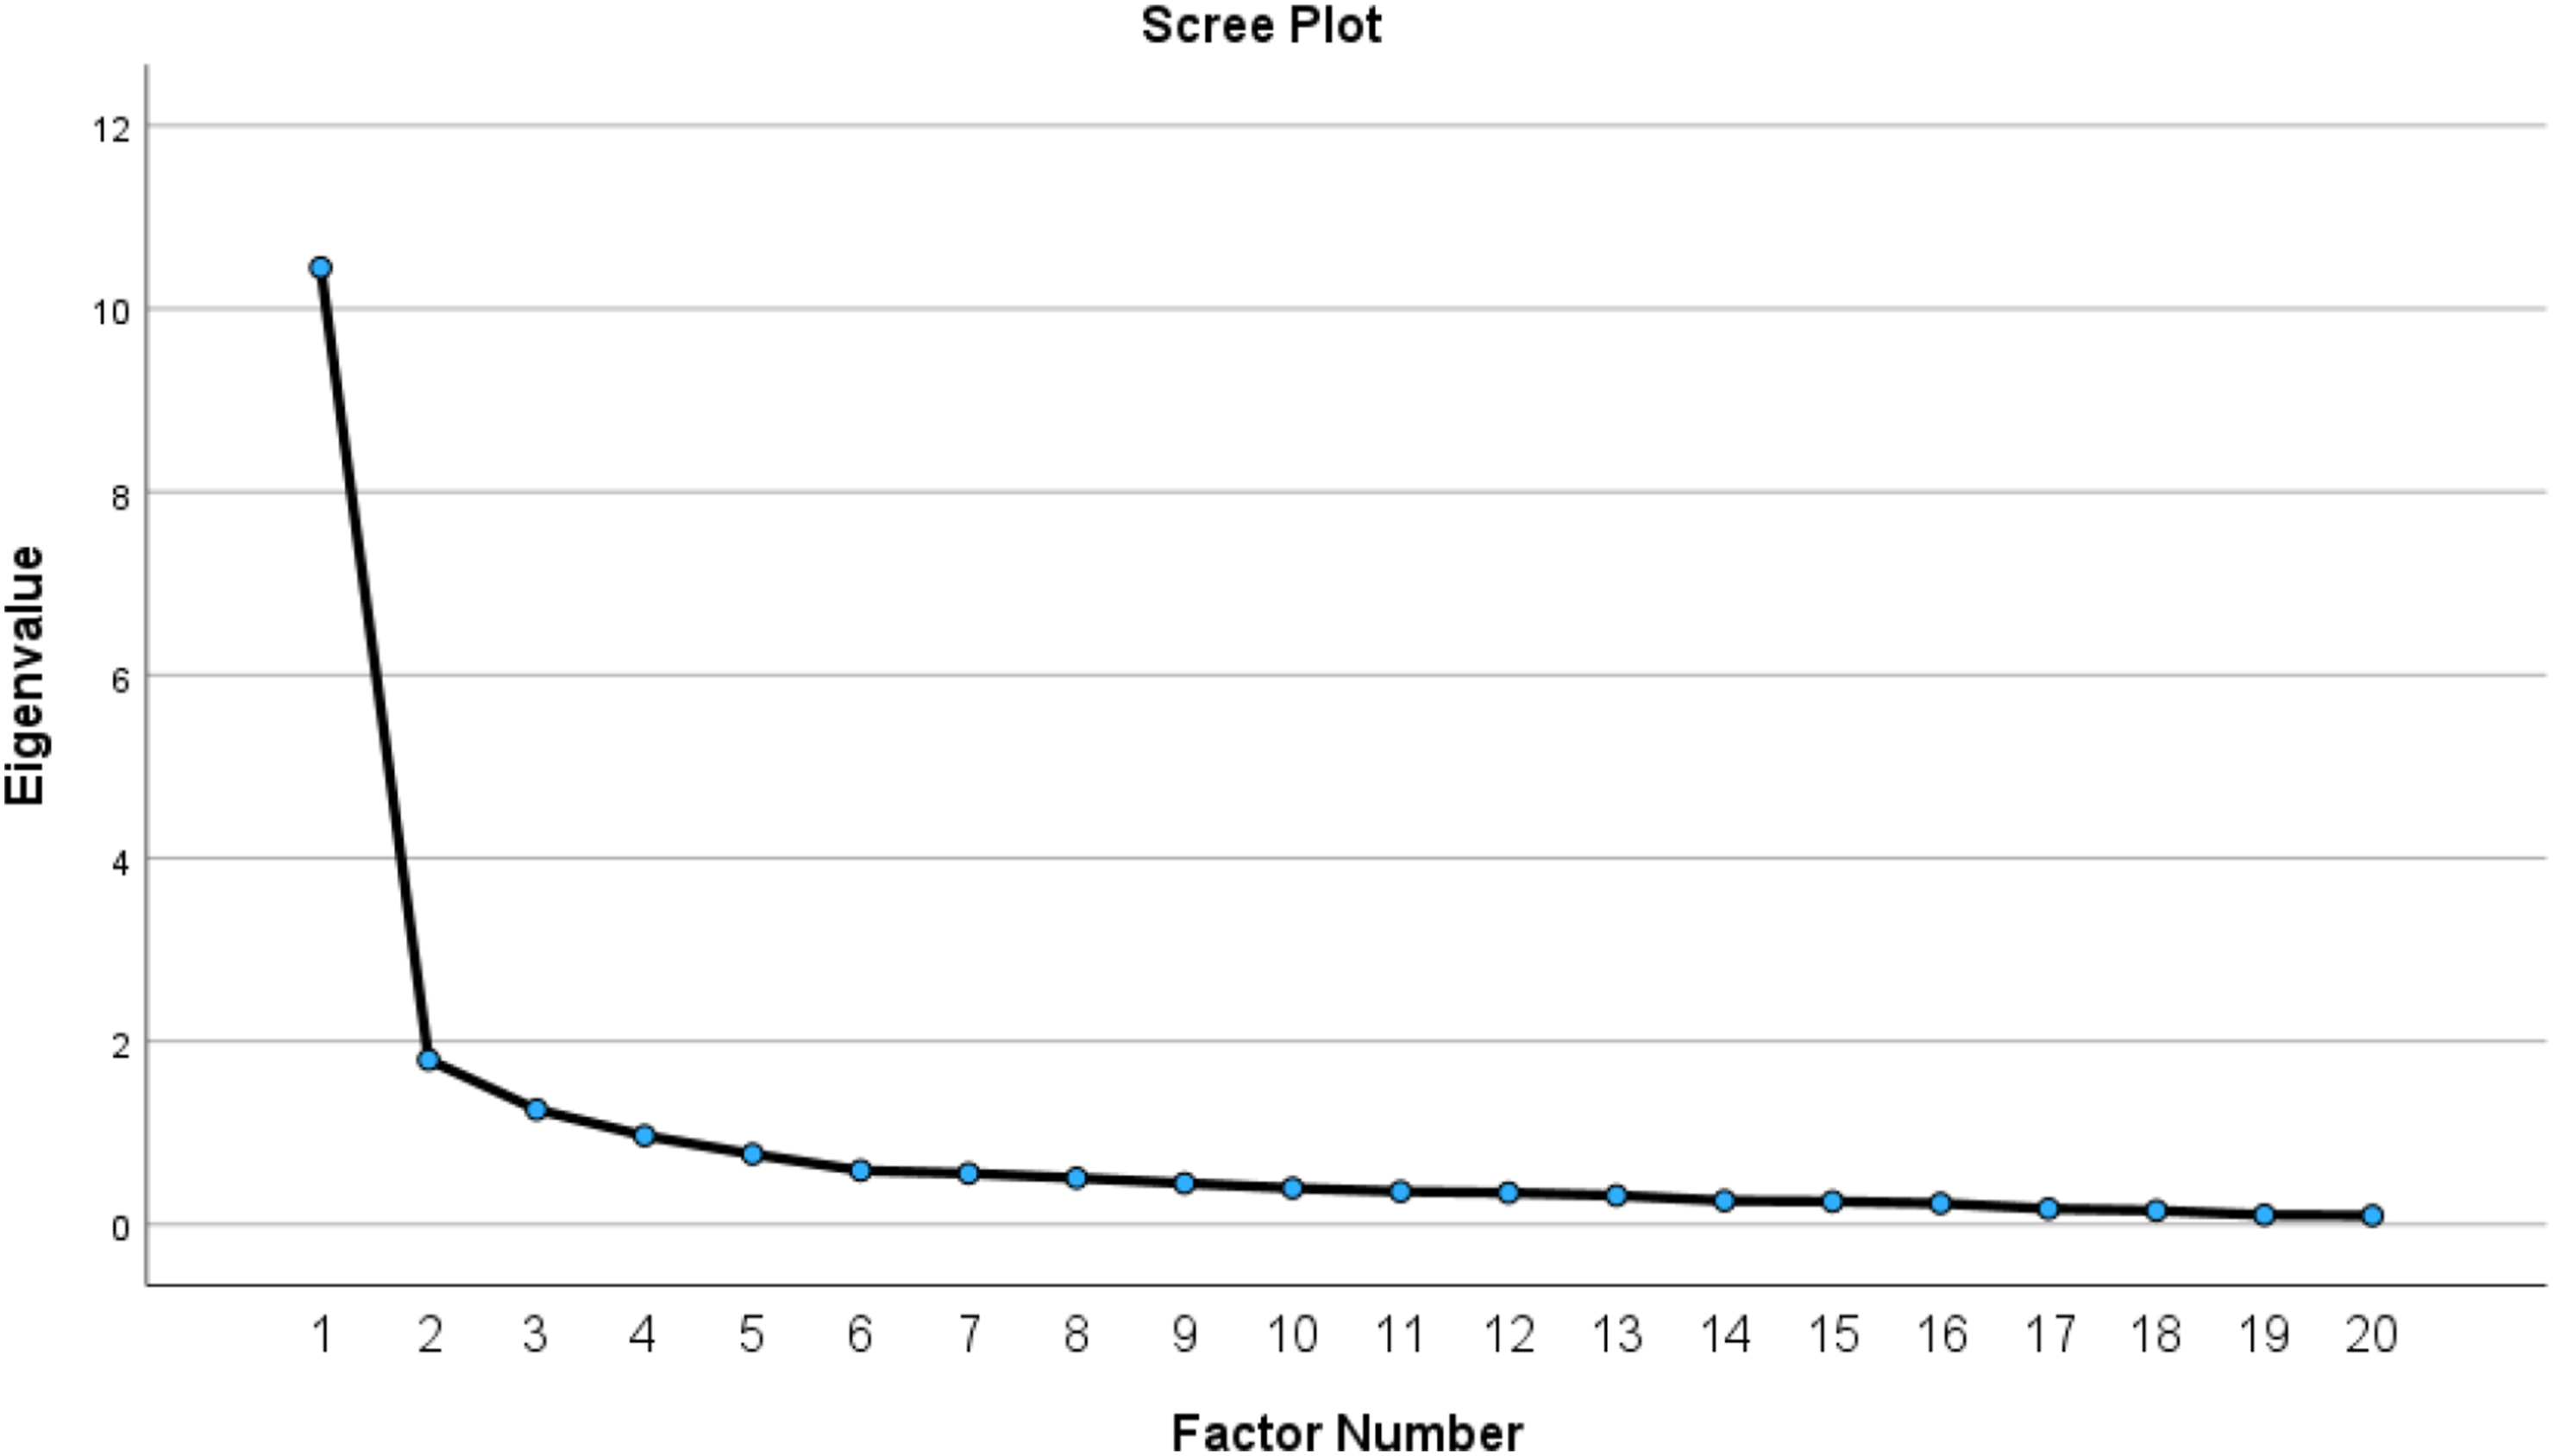
To further evaluate the factor structure, Velicer’s Minimum Average Partial (MAP) test was performed. Results indicated that a two-factor structure was optimal, with the smallest squared partial correlation of .03. Another approach used to validate the factors of the scale was the parallel tests. The analysis showed that as the fixation factor increased, raw eigenvalues, sampled eigenvalues, and percentage eigenvalues decreased. The raw eigenvalues were much higher than the sampled eigenvalues and percentage eigenvalues when the fixation factor was 1. Raw eigenvalues remained higher than the sampled eigenvalues and percentage eigenvalues when the fixation factor was 2. Therefore, two factors in the PSCP Social Presence Scale have been validated.
Draft PSCP Social Presence Scale Metrics
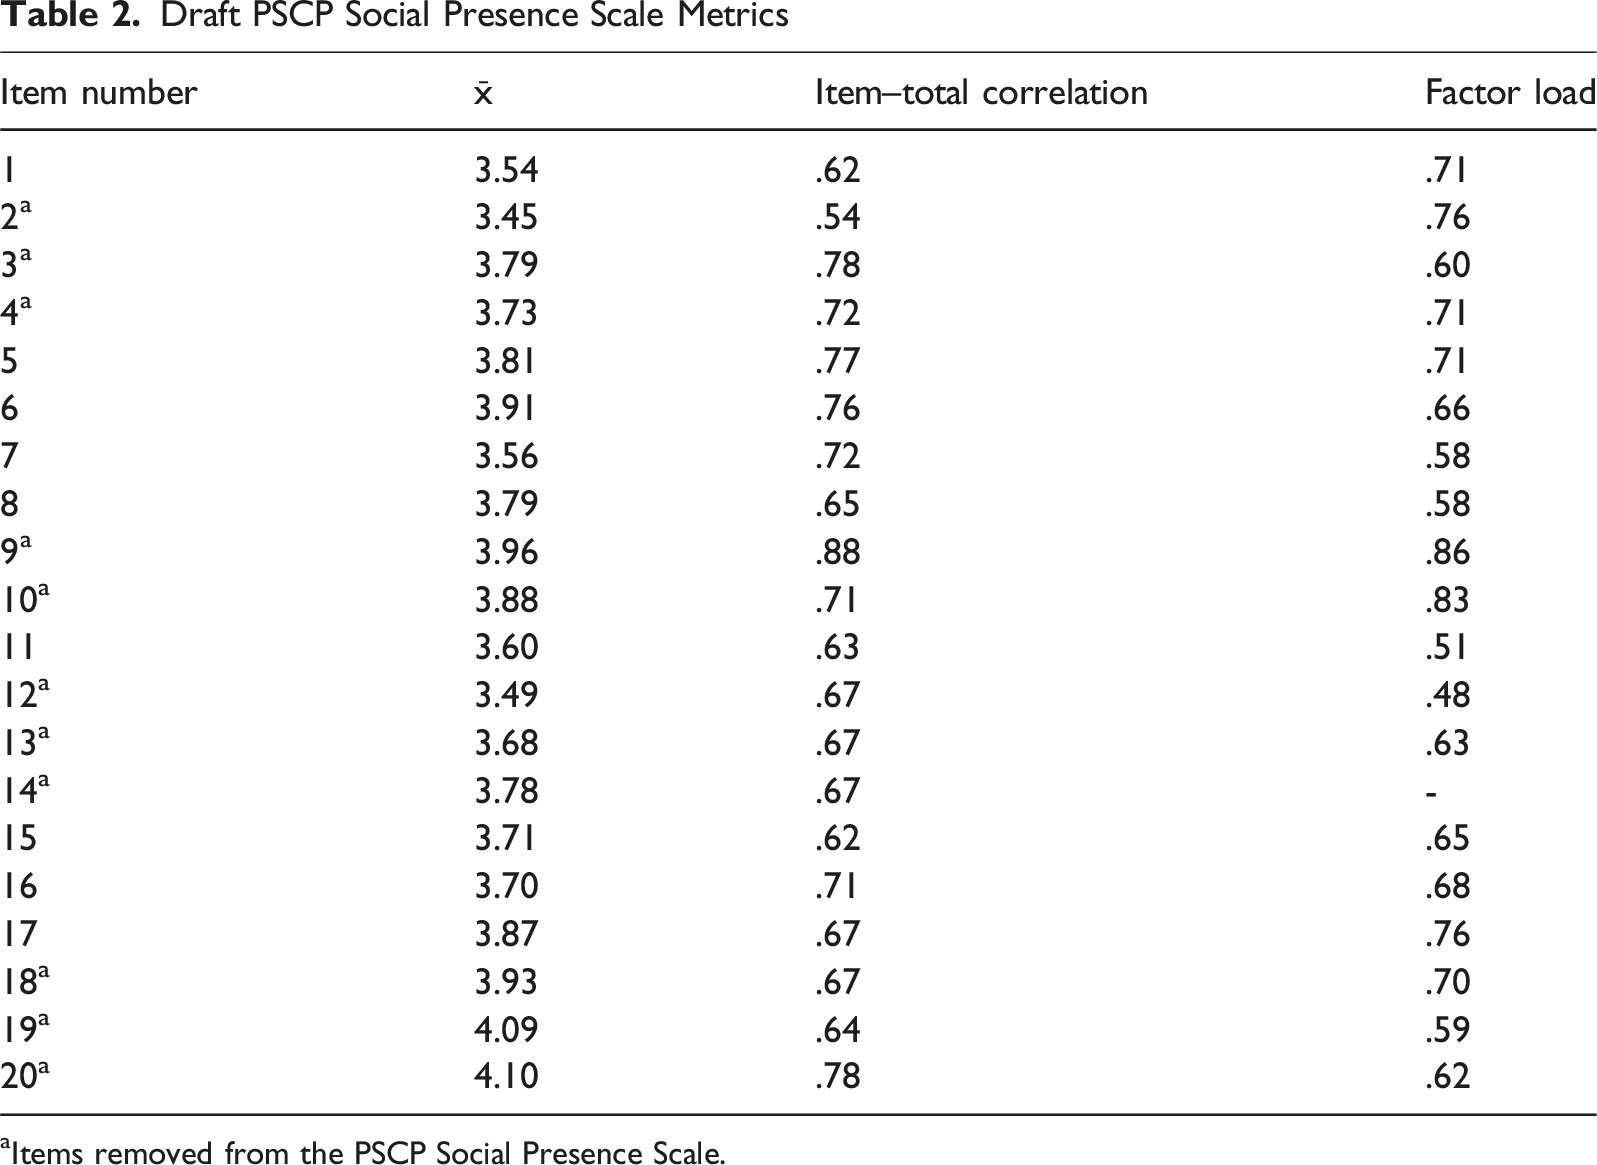
aItems removed from the PSCP Social Presence Scale.
Based on the results presented in Table 2, item-level decisions were made. Eleven items were removed for the following reasons: • Items 2, 3, 4, 12, 13 18, 19, and 20 showed cross-loadings exceeding |.10| on more than one factor. • Item 14 failed to load on any factor. • Items 9 and 10 formed a separate factor consisting of only two items, which was not theoretically or statistically justifiable.
After the removal of these items, the exploratory factor analysis was repeated on the remaining nine-item set. The two-factor structure was reproduced, and the factor structure remained stable. All retained items demonstrated substantial loadings on their intended factors (all >.50, p < .001), with no cross-loadings of concern.
Coefficient Alpha
Analyses conducted to assess the reliability of the nine-item PSCP Social Presence Scale showed strong internal consistency. Cronbach’s alpha was calculated as .89 for the first factor (five items), .85 for the second factor (four items), and .90 for the overall scale. Since .70 is considered acceptable for reliability (DeVellis, 2003), these findings indicate that the PSCP Social Presence Scale demonstrates a high level of internal consistency.
Overall, the analyses conducted in Study 1 yielded a refined nine-item scale that captures two theoretically coherent dimensions of social presence. Through a sequence of procedures—expert review, item-level analyses, and exploratory factor analysis—the item pool was reduced to those that demonstrated clear factor alignment, satisfactory discrimination, and strong internal consistency. These findings provided a sound empirical foundation for proceeding to Study 2, in which the proposed two-factor model was subjected to confirmatory factor analysis to further evaluate its construct validity.
Findings
To address the research questions guiding this study, findings from both phases of scale development are reported. The analyses conducted in Study 1 informed the refinement of the preliminary item pool and established the final structure of the scale. These results are described in the Method section as part of the development process. Study 2 then examined the stability of this nine-item structure using an independent sample. The results that follow present the empirical evidence from Study 2.
Findings on the Content Validity of the PSCP Social Presence Scale
Content Validity Ratios and Index for Items According to Expert Opinions
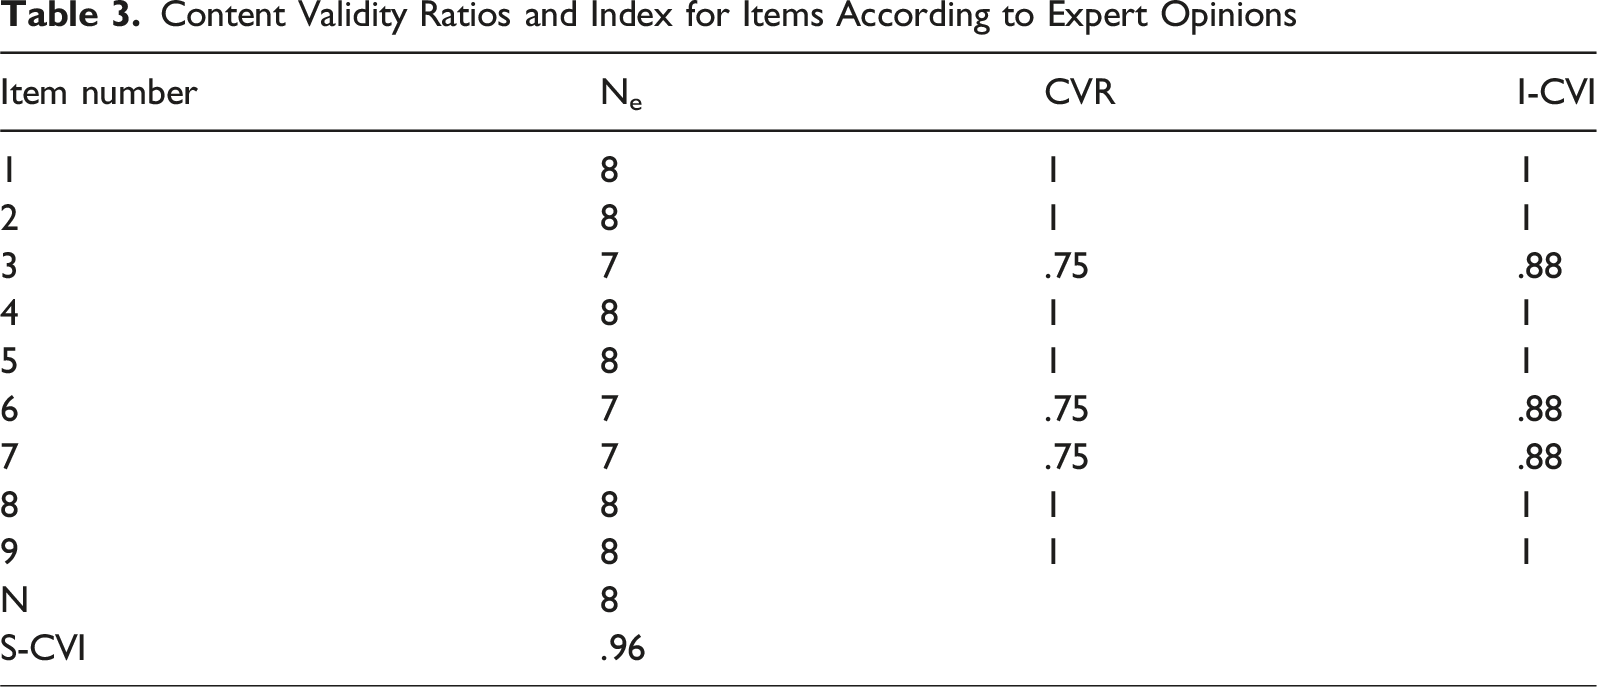
According to Lawshe’s (1975) criteria, a panel of eight experts must reach a minimum content validity ratio (CVR) of .75 for an item to demonstrate acceptable inter-expert agreement. After removing items that did not meet these criteria, the content validity of the final nine-item scale was re-evaluated using the content validity index. Based on expert ratings, the Scale Content Validity Index (S-CVI/Ave) was calculated as .96. Because this value is well above the recommended threshold of .75, the results confirm that the final set of items demonstrates strong content validity.
Findings on the Construct Validity of the PSCP Social Presence Scale
The second research question asked whether the PSCP Social Presence Scale demonstrates strong construct validity. Confirmatory factor analysis (CFA) was conducted in Mplus 8.1 with 329 participants to test the hypothesized two-factor nine-item model. The resulting measurement model is shown in Figure 2. CFA results for the PSCP Social Presence Scale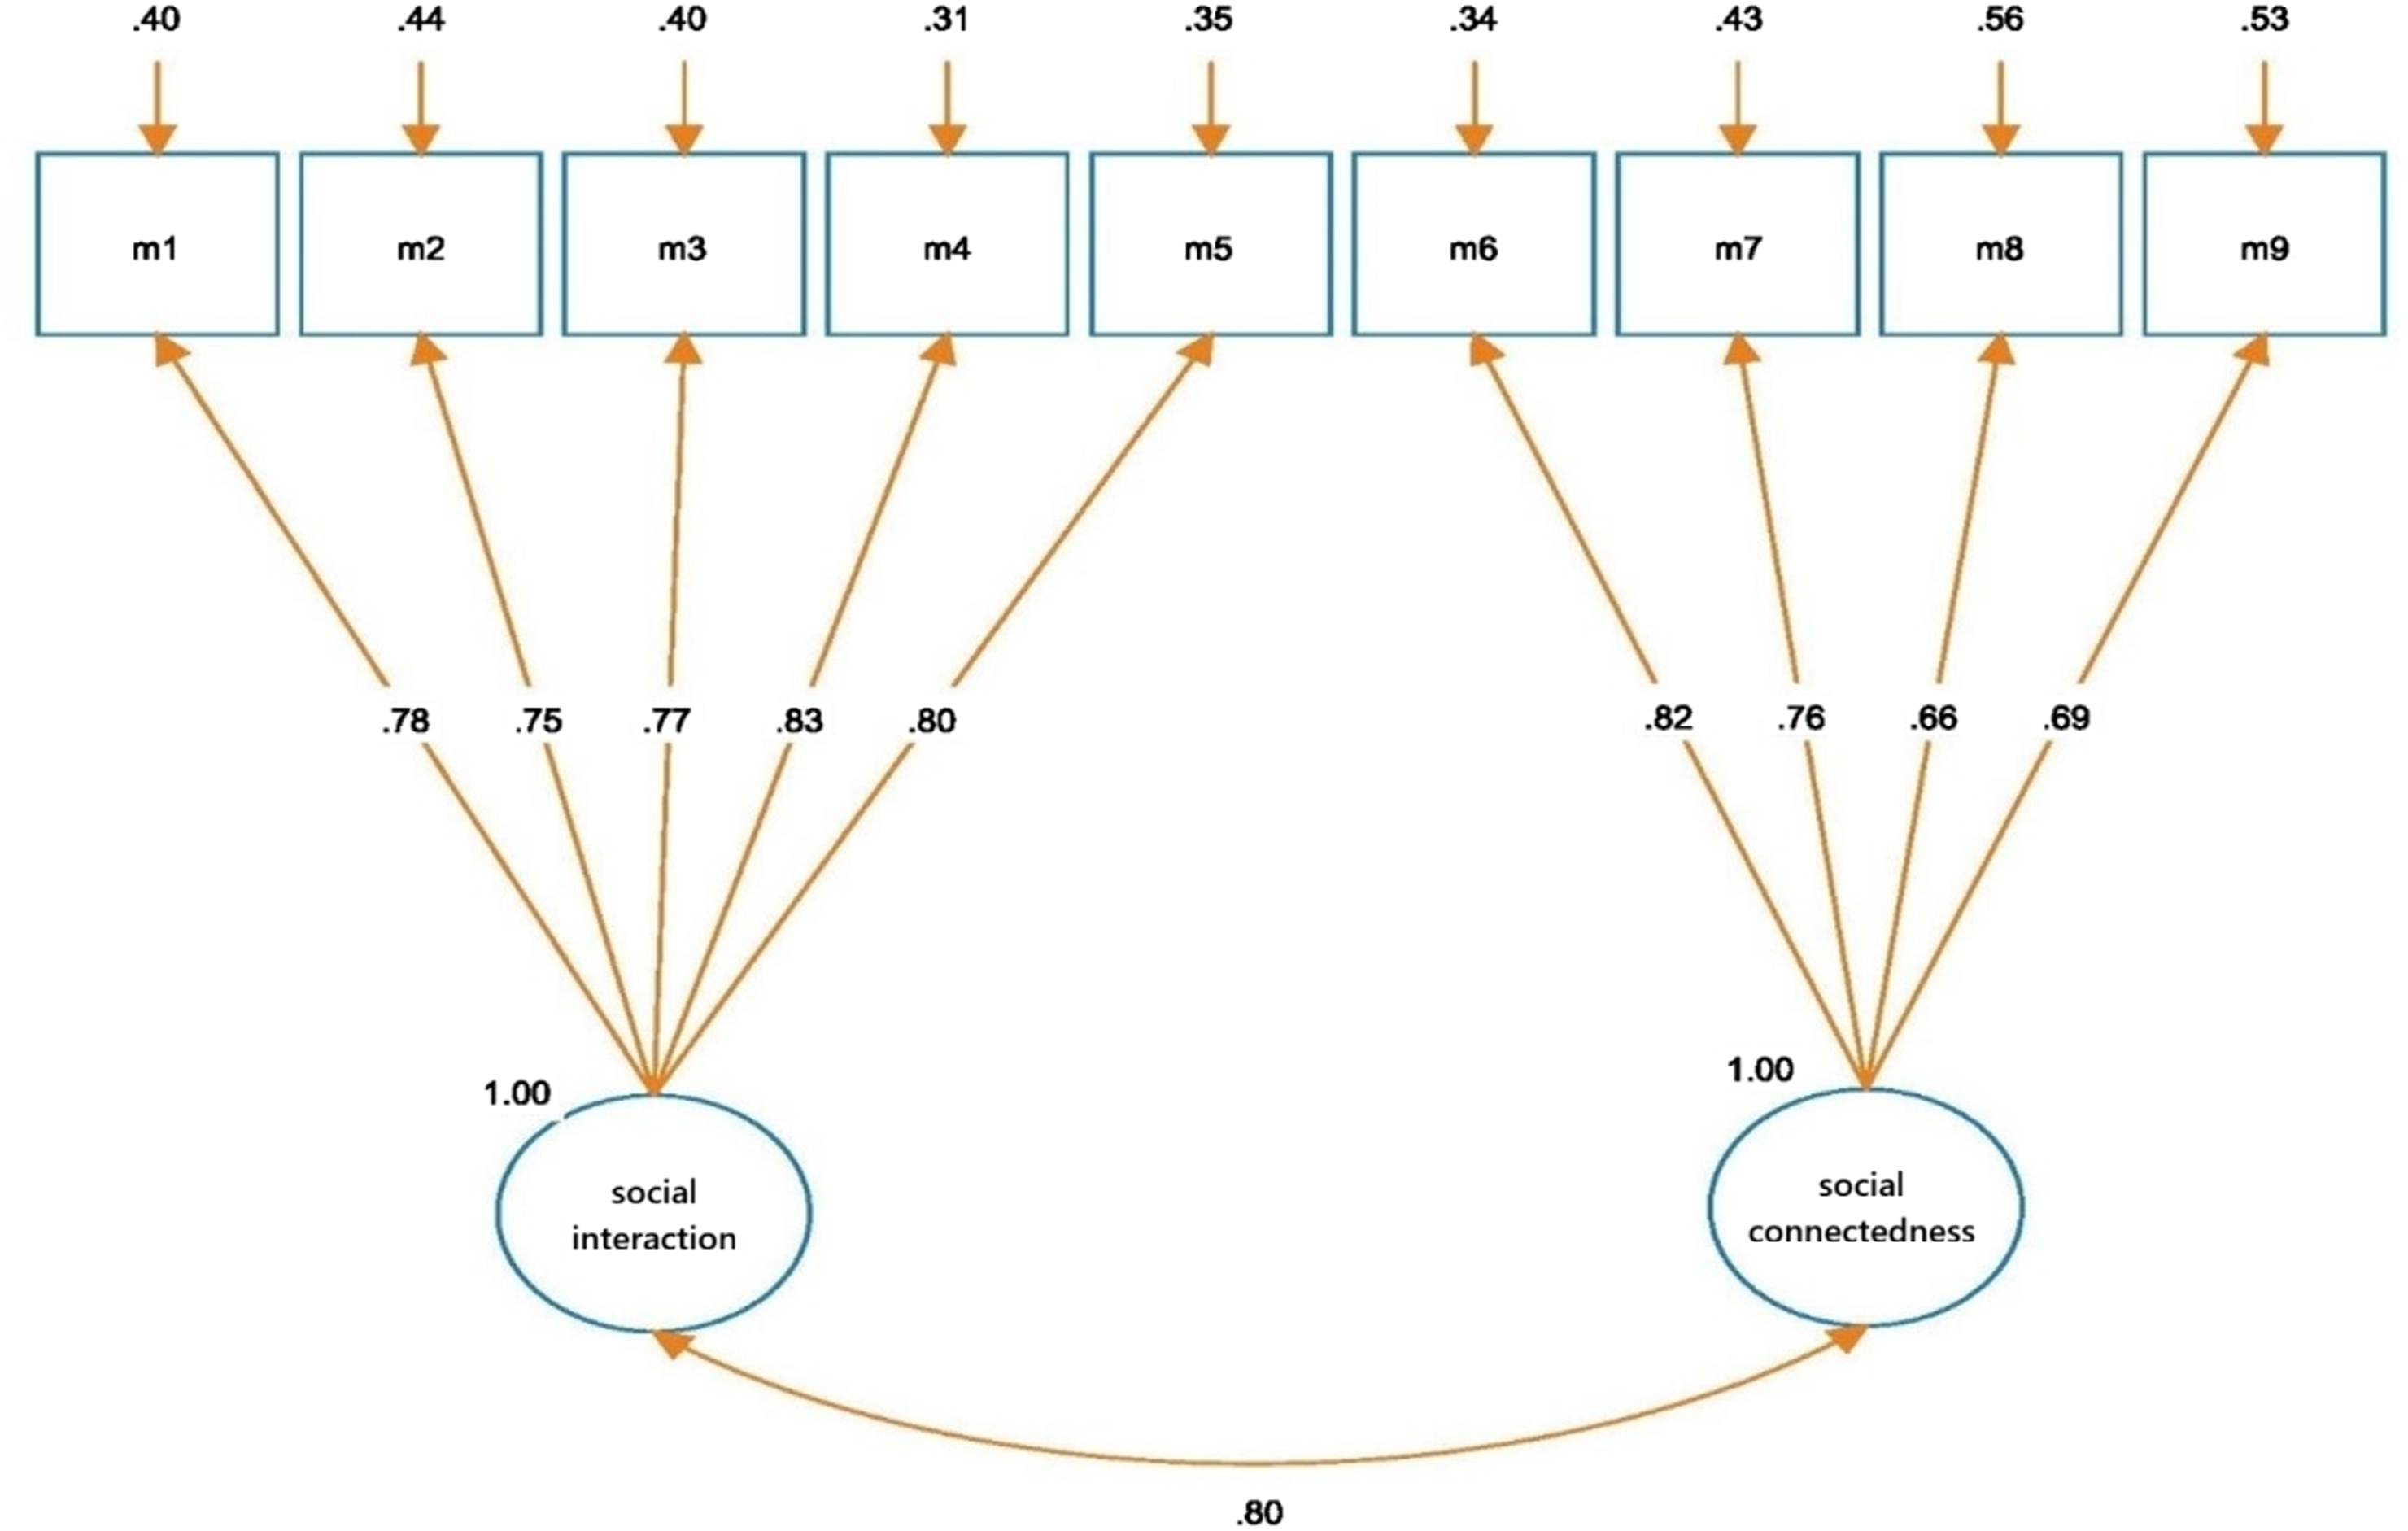
As Figure 2 shows, the model consists of two correlated latent dimensions—Social Interaction and Social Connectedness. Standardized factor loadings for Social Interaction items ranged from .75 to .83, whereas loadings for Social Connectedness items ranged from .66 to .82. All loadings exceeded the recommended minimum of .30, indicating that each item meaningfully reflects its respective latent construct. The latent factor correlation was .80, indicating a strong association between the two components of social presences. This association is theoretically expected because social interaction captures what students do in the classroom, whereas social connectedness reflects how those interactions gradually shape students’ feelings of belonging. While conceptually distinct, the two constructs are closely linked, as students’ sense of connectedness typically develops through ongoing interaction with peers.
Model fit indices further supported for the adequacy of the proposed structure. The ratio of chi-square to degrees of freedom (χ2/df = 2.3) fell within the acceptable range. The RMSEA (.06) also indicated acceptable fit, while the SRMR (.03) reflected good absolute fit. In addition, the incremental fit indices—CFI (.98) and TLI (.97)—exceeded conventional criteria for good model fit. When compared with the recommended cut-offs proposed by Schermelleh-Engel et al. (2003), these fit indices indicate that the two-factor model provides an adequate to well-fitting representation of the data, offering strong evidence for the construct validity of the PSCP Social Presence Scale.
Findings on the Convergent Validity of the PSCP Social Presence Scale
Convergent Validity Results for the PSCP Social Presence Scale Factors
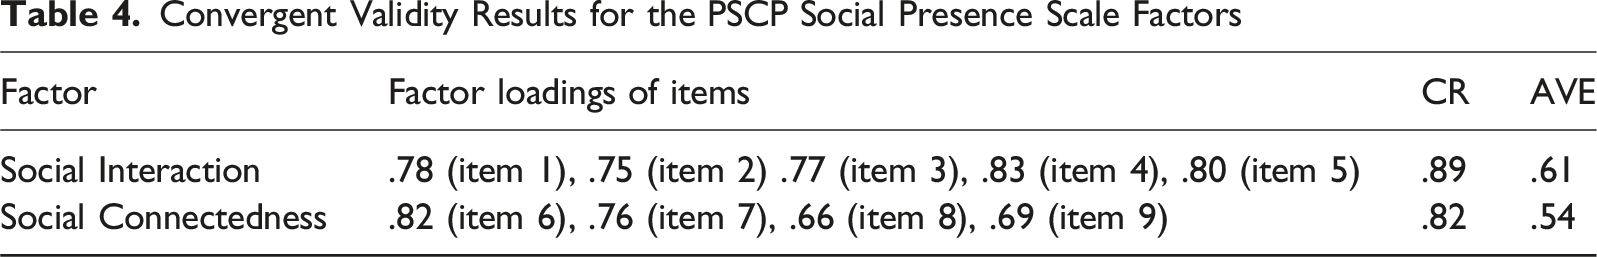
As Table 4 illustrates, both factors exceeded the recommended thresholds of CR ≥.70 and AVE ≥.50 (Hair et al., 2013), indicating that items within each factor share sufficient common variance. Thus, convergent validity for the scale is supported.
Findings on the Discriminant Validity of the PSCP Social Presence Scale
Factor and Cross-Loadings for the PSCP Social Presence Scale
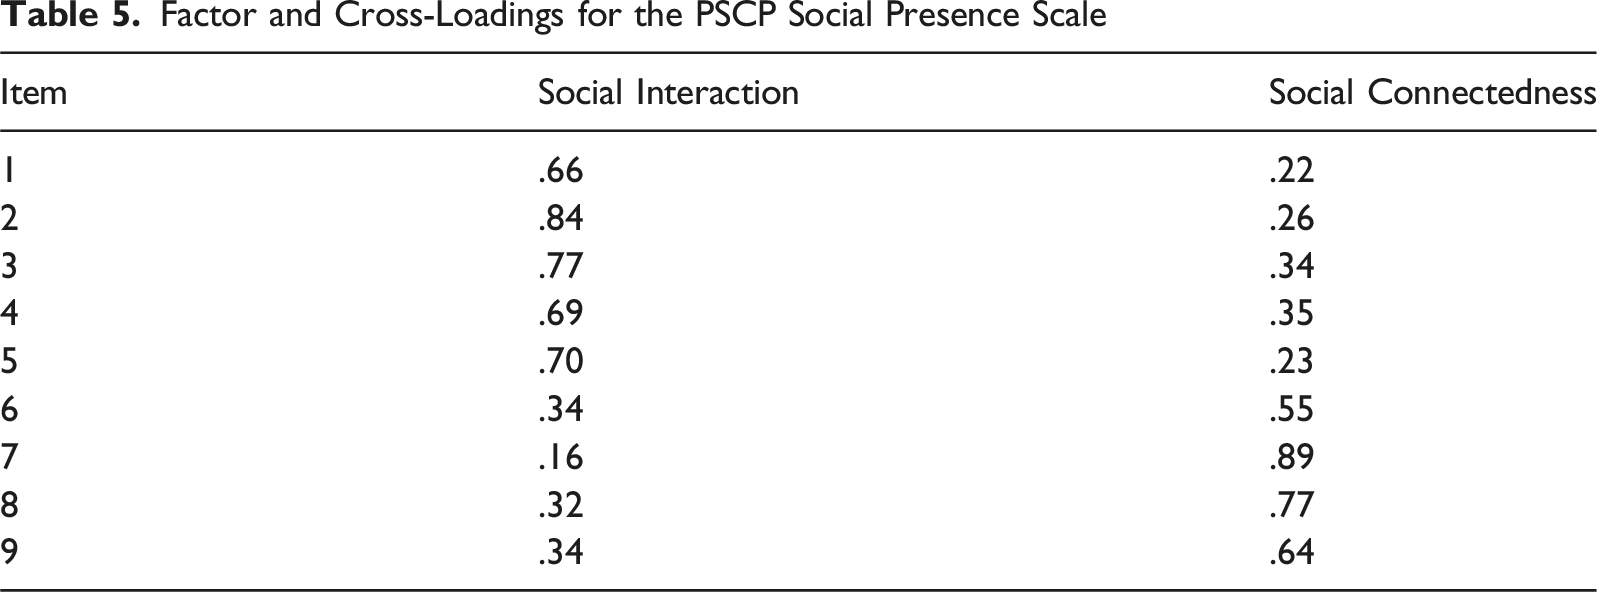
As shown in Table 5, items associated with the Social Interaction factor demonstrated primary loadings ranging from .66 to .84, while cross-loadings on the Social Connectedness factor remained notably lower, ranging from .22 to .35. This indicates that each Social Interaction item aligns more strongly with its intended factor than with the alternative factor.
A similar pattern was observed for the Social Connectedness factor. Primary loadings ranged from .55 to .89, whereas cross-loadings on the Social Interaction factor were substantially smaller, ranging from .16 to .34. In all cases, the difference between an item’s primary loading and its cross-loading exceeded the commonly accepted threshold of .10, which is considered evidence of discriminant validity (Hair et al., 2013).
Taken together, these results indicate that the two factors—Social Interaction and Social Connectedness—are empirically distinguishable. Although related, they capture different dimensions of students’ social experiences in the classroom, thereby supporting the discriminant validity of the PSCP Social Presence Scale.
Findings on the Item Discrimination Analysis of the PSCP Social Presence Scale
Item Characteristics of the PSCP Social Presence Scale
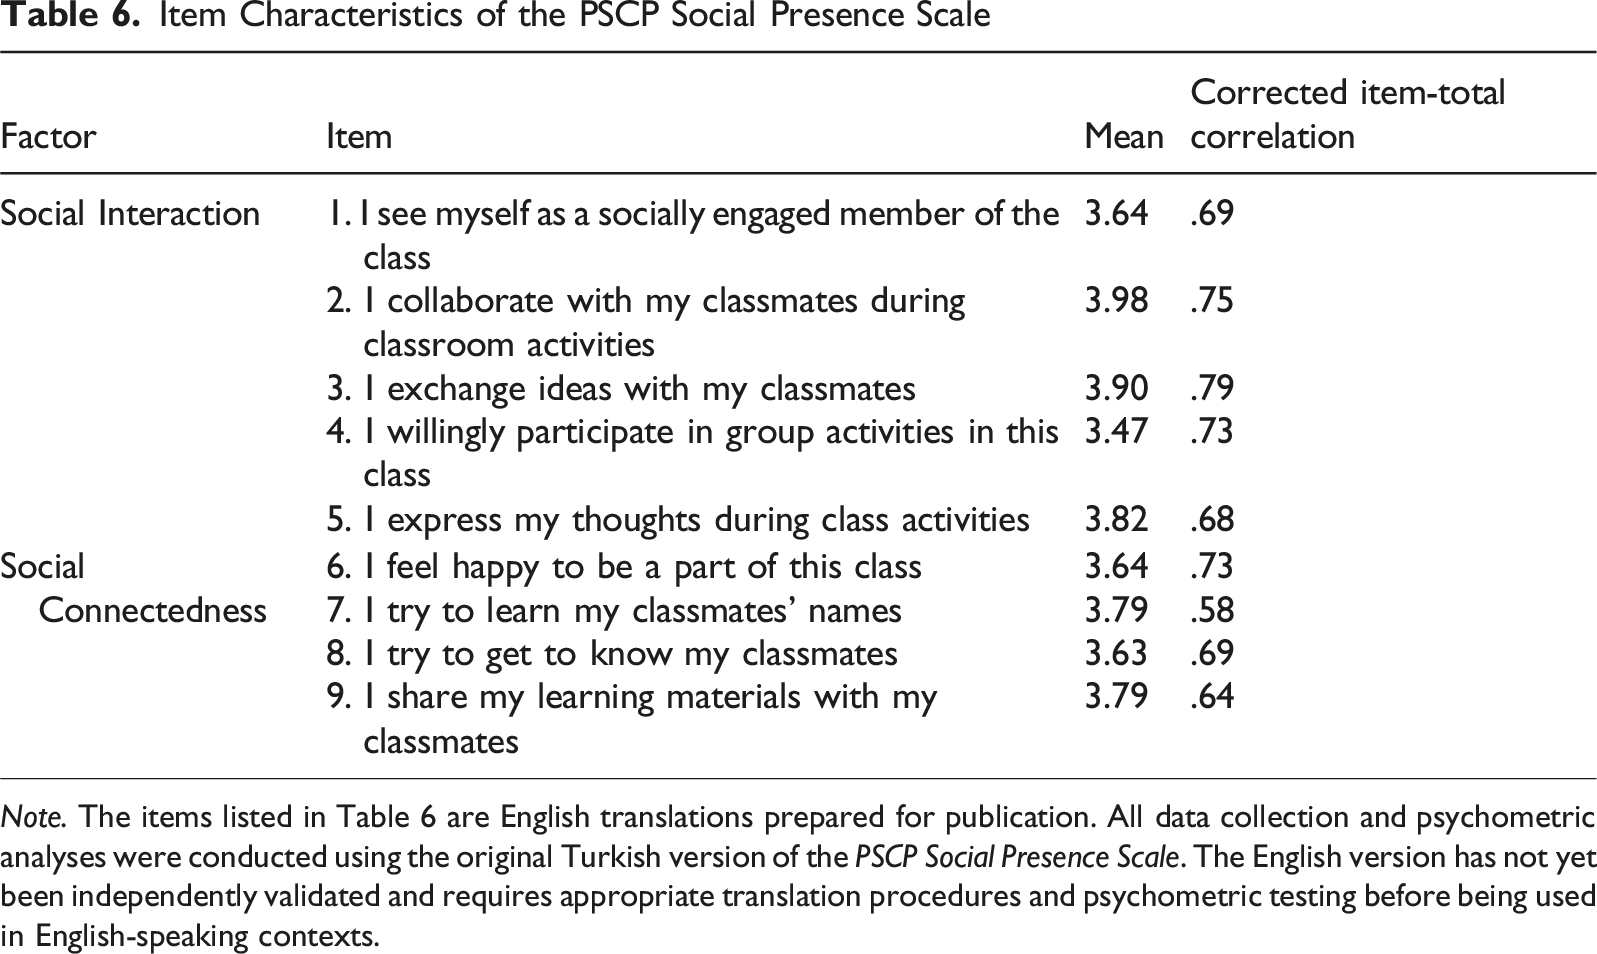
Note. The items listed in Table 6 are English translations prepared for publication. All data collection and psychometric analyses were conducted using the original Turkish version of the PSCP Social Presence Scale. The English version has not yet been independently validated and requires appropriate translation procedures and psychometric testing before being used in English-speaking contexts.
Based on corrected item–total correlations (criterion ≥.30), all items demonstrated adequate discrimination. As noted by Taber (2018), correlations above .30 indicate that an item meaningfully reflects the construct measured by the full scale. In this study, each item exceeded this threshold, suggesting that the PSCP Social Presence Scale effectively differentiates among individuals with varying levels of perceived social presence.
Item discrimination was further evaluated by comparing responses from the upper 27% (n = 89) and lower 27% (n = 89) of the distribution. Independent samples t-tests showed statistically significant mean differences for all items (p < .001), indicating that students with higher social presence scores consistently endorsed each item more strongly than those with lower scores.
These findings demonstrate that all nine items of the PSCP Social Presence Scale exhibit satisfactory discrimination, providing strong support for their retention in the final instrument.
Findings on the Internal Consistency Reliability of the PSCP Social Presence Scale
To examine whether the PSCP Social Presence Scale demonstrates strong internal consistency, reliability coefficients were computed for each subscale and for the full instrument. Cronbach’s alpha for the Social Interaction factor was .90, and the Social Connectedness factor demonstrated an alpha of .85. The reliability coefficient for the overall nine-item scale was .91.
All coefficients exceed the widely accepted benchmark of α ≥ .70 for adequate internal consistency (DeVellis, 2003; Taber, 2018), indicating that the items within each factor function cohesively and that the overall scale provides a stable and reliable assessment of students’ perceived social presence. These results offer strong evidence that the PSCP Social Presence Scale demonstrates sound internal consistency reliability across both factors and the total scale.
Findings on the Criterion-Related Validity of the PSCP Social Presence Scale
To address the final research question—whether the PSCP Social Presence Scale demonstrates criterion-related validity—the relationship between social presence and cognitive engagement was examined. Cognitive engagement was selected as an external criterion because it represents a theoretically relevant learning-related construct that is conceptually distinct from social presence.
Using latent variable modeling, the effect of social presence on cognitive engagement was tested independently. Cognitive engagement was measured using the PSCP Cognitive Engagement Scale (Özek & Fer, 2025), which assesses students’ cognitive attention and cognitive effort in classroom learning contexts. The scale consists of nine items rated on a Likert-type scale and demonstrated satisfactory internal consistency reliability in the present sample (Cronbach’s α = .88).
Social presence was modeled as a latent construct indicated by the dimensions of social interaction and social connectedness, while cognitive engagement was modeled as a latent construct indicated by cognitive attention and cognitive effort. Results indicated a positive and statistically significant effect of social presence on cognitive engagement (β = .17, SE = .08, p = .034). Model fit indices suggested an acceptable fit to the data (RMSEA = .05, CFI = .96, TLI = .95, SRMR = .04). These findings indicate that higher levels of social presence were associated with higher levels of cognitive engagement.
These findings provide evidence of criterion-related validity for the PSCP Social Presence Scale by showing that it is meaningfully related to a learning-relevant external construct. This relationship highlights the practical value of the scale and supports the internal validity evidence reported earlier.
Discussion
The present study developed and validated the PSCP Social Presence Scale as a psychometrically sound measure of students’ social presence across learning contexts. Overall, the findings provide consistent evidence that the scale reliably assesses students’ experiences of social interaction and connectedness in classroom settings.
Evidence for content validity was established through expert review. Eight specialists evaluated the initial item pool and rated the draft items highly, resulting in strong item- and scale-level content validity indices. Following psychometric analyses and item refinement, the final nine-item scale demonstrated high expert agreement regarding item relevance, indicating that the retained items were essential indicators of social presence.
Construct validity was supported through a combination of exploratory and confirmatory factor analytic procedures. The exploratory analyses identified a two-factor nine-item structure, which was corroborated by both Velicer’s MAP test and parallel analysis. Confirmatory factor analysis conducted with an independent sample further supported this structure and demonstrated good model fit according to established criteria. Together, these results indicate that social presence is adequately represented by two related but distinct dimensions—Social Interaction and Social Connectedness.
Additional evidence for construct validity was provided through convergent and discriminant validity analyses. Substantial factor loadings, acceptable composite reliability values, and AVE estimates exceeding recommended thresholds indicated that each factor explained a sufficient proportion of variance in its indicators. At the same time, discriminant validity was supported by consistently stronger primary loadings than cross-loadings across all items. Although the latent correlation between Social Interaction and Social Connectedness was high, this association is theoretically expected rather than problematic. In educational contexts, social interaction reflects students’ observable social behaviors in the classroom (Hurst et al., 2013), whereas social connectedness reflects their sense of belonging to the learning community (Bower et al., 2015; Lee & Robbins, 2000). Students may therefore participate actively without necessarily feeling connected, or feel connected despite limited overt interaction, highlighting the conceptual distinction between these closely related dimensions.
The scale also demonstrated strong item discrimination and internal consistency. Items consistently distinguished between students with higher and lower levels of perceived social presence, indicating sensitivity to individual differences across the response range. Reliability estimates for both subscales and the overall scale exceeded widely accepted benchmarks and were comparable to, or higher than, those reported for established social presence measures, further supporting the coherence of the instrument.
Besides its internal structure, the PSCP Social Presence Scale also demonstrated criterion-related validity through its association with cognitive engagement. Social presence was positively and significantly related to cognitive engagement, a learning-relevant construct that is theoretically aligned with, yet distinct from, social presence. This pattern is consistent with prior research showing that social presence is closely linked to how students engage cognitively (e.g., Dunmoye et al., 2024) and suggests that students who perceive higher levels of social presence tend to invest greater cognitive effort in classroom learning. These findings suggest a meaningful relationship with an external construct central to learning.
Despite these strengths, several limitations should be acknowledged. The evidence for criterion-related validity in the present study was limited to a single learning-related outcome. As a result, the external validation reflects predictive criterion-related validity rather than a comprehensive examination of the scale’s associations with a broader range of educational or psychological outcomes. Future research should therefore examine the PSCP Social Presence Scale in relation to additional criteria, such as academic performance or well-being, and across a wider range of instructional contexts and learner populations.
Taken together, the findings indicate that the PSCP Social Presence Scale is a conceptually grounded and empirically well-supported instrument for assessing students’ social presence across diverse learning environments. Beyond its psychometric contributions, the scale also has practical implications. Instructors may use it to monitor classroom climate, identify barriers to engagement, and evaluate interventions aimed at strengthening collaboration and sense of community, while institutions may incorporate it into broader assessments of learning environments as instructional models continue to evolve.
Overall, the PSCP Social Presence Scale emerges from this study as a valid and reliable measure of students’ social presence. Evidence from multiple validity and reliability analyses suggests that the scale is suitable for use in research and instructional contexts examining social presence in learning environments.
Footnotes
Funding
The authors received no financial support for the research, authorship, and/or publication of this article.
Declaration of Conflicting Interests
The authors declared no potential conflicts of interest with respect to the research, authorship, and/or publication of this article.