
Abstract
This study examined the psychometric properties of the Positive and Negative Affect Schedule for Children-Short Form (PANAS-C-SF) in a diverse sample of 15-year-olds in the United States [N = 4382]. Multiple measurement models, including a one-factor model, two-factor orthogonal and oblique models, a three-factor model (PA, Fear, and Distress), and a bifactor model, were tested. The results supported a three-factor structure, with distinct factors for PA, Fear, and Distress. The PANAS-C-SF scores evidenced good internal consistency reliability. Measurement invariance analyses indicated that the three-factor structure was invariant across gender and racial-ethnic groups, suggesting the generalizability of the PANAS-C-SF across diverse populations. Furthermore, the three factors demonstrated criterion validity, with PA positively associated with life satisfaction and meaning in life, and Distress negatively associated with these outcomes. These findings support the psychometric properties of the PANAS-C-SF, highlighting its practical utility in assessing affect across diverse adolescent population.
Introduction
The Positive and Negative Affect Schedule (PANAS, Watson et al., 1988) has been a valuable tool for understanding positive affect (PA) and negative affect (NA) and their impact on health and well-being across various adult populations. Recognizing the need for precise measurement of PA and NA in younger populations, researchers have devised a child-friendly adaptation of the PANAS, called the Positive and Negative Affect Scale for Children (PANAS-C, Laurent et al., 1999), along with a shortened version (PANAS-C-Short Form [PANAS-C-SF], Ebesutani et al., 2012) designed specifically to efficiently assess affect in children and adolescents. Studies involving these variations have consistently shown satisfactory internal consistency, as well as convergent and discriminant validity of PANAS scores, regardless of the specific version being utilized.
However, there is an ongoing debate surrounding the factor structure of the PANAS particularly for the shorter version of the PANAS-C. Moreover, it remains unclear how the psychometric properties of PANAS-C-SF are consistent across various demographic groups such as gender and race. This study aims to address these gaps by examining the factor structure and measurement invariance of the PANAS-C-SF in a sample of adolescents from diverse cultural backgrounds.
Regarding the factor structure of PANAS, initial exploratory factor analyses (EFA) identified two largely uncorrelated constructs of PA and NA in the PANAS (Watson et al., 1988). However, subsequent EFA and confirmatory factor analysis (CFA) studies have provided mixed evidence regarding the underlying structure of the 20-item PANAS. Some studies have supported the two-factor structure of PANAS, consistent with the orthogonal two-factor model, indicating that PA and NA are uncorrelated constructs (e.g., Heubeck & Wilkinson, 2019). In contrast, other researchers have found evidence for an oblique two-factor model, suggesting that PA and NA are distinct but correlated factors (e.g., Crawford & Henry, 2004; Merz et al., 2013). Yet, some other studies have provided evidence for more complex factor structures, including a three-factor model in which NA is further split into Fear and Distress (e.g., Allan et al., 2015; Gaudreau et al., 2006) and a bifactor model in which a general factor and two traditional PA and NA factors were examined (Leue & Beauducel, 2011; Seib-Pfeifer et al., 2017).
Studies examining the factor structure of both PANAS-C and its shorter variant, PANAS-C-SF, have produced diverse and inconsistent findings, mirroring those of the adult version. Regarding PANAS-C, some studies employing EFA have replicated the orthogonal two-factor structure observed in adults, indicating the presence of distinct PA and NA factors (e.g., Ciucci et al., 2017; Stevanovic et al., 2013). These findings imply that PA and NA can be conceptually and empirically differentiated among young individuals. However, akin to studies conducted with adults, while some studies utilizing CFA have found evidence for a correlated two factor model of PANAS-C (Ciucci et al., 2017; Ebesutani et al., 2011), others could not replicate such structure (e.g., Wróbel et al., 2019). Moreover, a study supported a three-factor model, akin to the one proposed for adults, encompassing PA, Fear, and Distress (Ebesutani et al., 2011). This model recognizes the significance of distinguishing specific components of NA in children’s emotional experiences.
The available evidence on the psychometric properties of the PANAS-C-SF is currently limited and inconsistent, particularly regarding its underlying factor structure. Some studies have indicated support for a correlated two-factor structure of the PANAS-C-SF, consistent with the original PANAS-C and adult PANAS versions (Sanmartín et al., 2018; Wróbel et al., 2019). These findings suggest that the shorter version retains the ability to capture separate dimensions of affect, with distinct but somewhat related PA and NA factors in children and adolescents. However, other researchers have found evidence for a more complex factor structure. Eadeh and colleagues (Eadeh et al., 2020) examined the factor structure of the PANAS-C-SF in adolescents with and without ADHD using a diary study. Among several alternative factor models, they found that a 3-factor within and a 3-factor between model (including PA, Fear, and Distress) provided the best fit to the data suggesting the multidimensionality of NA in youth.
The inconsistencies observed in these studies underscore the need for further research to establish a clearer understanding the factor structure of PANAS-C-SF. Moreover, given the lack cross-cultural research on PANAS-C-SF there is a crucial need to examine the consistency of its factor structure across different demographic groups, including gender and race (Merz et al., 2013; Sanmartín et al., 2018; Villodas et al., 2011, Wróbel et al., 2019).
The Present Study
Given the inconsistent findings regarding the dimensionality of the PANAS-C-SF, this study had several aims. Firstly, the primary objective was to examine the factor structure of the PANAS-C-SF in a diverse sample of US adolescents. To achieve this, we tested multiple a priori measurement models identified in the existing literature. These models included a one-factor model, a two-factor orthogonal model, a two-factor oblique model, a three-factor model [PA, Fear, and Distress], and a bifactor model. By exploring these different models, we aimed to gain insights into the most appropriate factor structure for the PANAS-C-SF in the studied population.
The second aim of the study was to investigate the measurement invariance of the PANAS-C-SF across gender and racial-ethnic groups. Despite the widespread use of the PANAS-C-SF in mental health research (e.g., Dodd et al., 2022), there has been a scarcity of literature examining its measurement invariance across diverse demographic groups. However, some evidence of gender measurement invariance for a two-factor model of the PANAS-C-SF has been found in two previous studies (Sanmartín et al., 2018; Wróbel et al., 2019). Addressing this aim would provide valuable insights into the generalizability and comparability of PANAS-C-SF scores across different gender and racial-ethnic groups.
The third aim of the study was to investigate criterion-related evidence for the construct validity of the PANAS-C-SF scores. Specifically, building on prior research (Busseri, 2018; Jovanović & Joshanloo, 2022; King et al., 2006) we assessed the relationship between PANAS-C-SF scores and two important psychological constructs: life satisfaction and meaning in life.
Methods
Data and Sample
The current study utilized the 2018 Program for International Student Assessment (PISA) US data (Organization for Economic Co-Operation and Development, OECD, 2019).
The PISA 2018 assessment covered, among other, subjects such as reading, mathematics, science, as well as the social and emotional well-being. The US data consisted of 4838 fifteen-year-old students, of whom 2376 (49.1%) were female and 2462 (50.9%) were male. The sample reflected the racial-ethnic makeup of the US population and included students from various groups: White (43%), Black (16%), Hispanic (25%), Asian (6%), multiracial (8%), and other (1%). For the current study, participants with missing demographic data were excluded, ensuring complete information. Students who identified as “other” race were excluded due to their limited number, and participants who did not respond to any PANAS items were also removed. After these procedures, the final analytic sample consisted of 4382 students.
Measures
Positive and Negative Affect Schedule for Children-Short Form (PANAS-C-SF)
The short version of the PANAS-C was employed by PISA 2018 to evaluate PA and NA. The scale comprised nine items, which were rated on a 4-point Likert scale ranging from 1 (never) to 4 (always). The original scale consists of two subscales, each consisting of five items with high internal consistency: PA (α = .86; joyful, lively, happy, cheerful, and proud) and NA (α = .82; miserable, mad, scared, afraid, and sad). However, the “mad” item was not included in the PISA 2018 assessment.
Life Satisfaction
Life satisfaction was measured using a single item asking students “Overall, how satisfied are you with your life as a whole these days?” It has a response scale from “0” indicating “not at all satisfied” to “10” indicating “completely satisfied.”
Meaning in Life
Meaning in life was assessed using three items rated on a 4-point Likert scale ranging from (“strongly disagree” to “strongly agree”, α = .89). An example item: “My life has clear meaning or purpose.”
Data Analysis
All statistical analyses were conducted using R software (R Core Team, 2022). We evaluated the alternative factor models using CFA as implemented in lavaan package (Rosseel, 2012) using the robust maximum likelihood estimator (MLR). A multigroup confirmatory factor analysis (MGCFA) was used to investigate whether the final factor model is comparable across gender and racial-ethnic groups (Putnick & Bornstein, 2016). We evaluated three increasingly restrictive nested models. First, we examined configural invariance (analysis of equal form) and then we evaluated metric invariance in which equality of factor loadings was constrained. This was followed by scalar invariance in which the loadings and intercepts were constrained to equality (Putnick & Bornstein, 2016). To establish criterion validity, we estimated two structural equation models. The first model assessed how the latent factors of the PANAS-C-SF in the final model were associated with life satisfaction and the second model estimated how the variables are associated with meaning in life.
To evaluate the fit of the CFA and SEM models, we used several goodness-of-fit indices including the comparative fit index (CFI), the Tucker–Lewis Index (TLI), and the root mean square error of approximation (RMSEA). For CFI and TLI values of .90 and .95 defined as “acceptable fit” and “good fit,” respectively, and for RMSEA, values <.08 and .06 defined as “acceptable fit” and “good fit,” respectively (Hu & Bentler, 1999). In the MGCFA models, to compare the fit of the constrained model relative to the comparison model, we used ΔCFI and ΔRMSEA. Invariance was considered tenable when ΔCFI <.01 and ΔRMSEA <.015 (Chen, 2007).
Results
Means, Standard Deviations, and Correlations.
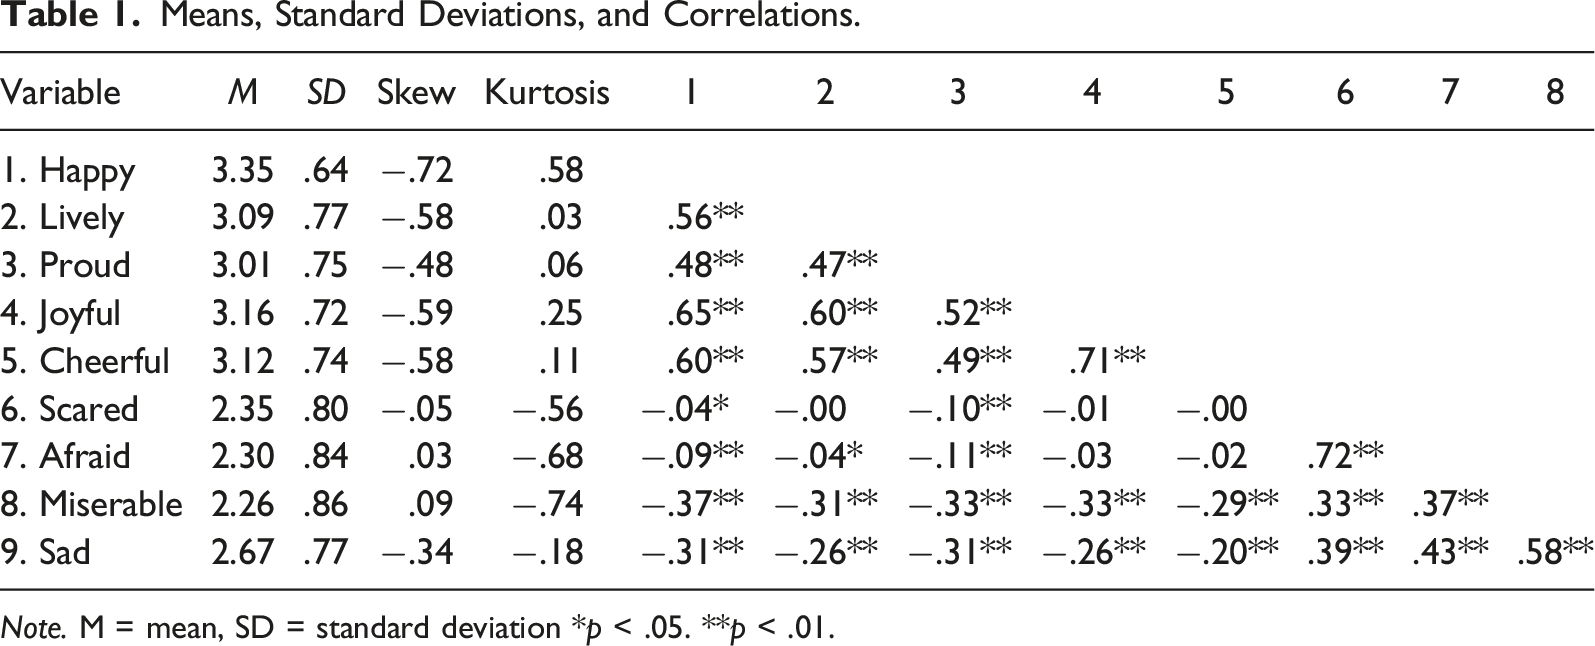
Note. M = mean, SD = standard deviation *p < .05. **p < .01.
Summary of Goodness of Fit Statistics for the CFA Models and the Measurement Invariance Tests.
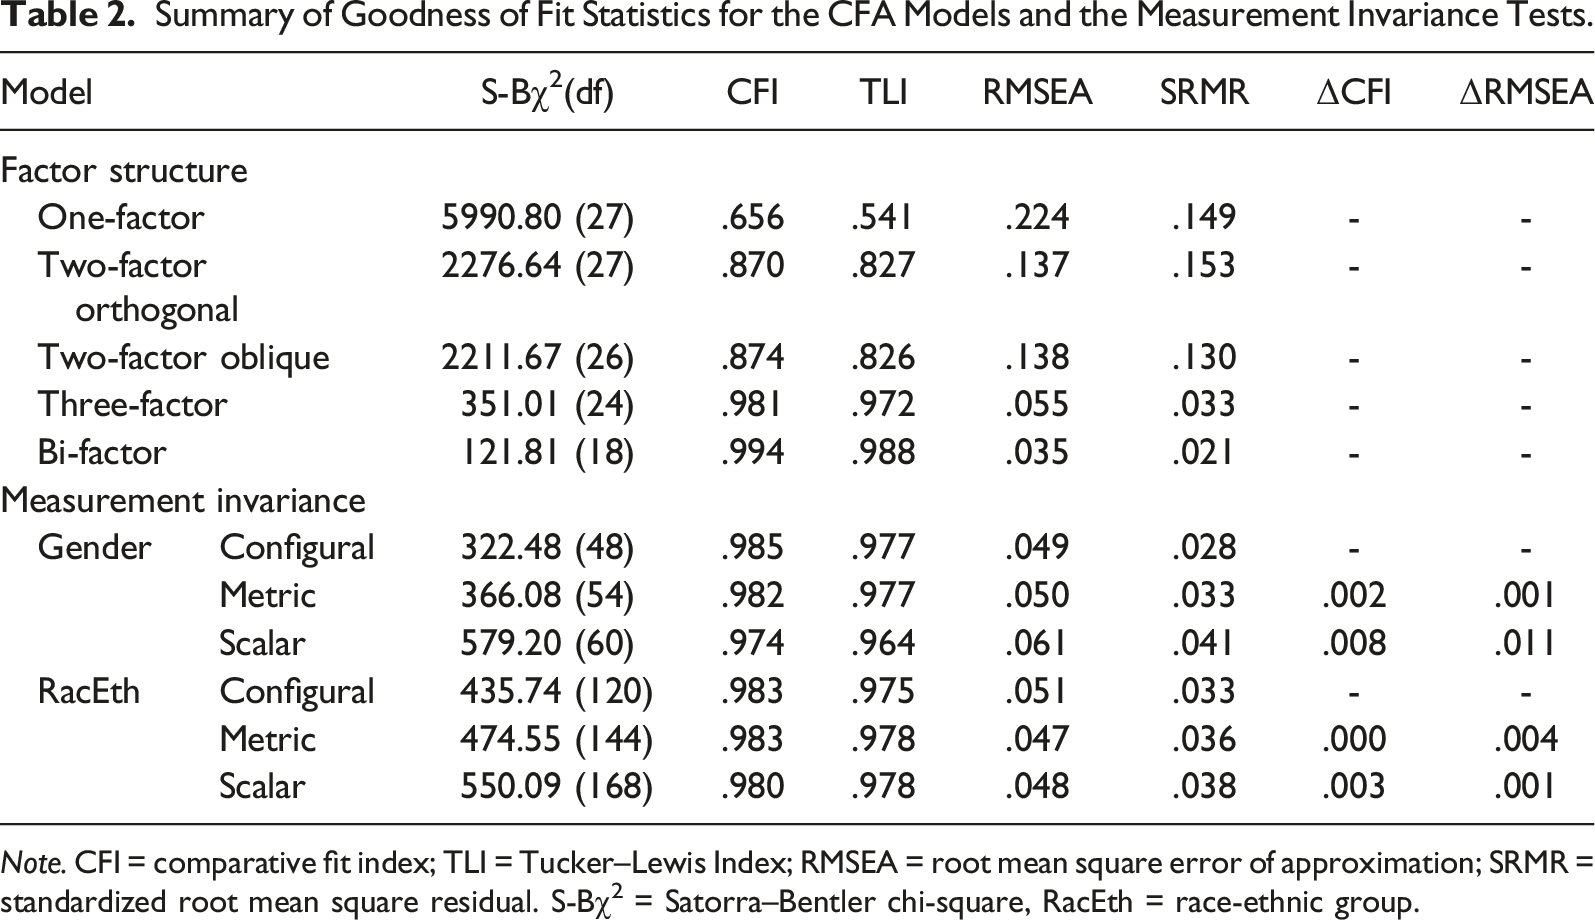
Note. CFI = comparative fit index; TLI = Tucker–Lewis Index; RMSEA = root mean square error of approximation; SRMR = standardized root mean square residual. S-Bχ2 = Satorra–Bentler chi-square, RacEth = race-ethnic group.
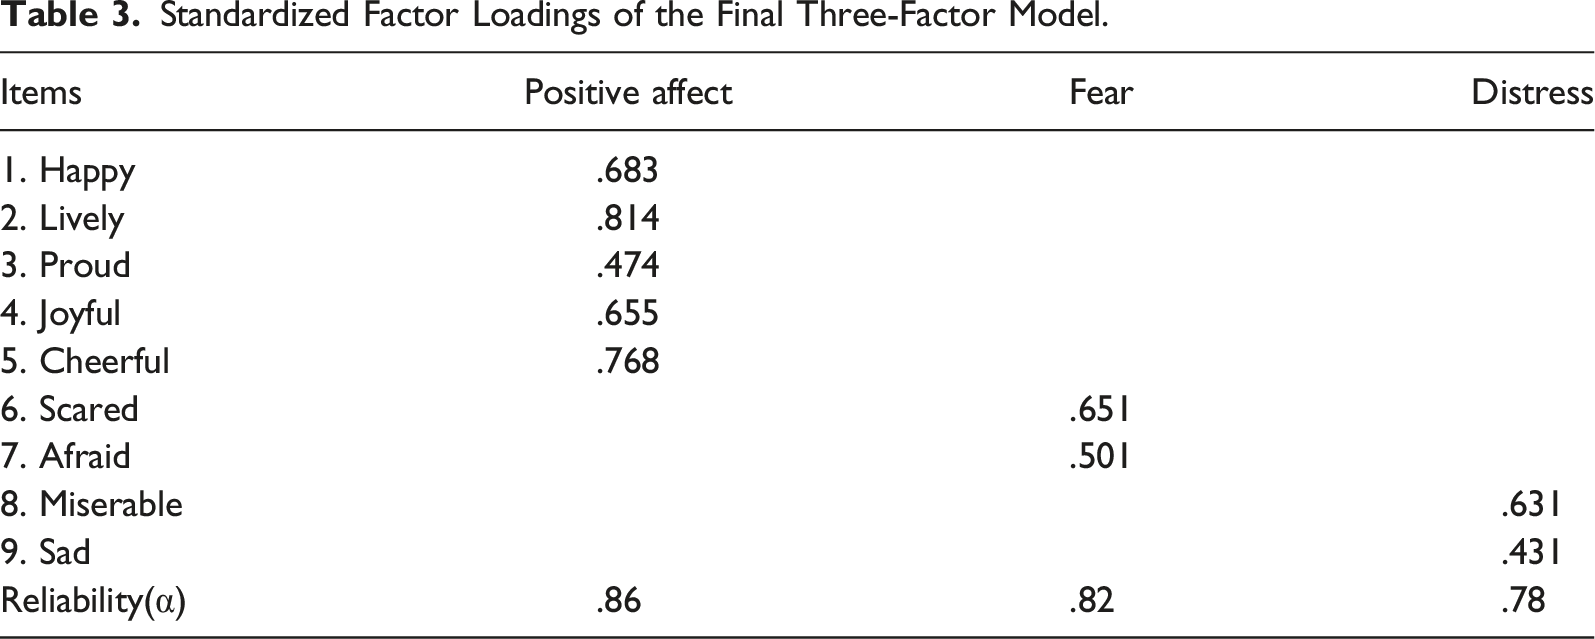
Standardized Factor Loadings of the Final Three-Factor Model.
The second aim of the study was to assess the stability of the best fitting model across gender and racial-ethnic groups using MGCFA. Fit statistics for the invariance models are presented in Table 2. To examine cross-gender configural invariance, the three-factor model was simultaneously tested across gender groups. This model demonstrated a good fit to the data. Subsequently, metric invariance was assessed by constraining the factor loadings across groups. The metric invariance model provided a good fit to the data and did not significantly deviate from the configural model. Additionally, scalar measurement invariance was examined by constraining item intercepts to equality across groups. The scalar invariance model also demonstrated a good fit and did not significantly deviate from the metric invariance model. Similarly, consistent with the gender analysis, the results indicated configural, metric, and scalar invariance across racial-ethnic groups. These consistent invariance findings were observed among Asian, Black, Hispanic, multiracial, and White racial-ethnic groups.
The results provide evidence for measurement invariance of the three-factor PANAS model across gender and racial-ethnic groups. The consistent model fit indices across increasing levels of model constraints support the conclusion of measurement invariance, suggesting that the measurement properties of the PANAS-C-SF remain consistent across different demographic groups.
The third aim of this study was to assess the criterion validity of the best-fitting factor structure of the PANAS-C-SF. Specifically, separate structural equation models were estimated to examine the predictive effects of the three latent factors on two important outcomes: meaning in life and life satisfaction. In the first model, a structural equation model was specified with life satisfaction as the outcome variable, and the latent variables of PA, Fear, and Distress as predictor variables. The model demonstrated a good fit to the data (CFI = .976, TLI = .964, RMSEA = .051). Both Fear (β = −.137, z = 5.910, p < .001) and Distress (β = −.515, z = −16.246, p < .001) were significantly and negatively associated with life satisfaction. Conversely, PA was significantly and positively associated with life satisfaction (β = .376, z = 17.277, p < .001). Moving on to the second model, meaning in life was specified as the outcome variable, with PA, Fear, and Distress as predictor variables. Similar to the previous model, this model also provided a good fit to the data (CFI = .984, TLI = .978, RMSEA = .040). Fear was not significantly associated with meaning in life (β = .040, z = 1.610, p < .001), while Distress showed a negative association with meaning in life (β = −.291, z = −8.501, p < .001). PA was significantly and positively associated with meaning in life (β = .436, z = 18.743, p < .001).
Discussion
This study sought to examine the factor structure, measurement invariance, and criterion validity of the short version of the PANAS-C in a large, racially representative sample of 15-year-olds in the United States. The findings indicated that PANAS is characterized by a three-factor structure comprising of PA, Fear, and Distress. The three-factor structure was invariant across both gender and diverse racial-ethnic groups. Furthermore, the derived factors were subsequently found to exhibit significant associations with pivotal well-being indicators.
An important finding of the current study is the confirmation of a three-factor structure of the PANAS. The results indicate that the affective experience of the current sample is best described by a three-dimensional structure consisting of PA, Fear, and Distress factors. These finding align with previous studies that used the original adult version of PANAS (Allan et al., 2015; Gaudreau et al., 2006; Merz et al., 2013) as well as one recent study that evaluated the dimensionality of PANAS-C-SF among adolescents (Eadeh et al., 2020). Previous studies (Eadeh et al., 2020; Heubeck & Wilkinson, 2019; Merz et al., 2013) found support for a three-factor model but acknowledged that Fear and Distress showed a strong correlation, raising concerns about maintaining separate factors instead of a single general NA factor. However, in the current study, the latent correlation between fear and distress was found to be moderate. This suggests that while they should be treated as distinct factors, they are still interconnected aspects of NA. Most studies have reported support for a two-factor structure of PANAS scores, allowing correlations among indicator residuals (Ciucci et al., 2017; Crawford & Henry, 2004; Merz et al., 2013). Given the controversy surrounding the practice of correlated measurement errors (Hermida, 2015) and the limited practical utility for practitioners (Heubeck & Wilkinson, 2019), the current study did not allow correlated item residuals to improve model fit. Nonetheless, the three factor scores demonstrated good internal consistency reliability.
The second important finding of this study is related to the invariance of the three-factor structure of PANAS scores across diverse male and female adolescents. The study’s results provide compelling evidence that the three-factor model of PANAS, consisting of PA, Fear, and Distress factors, holds true across these diverse groups. Invariance across gender means that the factor structure remains stable and comparable between males and females. This finding implies that the underlying dimensions of affective experiences represented by the scale—positive emotions, fear-related emotions, and distress-related emotions—are similarly applicable and relevant to both males and females during adolescence. Moreover, the study’s findings also establish invariance across racial-ethnic groups (Villodas et al., 2011) suggesting that individuals from different racial and ethnic backgrounds—such as Asian, Black, Hispanic, multiracial, and White—experience and express affect in a manner consistent with the three-factor model of PANAS-C-SF. The confirmation of the three-factor structure’s invariance across gender and racial-ethnic groups is particularly valuable for research and practical applications. The metric invariance results demonstrate that the observed PANAS items are associated with the latent variables (i.e., PA, Fear, and Distress) consistently across both gender and racial-ethnic groups suggesting the equivalence of the instrument across groups. Thus, the relationships between the affective constructs (e.g., PA, Fear, and Distress) and other variables (e.g., well-being) can be meaningfully compared across groups. For example, if a study finds that the relationship between PA and well-being is stronger for one group compared to another, the current results suggest that the difference is genuine and not a result of measurement biases. The results from scalar invariance suggest that researchers and clinicians can make valid comparisons of the means of the latent PANAS variables across these groups. Overall, the results highlight the universal nature of the PANAS and its ability to capture and measure affective experiences consistently, regardless of gender or racial-ethnic background.
The third significant finding of this study strengthens the criterion validity of the three-factor model by examining its predictive power in relation to life satisfaction and meaning in life. The findings provide compelling evidence that the three factors—PA, Fear, and Distress—have distinct associations with these important psychological outcomes. Consistent with previous research on life satisfaction and meaning in life (Busseri, 2018; Jovanović & Joshanloo, 2022; King, et al., 2006), PA demonstrated a positive association with both variables. This suggests that adolescents who experience higher levels of positive emotions are more likely to report greater life satisfaction and a sense of meaning in their lives. In contrast, Fear showed no relationship with meaning in life but a small association with life satisfaction. This indicates that fear-related emotions may not have a significant impact on these outcomes. On the other hand, distress exhibited a substantial negative association with both life satisfaction and meaning in life. This suggests that adolescents experiencing higher levels of distress, characterized by feelings of sadness and misery are more likely to report lower levels of life satisfaction and a reduced sense of meaning in their lives.
These findings highlight the validity of the distinction made in the current study between fear and distress as separate factors within the PANAS-C-SF. The differential associations of these NA factors with the outcomes further emphasize their distinct roles in psychological functioning and well-being (Allan et al., 2015; Clark & Watson, 1991; Eadeh et al., 2020). These results align with previous research, such as the work of Headey and collogues (Headey et al., 1993), who noted the improbability of simultaneously experiencing contentment with life and depression, but the possibility of feeling satisfied while experiencing anxiety.
The present findings should be interpreted in light of several study limitations. First, because our study used a sample of 15-year-old adolescent students, it is unclear whether the pattern of findings can be generalized across all adolescents. Although our study supported the three-factor model of the PANAS-C-SF as a valid measure for the current sample and possibly other adolescents, it is possible that competing two-factor models may be more appropriate in other populations. Future studies could examine the utility of the PANAS-C-SF across diverse age ranges. Second, comparing PANAS-C-SF scores and factor structures across the five major racial groups (Asian, Black, Hispanic, multiracial, and White) fails to capture within-group variability. Therefore, future research could examine the degree to which individual differences such as racial identity, personality attributes or socioeconomic status may influence the psychometric properties and factor structure of the PANAS. Third, the current study may be limited by focusing on trait-like affect, as affect variability plays a significant role in adolescents’ mental health. Future research should evaluate the factor structure and criterion validity of the short version of the PANAS-C-SF using experience sampling and longitudinal designs.
Despite these limitations, the findings provided valuable insights into the psychometric properties of the PANAS-C-SF in a diverse sample of male and female adolescents in the United States. The study demonstrated that the PANAS-C-SF effectively measures three distinct factors: PA, Fear, and Distress. The internal consistency of the scale was high, suggesting that the PANAS-C-SF items within each factor were measuring the intended construct consistently. Moreover, the findings regarding the measurement invariance of the PANAS-C-SF across gender and diverse racial and ethnic backgrounds, highlights the potential generalizability of the PANAS-C-SF and its ability to capture affective experiences across different demographic groups. The findings contribute to the existing literature on the factor structure of the PANAS-C-SF and support its utility as a brief tool for assessing affect in adolescents.
Footnotes
Author Note
An earlier version of this manuscript was presented at the 2022 Annual Convention of the American Psychological Association in Minneapolis, Minnesota.
Declaration of Conflicting Interests
The author(s) declared no potential conflicts of interest with respect to the research, authorship, and/or publication of this article.
Funding
The author(s) received no financial support for the research, authorship, and/or publication of this article.