
Abstract
The current study sought out to advance the Social Self-Efficacy and Social Outcome Expectations scale using multiple approaches to scale development. Data from 583 undergraduate students were used in two scale development approaches: Classic Test Theory (CTT) and Item Response Theory (IRT). Confirmatory factor analysis suggested a 2-factor structure that aligns with the theoretically based domains for SEOES items and supports previously proposed models of this scale from CTT and psychometric analyses. The IRT analysis indicated that the SEOES items have greater measurement precision at measuring lower levels of the latent constructs. Future research directions are provided and practice implications are discussed.
Keywords
Further Validation of the Social Efficacy and Social Outcome Expectations Scale
Bandura’s (1977, 1997) self-efficacy theory is widely researched across various domains, such as social relationships (Smith & Betz, 2000; Wright, Wright et al., 2013), career decision-making (Betz & Taylor, 2001), coping (Chesney et al., 2006), and academics (Robbins et al., 2004) to name just a few. Bandura’s concept of self-efficacy has also been instrumental in guiding theory development (Lent et al., 1994). Bandura (1997) articulated self-efficacy as individuals’ cognitive judgments related to their belief about their skills and abilities in a specific domain. Utilizing this definition, researchers seek out ways to determine how self-efficacy in a domain influences various aspect of individuals’ lives such as their overall life satisfaction (Wright & Perrone, 2010), academic success and persistence (Robbins et al., 2004; Wright, Jenkins-Guarnieri et al., 2013), (Wright, Jenkins-Guarnieri et al., 2013), career success (Spurk & Abele, 2014), and many other areas (Brown & Lent, 2016).
An area of self-efficacy that is of growing interest related to scale development is social self-efficacy (Wright, Wright et al., 2013). Sherer et al. (1982) discussed the importance of measuring self-efficacy and developed the Self-Efficacy Scale (SES) that consisted of two subscales: general self-efficacy and social self-efficacy. Subsequently, Smith and Betz (2000) continued to explore the concept of social self-efficacy and develop the Perceived Social Self-Efficacy scale (PSSE). Both the SES (Sherer et al., 1982) and PSSE (Smith & Betz, 2000) are limited to only examining one of the two theorized domains of self-efficacy, which include self-efficacy expectations and outcome expectations according to Bandura (1977, 1997). Others have published scales examining both self-efficacy and outcome expectations, but in the context of motivation. For example, Pintrich et al. (1991; 1993) developed the Motivated Strategies for Learning Questionnaire (MSLQ) that examines 15 domains, including a motivational subscale that focuses on self-efficacy and performance expectations. Although this comprehensive multi-dimensional scale is related to academic learning and performance for college students, it does not measure aspects of an individual’s cognitive beliefs in their abilities in relationships or their outcome expectations from engaging in relationships.
Responding to this need for a scale based on both areas of Bandura’s Self-Efficacy Theory (Bandura, 1977, 1997) that would allow for a more accurate representation of the constructs (DeVellis, 2012), Wright, Wright et al. (2013) developed the Social Self-Efficacy and Outcome Expectations scale (SEOES) that included both facets of self-efficacy theory. This original scale examines individuals’ perceived confidence in their abilities in social relationships (i.e., social self-efficacy) and the expected outcomes as a result from their behavior in relationships (i.e., outcome expectations; Wright, Wright et al., 2013). The scale has been previously translated and used internationally (e.g., Turkish; Akin & Akkaya, 2015) and it is our hope that a more precise measure of the construct will be beneficial for international scholars and practitioners as they examine social self-efficacy and outcome expectations. The original scale, as well as the aforementioned social self-efficacy scales' measurement precisions were limited due to being developed using Classic Test Theory (CTT) (i.e., exploratory and confirmatory factor analysis) and may be improved using more current scale development techniques, such as Item Response Theory (IRT). Therefore, we decided to further validate the SEOES by implementing both confirmatory factor analysis and IRT techniques. We also followed the recommended practices and approach outlined by Worthington and Whittaker (2006) to ensure the methodological rigor of our factor analyses. We utilized IRT analyses to examine the SEOES in order to determine the effectiveness that the scale’s items have in measuring the full spectrum of the latent variables of social self-efficacy and social outcome expectations; thus, being able to identify individuals that have a higher degree of the constructs, as well as at lower levels of the constructs.
Measurement Approaches
Both exploratory and confirmatory factor analyses are guided by the principles of Classic Test Theory. CTT is based on the premise that a group of items can be combined together to represent an overall latent construct (DeVellis, 2012) that is specific to the measure (Reise et al., 2005), and focuses on the properties of an entire scale (Mallinckrodt et al., 2016). The individuals’ scores are theorized to represent their true score and random error that consist across all items (DeVellis, 2012). This classic test method has dominated the measurement of social and psychological constructs (DeVellis, 2012; Reise et al., 2005). However, there is currently a strong movement to develop scales using methods beyond CTT, such as approaches that implement Item Response Theory (Harvey, 2016).
According to the IRT method, each individual item represents the characteristics of the latent variable, whereas the classic test method assumes that the latent variable affects all items equally (DeVellis, 2012). Using IRT, the relationship between response on a scale item and the underlying latent variable along its continuum is represented by the item-characteristic curve (ICC) (DeVellis, 2012). The slope of the ICC and its location along the continuum reflect how well the item differentiates individuals at different levels of the construct assessed (Harvey, 2016). Specifically, the x-axis indicates the continuum of the latent construct based on a mean of 0 and standard deviation of 1 (θ, Theta), and the y-axis indicates the probability of endorsement (Thomas, 2011). For example, an ICC with robust slope for an item at the lower range of θ (e.g., below 0) would suggest that the item is able to better assess the construct at the lower end of the construct’s continuum. Each individual item’s ICC can be examined in this way. The Category Response Curve (CRC) can also be used when examining the multiple response categories (e.g., Likert responses) for an item by determining the probability of endorsing each response category of that item, and ideally the item’s CRC will have distinct peaks (Nguyen et al., 2014).
The ability to analyze item-level parameters and each item’s functioning along the spectrum of a latent construct being assessed provides additional information beyond the classic test theory approaches, such as confirmatory factor analysis. Another useful concept in IRT is the item information function (IIF). The IIF indicates the degree of measurement precision or amount of information provided across the trait spectrum of the construct (Mallinckrodt et al., 2016). Increases in IIF are similar to higher degrees of reliability and lower levels of standard error of measurement from a CTT perspective (Thomas, 2011). Therefore, a collection of items measuring a similar area of the latent construct will help increase precision of this aspect of the construct (Mallinckrodt et al., 2016). Similarly, items that have higher discrimination values are able to better differentiate between people at different levels of the construct (Thomas, 2011). Thus, a strength of the IRT approach allows researchers to establish if the measure’s items are more sensitive at determining individuals that score at the low or high end of the latent continuum (Mallinckrodt et al., 2016); a more detailed discussion of the specific IRT principles used in the current study are further described in the method section.
Purpose of the Study
The present study sought to understand how the SEOES’s items function along the continuum of social self-efficacy and social outcome expectations among individuals. As recommended by Mallinckrodt et al. (2016), we fist used CFA procedures and then implemented IRT. This approach allowed for us to first confirm the overall factor structure and then examine how well each individual item represented the overall latent variables. Accordingly, our purpose of the study was to provide a more refined understanding of the SEOES (Wright, Wright et al., 2013) that may allow future researchers, educators, and practitioners to more accurately identify individuals’ levels of social self-efficacy and outcome expectations along the latent continuum beyond the current scales that are used (e.g., Sherer et al., 1982; Smith & Betz, 2000). It is our hope that further examining the SEOES will also provide researchers with a well validated measure of the constructs of social self-efficacy and social outcome expectations based on Bandura’s (1977, 1997) self-efficacy theory that can be readily translated and used internationally. This may help to inform research directions and the design of psychological and educational interventions.
Methods
Participants and Procedures
The study’s sample was comprised of 389 female and 194 male undergraduate college students from a medium size university in the Rocky Mountain region of the United States. The university offers more than 200 undergraduate and graduate programs. The mean age of the sample was 19 and a large portion of the participants were freshman (67%) followed by sophomores (19%), juniors (11%), and seniors (4%). The majority of participants were White (74%) and approximately half of the sample were not in a dating relationship. Once the first author’s institution granted IRB approval, participants were recruited from undergraduate psychology courses and were part of a larger scale study that focused on career development and thus completed multiple instruments; data from the current study using the SEOES (Wright, Wright et al., 2013) measure has not been previously analyzed and was only used in the current study. If needed for class, research credit for participation was awarded to the participants. Data were collected using the first author’s university online survey collection tool. A link to the study’s survey was provided online to all undergraduate psychology students.
Instrument
The Social Efficacy and Social Outcome Expectations scale (SEOES; Wright, Wright et al., 2013) was used in the present study. The original SEOES version consists of 18 total items comprised of two subscales: Social Efficacy subscale (SE; 12 items) and Outcome Expectations (OE; 6 items). Participants respond to items using a 5-point Likert type scale ranging from 1 (strongly disagree) to 5 (strongly agree) and higher scores indicate a greater degree of endorsement of the construct. Using a sample of undergraduate students, Wright, Wright et al. (2013) determined Cronbach’s alpha coefficients based on the subscales’ scores were strong for both the Social Efficacy subscale (α = .965) and the Outcome Expectations subscale (α = .913). Cronbach’s alpha reliability estimates for the Social Efficacy and the Outcomes Expectations subscales calculated from our full sample’s data were .936 and .882, respectively (total score α = .942). The Pearson correlation coefficient between the subscales was .641. The items on the SE subscale had a mean score of 4.1155 and a standard deviation of .62,179 (standard error of mean = .02,575); the combined total mean score was 49.3859 (SD = 7.46,149; standard error of mean = .30,902). The items on the OE subscale had a mean score of 4.2461 and a standard deviation of .60,785 (standard error of mean = .02,517); the combined total mean score was 25.4768 (SD = 3.64,711 standard error of mean = .30,902). Convergent validity of the SEOES was established based on the high correlations between the SEOES and the Perceived Social Self-Efficacy scale (Smith & Betz, 2000), which is a scale that also measures social self-efficacy.
Data Analyses
SEOES Scale Items, Descriptive Statistics, and IRT Parameters.
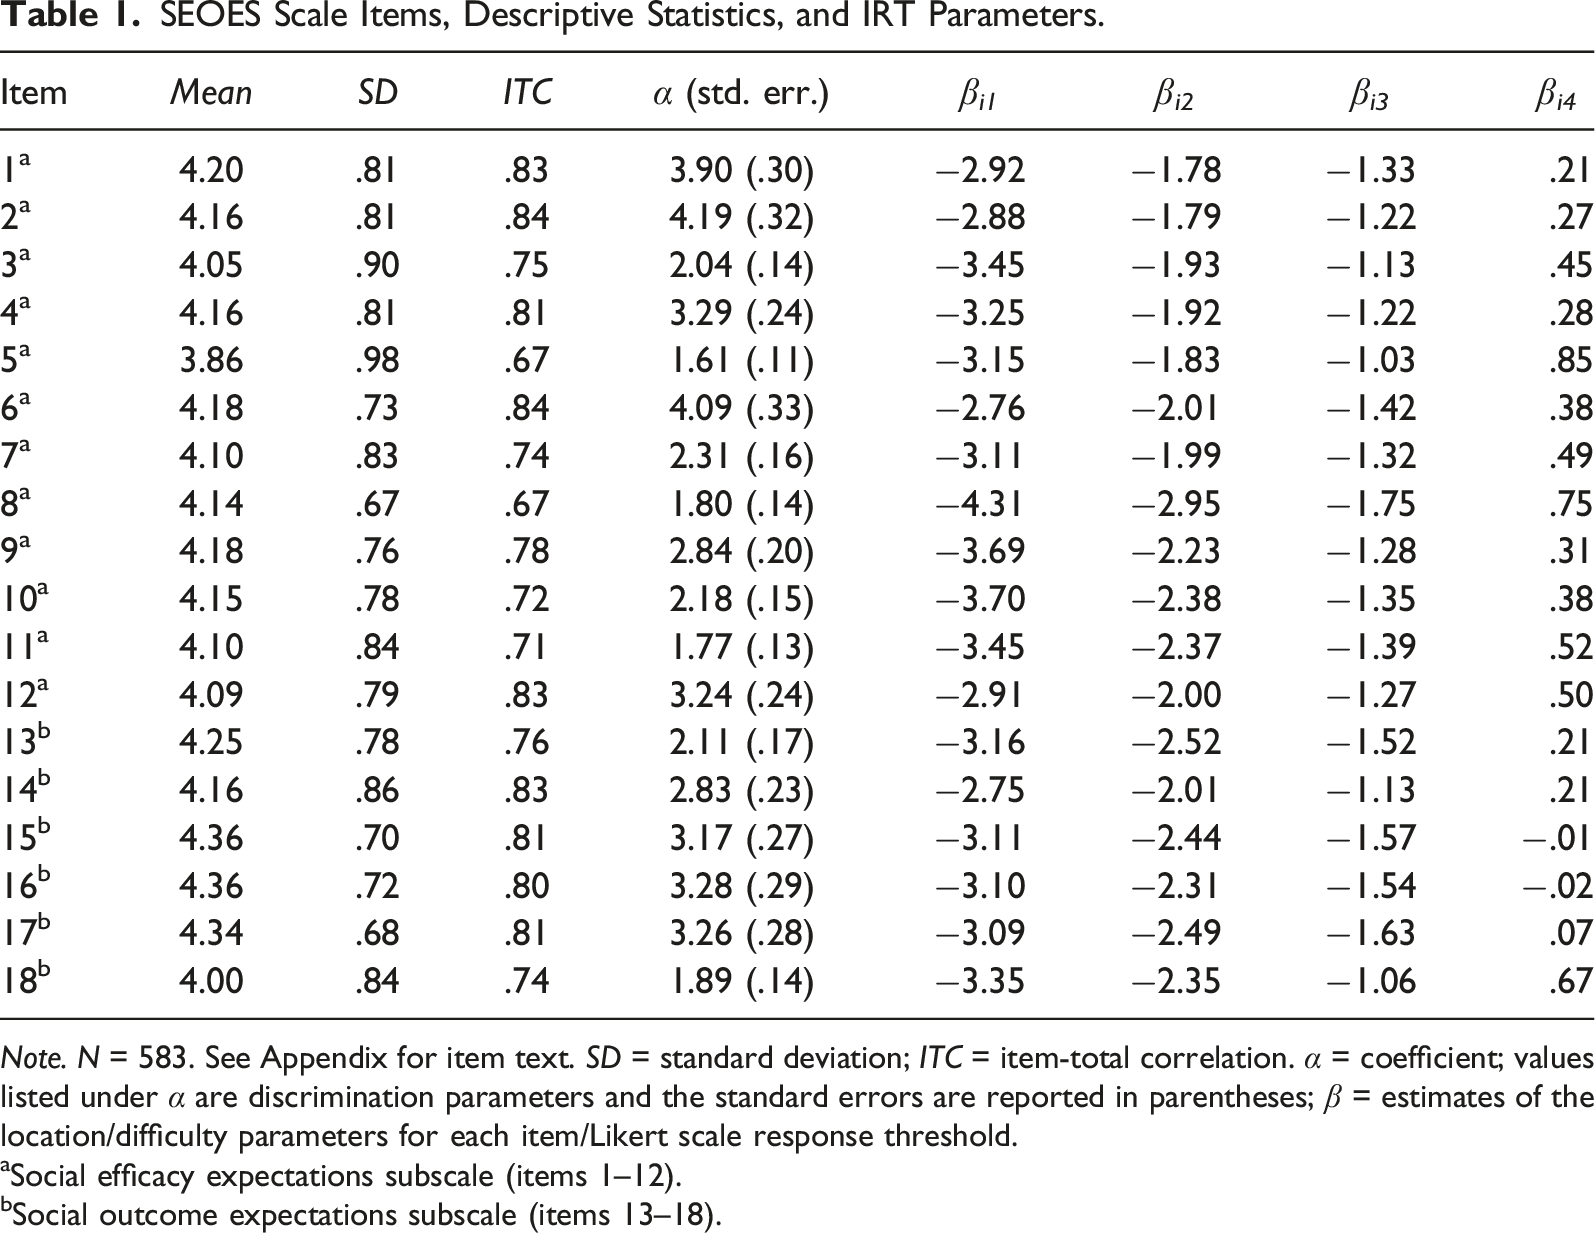
Note. N = 583. See Appendix for item text. SD = standard deviation; ITC = item-total correlation. α = coefficient; values listed under α are discrimination parameters and the standard errors are reported in parentheses; β = estimates of the location/difficulty parameters for each item/Likert scale response threshold.
aSocial efficacy expectations subscale (items 1–12).
bSocial outcome expectations subscale (items 13–18).
We then employed IRT analyses to further evaluate item properties and functioning in more detail using another approach to scale development that has been shown to compliment Classical Test Theory’s (CTT) psychometric and CFA procedures; this practice has also been supported by others (e.g., Mallinckrodt et al., 2016). IRT conceptualizes the latent trait being measured by scale items as a continuum spanning the full range of the construct under examination, for example, ranging from very low levels of social efficacy to very high levels of this trait. This continuum is commonly labeled Theta, represented by the θ symbol, and is set up like Z scores with a mean of 0, SD of 1, and a theoretically normal distribution (DeMars, 2010). The level of this trait that a specific person manifests can be thought of as a person’s location on the θ spectrum and will determine the likelihood of that person selecting a measurement scale item or an item’s specific Likert scale response category, and IRT analyzes these relationships between item response patterns and latent trait levels (Ostini & Nering, 2006). Thus, items in IRT are positioned on the θ continuum as well, as each item can provide information about different ranges of the latent trait spectrum and are therefore assigned a location parameter on θ, symbolized as β (DeMars, 2010). For example, a person with very low social efficacy will have a very low θ level, and therefore will be very unlikely to respond affirmatively (e.g., “True” response vs. “False”) to a social efficacy scale item with a β location in the middle to upper θ range that best captures moderately high to higher levels of social efficacy (e.g., an item reading “I am confident in my abilities to communicate effectively in conversations”). Scale items are also assigned another parameter, often labeled the discrimination parameter α, that indicates “how well an item discriminates among people along the trait continuum” or an item’s ability to “tell people apart with respect to the amount of a trait that they have” (Ostini & Nering, 2006, p. 4). In stark contrast to CTT, IRT parameters are conceptualized theoretically as invariant, in that they are not sample-specific and remain the same even in different samples of people because they are properties of the items (DeMars, 2010). However, in practice, there are often estimation errors due to differences in the samples used to estimate item parameters (DeMars, 2010).
Given the ordinal nature of our Likert-type scale data, we decided to apply the Graded Response Model (GRM) (Samejima, 1969) for IRT modeling of each SEOES subscale using the ltm package (Rizopoulos, 2006) which employs a marginal maximum likelihood estimation (MMLE) method (21 integration points; non-adaptive Gauss–Hermite quadrature). This GRM model treats ordered responses as a series of dichotomous choices separated by boundaries or thresholds (Ostini & Nering, 2006), for example, 4 thresholds (labeled j) between the 5 choices in a 5-point Likert-type response scale. A threshold represents the θ continuum location where respondents have an equal probability of choosing the two adjacent response options (DeMars, 2010). In this way, these ordered categories reflect a person’s decision-making involving “a cumulative process of successively accepting and then rejecting categories, where rejecting a category is defined as being more attracted to the next category, until a category is reached where the probability of attraction is greater than the probability of rejection” (Ostini & Nering, 2006, p. 63). Thus, location parameters are modeled separately for each of these thresholds (β
ij
) based on the response categories for each item, along with the item’s α parameter. Items with a larger range of thresholds cover a greater amount of item difficulty because they are able to more accurately predict if the construct level is correctly identified by the item response. Items and their thresholds can be evaluated graphically by creating Category Response Curves (CRCs), also known as Operating Characteristic Curves, that reflect the probability of choosing a Likert scale response category as a function of θ level with location and shape determined by item parameters (α
i
, β
ij
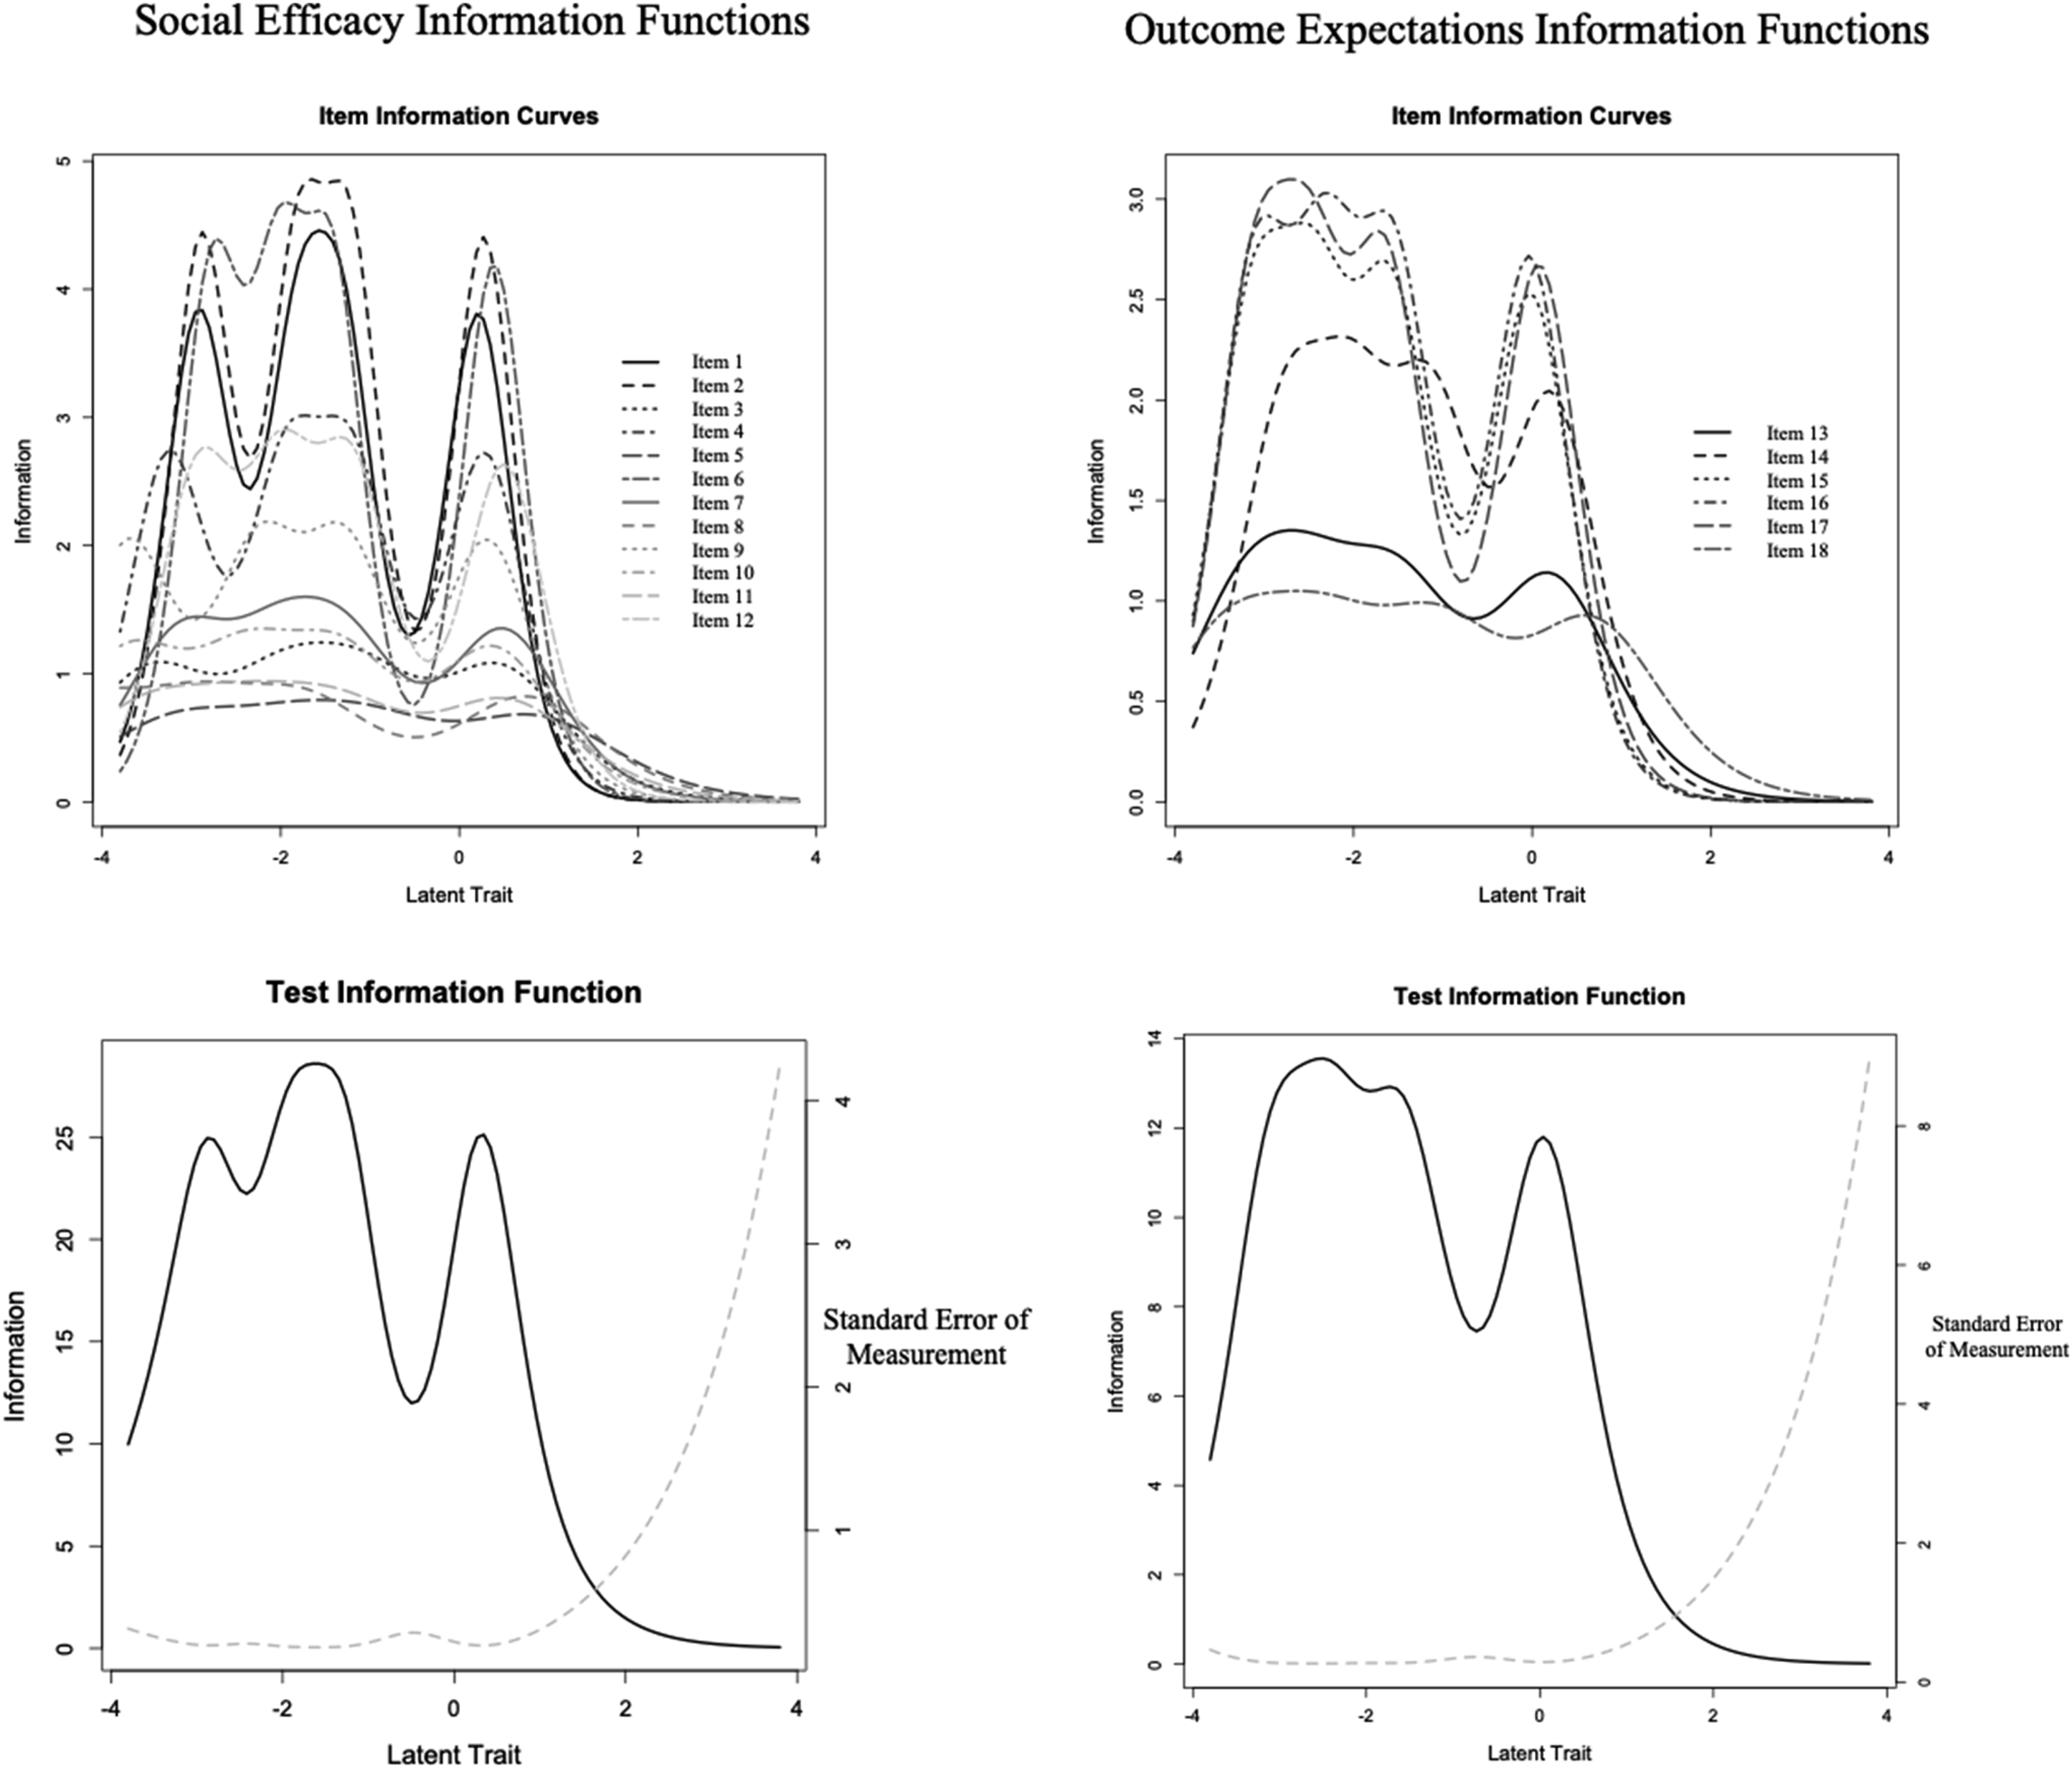
) (Embretson & Reise, 2000), see Figure 1. Items and subscales can also be evaluated graphically through information functions, which reflect measurement precision and how it varies across the θ spectrum, and information is inversely related to the standard error of measurement which can vary as a function of θ as well (DeMars, 2010), see Figure 2. We considered the preceding CFA analyses as sufficient tests of the unidimensionality assumption for each set of subscale items underlying IRT (DeMars, 2010), and our sample size exceeded the 500 minimum recommended by (Reise & Yu, 1990). We also examined indicators of overall IRT model fit by analyzing residuals based on two-way and three-way combinations of responses with a general cutoff guideline of 4 (Bartholomew & Tzamourani, 1999). Outcome expectations subscale items category response curves. Item and test information functions for the social efficacy and outcome expectations subscales.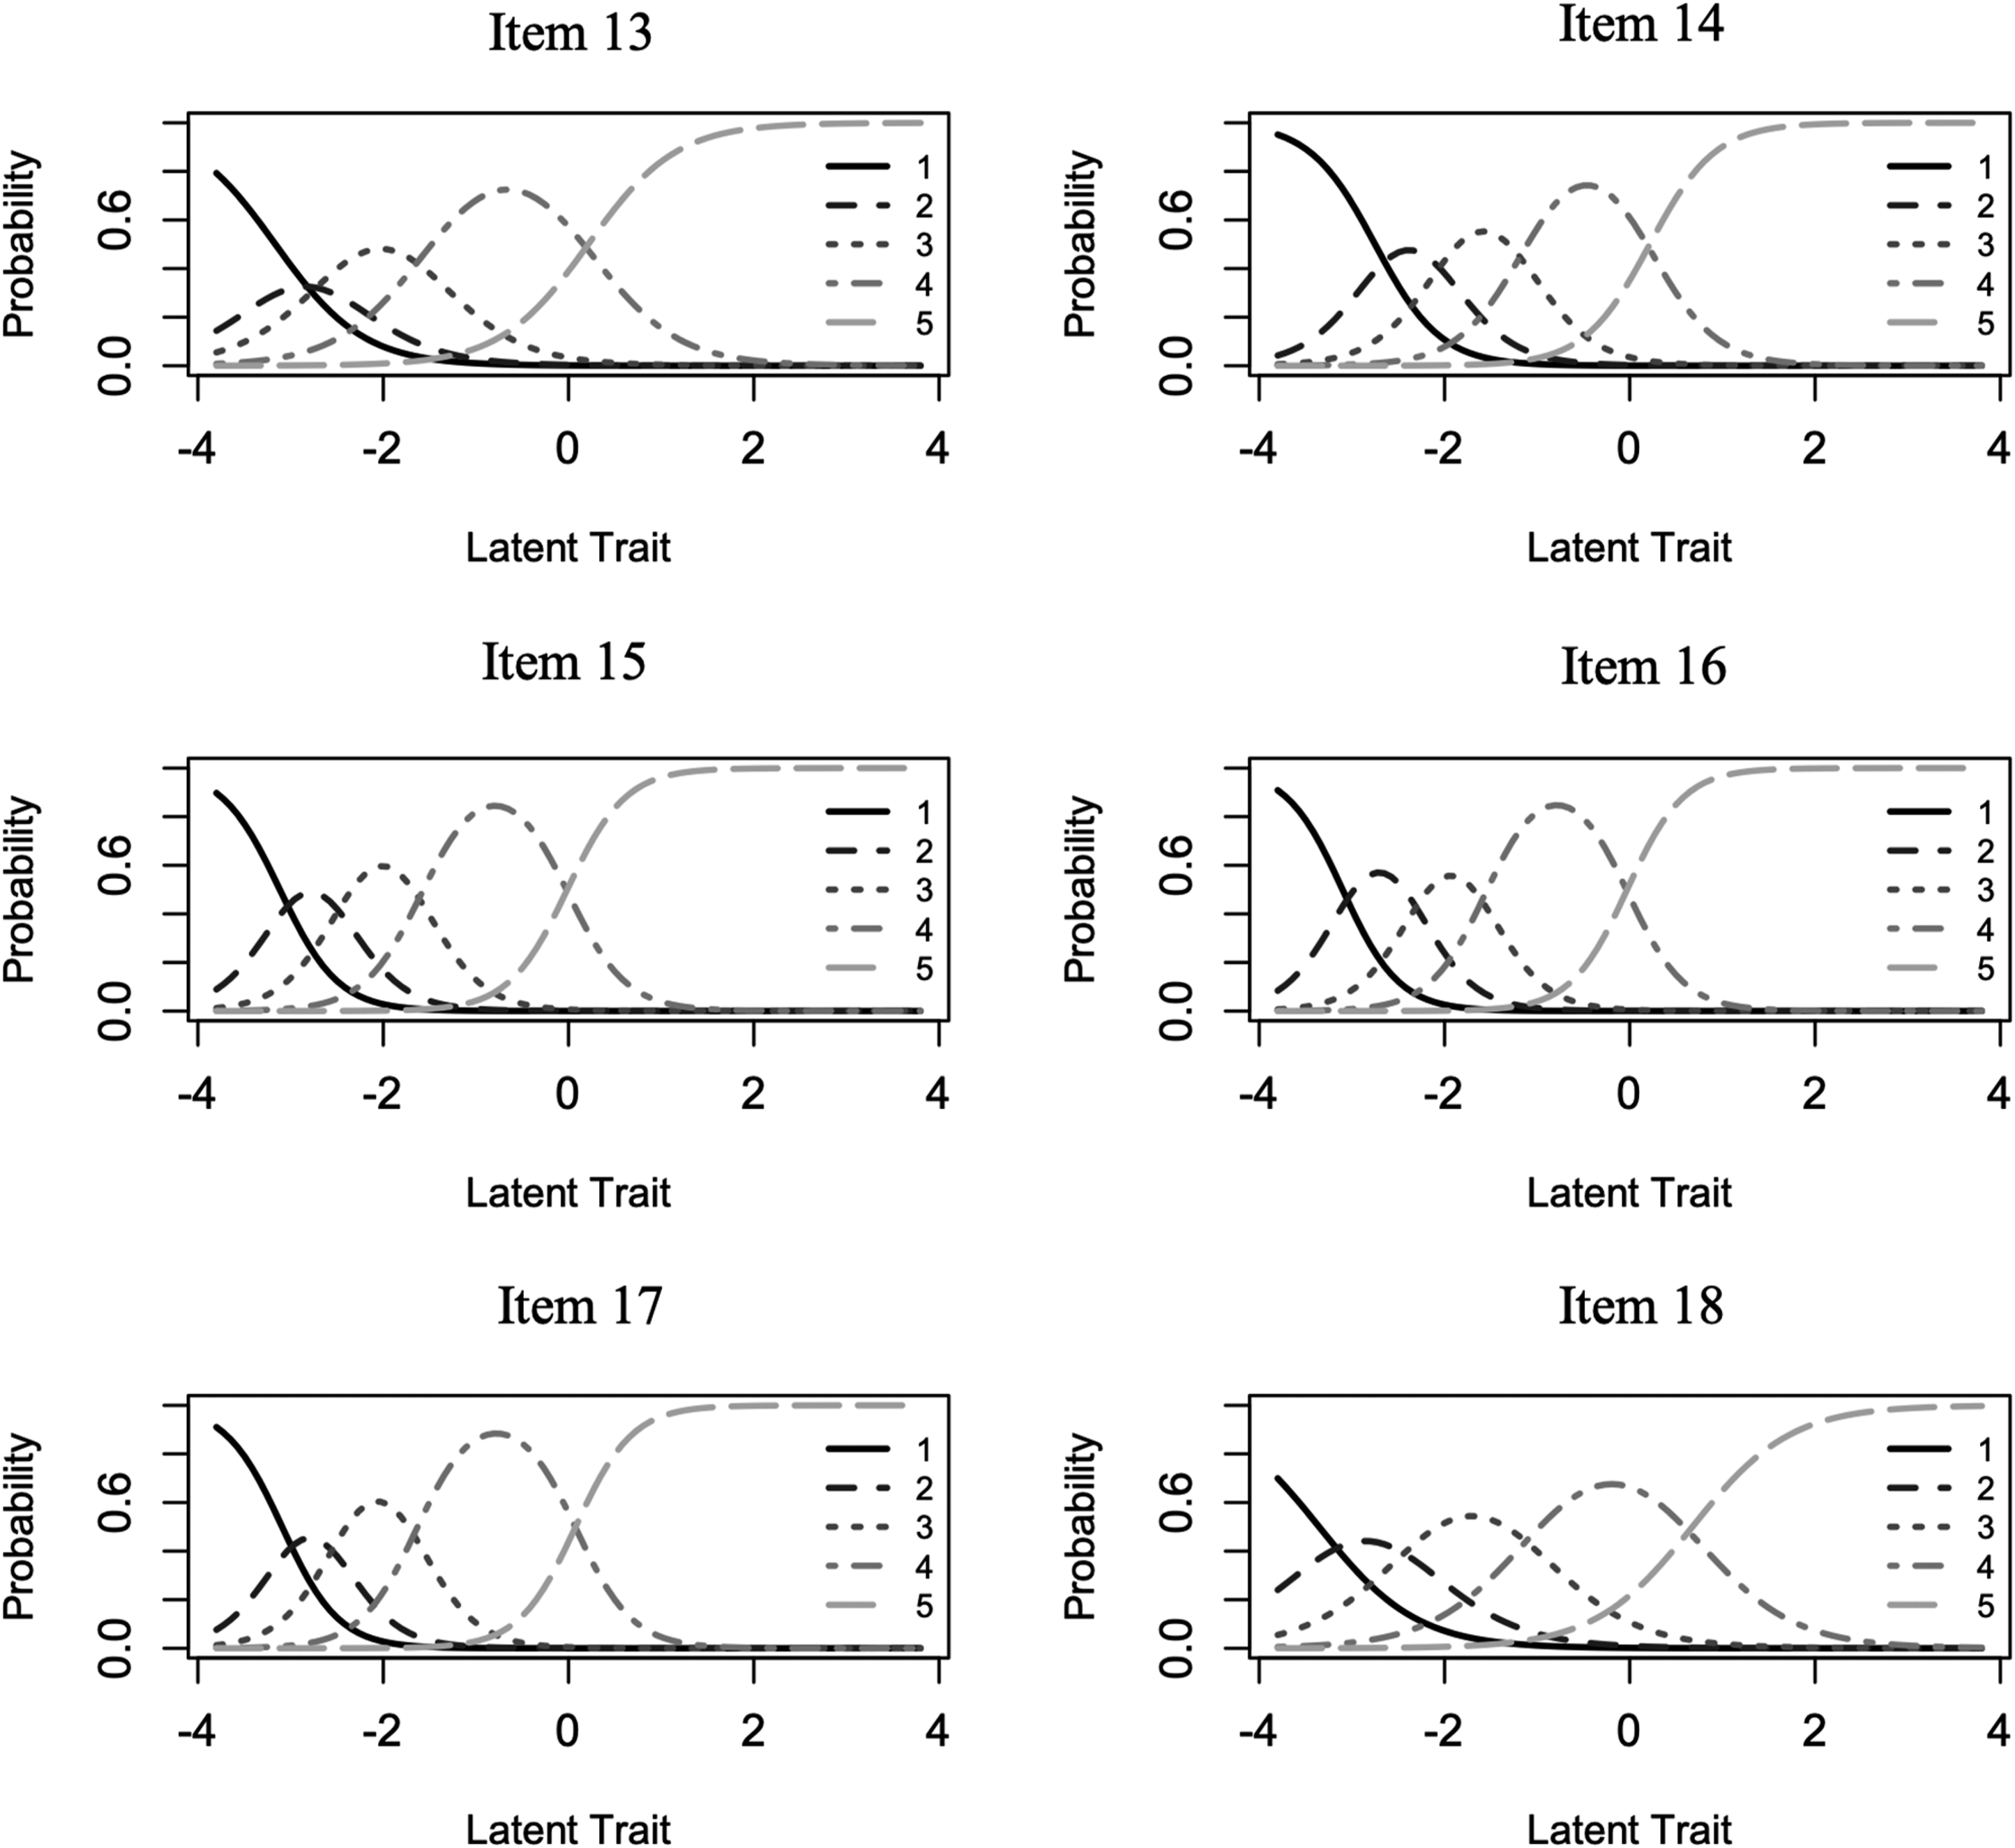
Results
Unstandardized and Standardized Coefficients for the Final 18-Item Model.
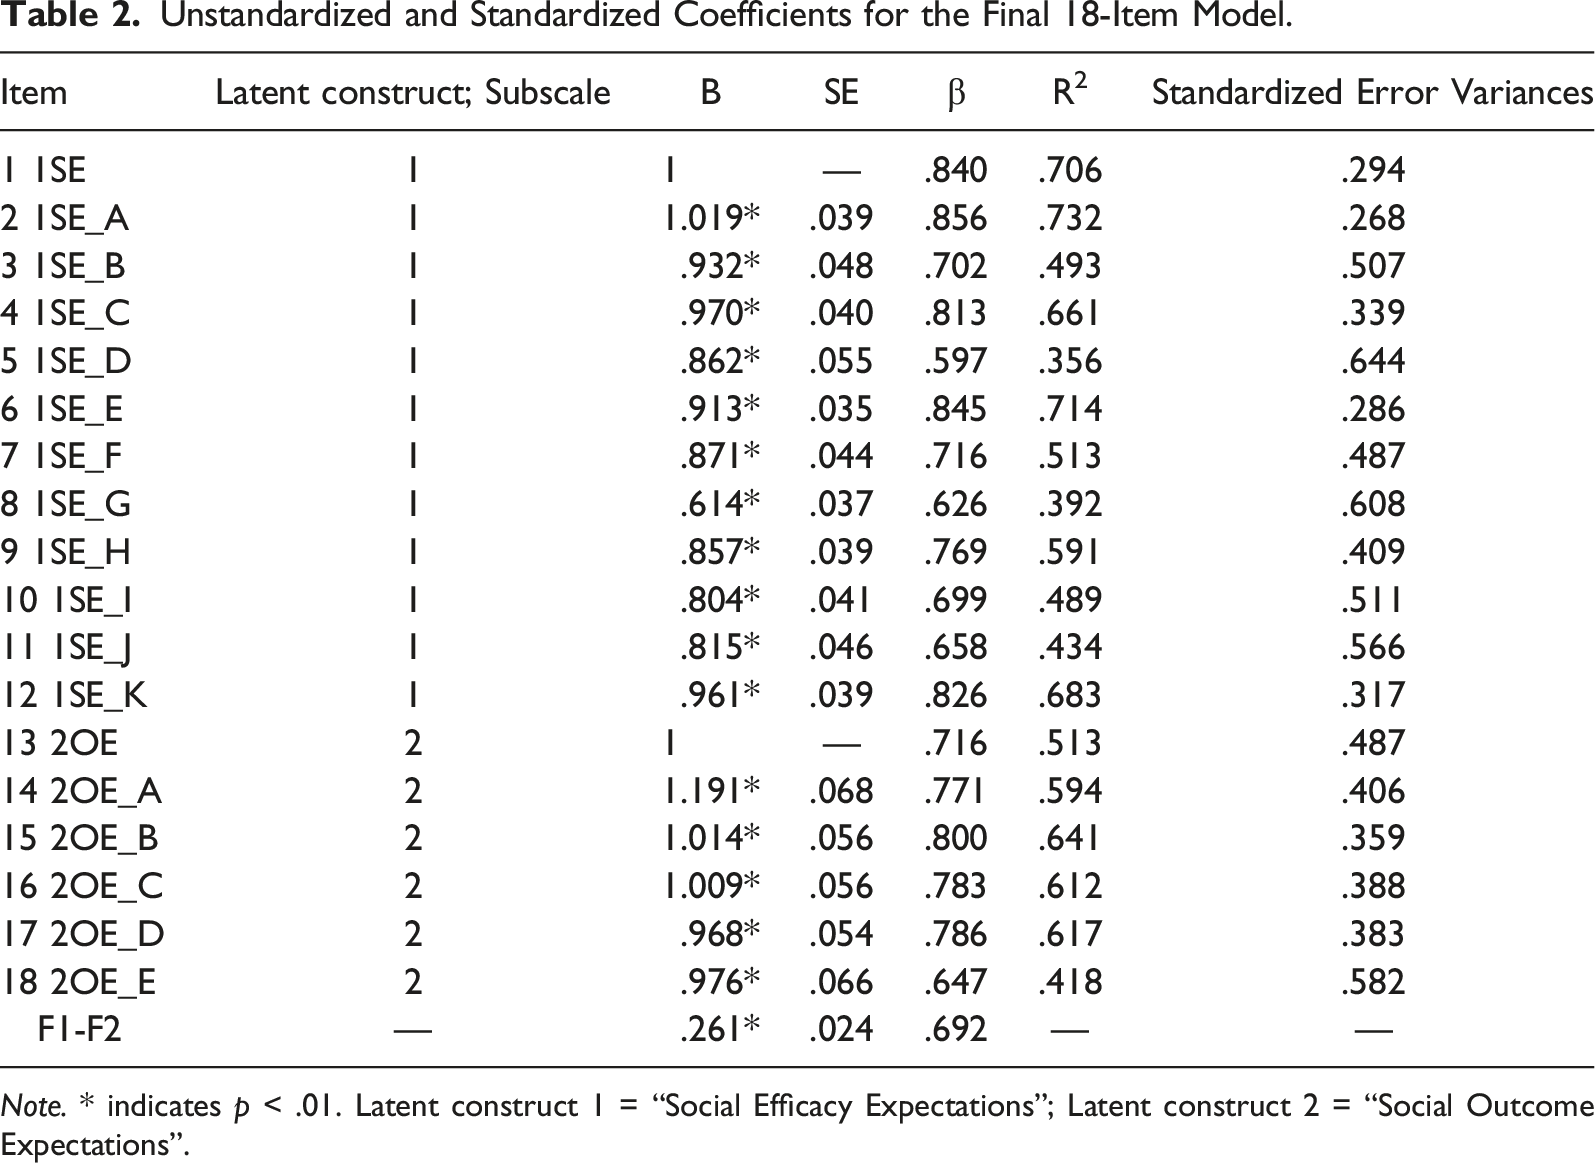
Note. * indicates p < .01. Latent construct 1 = “Social Efficacy Expectations”; Latent construct 2 = “Social Outcome Expectations”.
For IRT analyses utilizing the GRM, the unconstrained models demonstrated improved fit compared to constrained models for both the self-efficacy (SE) item subset, χ2 (11) = 234.06, p < .001, and the outcome expectations (OE) item subset, χ2 (5) = 50.73, p < .001, and so unconstrained models were selected. Our analysis of model fit for the SE model indicated multiple residuals (over 10) exceeding the recommended cutoff for pairs and triplets of items, while the OE model had only 3 two-way margin residuals exceeding 4 but 12 three-way margin residuals exceeding this cutoff. It is important to consider that the χ2 statistic in model fit applications can be especially sensitive to sample size (LaHuis et al., 2011), the SE model contained a relatively high number of items, and our sample size can be deemed relatively small by IRT standards. Despite these caveats, our results suggested that the two models may not demonstrate adequate fit, with the SE model exhibiting poorer fit than the OE model. Thus, we interpreted these models with caution, but we are able to utilize the IRT results for descriptive purposes related to the aspects of the latent continuum most represented and for comparison with future research.
The results from our IRT analyses suggested a wide spread for the β parameters along θ for all items in both subscales (see Table 1), with lowest category thresholds from −4.31 (β 8,1 ) to −2.75 (β 14,1 ) and the highest category thresholds reaching from −.02 (β 16,4 ) up to .85 (β 5,4 ). The Category Response Curves (CRC, Figure 1) for items and Test Information Functions (TIF, Figure 2) for the two subscales graphically reflect that β values were primarily located in the negative end of the latent trait spectrum, with very few positive β values (see Table 1) and category response curves (CRC) on the positive end of the latent continuum (see Figure 1). These results suggest that scale items best capture lower levels of social efficacy and outcome expectations with diminishing precision and information provided at increasing θ levels and thus higher levels of these traits. The larger range of estimates suggests the items have good ability to discriminate the differences between individuals at these lower ranges of the traits’ spectrums. The information functions shown in Figure 2 demonstrate how the information captured by items varies by θ, as items functioned better with lower levels of these latent traits and thus captured more information in this area of the trait spectrums. Furthermore, the information functions for some items and the subscales also show a prominent drop in information provided centered just below 0 on the latent trait spectrum, and reflect increased error and decreased accuracy of information in measuring this range of the spectrum for these latent traits. For example, the OE TIF (see Figure 2) reflects good item functioning from about −3 to −1.5 and from −.5 to .5 along θ. Additionally, item information curves which create the Test Information Function (TIF) demonstrated no significant overlap with other items across the latent trait spectrum, and suggested no problematic redundancy in information provided by subscale items. Analyzing the CRCs closely for the outcome expectations subscale (see Figure 1) suggested generally well-functioning response options; however, item 13 shows a response curve for option 2 that is almost completely subsumed under the 1 and 3 category response curves and suggested that response choice 2 may not have functioned effectively. A similar analysis of the self-efficacy items suggested the 1 category for items 8, 9, and 10 functioned ineffectively, as it was subsumed under the 2 category and thus did not operate distinctly from its adjacent category. Item slope parameters (α) could be considered generally very high at above 1.70 with one value in the high range (1.35–1.69) at 1.61 (Item 5) (Baker, 2001). Based on the discrimination parameters, β values, category response curves, and item information curves, our results suggested that most items were relatively strong in their ability to discriminate between people of different social efficacy and outcome expectation levels, with improved precision at measuring lower levels of the latent traits.
Discussion
The results from our study suggest that the SEOES continues to maintain the same two-factor structure as originally proposed and previously demonstrated (Wright, Wright et al., 2013), which has also been replicated in a translated version of the scale internationally (Turkish; Bakioglu & Turkum, 2017). Based on the confirmatory factor analysis results, both subscales were structurally represented by adequate model fit (Kline, 2011). These Classical Test Theory methods were supplemented by Item Response Theory (IRT) analyses, which is a more current test theory approach for scale development (Reise et al., 2005). According to IRT, our results suggested that most items were relatively strong in their ability to discriminate between people of different social efficacy and outcome expectation levels. Specifically, the larger range of estimates we found (see β values in Table 1) indicates the items have a better ability to discriminate the differences between any two individuals by correctly predicting the probability of endorsing the different levels of the construct. Based on test information functions (TIF, see Figure 2), the scale’s items have greater precision and provide more information at lower levels of perceived social self-efficacy and social outcome expectations, with lower performance at higher levels of these constructs.
These findings suggest that the current scale can be most effective at assessing individuals with lower levels of social self-efficacy and social outcome expectations and is less precise at measuring the more positive aspects of the latent variable (i.e., higher self-efficacy and outcome expectations). Researchers may want to consider our findings when using the scale, depending on the type of research questions they are investigating. As with our scale, other scales developed using IRT have difficulty in measuring positive aspects of the latent variables and more accurately measure lower ends of the continuum. For example, the Experience in Close Relationships – Revised scale (Fralely et al., 2000) has more difficulty assessing higher levels of the latent variable secure attachment and is more precise at assessing lower aspects of insecure attachment. Future research could explore the possible reasons related to the items having more difficulty at assessing positive aspects of social self-efficacy and outcome expectations (e.g., item wording).
Practice Implications
The items from the SEOES can be very useful at accurately measuring lower aspects of social self-efficacy and outcome expectations. Although there is less precision with this scale at identifying higher levels of social self-efficacy, scale results can be used to help identify individuals who may benefit from increasing their social self-efficacy. Given the broad range of interventions that can be designed to increase self-efficacy, as well as Bandura’s (1997) four areas that influence self-efficacy (i.e., performance attainments, vicarious learning, physiological effects, and social persuasion), we believe educators and psychologists can utilize the SEOES to identify individuals that have lower social self-efficacy and social outcome expectations and design interventions accordingly. For example, Thompson and Dahling (2012) found that learning experiences (based on Bandura’s four sources of self-efficacy) directly influence self-efficacy and outcome expectations. Therefore, psychologists and educators could help individuals engage in positive learning experiences by identify others that demonstrate strong social self-efficacy skills and encourage them to observe and recognize (i.e., vicarious learning) the characteristics related to others with strong social self-efficacy. According to Bandura’s theory (1997), engaging in this positive learning experience of vicarious learning will increase their social self-efficacy. In turn, this may be very beneficial for educators to consider, given the strong associations between social support and prosocial behaviors, as well as positive educational outcomes (Heerde & Hemphill, 2018).
Practitioners may also decide to utilize the SEOES to assist in their understanding related to the effectiveness of their work with clients. Based on the change of standard deviation scores, practitioners can reference classification criteria that have been identified (i.e., recovered, remitted, improved, deteriorated; Wise, 2004). Clinicians can utilize the reliable change index (RCI) formula to determine if there is a reliable change in their clients’ scores based on the pre-test and post-test scores. This information can be used to consider if the change is clinically significant, and these methods could be applied to outcome measurement using the SEOES. Wise (2004) provides a thorough overview and formulas related to effective methods to analyze psychotherapy outcomes (i.e., determining clinical significance and calculating RCI).
Limitations and Future Directions for Research
The generalizability of our results presents a limitation to our study. The sample consisted largely of White female undergraduate participants. Using this sample, our confirmatory factor analysis results demonstrated an adequate model fit. However, the model fit from the original development sample used was slightly improved (Wright, Wright et al., 2013). Although measurement invariances are unlikely based on individuals with similar demographics, our study was limited based on the current sample and future researchers could examine our scale with a more diverse sample to test for possible measurement invariances (Millsap & Olivera-Aguilar, 2012). Our study had an adequate number of participants to perform CFA (Kline, 2011), but the sample was relatively small for scale development procedures based on IRT using a graded model (Reise & Yu, 1990) and researchers should consider this limitation.
Another limitation to our study emerged from the results based on the IRT analysis. According to our IRT findings, the SEOES items do not appear to be as precise at measuring the higher levels of social self-efficacy in comparison to measuring lower levels of the construct. It is not uncommon to have an unequal distribution of accuracy at assessing the latent variable (Fraley et al., 2000). Subsequently, future researchers may want to explore scale development procedures by modifying the SEOES items in ways that may help assess higher levels of social self-efficacy.
We used a graded response model (GRM) because we were examining categorical Likert-type data (StataCorp, 2015), and the GRM approach is an extension of a two-parameter logistic model (2PLM; StataCorp, 2015; Fraley et al., 2000). However, there are other types of IRT models that could be utilized based on the purpose of the scale being developed, and future researchers may want to use these other models when appropriate. For example, a 2PL model could focus on examining item difficulty (Thomas, 2011), whereas a 3PL model helps account for guessing (Thomas, 2011) and a 4PL can address careless responding (Mallinckrodt et al., 2016).
Conclusions
The current study sought out to further validate the SEOES (Wright, Wright et al., 2013) using both classic test theory and item response theory approaches. The results support the two-factor structure of the SEOES in a sample of emerging adults with the two theoretically based subscales assessing social self-efficacy and social outcome expectations. However, IRT analysis found that the SEOES has better measurement precision at identifying lower levels of these latent constructs. Therefore, the SEOES may be more appropriate when researchers, educators, and practitioners are interested in assessing individuals who are concerned about lower levels of social self-efficacy.
Footnotes
Acknowledgements
We would like to thank Dorothy Wright for her contribution to the original scale development and for her thoughts on this manuscript.
Declaration of Conflicting Interests
The author(s) declared no potential conflicts of interest with respect to the research, authorship, and/or publication of this article.
Funding
The author(s) received no financial support for the research, authorship, and/or publication of this article.