
Abstract
Discrimination of waste plastics according to brominated flame retardant (BFR) concentration is essential to ensure quality and safety in recycling. We present a sensor fusion approach to classify BFR-containing plastic waste by combining Raman and near-infrared (NIR) spectroscopies. We analysed 210 waste plastic samples sourced from waste electronics and electrical equipment stream and 25 laboratory-made plastics. The Raman spectra were acquired in the range 27–2481 cm−1 using a time-gated Raman and the NIR spectra in the range 4000–5260 cm−1 using a novel active hyperspectral sensor. Total elemental bromine concentrations were determined with X-ray fluorescence spectroscopy and used as reference for training extremely randomized trees classifiers for high- and low-bromine plastics with different thresholds of segmentation. The classifier models were built using Raman and NIR spectral data after reducing dimensions with principal component analysis, both separately and by fusing the data. We achieved over 80% balanced classification accuracies using all models, with significant improvements by data fusion.
This is a visual representation of the abstract.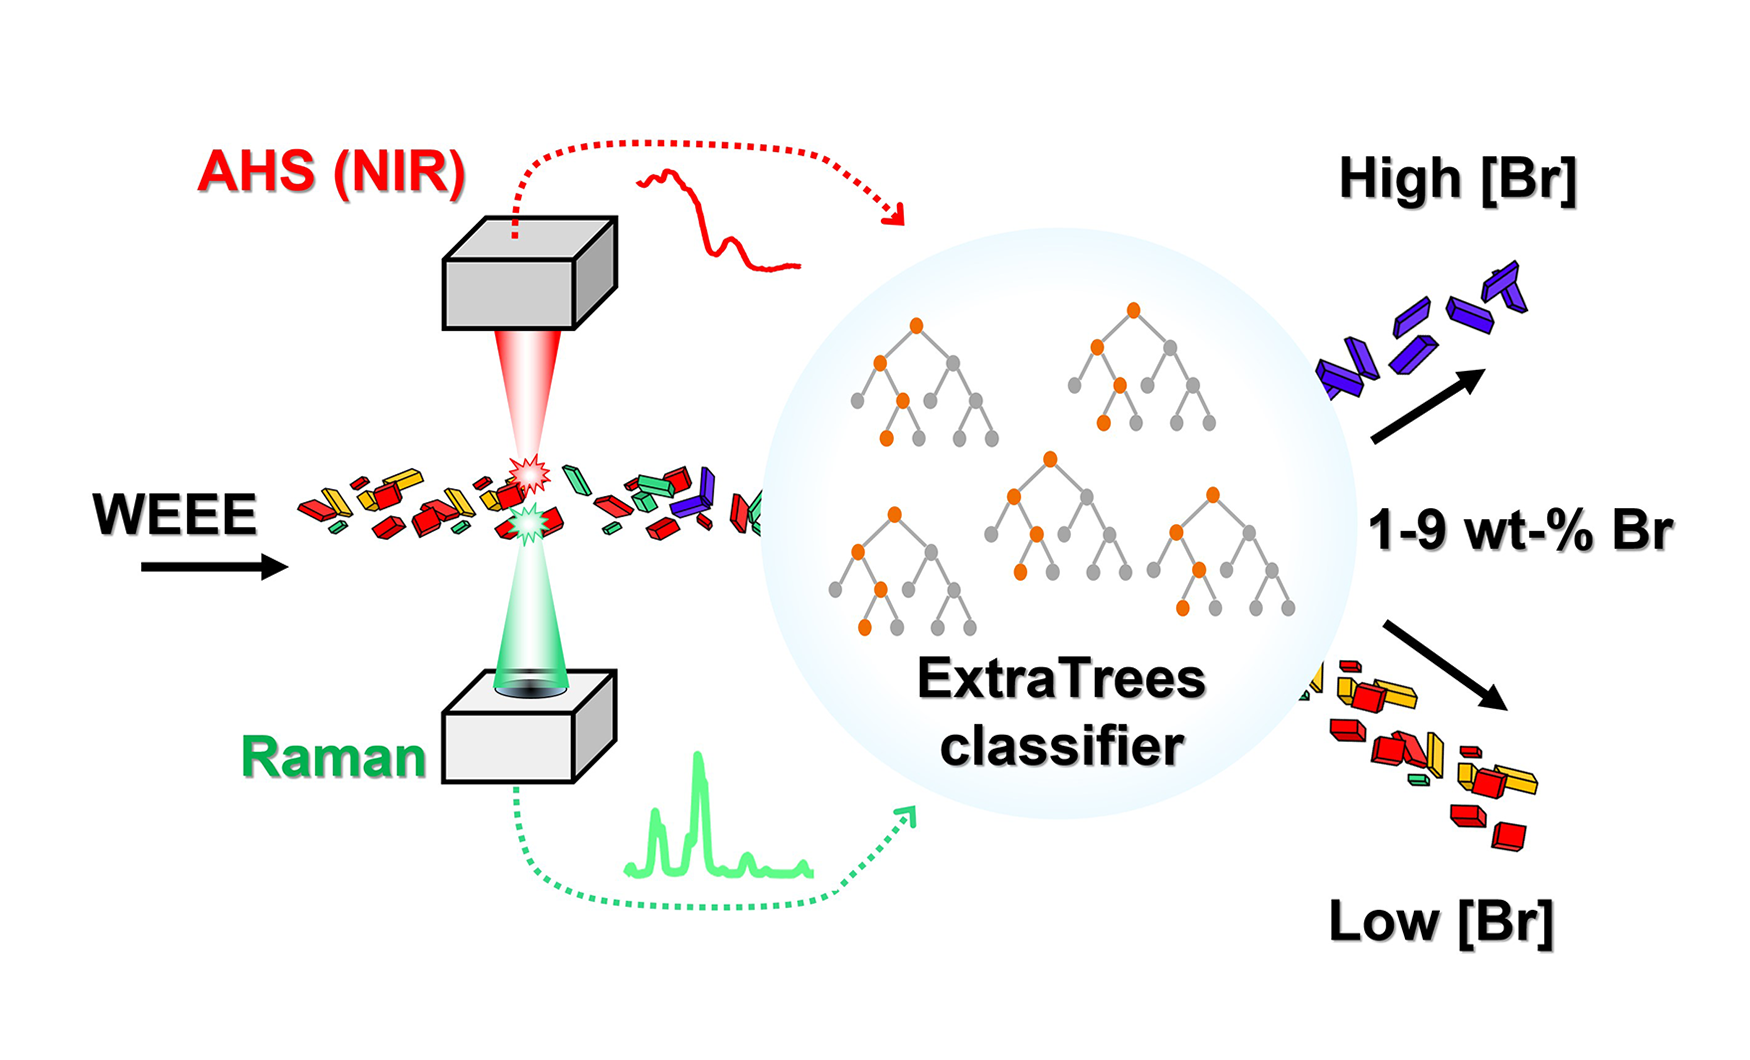
Keywords
Introduction
One of the key challenges in increasing the recycling rates of engineering plastic waste from waste electronics and electrical equipment (WEEE) lies in the quality assessment of waste plastic to ensure their suitability for new lifecycles in new products and applications (Wagner et al., 2020). In Europe alone, 29 million tonnes of post-consumer plastic waste were created and only about 34,6% was sent for recycling, over 42 % was sent for energy recovery and the remaining approximately 23.4% was landfilled in 2020 (Plastics Europe, 2021). The majority of plastics present in WEEE are high-value engineering plastics, which have a high potential to be used in added-value and high-performance applications again.
The presence of hazardous substances is one of the most important parameters, which can inhibit recycling or even define whether the waste plastic is eligible for recycling. For example, in the European Union (EU) by the EU regulations, waste management-related directives frame the operational environment for waste collection and treatment methods. Furthermore, recyclers are responsible for screening incoming waste materials and separating hazardous waste as well as for adequate treatment of the waste streams. Hazardous waste can only be recycled if it complies with relevant product legislation: Registration, Evaluation, Authorisation and Restriction of Chemicals (REACH) Regulation (EU) No. 1907/2006 (European Parliament and Council, 2006) and persistent organic pollutants (POPs) Regulation (EU) No. 2019/1021 (European Parliament and Council, 2019). These regulations restrict hazardous substances and set specific limits for certain restricted chemicals. The chemical legislation in EU aims to eliminate hazardous substances from circulation, preventing their use in products and eventually eliminating their existence (Castell-Rüdenhausen et al., 2022).
These hazardous substances are often present as additives, which have been introduced to the plastics during the manufacturing process to enhance specific and required properties. One particularly important yet problematic class of additives is brominated flame retardants (BFRs). BFRs are commonly used in heated electronic appliances, cables and insulation in vehicles and construction materials, which have a high risk of fire. Typically, even up to 10–30 weight-% (wt-%) is added to the plastics in high-risk applications. If the concentration of any given substance or element is above the limit set by the legislation, the material needs to be disposed. The regulations are effectively restricting the continued lifecycle of hazardous substances, especially legacy substances that have already been banned. However, due to different lifetimes, banned substances are present in the waste feedstock to be recycled, increasing the challenge to meet the required limits in recycled plastics. This effectively inhibits recycling of these feedstocks (Castell-Rüdenhausen et al., 2022).
Many BFRs, such as decabromodiphenyl ether (deca-BDE) and hexabromocyclododecane (HBCD), are regulated under the Regulation (EU) 2019/1021 POP and Stockholm Convention. In 2019, the POP Regulation (EU) 2019/1021 was amended, and the new maximum limit value was decreased from 1000 to 500 mg/kg. Although some BFRs are allowed by regulation, the elemental bromine (Br) concentration is used as an indicator of Br-based content as it is challenging and not currently feasible for recyclers to analyse plastic waste for specific BFR substances (Castell-Rüdenhausen et al., 2022). The trend is that the limit values become more restrictive: for example, the EU Council and the Parliament have reached a provisional agreement to lower the level for polybrominated diphenyl ethers even to 200 mg/kg(Council of the EU, Council and Parliament Agree to Reduce Limit Values for the Presence of Persistent Organic Pollutants in Waste, 2021). A sensor-based methodology to sort online waste plastics suitable for recycling from those containing prohibitive levels of BFRs would thus be tremendously beneficial to enhance the overall recovery of plastics for recycling.
Several sensor-based sorting technologies have been used to address the challenge of classifying waste plastics in terms of their BFR composition. X-ray fluorescence (XRF) spectroscopy determines the total Br content in plastics with a limit of detection (LOD) in the order of 30 mg/kg (Aldrian et al., 2015). Online sorting systems based on XRF detection already exist as commercial solutions. However, XRF is unable to distinguish between different types of BFRs and relies on harmful ionizing radiation. Several other non-invasive techniques, such as Raman spectroscopy (Dincer et al., 2014; Ghosal and Fang, 2015; Schlummer et al., 2015), near-infrared (NIR) hyperspectral imaging (HSI) (Caballero et al., 2019), laser-induced breakdown spectroscopy (Radivojevic et al., 2004) and sliding spark spectroscopy (Golloch and Siegmund, 1997), have been deployed to BFR-containing plastic classification. Techniques based on vibrational spectroscopy, for example, Raman and NIR-HSI, are of particular interest as they provide high scanning rates, use non-ionizing radiation and could enable non-destructive analysis of BFRs in waste plastics.
Raman spectroscopy can detect BFRs with some degree of selectivity based on the variation in the carbon–bromine (C–Br)-related vibrational modes. In Ghosal and Fang (2015), the authors employed Raman spectroscopy for identifying BFRs directly in plastic samples. Quantification of HBCD in polystyrene (PS) foam waste was tested with a handheld Raman spectrometer (Schlummer et al., 2015), but the device was not able to distinguish between samples that contained HBCD from those in which the BFR was absent. In Dincer et al. (2014), the authors proposed a method to quantify deca-BDE in white-coloured polypropylene samples with a LOD of 3 wt-%. However, only three Raman spectra with different amounts of deca-BDE were shown to support this claim. NIR-HSI and three different classifier models has also been demonstrated for classification of waste plastics based on their BFR content (Caballero et al., 2019). However, the study utilized a relatively small sample set, containing only one of each BFR/plastic type combination. So far, all existing works reporting use of vibrational spectroscopic techniques for BFR classification in plastics lack a robust methodology to evaluate their limits and capabilities.
In this work, we studied different classifiers for identifying BFR-containing plastics using both Raman and NIR spectra acquired from over 200 individual plastic samples as input data. Even though the BFR concern is a matter of concentration, we chose to develop classification rather than regression models for two reasons. Firstly, there is no need to determine the BFR concentration accurately, if we can correctly assign the plastic piece to either a high- or low-BFR containing class. The second reason is that, from a spectroscopic point of view, the detection of BFR in plastics is done partly indirectly, as several spectral features associated to the polymeric structures are correlated to the presence of BFRs.
The aim of our study was to propose a robust way for validating an extremely randomized trees classifier or extra-trees classifier (ETC), and interpreting the results based on the important features (wavenumbers) identified by the model and vibrational mode assignments from the literature. We deploy a novel active hyperspectral sensor (AHS) for acquisition of the NIR spectra (Kääriäinen et al., 2019; Manninen et al., 2014), which could be implemented in a real sorting line at several metres distance from the samples. We demonstrate, both in terms of quantitative metrics and important spectral features, the advantages of our sensor fusion approach in comparison to results obtained using either Raman or NIR spectral data alone.
Experimental section
Sample preparation and collection
In this study, a total of 235 plastic samples were used, consisting of 25 laboratory-made and 210 waste plastic pieces. For the laboratory samples, the used BFRs were HBCD, deca-BDE and tetrabromobisphenol-A (TBBP-A). For each BFR/polymer matrix combination, a series of samples was manufactured with a range of concentrations (see Supplemental Appendix Table A.1). These flame retardants were chosen due to their relative abundance as legacy flame retardants in the WEEE stream (Haarman et al., 2020). The polymers (acrylonitrile-butadiene-styrene (ABS) and PS) were also chosen due to their common usage in electric and electronic equipment (Kaartinen et al., 2020).
All the laboratory samples consisted of 25 × 25 × 3 mm square-shaped pieces with flat surfaces. No further additives were used in the compounding process. All samples presented clear colours, except for the samples that contained 8, 10 and 12 wt-% of HBCD. For those samples, thermal degradation during compounding resulted in colour alteration towards a dark shade, a phenomenon that has been identified in a previous study (Barontini et al., 2001). The purities of HBCD, TBBP-A and deca-BDE were 95%, 97% and 98%, respectively. All BFRs were produced by Sigma-Aldrich (Merck Life Science OY, Espoo, Finland).
The waste plastic sample set comprised irregularly shaped shredded pieces from objects belonging to category 5: small equipment of the EU WEEE Directive 2002/96/EC (European Parliament and Council, 2012). These samples were acquired from Kuusakoski Recycling, after the crushing phase. The sample sizes were heterogeneous, with average dimensions in the order of 20 × 20 × 2 mm (see Figure 1). Of the samples, 39 were black and the rest were white-coloured. The waste samples contained different plastics of unknown polymer composition. However, since all the waste plastic samples were sourced from WEEE, the main polymers present in the sample set should be styrenics (e.g. ABS and PS), polypropylene and polycarbonate (Freegard et al., 2006). Loose dirt was removed with a dry cloth from the sample surfaces prior to measurements.
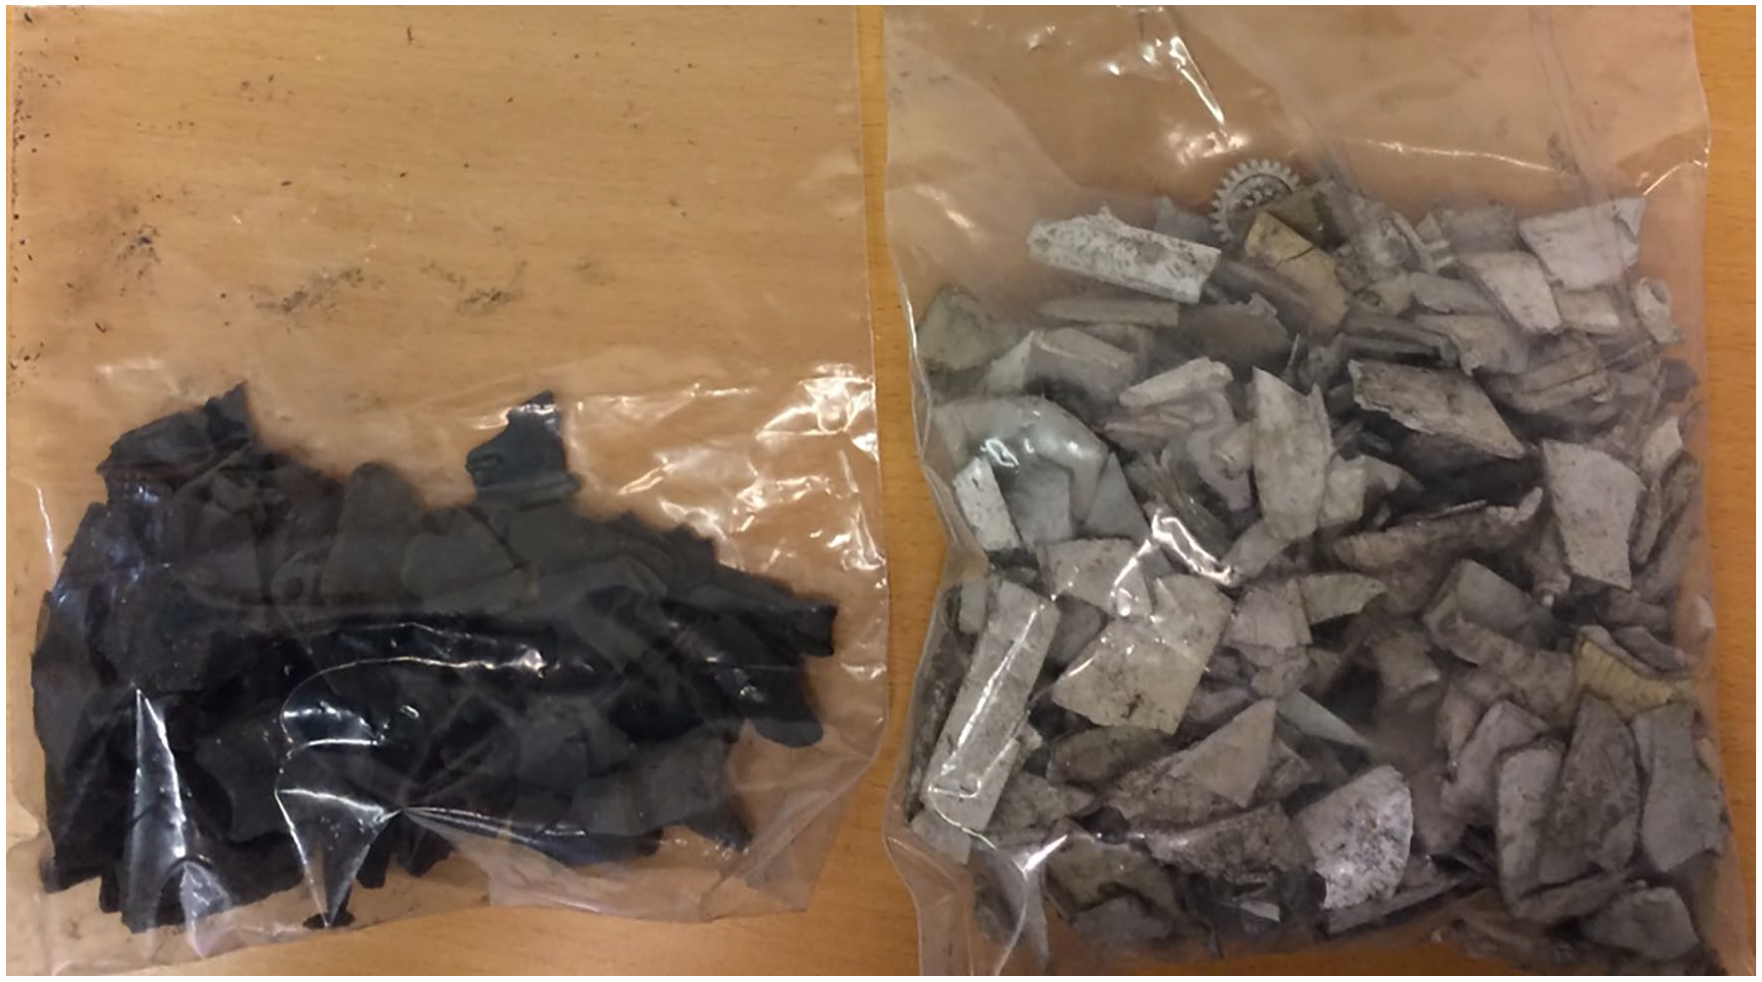
Photograph of the used WEEE samples from the real waste stream.
Reference analysis of BFRs
Reference elemental Br concentrations for the samples were determined using a hand-held XRF device (Niton XL3t 900S GOLDD; Thermo Fischer Scientific (Vantaa, Finland)). After collecting the XRF spectrum, the device automatically calculates the concentration of 19 different elements, including Br. In-built plastics analysis calibration mode and thickness correction were used for each measurement. The measurement time was 30 seconds per filter.
Raman spectroscopy
The Raman spectra were acquired utilizing a time-gated spectrometer (PicoRaman; Timegate Instruments Oy), which allows for effective fluorescence reduction (Kögler and Heilala, 2021). This spectrometer uses a Nd:YAG 532 nm excitation laser. The spectrometer recorded 749 different wavelengths within the Raman shift range 0–2481 cm−1. The setup of the Raman spectrometer is depicted in Supplemental Appendix B. The samples were individually placed on the measurement aperture, upon the Raman probe. The measurement time was approximately 1 minute with 25 sub-acquisition averaging for a single sample.
Active hyperspectral sensor
An AHS prototype similar to the setup described in Kääriäinen et al. (2019) was used for acquiring the NIR images of the plastic samples. The AHS is based on a supercontinuum source covering the spectral range 4082–5263 cm−1 and a microelectromechanical Fabry–Perot interferometer for wavelength selection. The output supercontinuum beam is incident on a sample located at 2-m distance from the AHS, and the backscattered light is collected by the receiver module of AHS. The AHS prototype is assembled on a pan-tilt mount, which allows for imaging in a point-scan operation. The setup of the AHS prototype is depicted in Supplemental Appendix B. The plastic sample pieces were arranged in a frame with dark background (see Supplemental Appendix B). The scan rate was 125 spectra per second, with each spectrum consisting of a measurement of a roughly 1 cm2 area. Considering the dimensions of the frame were approximately 40 cm × 60 cm, the total time of scanning was around 20 minutes. Prior to the plastic sample measurements, dark signal and white reference spectra (Spectralon) were acquired to calibrate the reflectance.
Data analysis
Figure 2 shows the overall flowchart of the data analysis routine. The first step with either Raman or AHS data is the preprocessing of the spectra. This step is essential to minimize baseline fluctuations due to different degrees of scattering and specular reflection from the samples. Such effects may generate spectral artefacts, which are not linked to the chemical composition of the waste plastics, but rather to the surface roughness, shape, and orientation of the sample. Examples of raw and preprocessed spectra acquired with both Raman and AHS are given in Supplemental Appendix C.
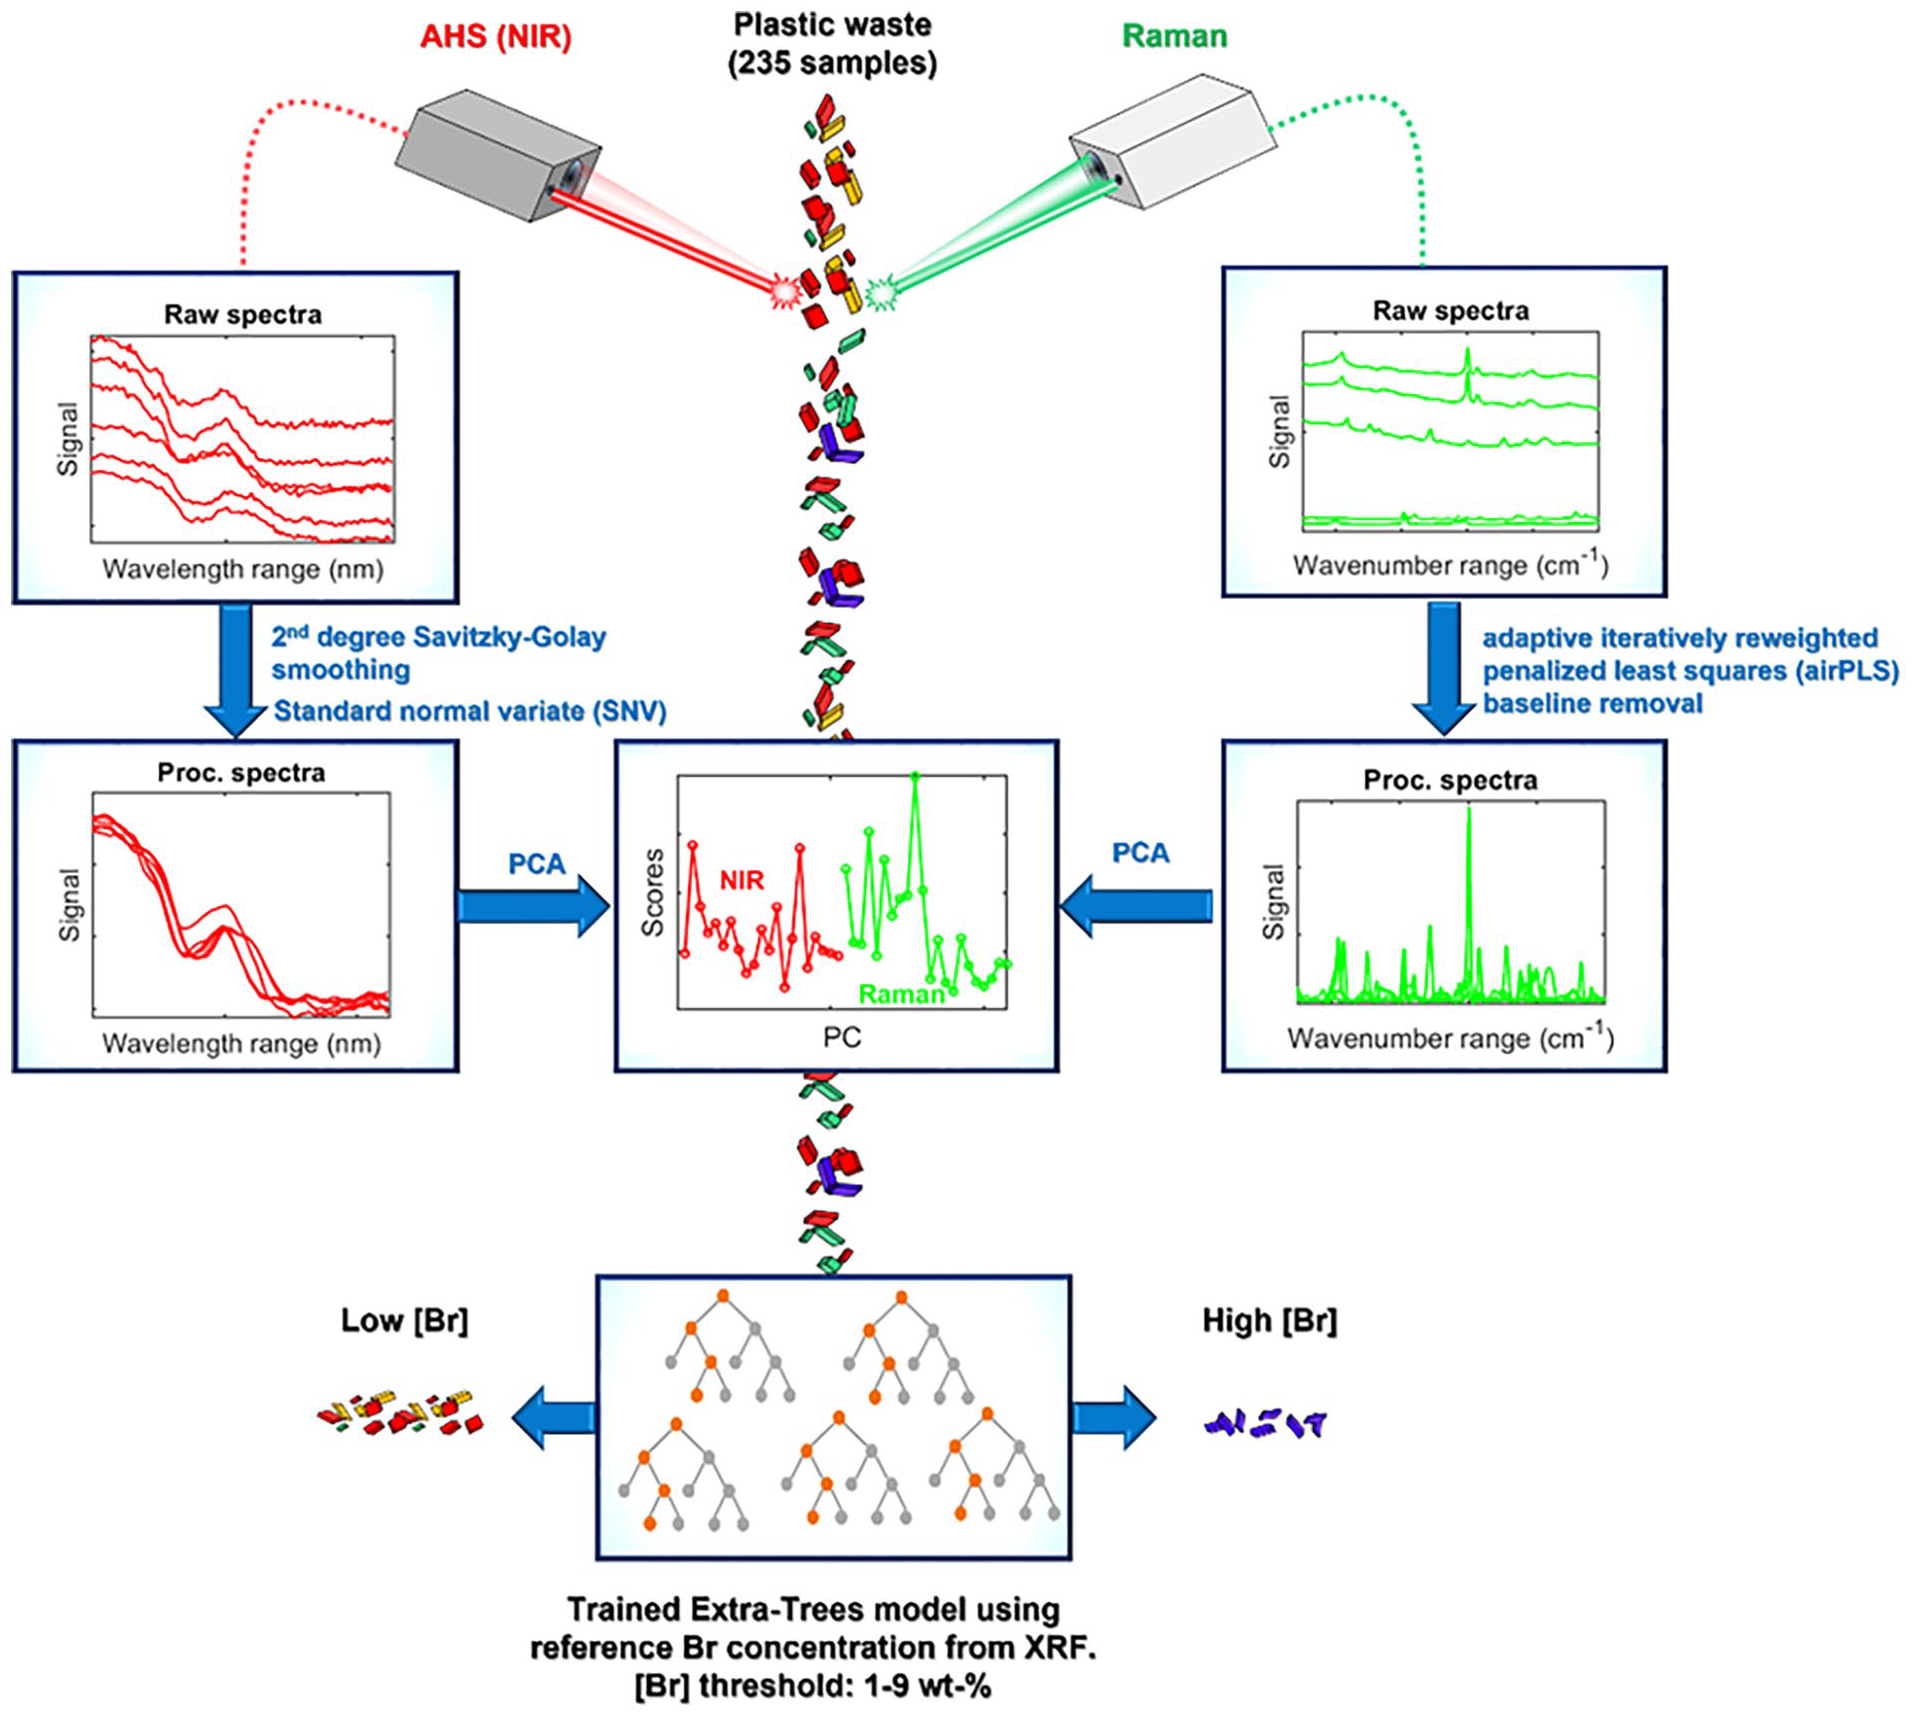
Overall flowchart of the sensor fusion approach for sorting plastic waste according to the BFR content.
The preprocessing step was specific for each dataset. For the Raman spectra, the first step was the removal of wavenumbers below 27 cm−1 as the signal in this range is a result of Rayleigh instead of Raman scattering. Afterwards, the baseline was removed using the adaptive iteratively reweighted penalized least squares method (Zhang et al., 2010), with lambda and polynomial order values 10 and 2, respectively. Next, second-degree Savitzky–Golay filter was applied to smooth the spectra, with a window size of 11. The spectra were then processed using standard normal variate. For the AHS dataset, spectra from a 4-by-4 pixel window were averaged to obtain one spectrum to provide a single signal per sample for both techniques. The subsequent preprocessing was similar to the procedure applied to Raman spectra, with the exception of the wavenumber range reduction and baseline correction.
Principal component analysis (PCA) was performed on both AHS and Raman datasets for dimension reduction. Four sub-datasets were used as input, according to the following approaches: (1) only Raman spectra; (2) only AHS spectra; (3) combined Raman and AHS spectra, with PCA applied jointly to both datasets (JPCA) and (4) combined Raman and AHS spectra, with PCA applied separately to each dataset (SPCA). The Raman and AHS datasets in the JPCA approach were combined by concatenating the data vectors on the spectral axis, with subsequent PCA. For the SPCA, the PCA is applied first, followed by the concatenation of datasets. The number of evaluated principal components (PCs) in all cases ranged from 2 to 25.
The datasets were split into two classes according to a low- or high-Br content. These classes were defined using a total Br concentration threshold based on the results determined by XRF. Multiple threshold values were evaluated within the range from 1 to 9 wt-% (10,000–90,000 mg/kg) to identify the optimum for discriminating the classes. The data were then used as input for 33 different classifiers, of which the ETC (Geurts et al., 2006), was the best performing one in terms of balanced accuracy. ETC is an ensemble method that utilizes a large number of decision trees and is an extension of random forest. A decision tree finds the optimal hierarchical binary splitting threshold for each input feature such that the classification performance on the whole training set is maximized. In the case of random forest, multiple decision trees are used, randomizing the input features, that is, each tree is fit only with a subset of training samples (Breiman 2020). The final predictions are done by majority voting principle, which leads to better stability by reducing variance and overfitting. Similarly, ETC uses randomized training input, but instead of finding the optimal thresholds uses a random value between the minimum and the maximum of each input feature, and majority voting is used for final predictions. This method has been found to outperform random forest in classification tasks due to further decrease in model variance (Geurts et al., 2006).
Balanced accuracy was chosen as the main evaluation metric, as it takes into account the class imbalance by considering the harmonic mean of in-class accuracy of both classes. Balanced accuracy is ideal for evaluating models where the number of samples in each class varies, as is the case when segmenting datasets based on different concentration thresholds, as well as cases of imbalanced class distributions.
Nested fivefold cross-validation was used to evaluate model performance for choosing the candidate model with the highest balanced accuracy (see Figure 3). The data was first randomly rearranged, and then split into two sets. The first set contained 80% of the samples and was used for training and the remaining 20% was used for testing the model. The test set was different for all fivefolds and was used only for evaluating the final model, with the different test folds giving information about the generalizability of the final model, that is, to what extent the randomly chosen training samples affect the model performance. The training set was used for fourfold cross-validation by further splitting the training set into validation and training subsets comprising 20% and 60% shares of the original dataset sizes, respectively. Similarly, for each of the four-folds, the validation set was different. In the inner cross-validation, the parameters were iterated through and balanced accuracy was calculated for the results given by all parameters and the 33 classifiers for all of the four-folds by training the models with the training set and predicting on the validation set. Then, the best candidate model was identified by averaging the performance of each parameterization over the four-folds and selecting the one with highest score. This approach was repeated for the different training splits of the outer loop, so five candidate models remained. The best scoring model was selected for the final evaluation, which was carried out in the outer loop. For each fold, the best model identified by the validation phase was trained on all the training data and used for test set prediction. The final model inference time is in the order of milliseconds. All the data analysis was carried out using MATLAB and Python.
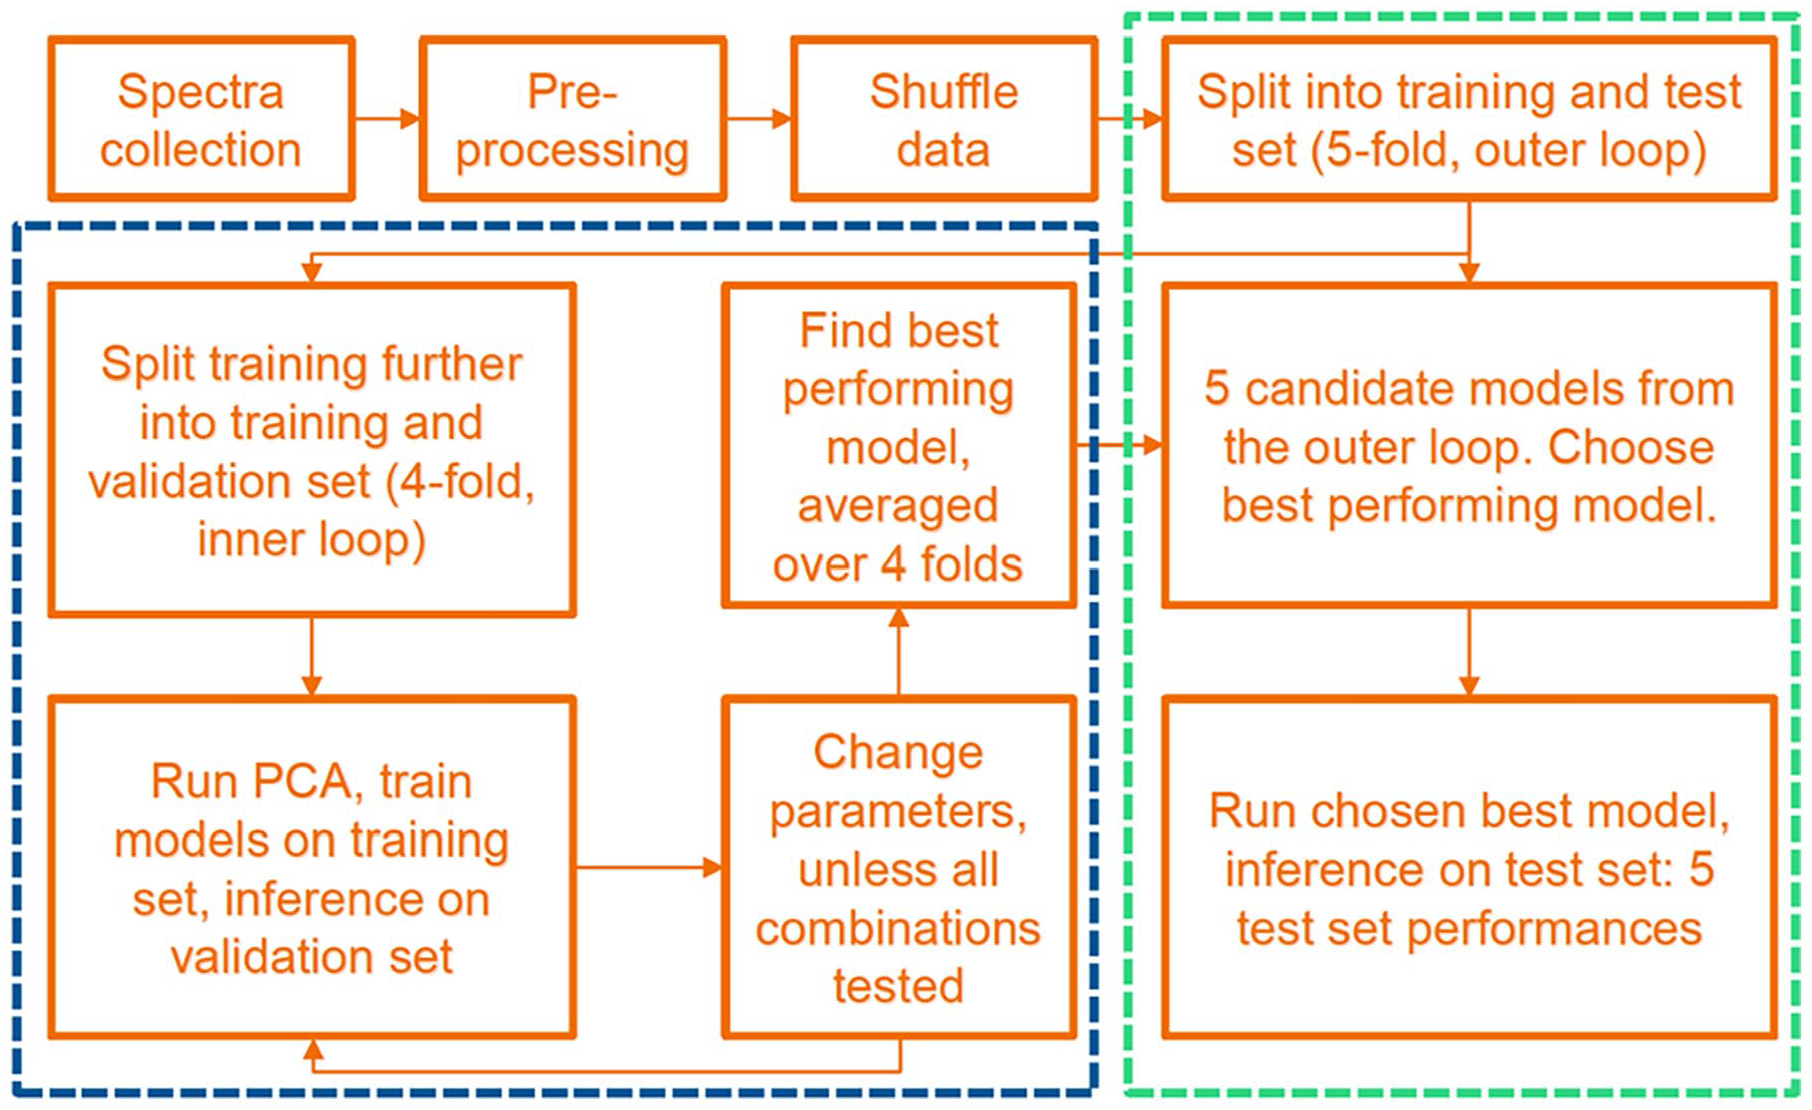
Flowchart of the nested cross-validation pipeline. The blue dashed line marks the inner loop, and the green dashed line the outer loop.
Results
Reference analysis
The total concentrations ranged from below the XRF LOD (30 mg/kg) to almost 20 wt-%, with a rather heterogeneous distribution (see Supplemental Appendix Figure A.1). The number of samples in the low- and high-Br classes ranged from 49 and 186 (1 wt-% threshold) to 158 and 77 (9 wt-% threshold), respectively (see Table 1). XRF as well as GC–MS/MS analysis for a subset of these samples can be found in Fjäder et al. (2022; appendix 1 and table 10, respectively).
Low-Br and high-Br sample distribution for different segmentation thresholds.
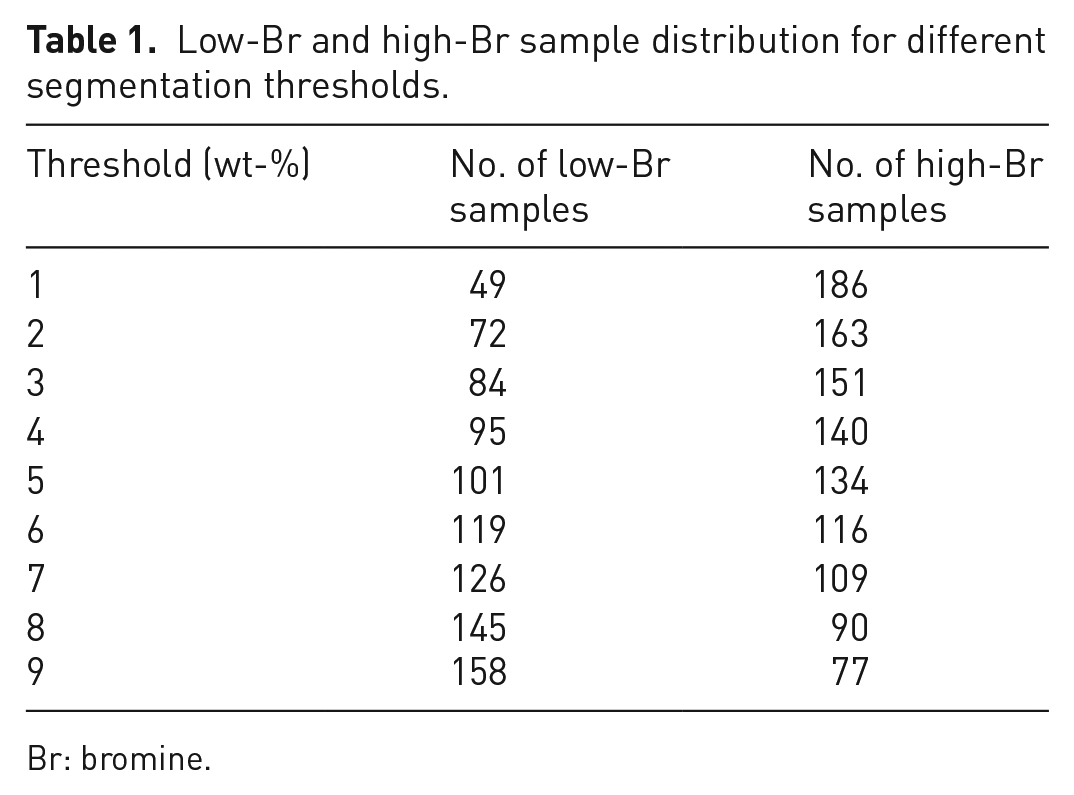
Br: bromine.
Sensor fusion classifier results
The results of the optimal model search for classification are shown in Table 2. In all cases, the ensemble method of ETC yielded the best performance, with different number of PCs and Br concentration thresholds. These models were used in the final classification evaluation on the different test folds.
Results for the best performing model (ETC) of the iterative search for optimal parameterization of the classification models.
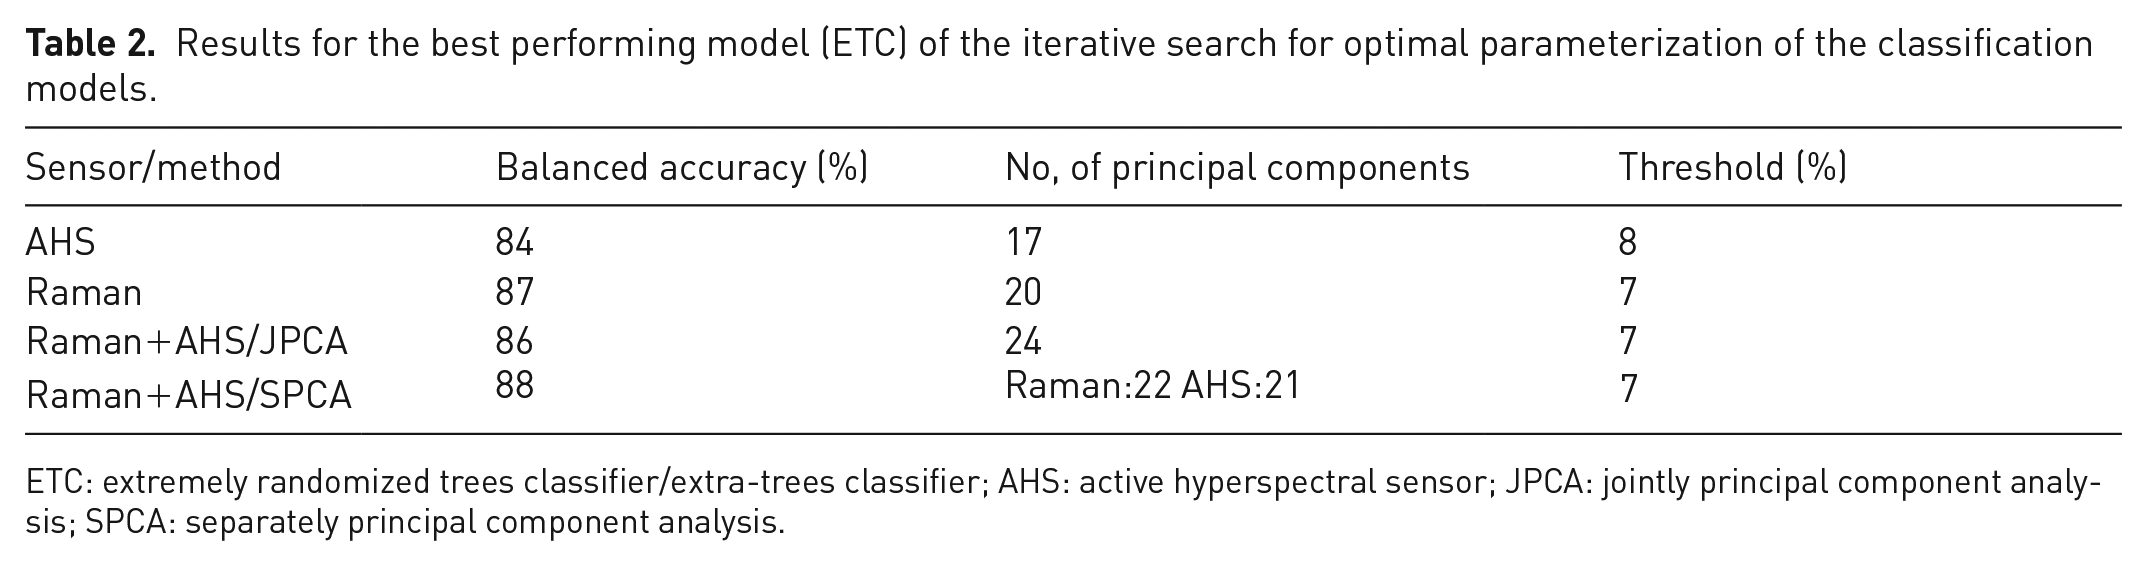
ETC: extremely randomized trees classifier/extra-trees classifier; AHS: active hyperspectral sensor; JPCA: jointly principal component analysis; SPCA: separately principal component analysis.
Final classification results of the four methods using the five-folds are shown in Table 2. Here, the mean balanced accuracy of three methods in the test set were very close to each other, 81.6%, 82.0% and 82.9% for AHS, Raman and their JPCA combination, respectively. The best performance was obtained with combined Raman+AHS SPCA, yielding a mean balanced accuracy of 85.2%. In the case of AHS, the optimal threshold value was higher (8 wt-%) than for the other methods (7 wt-%).
In Table 3, the classification results seem to vary in different folds. For example, the balanced accuracy given by Raman+AHS JPCA for folds 1 and 5 are 78.6 and 91.0%, respectively. This suggests that there are marked differences between the samples that are randomly split to either training or test set. One explanation of this is the probable wide variety of different BFRs and polymer combinations that exist in the sample set, leading the training set to be biased towards certain samples.
Classification results on the test set of different folds with the acquired optimal parameters.
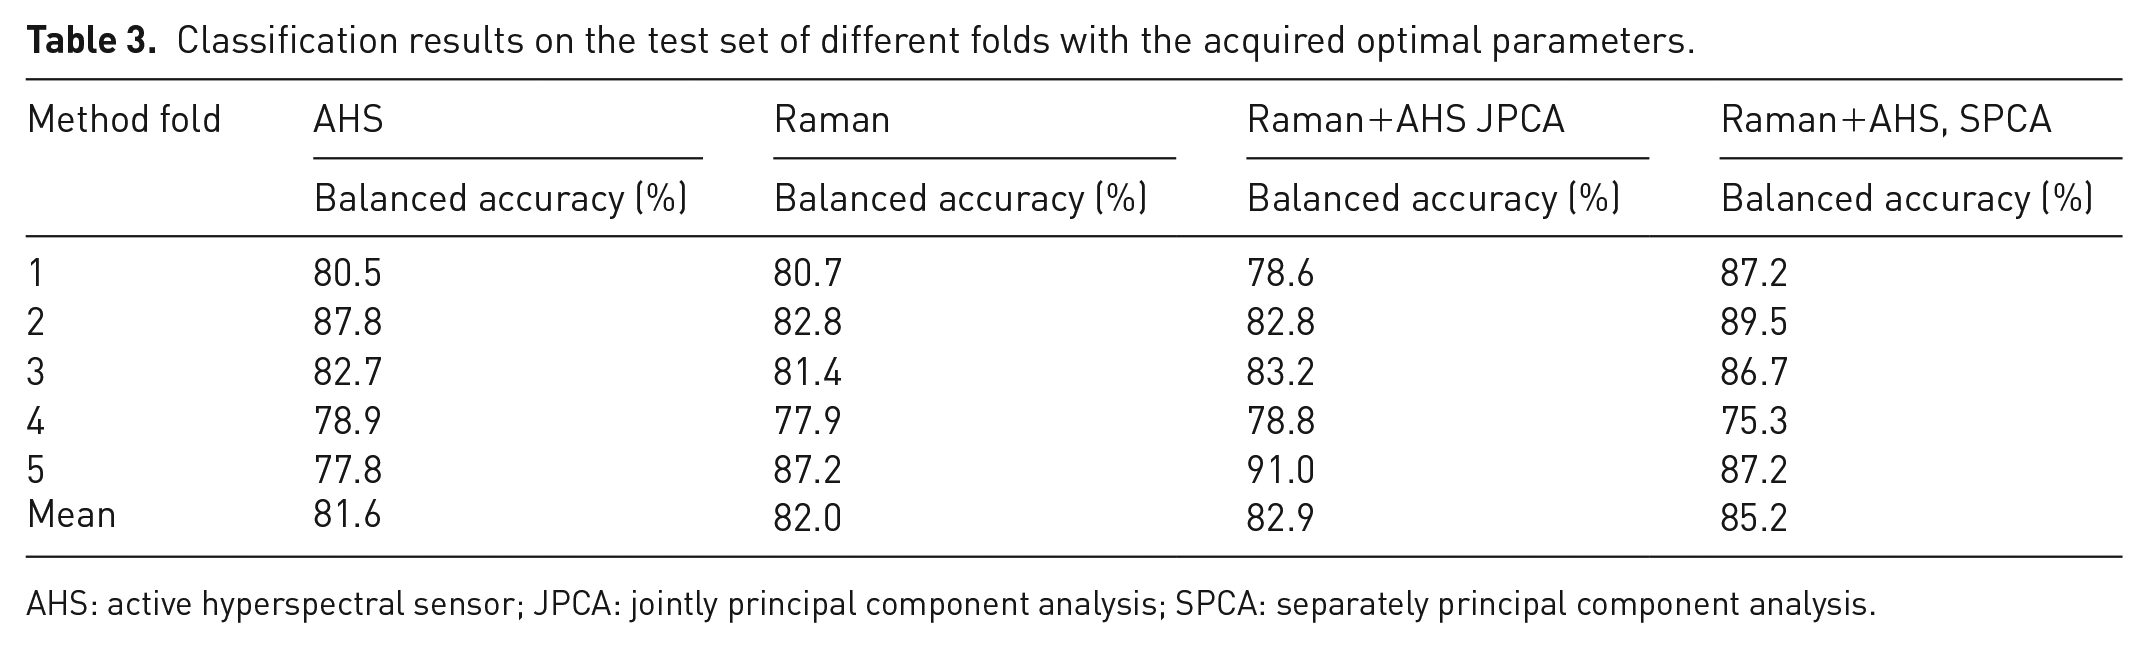
AHS: active hyperspectral sensor; JPCA: jointly principal component analysis; SPCA: separately principal component analysis.
Regarding the best performing classification model, that is, Raman+AHS SPCA, the total number of misclassified samples across all test folds was 31. Of these samples, 13 were black coloured WEEE samples, and only one was lab-made (the PS sample with 12 wt-% HBCD). As expected, the black coloured samples were over-represented due to the low signal-to-noise ratio in the spectra; the colouring agent (carbon-black) absorbs most of the incoming radiation, rendering the amount of reflected and scattered radiation minimal. The misclassified samples consisted of almost equal number of high- and low-Br samples, 14 and 17, respectively. The total number of high- and low-Br samples were 109 and 126, respectively, with the threshold value of 7 wt-%.
The superior performance of Raman+AHS SPCA can potentially be attributed to the fact that, as the PCA is done separately for each spectroscopic modality, most spectral variance from both measurement modalities is retained in a compressed form. Thus, the classifier may find combinatory features within and between each modality. Contrasted with Raman+AHS JPCA, the variance from both modalities is reduced to the same coordinate system; in this case, the classifier may only account for the combinatory features (found by PCA) between the modalities. In addition, AHS is more affected by the black plastic absorbing most of the signal, leading to better results for Raman and its sensor fusion with AHS.
Figure 4(a) shows the accumulated average performance of each model at the threshold of optimum accuracy for a series of 1000 runs with random train-test (80%–20%) splits. In order to provide statistical validity, a paired t-test was conducted. Firstly, normality test (Agostino and Pearson, 1973) was conducted to confirm that the balanced accuracy scores follow normal distribution with the optimal threshold values for each method, and the p-value in all cases was below 0.05. The variances between the methods were also equivalent, varying between 0.0026 and 0.0031. Then, the t-test was conducted between each method, and the results are shown in Supplemental Appendix Table D.1. The p-values were well below 0.01 in all cases except one, that is, between Raman and Raman+AHS JPCA, which shows the variation between methods is statistically significant.
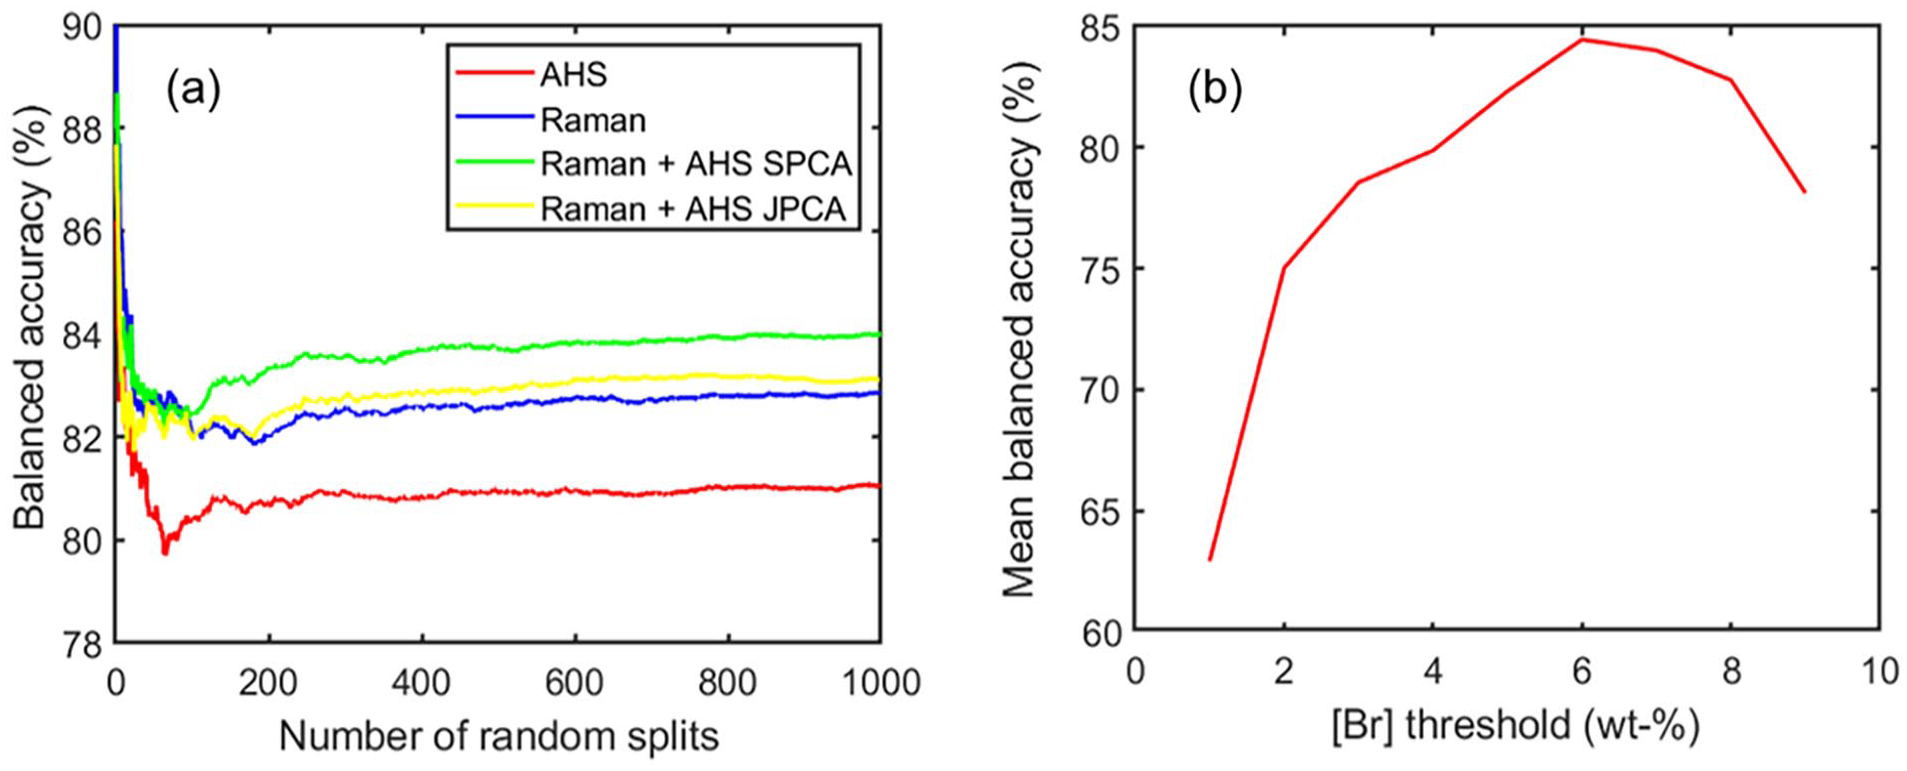
Mean balanced accuracy for 1000 runs splitting the dataset randomly into training and test sets and applying the best performing ETC model obtained in the cross-validation (a), and the best performing method with different thresholds, averaged over 1000 runs (b).
In addition, experiments were conducted with the optimal parameters for the best method (Raman+AHS SPCA) for 1000 random splits with different threshold values; the mean results are shown in Figure 4(b). The best classification performance occurs with 6 wt-%. However, even with the lowest threshold of 1 wt-%, the mean balanced accuracy was 63%, indicating that some features in the spectra correlated with Br that allowed for classification, although with lower performance.
It is worth mentioning that, despite our successful proof-of-concept demonstration, there is still a technological gap between our work and its implementation in recycling plants. The main challenges associated with measurements in a recycling plant environment concern the plastic sample presentation and the required measurement speed. Regarding speed, the 125 Hz of the AHS would be enough for probing a single line in a conveyor belt, but faster scanning would be required for imaging. For time-gated Raman, the measurement time and very accurate focusing needed to get a successful spectrum currently limits it to off-line use. The presentation of the plastic samples in a conveyor belt could affect the accuracy of the models, as dirt spots on the surface of the plastic pieces would prevent acquisition of true plastic spectra. On the other hand, calibrating the models on a real conveyor belt would mean that the sample sets would be considerably larger, which could in turn enhance the robustness of the classifiers and allow for using more sophisticated artificial intelligence tools that require larger data sets.
Interpretation of classifiers
To further verify the robustness of the classification approach, the most important features of both Raman and AHS spectra in each model were compared to experimental and theoretical spectra of relevant pure polymers or BFRs. The spectral features of both Raman and NIR spectroscopies correspond to vibrational modes of molecules, which are the signatures of specific chemical bonds – for example, C–Br, carbon–hydrogen (C–H) – as well as larger structures composed by several atoms – for example, aromatic rings. Therefore, by identifying which chemical bonds or groups of atoms are associated with each spectral feature, one can infer the main molecular structures probed by either technique. In particular, by analysing the features identified as the most relevant to the classifier, it is possible to interpret the model in terms of what compositional information from the samples was used for classification. Such interpretation is also useful for verifying whether there are spurious correlations – for example, if the important features do not correspond to any relevant substance present in the sample.
The selection of BFRs was based on the availability of vibrational mode assignments in the literature for the measured spectral range. In the case of Raman spectroscopy, spectra of PS (Torres et al., 2007), ABS (Reggio et al., 2020), polycarbonate (Resta et al., 2015), polypropylene (Nielsen et al., 2002), TBBP-A (Qiu et al., 2013) and BDE-15 (Qiu et al., 2010) from the literature were selected.
Figure 5(a) shows the comparison between the most significant spectral features of the best classifier using the Raman spectral data with frequencies of the most common WEEE polymers and BFRs from the literature. The black curve shown in Figure 5(a) corresponds to the loadings of the PC identified as the most important by the classifier. For both TBBP-A and BDE-15, the majority of lines assigned to C–Br-related vibrational modes lie below 300 cm−1, a region where the most intense peaks were observed. In particular, the peak around 260 cm−1, prominent in the loadings spectrum, coincided with the in-plane bending of the C–Br bond for both the TBBP-A (261 cm−1) and the BDE-15 (257 cm−1) molecules. This feature is particularly selective as it does not overlap with vibrational modes associated with aromatic ring torsion (τ-ring) and deformation (δ-ring), as it is the case for several other features.
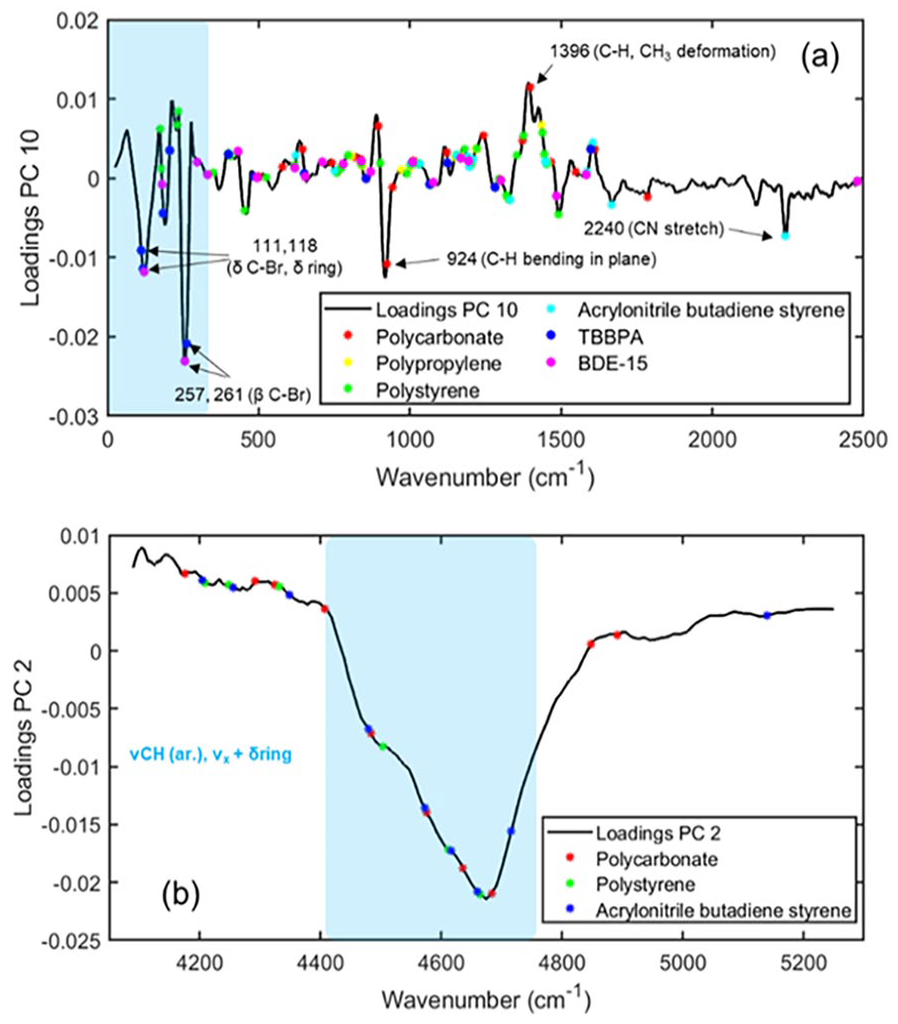
Comparison between the normalized absolute value of the loadings for the most important PC for the classifier built using both Raman and AHS spectral data and reference BFR and polymer spectral information. Vibrational mode frequencies of two BFRs (TBBP-A; Qiu et al., 2013 and BDE-15; Qiu et al., 2010) and four of the main polymer constituents of WEEE (PS; Torres et al., 2007, ABS; Reggio et al., 2020; polycarbonate; Resta et al., 2015 and polypropylene; Nielsen et al., 2002) are represented by markers. All NIR polymer frequencies and assignments were taken from Beć et al. (2021). Raman (a) and AHS (b) loadings, highlighting the most intense peaks.
In addition to the C–Br-related modes, three peaks located at 924, 1396 and 2240 cm−1 are prominent in the spectrum in Figure 5(a). The first two peaks (924 and 1396 cm−1) correspond to C–H-related modes of polycarbonate, and the last one (2240 cm−1) is assigned to the C–N stretch mode in ABS. Since these three peaks are related to two of the most common polymers present in WEEE plastics, it is likely that their relevance in classification is associated to either changes in the polymer matrix correlated with the addition of BFRs in plastic manufacture, or other additives required for the embedding of BFRs in the polymer matrix. Moreover, polycarbonate is constituted of bisphenol-A units, and that TBBP-A is often used as a reactive BFR in polycarbonate resins (Alaee et al., 2003), that is, the BFR molecule is chemically bonded to the polymer chain. Therefore, it is possible that changes in some of the polycarbonate spectral features were strongly affected by addition of TBBP-A.
Figure 5(b) shows a comparison between the PC loadings spectrum for the most important PC in the AHS spectral range and the vibrational modes obtained from the literature, similarly to Figure 5(a). Since no specific C–Br-related features are available in the NIR range, the interpretation presented here is solely based on the WEEE polymer spectra. To assess in detail the contributions of the vibrational modes, the frequencies shown in Figure 5(b) were obtained from Beć et al. (2021). The spectral region containing the most prominent band in Figure 5(b) was attributed mainly to combination bands of C–H stretch modes or aromatic rings and ring deformation modes (νCHar+δ-ring). According to Beć et al. (2021), the combination bands in the NIR region are less sensitive to long range chemical environment effects. This could lead to higher selectivity to changes in vibrational modes due to more localized effects, such as the presence of Br atoms bonded to the aromatic rings, which in turn would explain the significance of the spectral region highlighted in Figure 5(b). In this regard, the same observation regarding identification of TBBP-A in polycarbonate resins made for the Raman spectra should also apply to the NIR region. The lower sensitivity of the NIR region to conformational changes in the polymer chain could also lead to a higher selectivity to the presence aromatic BFRs. However, this hypothesis would require a sample set for which the type of BFR is known for all the samples.
The above interpretations of significant wavenumbers for NIR and Raman also provide possible explanations for the different accuracies obtained with each model, as well as the enhancement observed when implementing the sensor fusion approach. When the spectral data of each technique is used separately, Raman outperformed the AHS, due to its ability to distinguish specifically the C–Br bonds. On the other hand, the higher selectivity to changes in the local chemical environment in the aromatic ring provided by the NIR spectral region may be responsible for the improved accuracy when data from both sensors were combined.
Conclusion
We developed a robust sensor-fusion approach to combine the advantages of Raman and NIR spectroscopies for characterizing BFR containing waste plastics. We identified, via a thorough process of nested cross-validation, ETC as the best performing classifier, and its optimal parameterization in terms of number of PCs and the segmentation threshold. The classifiers using both Raman and AHS data provided higher balanced accuracies than either one of the techniques alone, demonstrating the advantages of the sensor fusion approach. Our interpretation of the most important PC loadings provides qualitative evidence of the significance of the classifiers, reinforcing the robust aspect of the ETC approach. In future investigations, classifier models built using input spectral data acquired from samples with well characterized composition could provide additional clues to the potential selectivity in classification.
Although it is evident that the concentration thresholds for classification do not meet the concentration levels required by the EU regulations (POP, RoHS), this approach could be implemented as a screening step, where a rough classification of BFR-containing plastics could be combined with polymer identification. There could be further advantages in being able to sort the plastic waste samples based on also higher Br-level thresholds, as different debromination technologies are in development; based on the capacity of removal, the debromination processes could be better targeted and optimised for preservation of the polymer structure. Moreover, the AHS technique is readily applicable to online use, enabling the pre-sorting of the most harmful WEEE fraction.
Supplemental Material
sj-docx-1-wmr-10.1177_0734242X241287736 – Supplemental material for Raman spectroscopy combined with active hyperspectral sensing for classification of waste plastics containing brominated flame retardants: A sensor fusion approach
Supplemental material, sj-docx-1-wmr-10.1177_0734242X241287736 for Raman spectroscopy combined with active hyperspectral sensing for classification of waste plastics containing brominated flame retardants: A sensor fusion approach by Tuomas Sormunen, Ilkka Rytöluoto, Anna Tenhunen-Lunkka and Francisco Senna Vieira in Waste Management & Research
Footnotes
Acknowledgements
The authors are grateful to Kuusakoski Recycling for providing WEEE samples for the research, and THL for conducting GC–MS/MS measurements. The authors would like to thank Jari Havisto and Kirsi Korpijärvi for Raman and XRF measurements, Arttu Lämsä for providing supervision for data analysis, and Mikko Mäkelä for helpful discussions during the manuscript preparation.
Author contributions
Declaration of conflicting interests
The authors declared no potential conflicts of interest with respect to the research, authorship, and/or publication of this article.
Funding
The authors disclosed receipt of the following financial support for the research, authorship, and/or publication of this article: This work has been supported by the EU H2020 project NONTOX (grant agreement 820895) and Business Finland project PLASTin (decision 8619/31/2019).
Supplemental material
Supplemental material for this article is available online.
References
Supplementary Material
Please find the following supplemental material available below.
For Open Access articles published under a Creative Commons License, all supplemental material carries the same license as the article it is associated with.
For non-Open Access articles published, all supplemental material carries a non-exclusive license, and permission requests for re-use of supplemental material or any part of supplemental material shall be sent directly to the copyright owner as specified in the copyright notice associated with the article.