
Abstract
The Pew Charitable Trust’s 2020 report ‘Breaking the Plastic Wave’, indicates that existing technologies could support an 80% reduction in plastic leakage relative to business as usual by 2040. Therefore, South Africa became the first country to work with the Pew Charitable Trust and Oxford University to test and apply ‘Pathways’, a modelling framework and software tool which stemmed and evolved from the Pew report, at country level. The tool calculates the flows of plastics in the economy and the impact of various strategies to reduce future plastic pollution. The Scenario Builder within the Pathways tool allows the user to optimise flows in the plastics value chain to satisfy a set of defined objectives in order to achieve an optimal solution. Three major findings have emerged from the application of Pathways at country level for South Africa. Firstly, plastic pollution is set to almost double by 2040 if no interventions are implemented. Secondly, meeting the newly legislated extended producer responsibility (EPR) targets set for plastic packaging can avoid 33% of projected total pollution over the period of 2023–2040. Lastly, an optimal system change can avoid 63% of total plastic pollution over the period 2023–2040. Thus, applying Pathways at country level in South Africa has proven to be valuable by setting a baseline against which progress towards reducing plastic pollution can be measured; determining the outcome of meeting the legislated EPR targets over time, and informing policy decisions by allowing users to model different scenarios towards an optimal system change scenario.
Keywords
Introduction
Plastics are increasingly found where they do not belong, ranging from remote places such as St Helena, Goch and the Falkland Islands (Barnes et al., 2018), Mount Everest at 8440 m elevation (Napper et al., 2020), snow cores of glaciers in Iceland (Stefánsson et al., 2021), arctic snow (Bergmann et al., 2022), stomachs of wildlife, birds and fish (Bergmann et al., 2022) and in human blood samples (Kumar, 2018), stools (Schwabl et al., 2019) and placentas (Braune et al., 2021). As a result, plastic pollution has become an issue of global concern. The ‘Breaking the Plastic Wave’ study published in 2020 (Lau et al., 2020a) provided the first global assessment to reduce plastic pollution. Applying a first of its kind modelling tool, this study concluded that annual plastic leakage to the ocean can be reduced by about 80% in the next 20 years by applying existing technologies and solutions, but the supporting infrastructure, policies, business processes and financing are still lacking. The identified interventions include reduction in plastic production and use, substitution of plastic with paper and other compostable materials, design products and packaging for recycling, increase collection rates, increase recycling and properly dispose of plastics that cannot be recycled economically (Lau et al., 2020a). To achieve this 80% reduction requires all interventions to be implemented concurrently, ambitiously and starting immediately. The 5th United Nations Environmental Assembly (UNEA-5) that took place in Nairobi Kenya from 28 February to 2 March 2022 adopted, as Resolution 14, a pathway towards an international legally binding instrument to end plastic pollution (UNEA-5, 2022). This initiative is supported by more than 175 countries and 600 observer organisations participating in the International Negotiating Committee (INC) convened by the United Nations. Importantly the global treaty aims to address all parts of the plastics life cycle and is developed following a consensus seeking negotiations process. The final treaty is expected to be adopted in 2025.
According to Statista (2023), the world produced an estimated 400 million tonnes of plastic in 2021 and the annual global plastic waste generation is close to 350 million tonnes. If current practices and policies remain unchanged, plastic waste is projected to triple by 2060, while an estimated 30 million tonnes of plastic waste have accumulated in the oceans between 1970 and 2019. Perhaps more concerning is that less than 10% of plastic waste is recycled per year, the remaining collected plastics is simply incinerated or disposed of at landfill, where it will take up to 500 years to decompose. As much as 25% of plastic waste is thought to be mismanaged and a large portion of the mismanaged plastic waste is burned at open dumps, posing a threat to human health and contributing to local air pollution and climate change.
Given the growing problem with plastic pollution and the global trade flows in plastic polymers and chemicals in plastics, plastic products and plastic waste, a global treaty is seen as an essential policy instrument to end plastic pollution. The global commitments and binding regulatory instruments will need to align with the national context so that they are in accord with national policy and are in accordance with national action plans. The first step to support local action entails gathering evidence for taking informed action. Every country must take stock of the internal plastic waste flows, including the end-of-life management and fate of plastic waste. Therefore, the South African experience in applying Pathways to develop an evidence-based strategy to address plastic pollution in South Africa excited the authors about the potential of this tool to also assist other countries in developing strategies based on local conditions and data to reduce plastic pollution.
Pathways is a modelling framework and software tool, which evolved from the Pew Charitable Trust’s ‘Breaking the Plastic Wave’ report. Pathways enables the analysis of current and projected plastic material flows and the effects of strategies and policy interventions on reducing plastic pollution. In addition, it provides an opportunity for multi-objective optimization which in the South African context, was guided by the need to reduce plastic pollution and greenhouse gas (GHG) emissions, while ensuring socio-economic development by providing jobs and infrastructure at reasonable cost.
Materials and methods
Applying Pathways starts with the development of a local system map, indicating all plastic flows including managed and mismanaged waste at local level (refer to Figure 1 for the South African system map). The Pathways tool is data intensive. It requires plastic-specific data representing all the flows as illustrated on the system map. Data requirements include total plastic waste, waste generation per capita, projected annual growth in waste generation, and the proportion split between the three plastic categories, namely rigid, flexible and multi (i.e. multi-material or multi-layered) in the waste stream. The data were sourced from secondary sources including scientific literature, industry and government reports, and data bases. All data sources as well as the rationale for key assumptions were documented and appended to the South African report by Stafford et al. (2022).
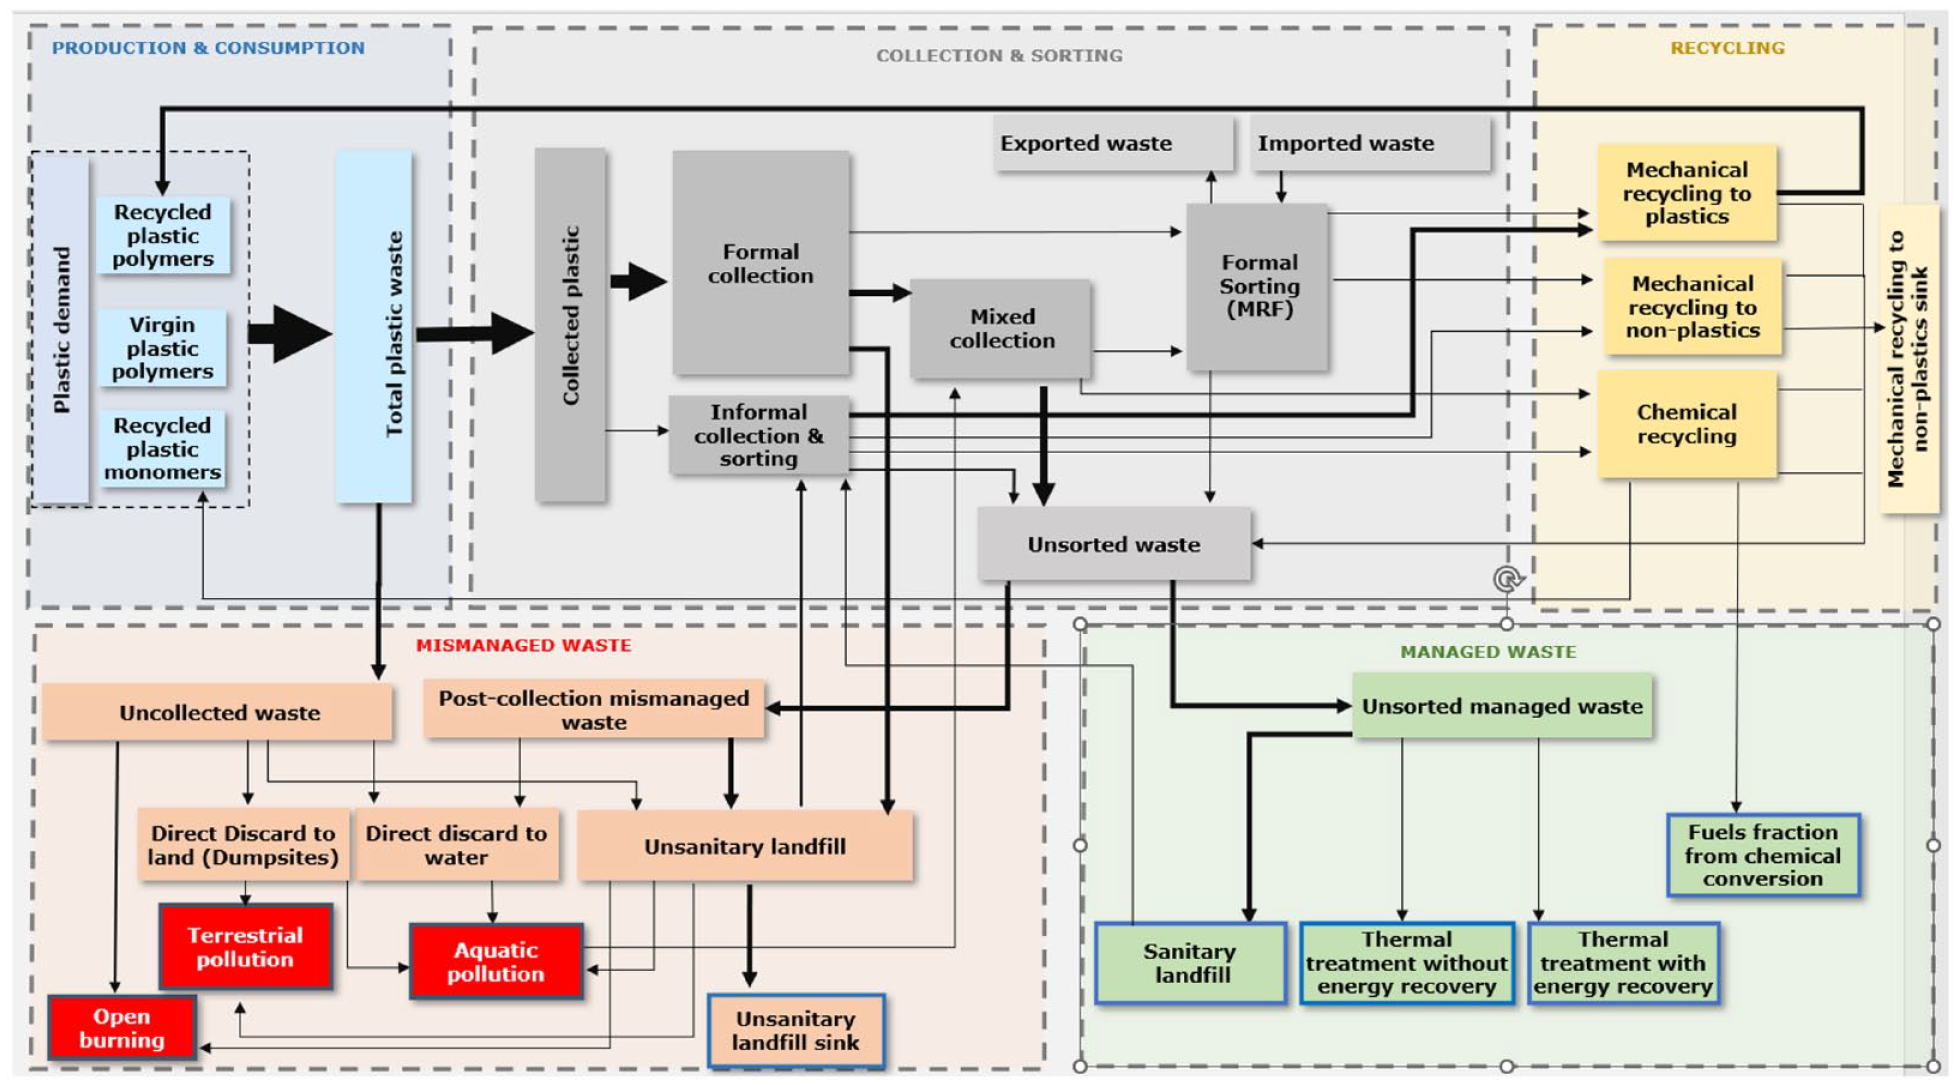
System map for South Africa showing plastic flows in 2020. The arrow width indicates the plastic mass flow (Sankey diagram) (Stafford et al., 2022).
Data gaps were filled by sourcing expert opinion from the South African plastics sector and waste management consultants and researchers with relevant experience. Where data gaps could not be filled for South Africa, archetype data from the global model (developing country, upper middle-income (UMI) archetype) were critically assessed and, where appropriate, used to fill these gaps. The global study developed eight geographic archetypes according to the World Bank income categories and the United Nations urban–rural classifications (Lau et al., 2020a). Uncertainty of the data used in the analyses was addressed by using the pedigree scoring framework developed by Lau et al. (2020b). Applying uncertainty levels to the data used for the analysis was a critical part of the modelling exercise and provided with interval of confidence in the results.
Existing data were used for the period 2016–2020 (last year for which historical data is available for South Africa), after which trends were projected into the future (Stafford et al., 2022). Projected growth in demand for plastic is calculated using country level population statistics and the per capita estimate for the macro-plastic component of municipal solid waste. The leakage potential for plastic is calculated based on waste management processes implemented. The population is differentiated by their distance to a water body (<1 km or >1 km) to estimate the relative flows of plastic pollution to terrestrial or aquatic (freshwater and marine) systems (Stafford et al., 2022).
Data for GHG emissions were sourced from Goga et al. (2023) and from the UMI archetype when data were not available as reported in Table 1. The scenario projected the future path based on current development without any carbon mitigation policy targets. It also assumes no future changes in the carbon-intensity of South Africa’s plastic polymer production and the future ability of Sasol to retain its market share in local plastic polymer consumption. This aligns with the ‘Business-As-Usual’ of South Africa’s Long-term Mitigation Scenario (DFFE, 2009). It can be argued that this may not represent the most likely development path and that further investigation of the GHG footprint of plastics should also consider the decarbonisation of South Africa’s energy supply. This would reduce the plastics GHG footprint in line with South Africa’s decarbonization targets: the Peak-Plateau-Decline in DFFE (2009), the increasing share of renewables in the supply mix as per DFFE (2013 and the ‘Reference’ and ‘Least Cost’ scenario in Wright and Calitz (2020).
Historical data and projections on GHG emissions factors (Stafford et al., 2022).
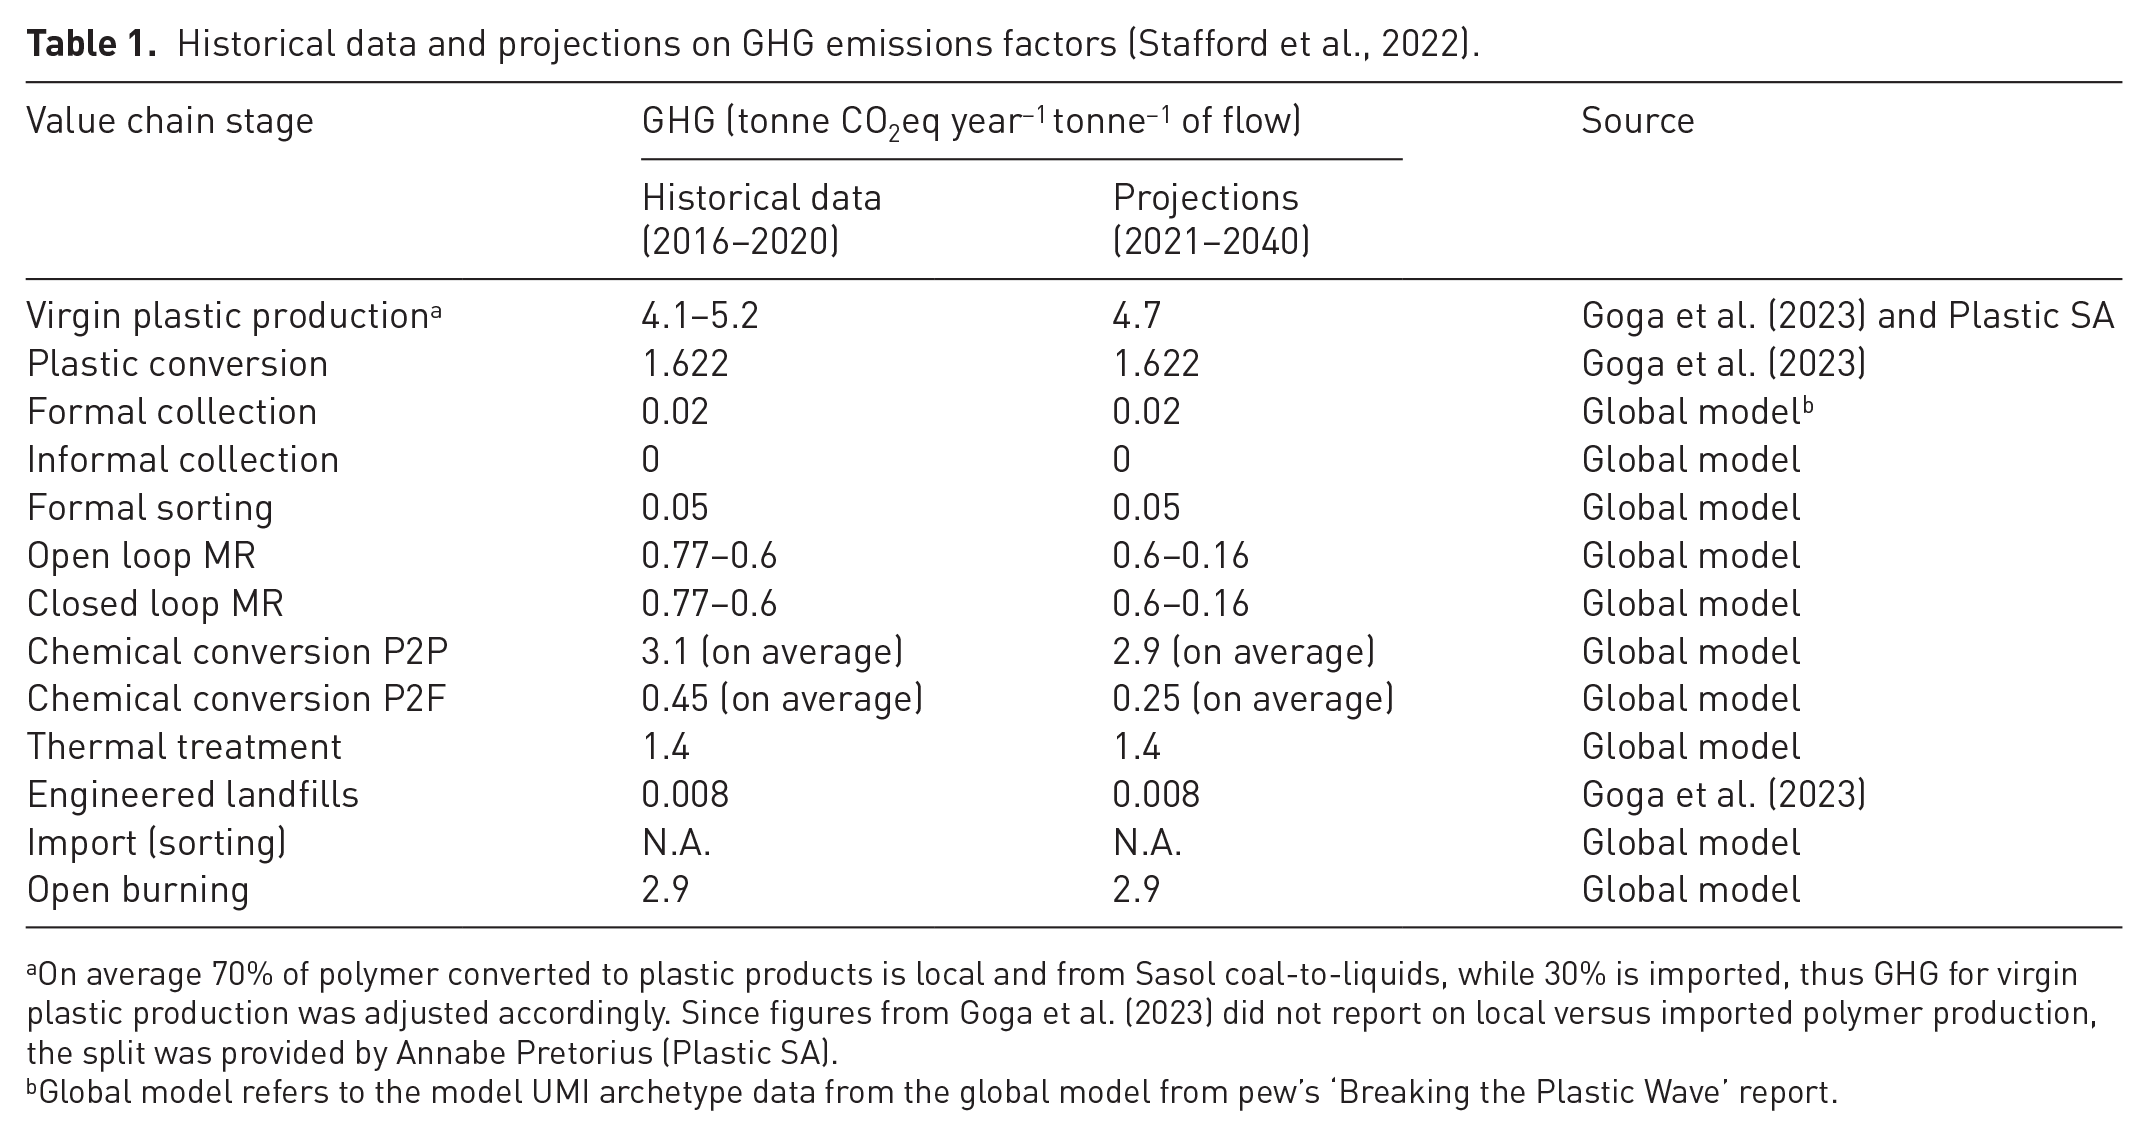
On average 70% of polymer converted to plastic products is local and from Sasol coal-to-liquids, while 30% is imported, thus GHG for virgin plastic production was adjusted accordingly. Since figures from Goga et al. (2023) did not report on local versus imported polymer production, the split was provided by Annabe Pretorius (Plastic SA).
Global model refers to the model UMI archetype data from the global model from pew’s ‘Breaking the Plastic Wave’ report.
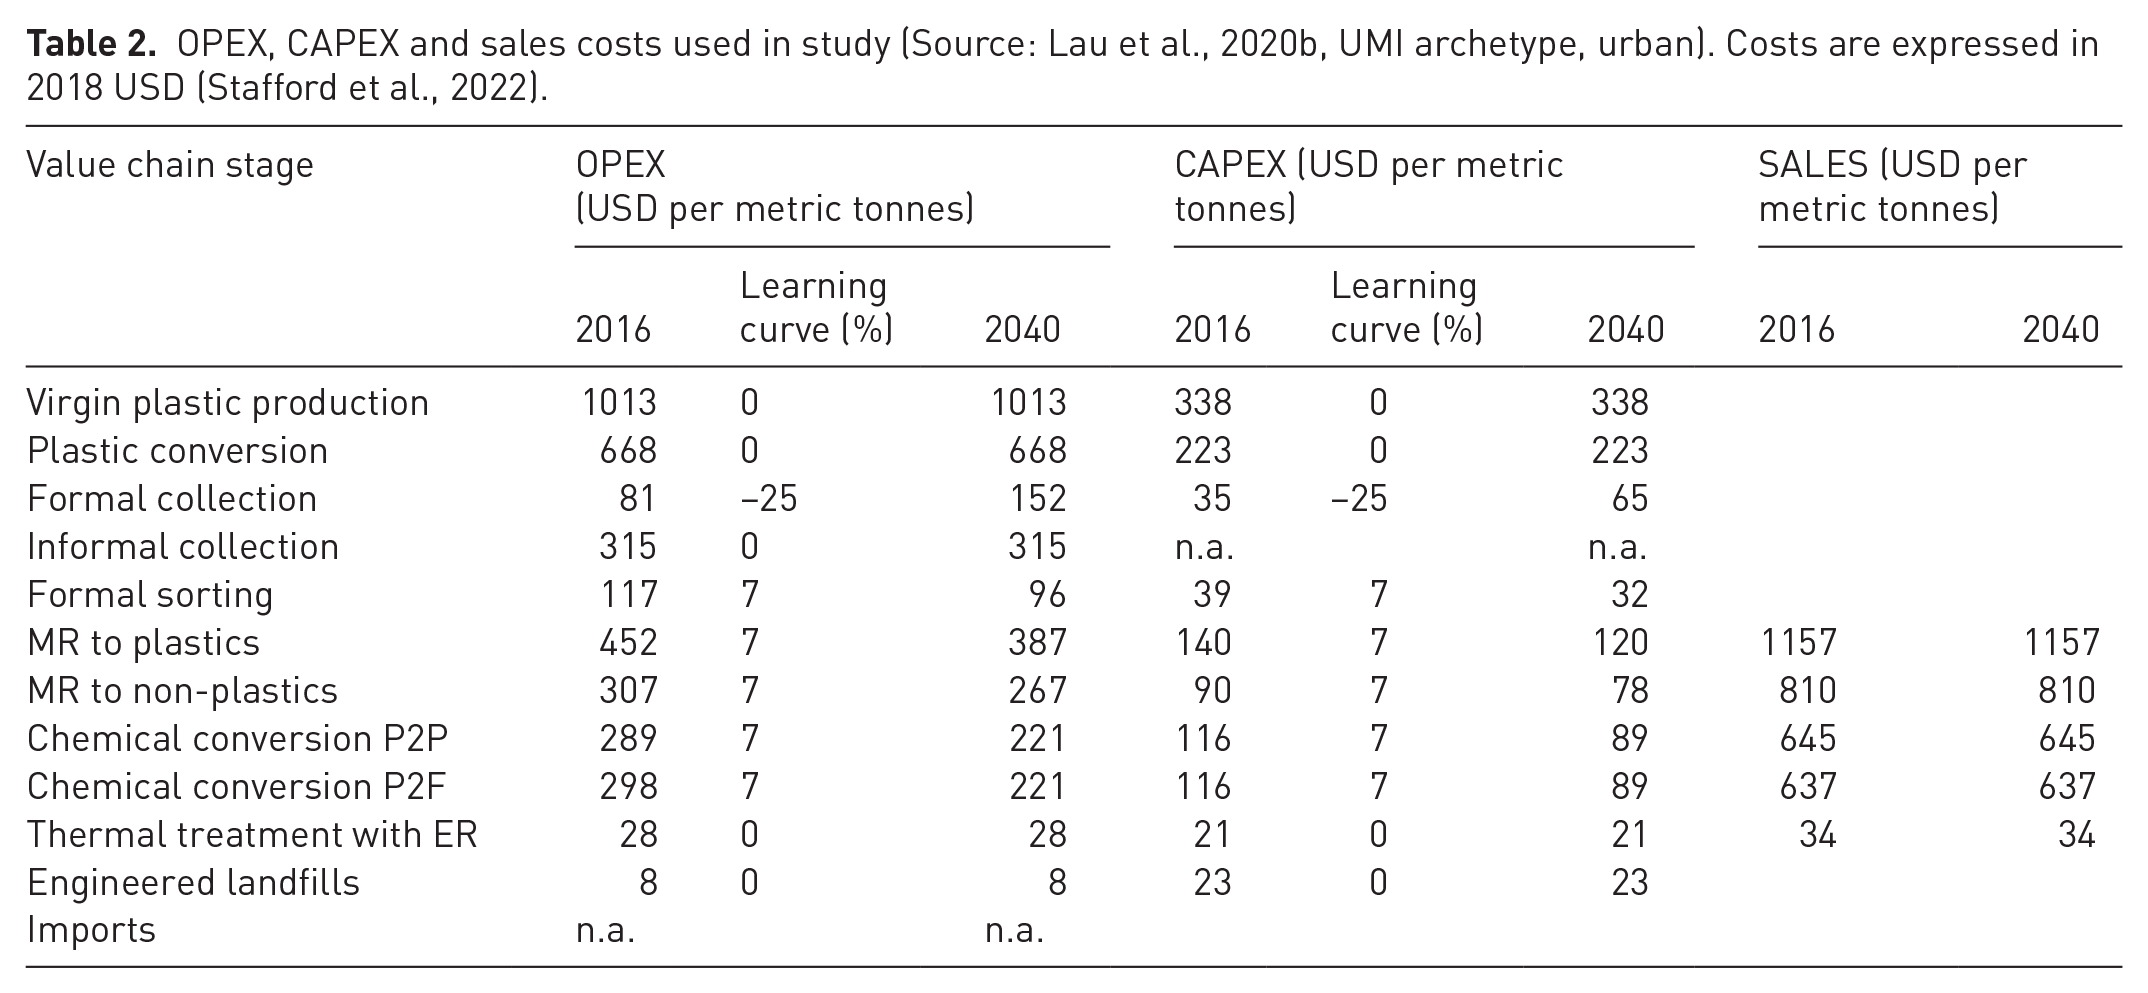
Due to the lack of data for costs (OPEX, CAPEX and sales) for the South African context (data were very sparse), the model relied entirely on the UMI urban archetype data for costs as per Lau et al. (2020b). Costs (in constant 2018 US dollars) are divided into capital costs (CAPEX) and the operational costs (OPEX) as well as capital expenditure that are amortised over the asset lifetime. Costs are calculated as a function of modelled plastic flows, with changes in costs due to production scale and technological advancement accounted for through learning curves and returns to scale (Stafford et al., 2022). Table 2 details the costs, OPEX, CAPEX and sales costs (used to calculate revenues) in 2016 and 2040, the latter is reported as a result of the said learning/experience curve. In alignment with the approach in Lau et al. (2020b) all costs were reported as NPV (net present value: OPEX+CAPEX-Revenues) to which was applied a 3.5% discount rate (ibid).
OPEX, CAPEX and sales costs used in study (Source: Lau et al., 2020b, UMI archetype, urban). Costs are expressed in 2018 USD (Stafford et al., 2022).
Data on employment were scattered and sourced from Plastics SA (2019) as well as a government report on the manufacturing sub-sectors (TIPS, 2021). It was further augmented with urban UMI archetype data trends for both historical data and future projections. Informal employment (reported as employment opportunities) were estimated at (60 kg day−1) and multiplied by the number of informal income opportunities reported by Plastics SA (2019). The input figures for employment are provided in Table 3.
Input figures for employment (Stafford et al., 2022).
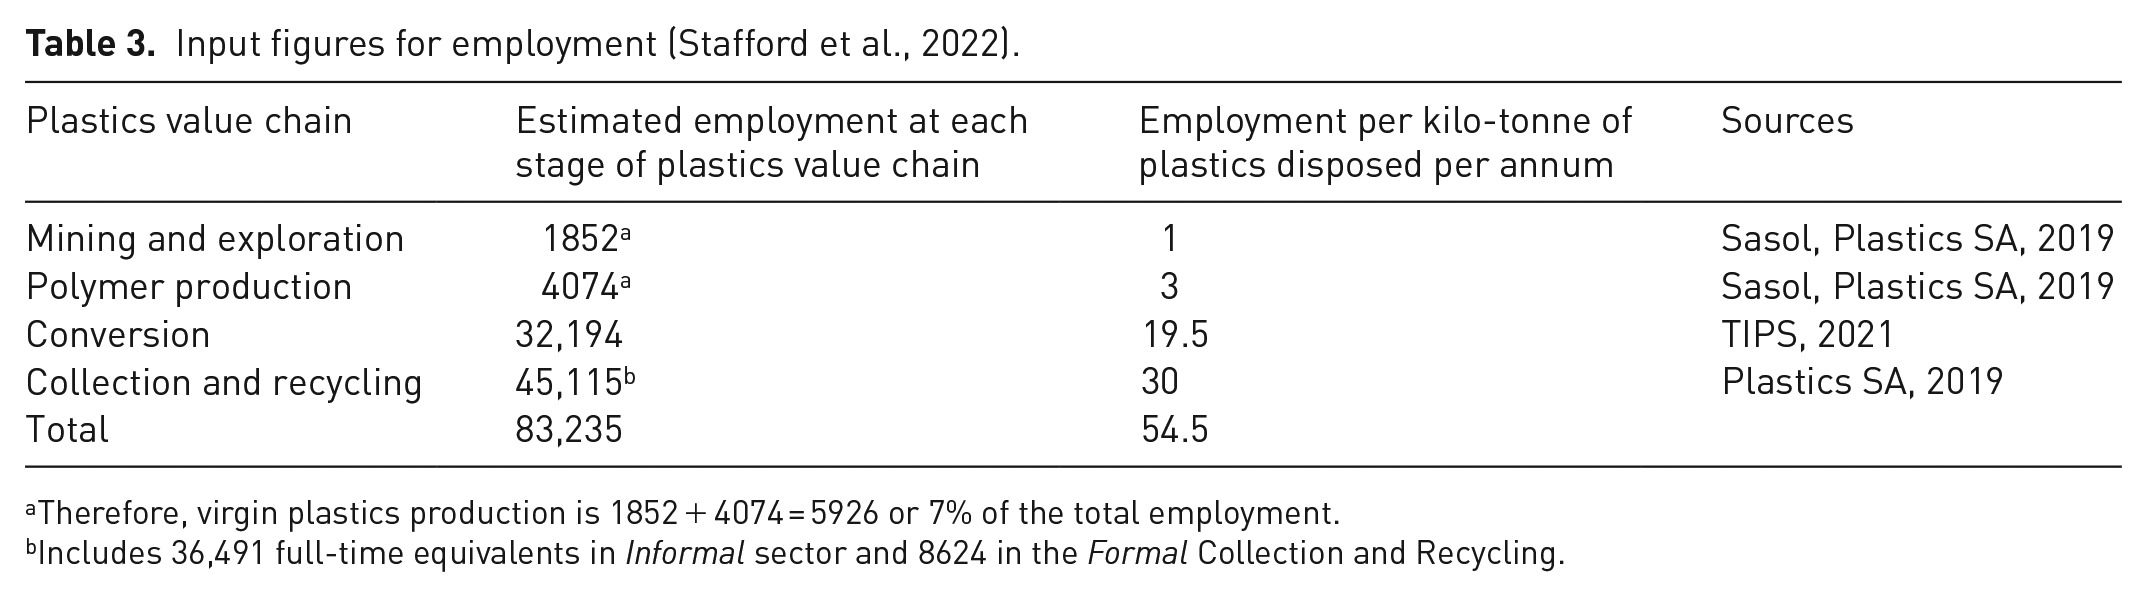
Therefore, virgin plastics production is 1852 + 4074 = 5926 or 7% of the total employment.
Includes 36,491 full-time equivalents in Informal sector and 8624 in the Formal Collection and Recycling.
However, the model requires employment per tonne product at each stage of the plastic value chain which was calculated as explained in Stafford et al. (2022). The calculated jobs input into the model is provided in Table 4.
Jobs input figures to the model (Stafford et al., 2022).
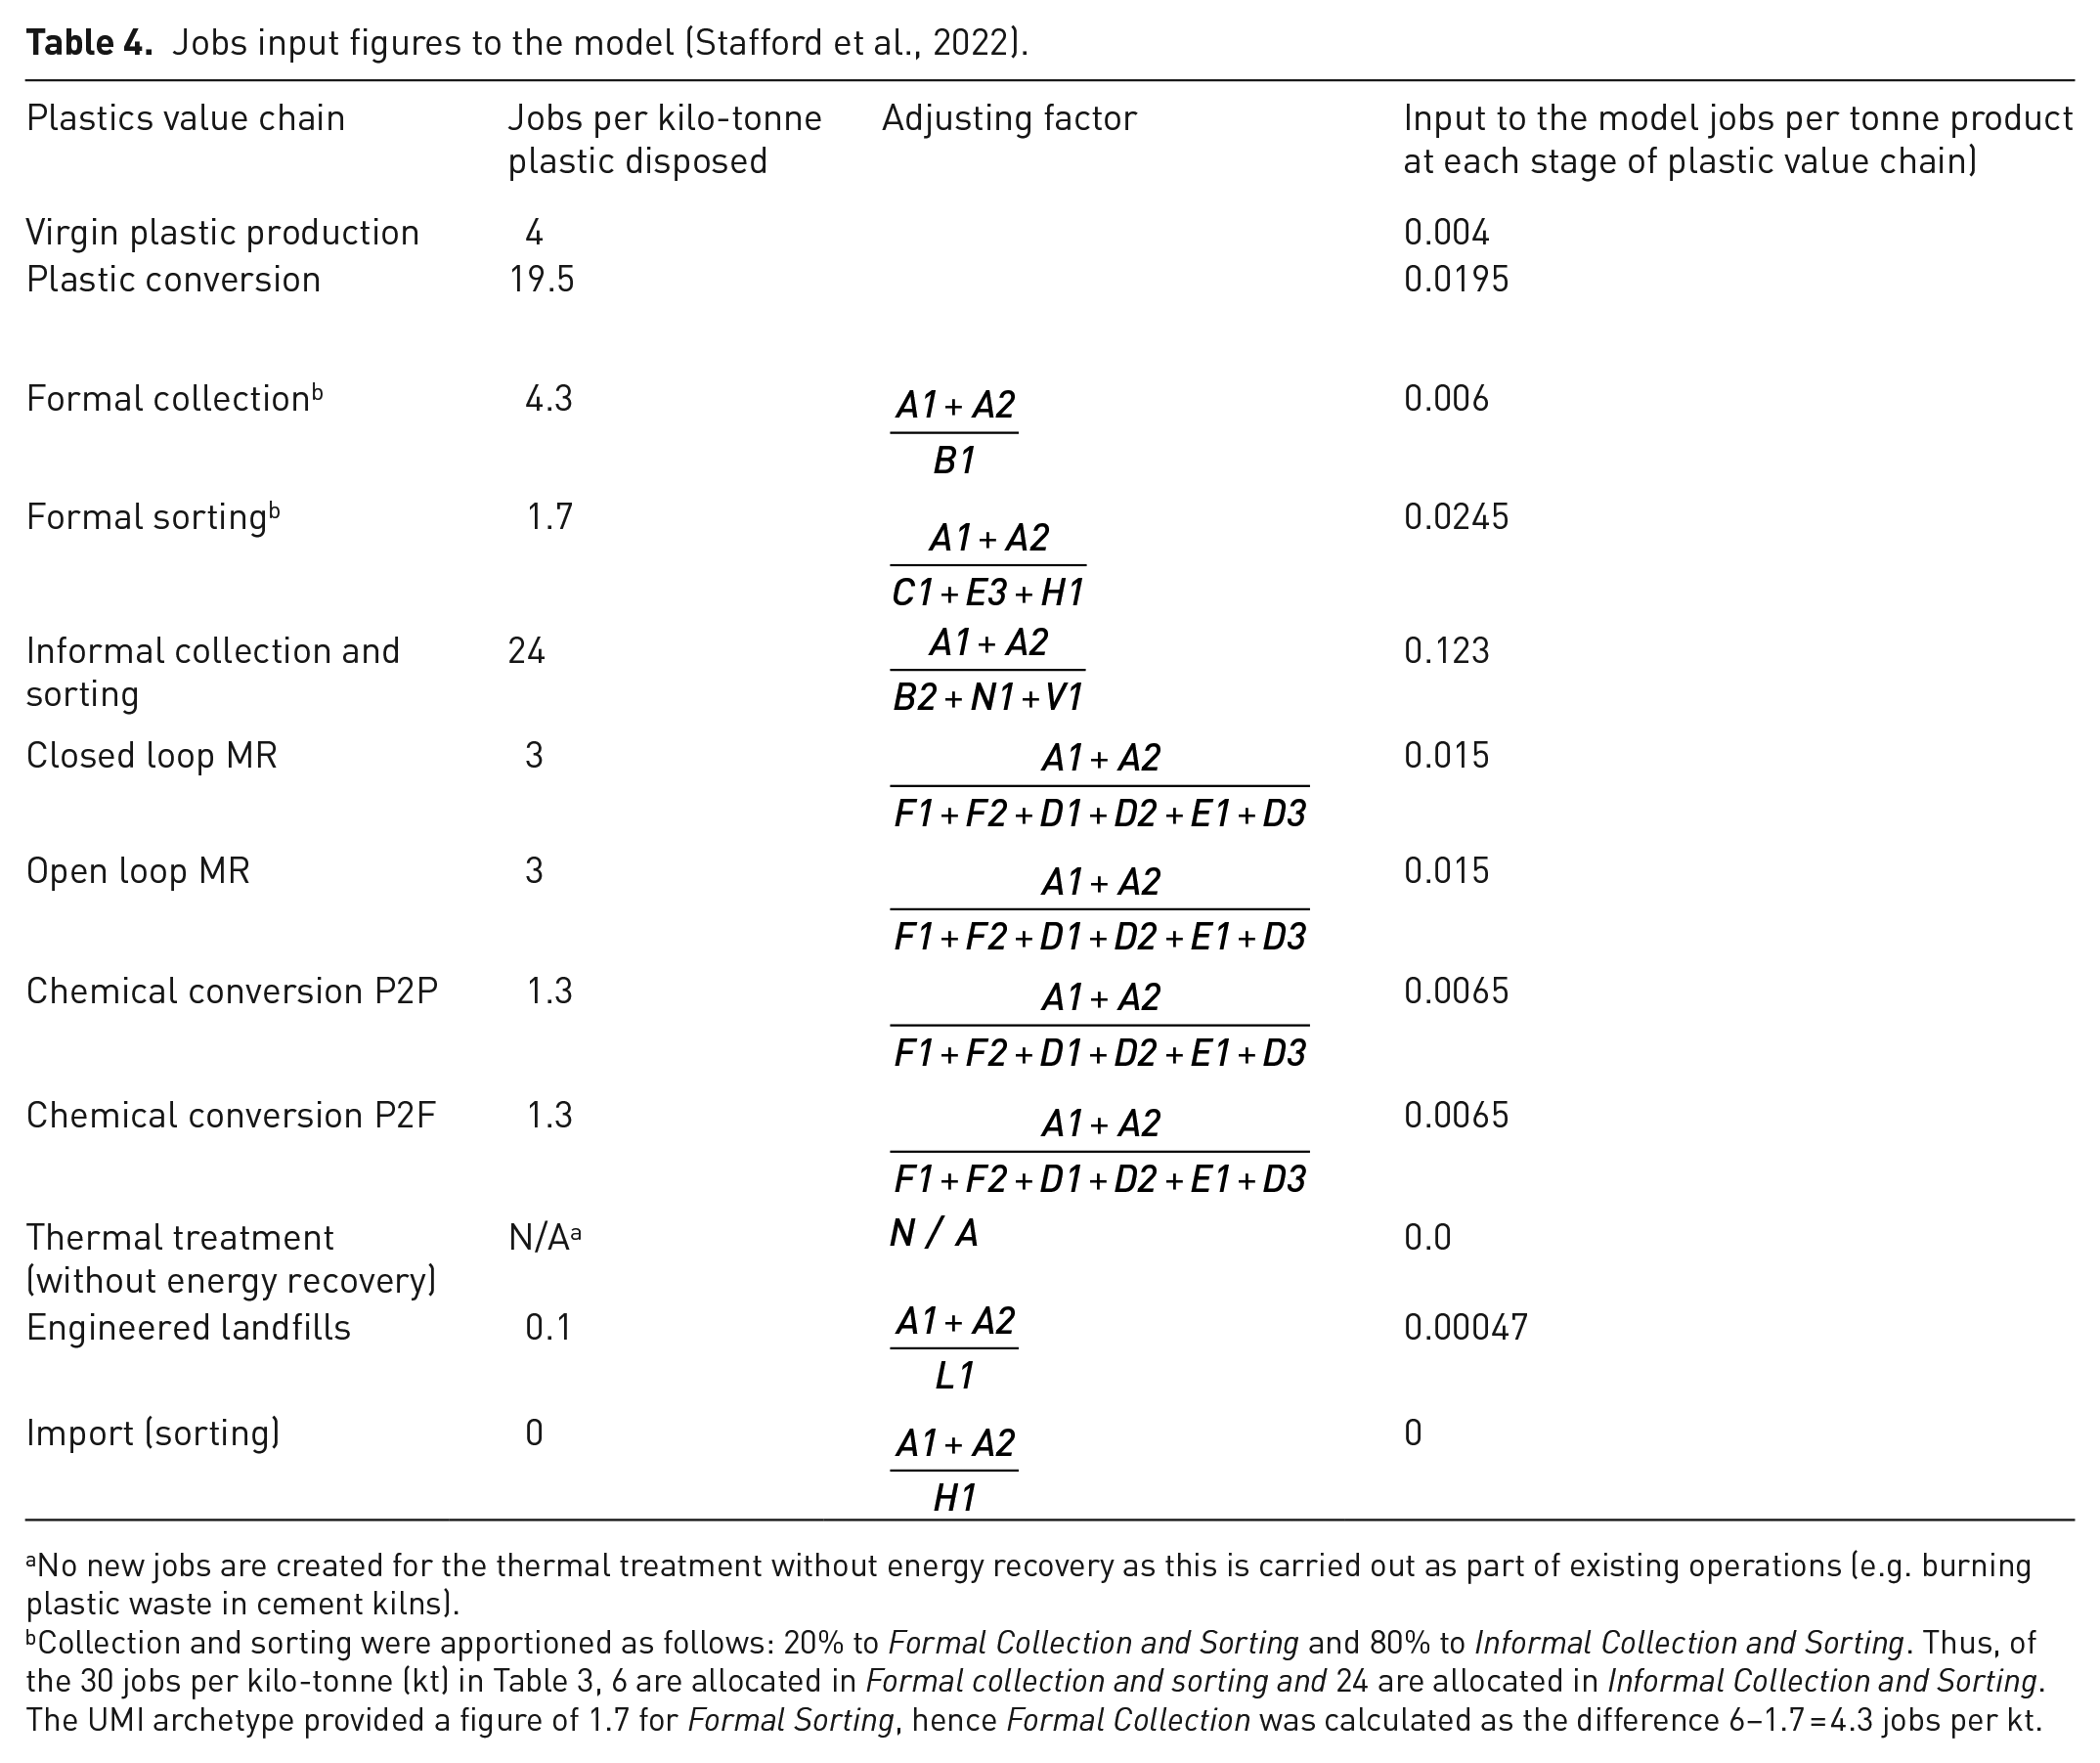
No new jobs are created for the thermal treatment without energy recovery as this is carried out as part of existing operations (e.g. burning plastic waste in cement kilns).
Collection and sorting were apportioned as follows: 20% to Formal Collection and Sorting and 80% to Informal Collection and Sorting. Thus, of the 30 jobs per kilo-tonne (kt) in Table 3, 6 are allocated in Formal collection and sorting and 24 are allocated in Informal Collection and Sorting. The UMI archetype provided a figure of 1.7 for Formal Sorting, hence Formal Collection was calculated as the difference 6–1.7 = 4.3 jobs per kt.
Pathways, was used to model three distinct scenarios, namely, (1) a Business-as-Usual (BAU) scenario which assumes that current plastic-related policies, economies, infrastructure and materials, as well as cultural norms and consumer behaviour remain unchanged; (2) an Extended Producer Responsibility (EPR) scenario, which assumes that the 5-year EPR targets relating to the collection and recycling of plastic packaging are implemented and enforced and (3) an Optimal System Change (OSC) scenario, which seeks to identify an optimal solution for South Africa’s sustainable development that balances environmental objectives of minimising plastic pollution and GHG emissions, with socioeconomic objectives of minimising costs and maximising jobs. Those three objectives somehow trade off against each other; hence, the Pathways model help to find the sweet spot (optimal solution) which satisfies all objectives. The OSC scenario combines strategies of increasing plastics waste collection, recycling and safe disposal to sanitary landfill, and reducing the demand for plastics.
Estimates based on national statistics suggest that 37% of households in South Africa do not have access to weekly waste collection services, leaving 29% of all generated household waste uncollected (Rodseth et al., 2020). While collected waste is disposed of at municipal landfill, many of these sites are not managed in accordance with national norms and standards for disposal of waste to landfill. In addition, uncollected waste is typically dumped and/or burned in the environment causing pollution. Consequently, plastic waste mismanagement causes plastic leakage (from both uncollected waste and the collected waste, which is subsequently improperly disposed at landfill) to the environment, where it impacts air quality, water and land resources. South Africa’s waste management practices and the percentage of the population living in proximity (<1 km) to water bodies were used to model plastics leakage and the fate of the plastic pollution in the receiving environment.
Results and discussion
The informal waste sector collects 76% of all plastic that enters recycling, whereas most plastics is collected as mixed municipal solid waste with limited plastic separation at source. South Africa generated an estimated 1546 kt of total plastic waste in 2020, of which 1350 kt was collected and mostly disposed of at landfill, whereas 196 kt remained uncollected. Only 301 kt of plastics were recycled representing a 19% recycling rate of the total plastic waste disposed, or 22% recycling rate of total plastic waste collected. Due to the growing production and consumption of plastics, the lack of a circular economy for plastics, as well as the high prevalence of uncollected waste and the mismanagement of disposed waste, results in 488 kt of waste plastic leaking into the environment; contributing to air pollution through open burning (275 kt), land pollution (145 kt) and aquatic (freshwater and marine) pollution (68 kt) (Stafford et al., 2022).
Currently, under a BAU system, there is a 1.33% projected growth in plastic consumption per annum and plastic pollution is set to almost double in 20 years (Figure 2(a)). The GHG emissions associated with plastic will increase by 63% over the same period. The recently legislated 5-year EPR targets for plastic packaging in South Africa, will potentially avoid 33% of total plastic pollution over the period 2023–2040 (aquatic pollution will be reduced by 25%, land pollution by 33% and air pollution from open burning by 35%, respectively), compared to BAU (Figure 2(a) and (b)). The OSC scenario (Figure 2(c)) will potentially avoid 63% of total plastic pollution over the period 2023–2040 compared to the BAU scenario (i.e. aquatic pollution will be reduced by 56%, plastic to land by 66% and air pollution from open burning by 63%). In addition, the OSC scenario also avoids 37% of projected GHG emissions and reduces the required investment by 67% as a result of avoided capital costs for plastic production, conversion and disposal, while also increasing job opportunities by 3%, compared to the BAU scenario. The OSC scenario requires a combination of strategies with a 2.67% annual reduction in plastic demand, a 4.9%, increase in plastics waste collection and recycling, as well as a 3.4% increase in the safe disposal of plastic waste to sanitary landfill so that the waste is contained in situ.
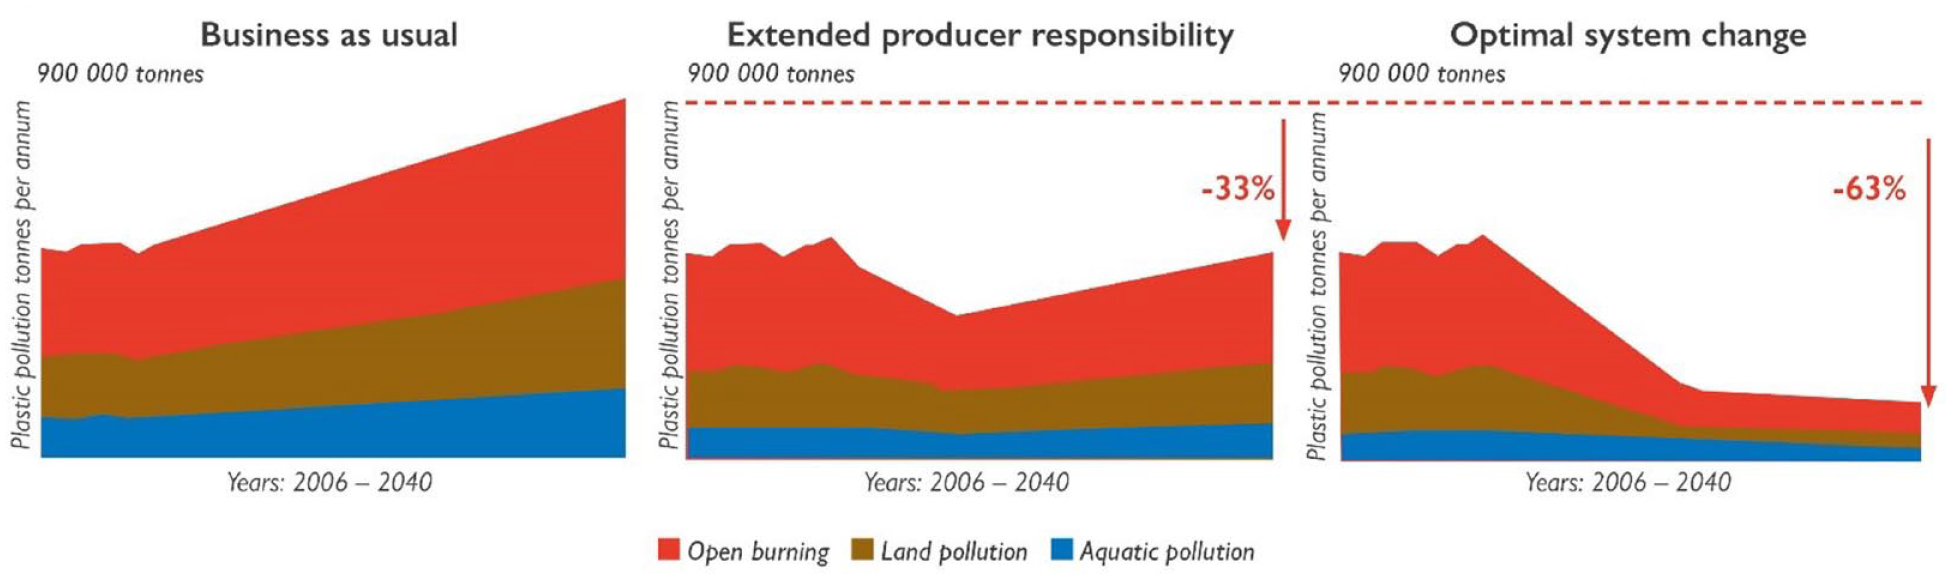
Scenario comparison: (a) BAU, (b) Meeting EPR targets for plastics, and (c) OSC scenario, which combines the strategies of reducing demand, increasing collection and recycling, and increasing safe disposal to sanitary landfill (Stafford et al., 2022).
Although the current waste management systems in South Africa are not conducive to plastic pollution mitigation, and the policy and legislative interventions currently considered will only slow down pollution impacts over time, the OSC scenario has shown that it is more likely to have a long-term positive impact. It should be noted that the scenarios tested did not account for growth in plastic waste imports for recycling, due to lack of local reliable data, despite the possible economic opportunities that it may bring for the South African recycling business.
The global Pathways study revealed that additional infrastructure is needed in the interim to dispose of 23% of plastics that cannot currently be recycled economically and that plastic waste exports to countries with low collection and high leakage rates must be reduced by 90% (Lau et al., 2020a). Therefore, this intervention calls for a change in current plastic waste trade. It implies that Asia, currently responsible for 80% of the global plastics flow to oceans (Statista, 2023), should not be importing waste plastics, but it does not provide a solution to the current plastic waste exporting countries.
In addition, there is a risk that plastic importing countries with high plastics leakage to the environment may follow China’s example and ban the imports of certain plastics. The China ban is well aligned with the pathway proposed by Lau et al. (2020a), but the ban had serious negative consequences for many waste plastic exporting countries. It threw the global recycling system into chaos (Katz, 2019) and resulted in a drop in the price being paid for recyclable plastics in Africa (Oelofse et al., 2018).
Given the importance of international trade to social and environmental impacts, there is a need to better understand the drivers of plastic waste imports and the role that recycled plastic plays in producing products (Huang et al., 2020). These drivers could influence national policy responses in reaction to the treaty. Although developing countries may lack proper waste collection and disposal systems to manage waste, the China ban has opened-up business opportunities for recyclers in developing countries to import plastic waste as feedstock. Furthermore, the treaty is likely to strengthen the push for developing recycling capacity and governments may see the benefit of developing local markets and processing facilities for recyclables to create resilience to global shocks in the plastic recycling market. Unfortunately, there is a risk that these opportunities could be exploited to the detriment of developing countries and their people, if not properly managed (Oelofse et al., 2018). This is especially a concern where developing countries offer inexpensive labour, lax environmental regulations combined with low health and waste disposal costs (Wang et al., 2020).
Adding plastic waste under the Basel Convention was a first attempt to regulate trans-boundary movement of plastic waste by the United Nations. However, the USA is the largest plastic waste exporter in the world, but is not party to the Basel Convention and therefore not subject to its regulations (Wang et al., 2020). This is a clear indication that the international treaty may not solve the plastic pollution issue if all member states are not part of the negotiations or if consensus on key issues are not reached. For the INC global treaty to be successful in addressing global plastic pollution, it is imperative to have support from all the main plastic waste trading countries as well as the main players in plastic production across the full value chain of plastics. This includes plastic polymer production, chemicals in plastics, plastic products as well as plastic waste and recycling. Ensuring that interventions cover the full value chain of plastics and there is a harmonious global regulation of problematic plastic products and chemicals is needed, together with agreed targets to end plastic pollution. The INC global treaty aims to achieve consensus on these aspects through a legally binding instrument that also addresses global trade of plastics and includes market-based instruments and financial mechanisms to govern the trade in plastic waste and recyclables. The success of reaching global agreement on these aspects underpins the global negotiations of the INC with some member states proposing a global EPR system.
Conclusions
Similar to the Intergovernmental Panel on Climate Change negotiations on climate change, reaching consensus on plastic pollution is a challenge but a necessity to achieve global impact. To implement the requirements of the global treaty will require cognizance of the local context and need for country-specific interventions. It is therefore advisable that all countries must first gain an understanding of the plastic flows in their economy and then understand the entire value chain, including the end-of-life plastic waste management in order to develop evidence-based strategies to reduce plastic pollution within their areas of jurisdiction. Pathways as applied in the South African case study provides clear guidance on where the plastic pollution issues are most pressing, and where interventions are effective in reducing plastic pollution. Furthermore, it provides insight into the effectiveness of integrated solutions that address the whole value chain of plastics and enables an assessment of multiple development objectives to be included in the scenarios for reducing plastic pollution and contributing to sustainable development.
Footnotes
Declaration of conflicting interests
The authors declared no potential conflicts of interest with respect to the research, authorship, and/or publication of this article.
Funding
The authors disclosed receipt of the following financial support for the research, authorship, and/or publication of this article: The authors would like to thank Pew Charitable Trusts and Oxford University for allowing South Africa to be the first country to test and apply Pathways at country level and the South African Department of Science and Innovation through the Waste Research Development and Innovation Roadmap for funding the application of Pathways.