
Abstract
Most ocean plastic pollution results from leakage from waste management activities on land, mainly in coastline communities. In this research, the digitalization of waste management will be evaluated to improve the prevention of leakage. The digitalization means introducing mobile apps into the waste bank that can improve waste management efficiency while providing reliable data. The data on waste management were gained from Griya Luhu App which has been used in 13 villages around Gianyar, while the waste generation was calculated from 97 samples. Then, the villages were categorized by their potential risk of waste leakage based on their distances from the shore. First, the growth of digital waste banks based on the number of units, the number of customers and the amount of waste-managed was analyzed. Second, the composition of waste collected was evaluated. Last, inorganic waste generation (IWG) from digital waste banks was reduced. The results showed that digital waste banks and the customers had grown rapidly in 1 year. The number of waste bank units grew from 0 to 80 with an increase to a total of 5500 customers during the same period with a maximum of 20 tons of waste managed per month. In general, digital waste banks have shown promising performance in preventing waste leakage into the ocean with a 54.04% reduction of IWG. Compared to this reduction percentage, Tulikup as a high-risk village has a considerably low reduction (30.30%) and should be prioritized. Furthermore, the ability to manage a village with a high population/number of customers should be improved.
Highlights
The digital waste bank has shown a promising growth as a potential approach to improve waste management;
The digital waste bank can reduce 54% potential leakage of inorganic waste generation but its performance in high population villages needs to be improved
The digitalization of waste management provides a comprehensive information to optimize strategy and policy on preventing plastic leakage into the ocean.
Introduction
The issue of marine debris has been posing a rapidly growing concern in recent years due to its massive impact on ocean ecosystems and human safety (Engler, 2012; Gall and Thompson, 2015; Sheavly and Register, 2007). Amongst the types of solid waste, plastic waste is the majority of the waste that is leaked, as it amounts to only 10% of all solid waste but 80% of the waste that accumulates on land, shorelines, the ocean surface and the seabed (Barnes et al., 2009). It is estimated that around 5.25 trillion plastic particles equivalent to 268,940 tons of plastic are currently floating in the sea and about 10 million tons of plastic leak into marine environments every year (Boucher and Billard, 2019; Eriksen et al., 2014). Several countries with a relatively small land surface area compared to the length of their coastline and with high precipitation rates are more likely to discharge plastics into the ocean, such as Indonesia which contributed to discarded plastic waste leaking into the ocean to an extent of 6.8% of the total global figures (Meijer et al., 2021). Although some plastic waste directly comes from the ocean itself such as fishing nets, ropes and fleet waste, it only accounts for 20% of the total amount of plastic waste (Ritchie, 2021). The other 80% is leaked from the land through rivers and coastlines (Li et al., 2016). Highly densely populated and industrialized areas are the major sources of plastic waste generation from littering activities such as plastic bag and solid waste disposal (Derraik, 2002), while other factors such as coastal recreational activities, wastewater effluents, accidental raw material spillage, refuse-site leachate and extreme weather are also considered (Barnes et al., 2009; Browne et al., 2010; Lee et al., 2013; Redford et al., 1997). This is also highly related to the significant increase of plastic production from 1.5 million metric tons in the 1950s to an estimated 368 million metric tons in 2019, with about 50% of plastic products intended to be disposable (Hopewell et al., 2009; Tiseo, 2021). Unfortunately, this massive production of disposable plastic is not followed up with significant improvements of waste management.
There are many solutions that have been tried and tested for this problem. They vary from creating alternative products to improving the waste management systems. One instance is the modification of algae to make bioplastic including from food waste (Chong et al., 2021, 2022). There are also many waste management practices that have been applied for solid waste like plastic, which are landfilling, incineration, composting, land spreading and recycling, with different impacts on human health (Giusti, 2009). Apart from these centralized waste management practices, the recent approach is developing source-based waste management, which focuses on managing waste at the earliest stage possible. This strategy might vary with respect to its names and techniques, but it normally includes separation from the source, community-based management, local value approach and collective behaviour changes (Pasang et al., 2007; Sekito et al., 2013; Zhuang et al., 2008). One prominent example is waste bank, which has been growing rapidly in Indonesia in recent years (Wulandari et al., 2017). The waste bank management system works like the activity of buying and selling recyclable materials such as plastic, paper, metal, glass and others, but, instead of providing cash money, it normally converts payments into other incentives such as savings, health services and/or community support (Dhewanto et al., 2018). This strategy will reduce waste from the source while increasing the recyclability of non-organic waste, apart from its benefit as an income generator (Singhirunnusorn et al., 2012). Unfortunately, most waste banks have several weaknesses such as poor administrative development, unclear economic benefits and lack of communication (Dhewanto et al., 2018). The waste bank system is hardly applied using paper-based records as it has to deal with many different types of recyclable materials.
To tackle this limitation, digitalization of waste banks is a potential solution for waste bank management to reduce potential marine litter. Various recent technologies have been applied in waste management to improve its quality, which include Internet of Things, Artificial Intelligence, Robot Automation and others (Abdallah et al., 2020; Beliastis et al., 2018; Sarc et al., 2019; Teng et al., 2020). With respect to waste banks, there is a rising digitalization that may lead to improvement and tackling some limitations of paper-based management of waste banks. Furthermore, it helps us quantify the contribution of this method to preventing ocean plastic pollution, which is hardly applied in the paper-based method. One prominent organization is Griya Luhu, a digital waste bank that promotes the integration of digital technology and community empowerment to improve waste segregation at the source (Maimaiti, 2021; Kristina et al., 2020). This digitalization of waste banks remains little understood, being a recently commenced approach. Moreover, most waste bank implementations are located in villages that have lower digital literacy, which means a longer time for people to adapt to the digital system. This leads to a situation where the benefit of the waste bank is often seen from the community participation angle, not from its environmental impact like preventing waste leakage into the ocean. However, it has massive potential to improve the accountability of waste management. Furthermore, the real-time data provided will be beneficial for any stakeholder (governments and/or industries) who wants to develop integrated waste management systems.
The ocean plastic pollution problem has been a global challenge and the prevention of pollution leakage should start from inland waste management as the main source. There are many existing waste management practices with a source-based approach, such as the waste bank, that can become solutions but are lacking in accountability. Digitalization has the potential to overcome this weakness. As it is a recent technology, the performance of digital waste banks in reducing waste from the source and figuring out potential leakage into the ocean remains unknown. This research is focused on the evaluation of digital waste banks in preventing marine debris. This study was conducted in Gianyar Regency, Bali, Indonesia in 2020–2021.
Materials and methods
This research was located in Gianyar Regency, Bali as it was the main location of the digital waste bank of Griya Luhu. The waste management data were collected from October 2020 to September 2021 (over a period of 12 months) in 13 villages (Figure 1), while the waste generation survey was conducted between 1 and 8 October 2022 with 97 households across those villages. They were categorized into three waste leakage risks based on their distances from the nearest coastal area. The closer the population is to the ocean or river that leads to the ocean, the higher the risk of plastic leakage pollution (Ryan, 2020; Ryan et al., 2021; Meijer et al., 2021).
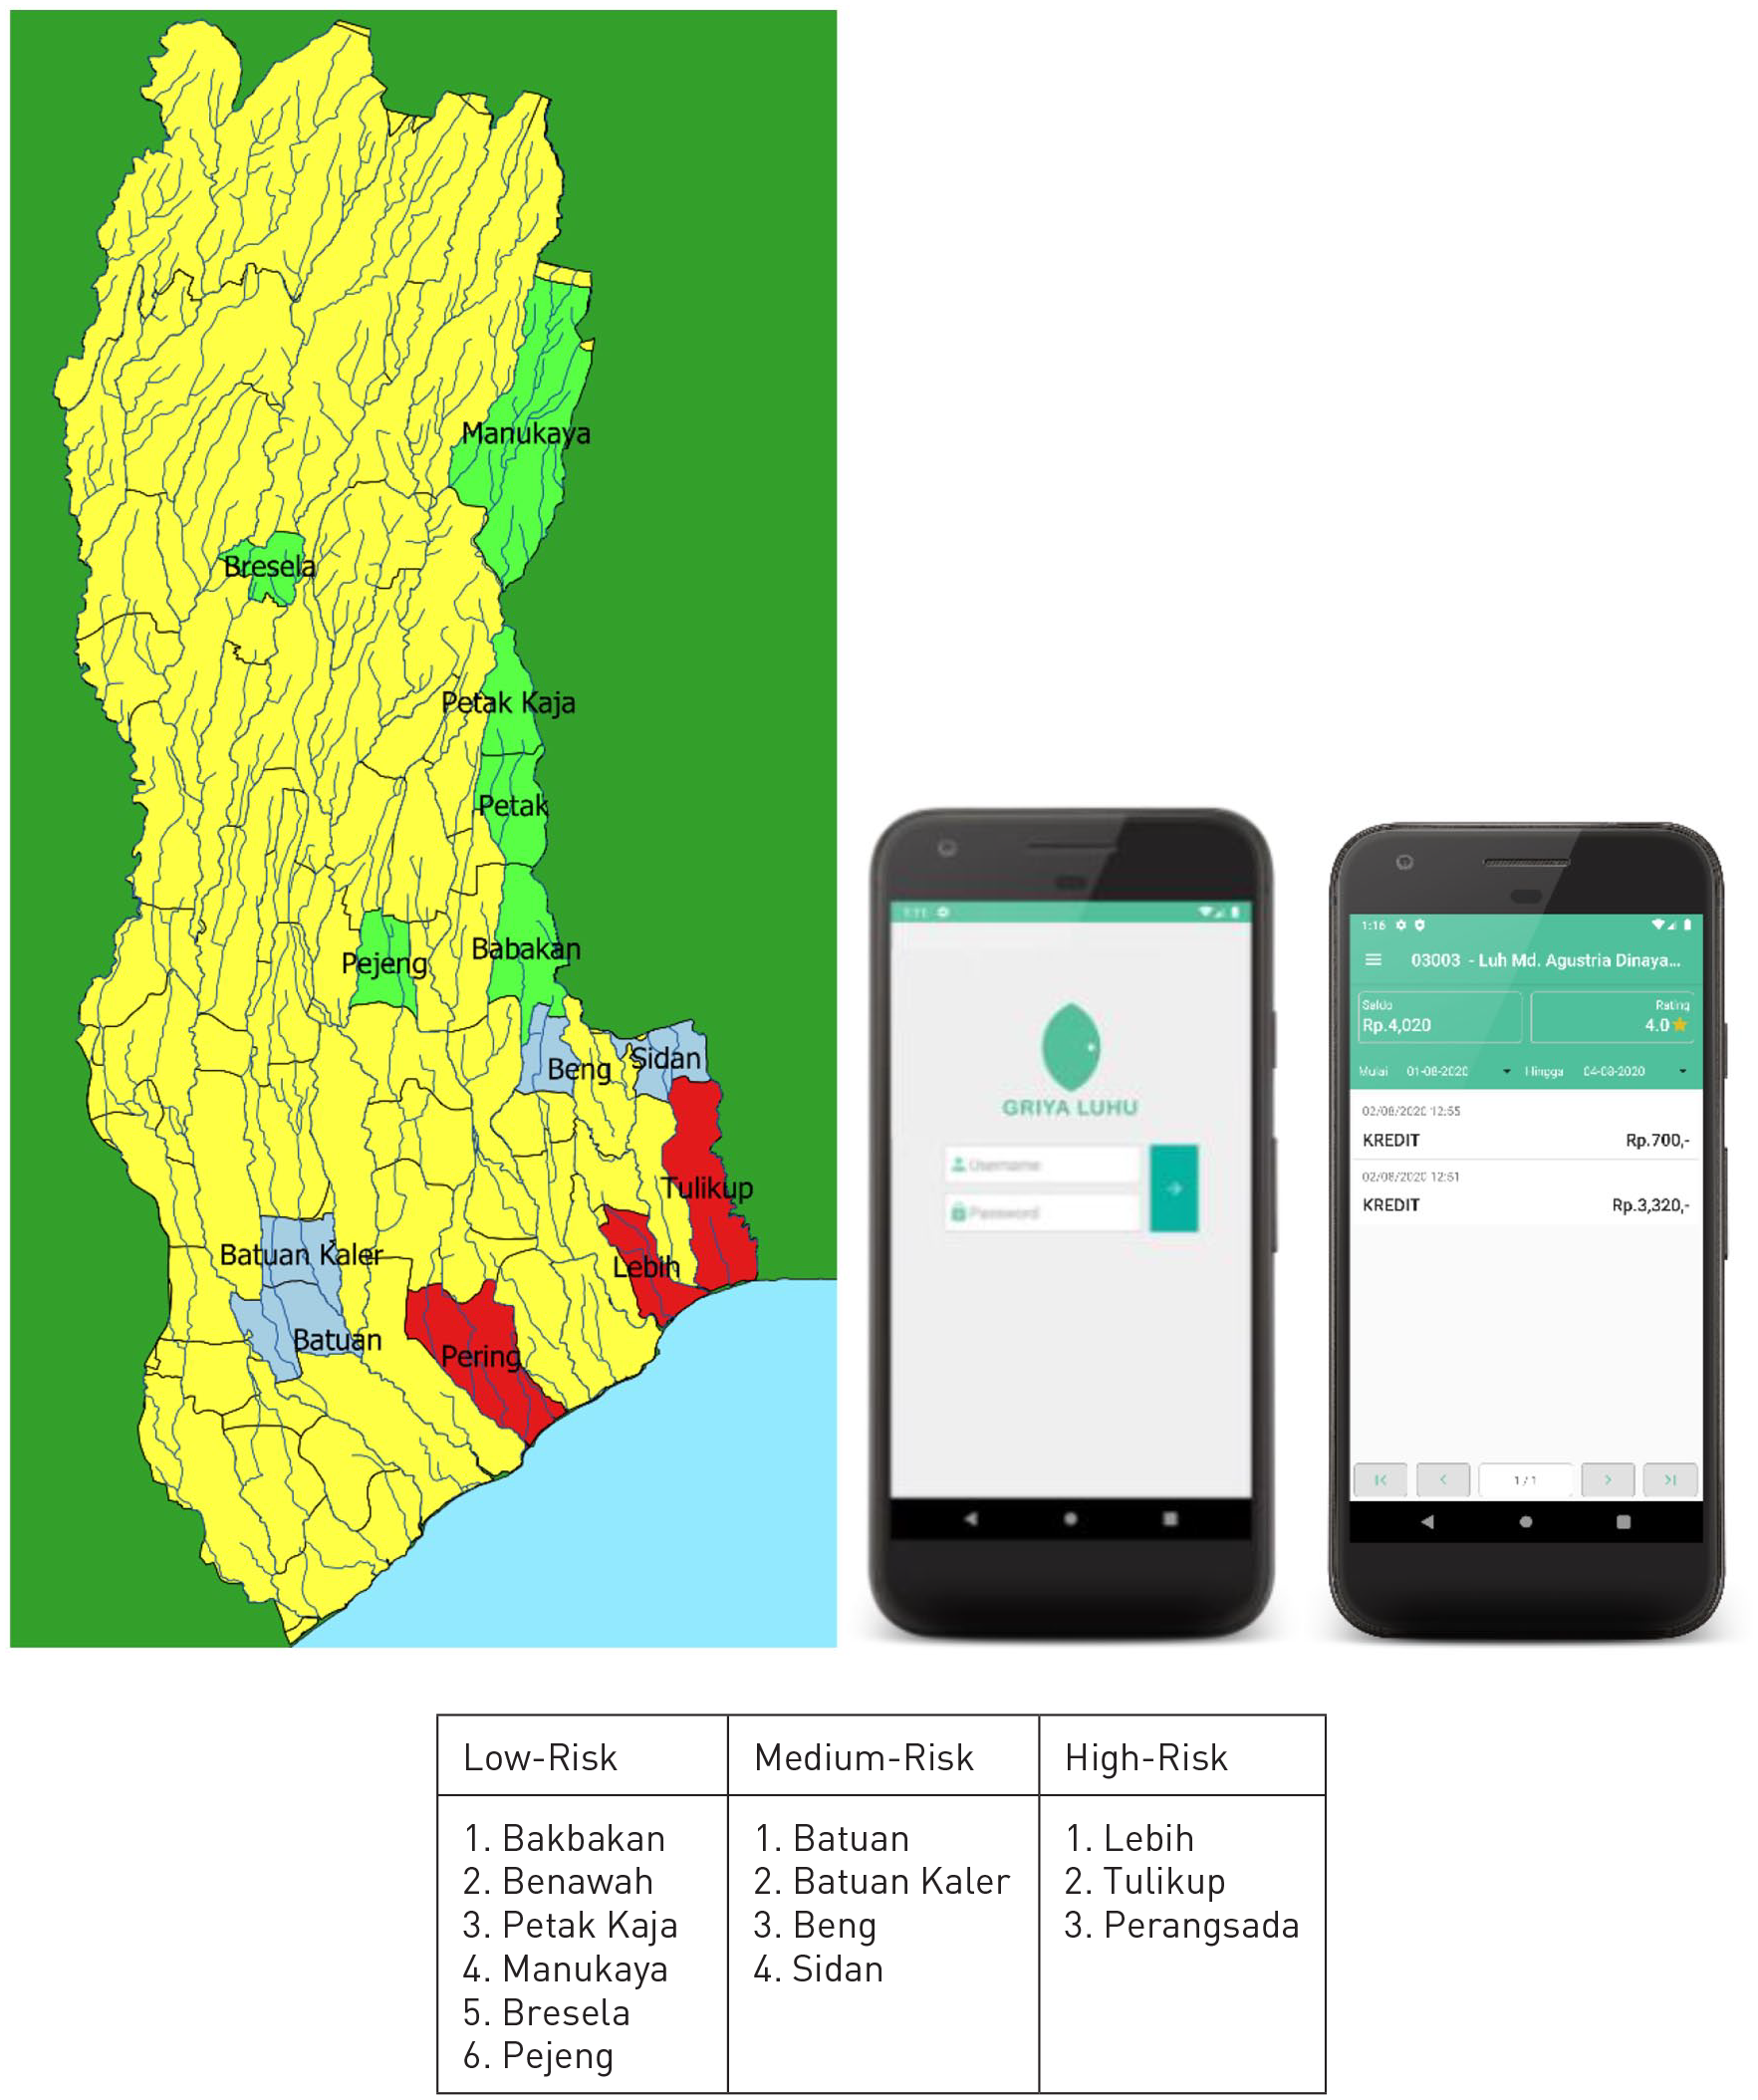
The locations of the villages in three categories (red = high-risk; blue = medium-risk; green = low-risk) and the front face of Griya Luhu App.
The high-risk category included the villages located less than 5 km within the radius of the coast. There were three villages in this category, namely Lebih, Tulikup and Perangsada, which also directly bordered with the shoreline. Thus, these villages had a potential of polluting the ocean directly and via rivers that flowed through them. The medium-risk category included the villages located within 5–10 km from the coast, which were Batuan, Batuan Kaler, Beng and Sidan. These villages had no direct access to the ocean but their locations were still close to the shoreline. Moreover, some of them were neighbours with villages that had a high-risk. The low-risk villages were located beyond 10 km from the beach. They were Bakbakan, Benawah, Petak Kaja, Manukaya, Bresela and Pejeng. The distances of the villages in this category to the sea varied widely, that is, from 10 to 35 km. Villages in this category had no direct access to the ocean like the medium-risk villages. Plastic waste might flow through the river but it would possibly be trapped somewhere before it arrives at the shore.
The limitation of this research is that the waste leakage into the ocean was not directly calculated. However, the potential leakage based on the generation of unmanaged waste, especially inorganic materials and their access into the ocean, was calculated. Moreover, as the focus was on the digital waste bank’s ability in reducing potential waste leakage into the ocean, other waste management systems that might also prevent the leakage were not considered. In general, the methodology of this research can be summarized in Figure 2.
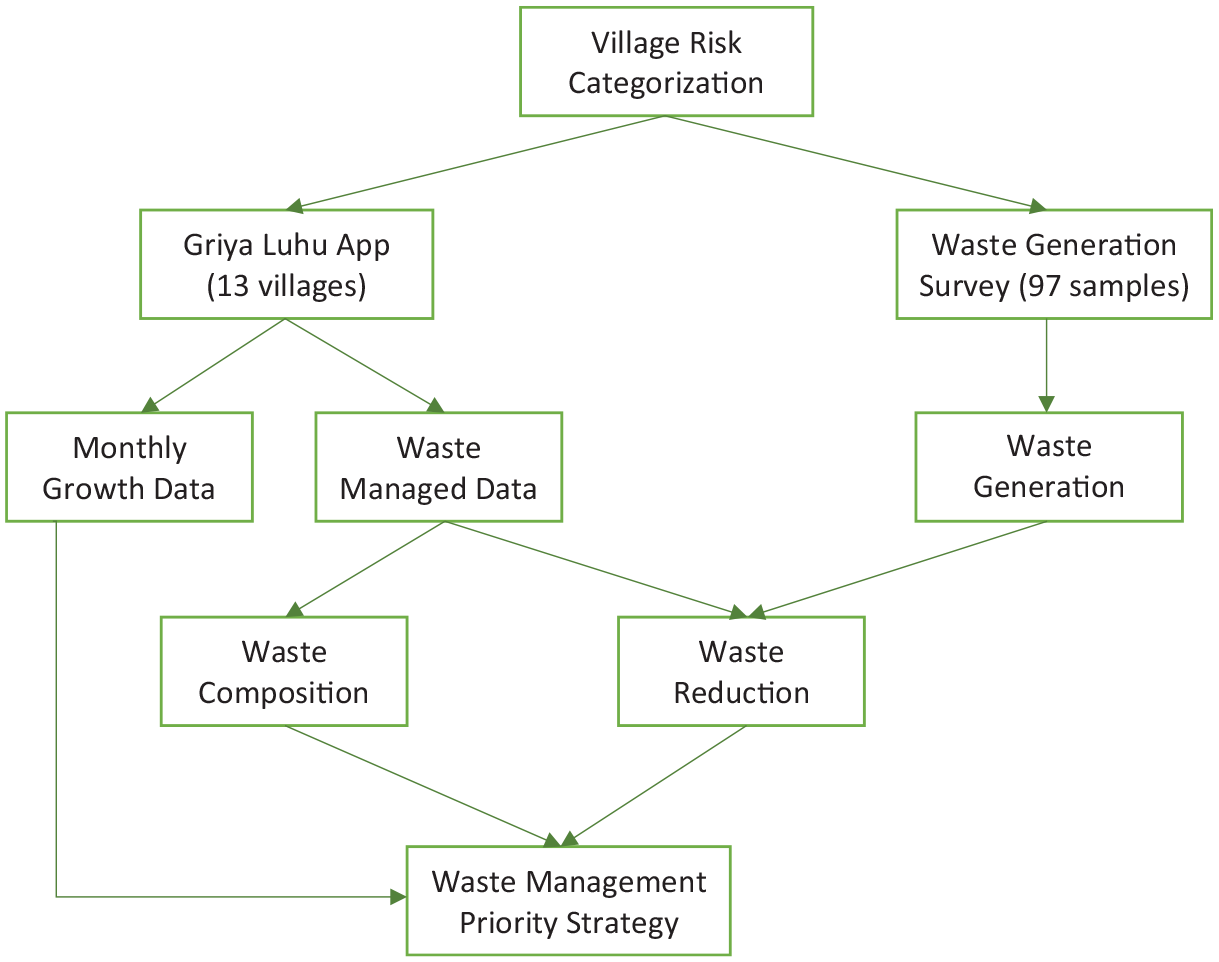
Flowchart of the digital waste bank research.
In the first part, the general features of the digital waste bank growth were analyzed. The growth was figured out from the number of waste bank units, the number of customers, and the monthly data on the total waste managed. The data were presented in a monthly time series. These can explain how fast digital waste banks grew in the first year of their introduction and how it related to the amount of waste that could be prevented from leaking into the ocean. All of the data were collected directly from Griya Luhu App (Figure 1) which included all the waste bank units in 13 villages. The types and total amount of waste collected were input directly by the operators at the waste bank units on a real-time basis. The number of waste bank units was counted from the time of the first opening. Meanwhile, the number of customers was recorded directly by the operators at each unit. The growth of customers in each unit was measured based on the number of new members every month.
The next part was evaluating the composition of the waste managed in all the villages within the three risk-level categories. The waste was grouped into two types, namely plastics and non-plastics. Plastics included flexible plastics, PET plastics and High-density polythylene (HDPE)/ Polypropylene (PP) plastics. Meanwhile, non-plastics included paper, metal, glass and others. Flexible plastics such as plastic bags and sachets are plastics with a low rate of recyclability that are easily dumped and will potentially leak into waterways (Hopewell et al., 2009). PET plastics (e.g. mineral water bottles) have a high recycling rate but need an industrial-scale system, so they have to be collected in huge amounts. Meanwhile, HDPE/PP plastics (e.g. shampoo bottles, mineral water cups) also have a high rate of recycling, but the variance is vast and the quantity is smaller. Both PET and HDPE/PP plastics have more potential to be prevented from leaking into the ocean as they have high economic recovery benefits and are easier to be collected (Eriksen et al., 2019).
Then, the generation of inorganic waste from every village was calculated (equations (1)–(2)). Inorganic waste is defined as all waste that are not of organic nature and that can be accepted in the waste bank plus all other residuals. Samples from 97 waste bank customers were taken, which were selected by purposive random sampling. The quantity of inorganic waste was weighed after the waste was separated (into organic and inorganic wastes) directly at the houses from where the samples were collected, for 8 days in a row (BSN, 1994).
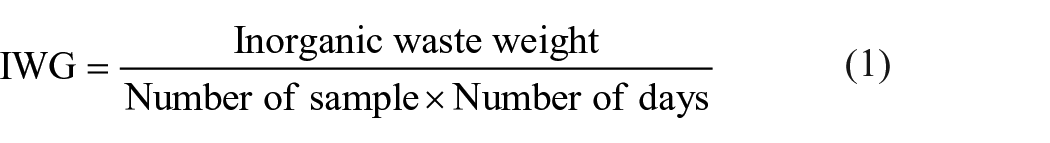

The IWG is short for Inorganic Waste Generation, which is the average waste generation by a person/from a sample in a day (kg household−1 day−1). The Total IWG is IWG multiplied by 30 to present the waste generation in a month.
Then, the monthly IWG was compared to the quantity of managed waste in the digital waste bank (Figure 2). Thus, the percentage of waste reduction from the total potential waste leakage in every village could be calculated (equation (3)).

From this data/information, the proper waste management priority strategy could be elaborated. First is the growth of digital waste banks to understand the ability of this approach to increase the amount of waste managed. Second is the waste composition to analyze the consumption characteristics and the digital waste bank’s ability in collecting plastic waste. Last is calculating waste reduction, which is measuring this waste management’s performance in preventing ocean marine debris.
Results and discussion
The growth of digital waste banks can be seen based on some parameters, such as the total number of waste bank units and the total number of customers. Apart from that, this research also considered the monthly generation of waste that was collected in all the digital waste banks. This is more relevant to understand the impact of the digital waste banks on preventing waste leakage, as the increasing number of registered waste bank units did not always result in the increasing amount of waste-managed, as the opening of every unit varied based on many factors including cultural activity and COVID-19 (the Coronavirus disease) restrictions.
Total number of waste bank units, total number of customers and quantity of collected waste
In Figures 3(a) and (b), we can see the growth in the number of waste bank units and customers that were registered with the Griya Luhu digital waste bank. Starting from October 2020 until September 2021, the number of units and customers showed an increase every month. The quantity of waste that could be prevented from leaking every month because of the digital waste banks are presented in Figure 3(c). It showed progress in general, but in several months such as April, June and July, the quantity decreased.
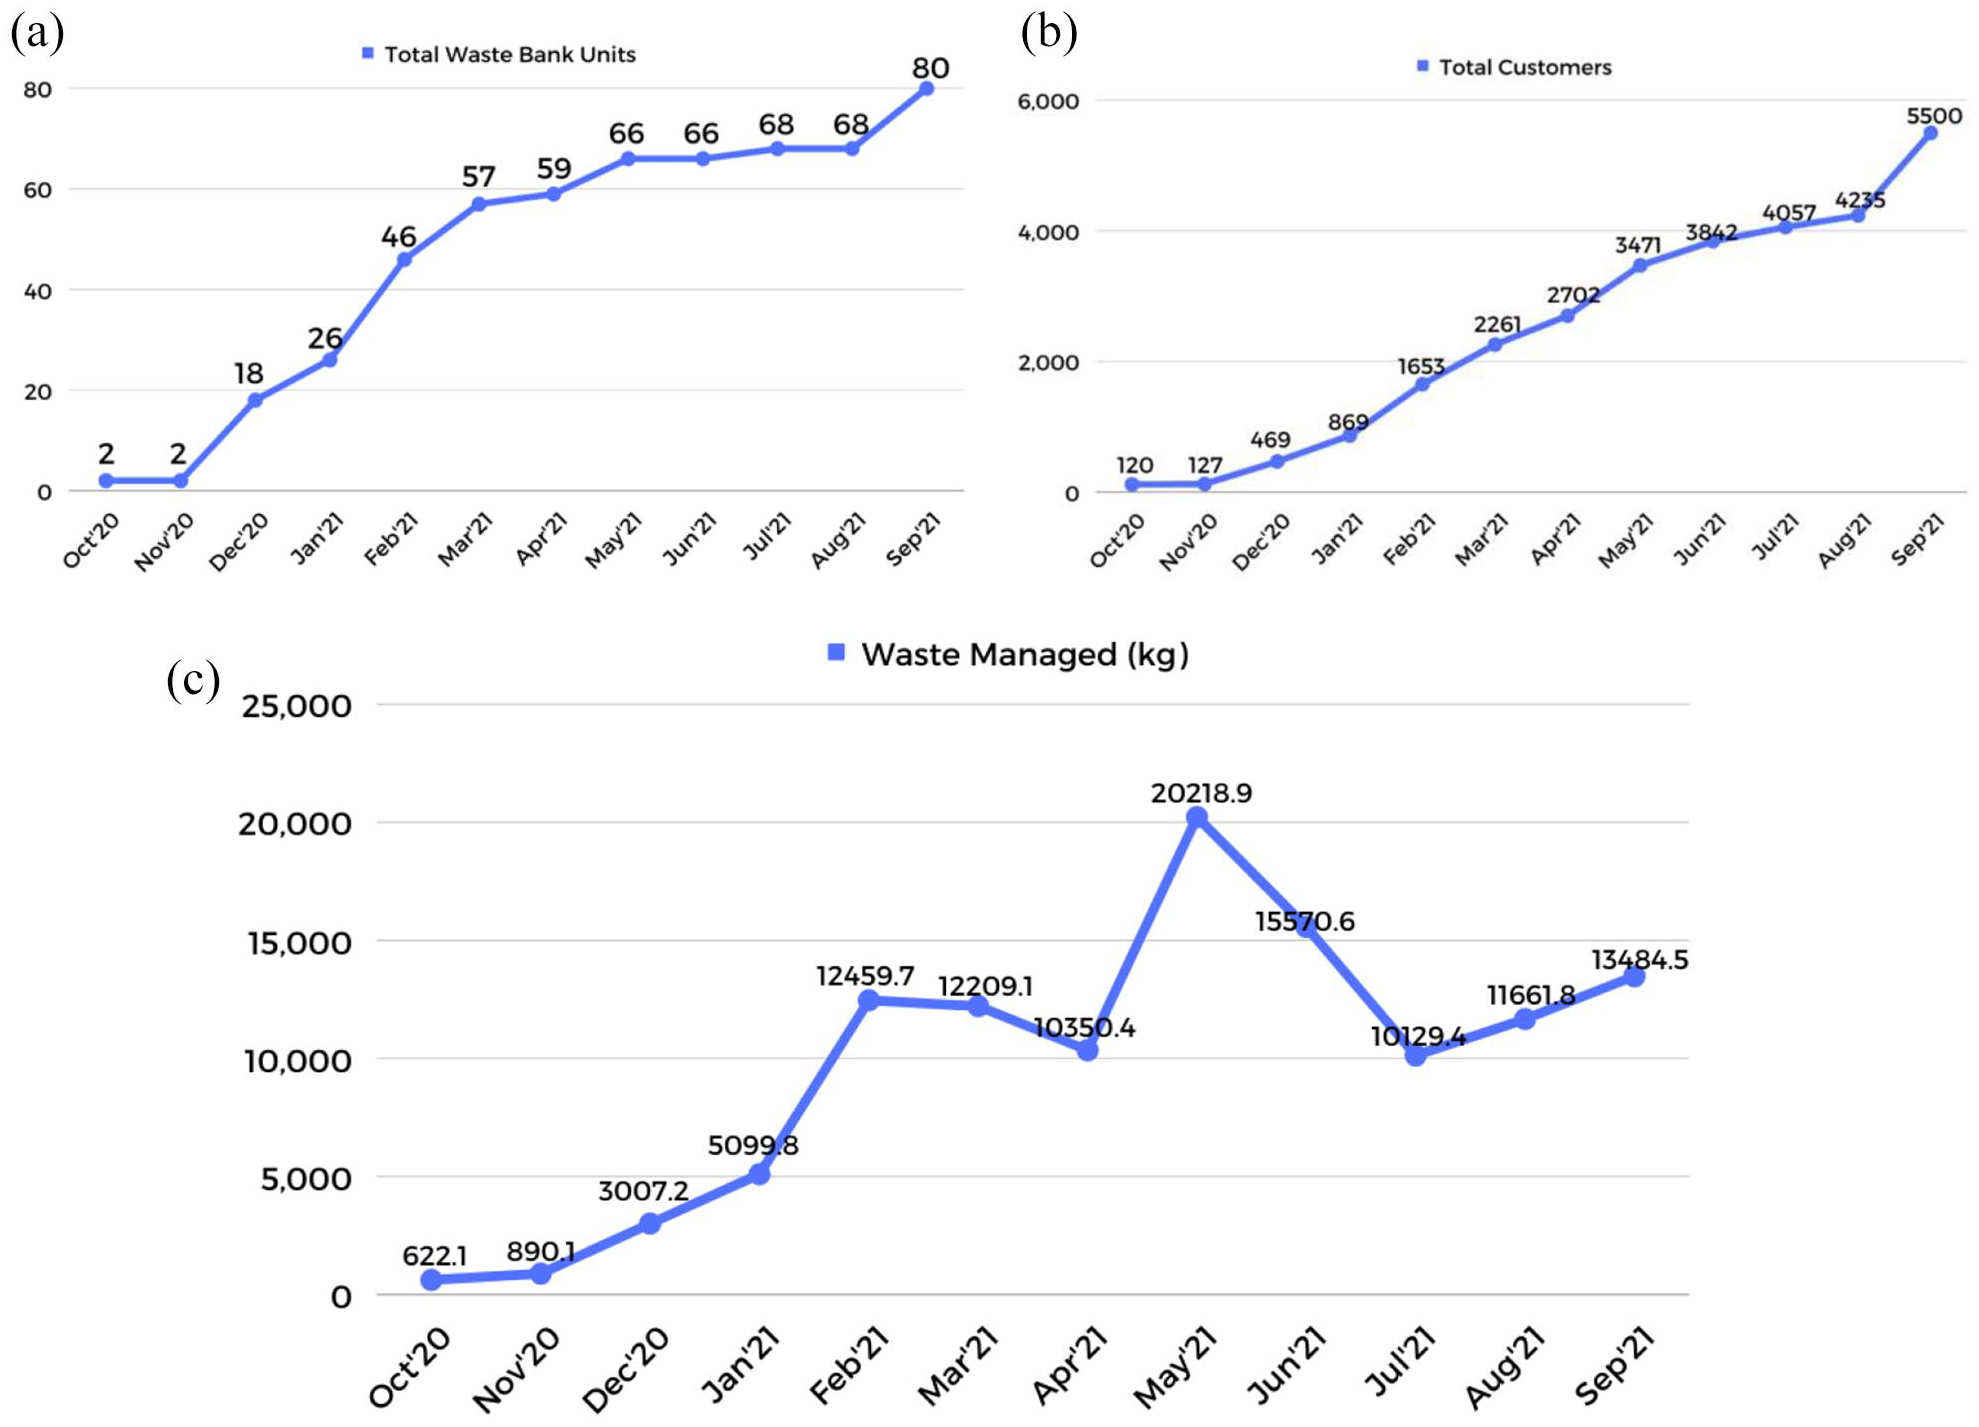
(a) Total number of waste bank units, (b) total number of customers, and (c) quantity of monthly waste managed in the Griya Luhu digital waste bank.
In the first 2 months (October–November 2020), the digitalization of waste banks had slow progress as it was the introduction period of the digital system. There were only two digital waste bank units in this period. This was consistent with the number of customers which saw no significant increase, namely, around 120 households. Then, it grew rapidly from December 2020 to March 2021. In 4 months, the number of waste bank units increased from 2 to 57 units and the number of customers also increased from 127 to 2261 households. The growth rate of waste bank units was slower in March–August 2021, but the number of customers continued to increase. This was caused by new customers being registered with the already existing waste bank units. Then, the number of waste bank units bounced back again in September 2021, followed by the increase in the number of customers.
Similar to waste bank units and customer growth, the quantity of waste managed in the first 2 months was low, only accounting for 600–900 kg per month. The number increased rapidly to 12 tons in February 2021, although there was a slight decrease in the next 2 months. This sudden increase is the effect of the long adaptation process of digital systems from villagers who have lower digital literacy. So, they might have been registered several months before but started to properly separate their waste only in February. The amount of waste managed reached its peak in May 2021 with a total of more than 20 tons in a month. Unfortunately, it decreased again in June and July, but then rose to almost 13.5 tons in September 2021. This fluctuation in the amount of the monthly waste managed was mainly caused by the restrictive regulations of COVID-19 (Miharja et al., 2021). Many digital waste banks had to stop their operations for several weeks or months from June 2021.
This rapid growth of the digital waste banks in a short time shows the promising performance of this approach in improving the coverage of proper waste management which prevents marine litter. Adding access points (waste bank units) naturally increases the amount of waste that can be prevented from leakage. Apart from that, the consistency of the system is also important, so more people trust and join the waste bank.
There were 13 villages in Gianyar that had adopted the digital waste bank system. Based on their distances from the shore, the villages were divided into three categories, namely, Low-Risk, Medium-Risk and High-Risk.
Low-risk villages
The villages with a low risk of ocean plastic leakage are defined as being located more than 10 km from the nearest coastline. This category has the longest range, as it includes the villages that are located from 10 to 35 km away from the ocean. Thus, the villages might have many variances of potential leakage, but, in general, the risk remains considerably low due to their positions. There are six villages in this category, namely Bakbakan, Pejeng, Petak Kaja, Manukaya, Benawah and Bresela. The percentage of seven different types of waste in these villages can be seen in Figure 4.
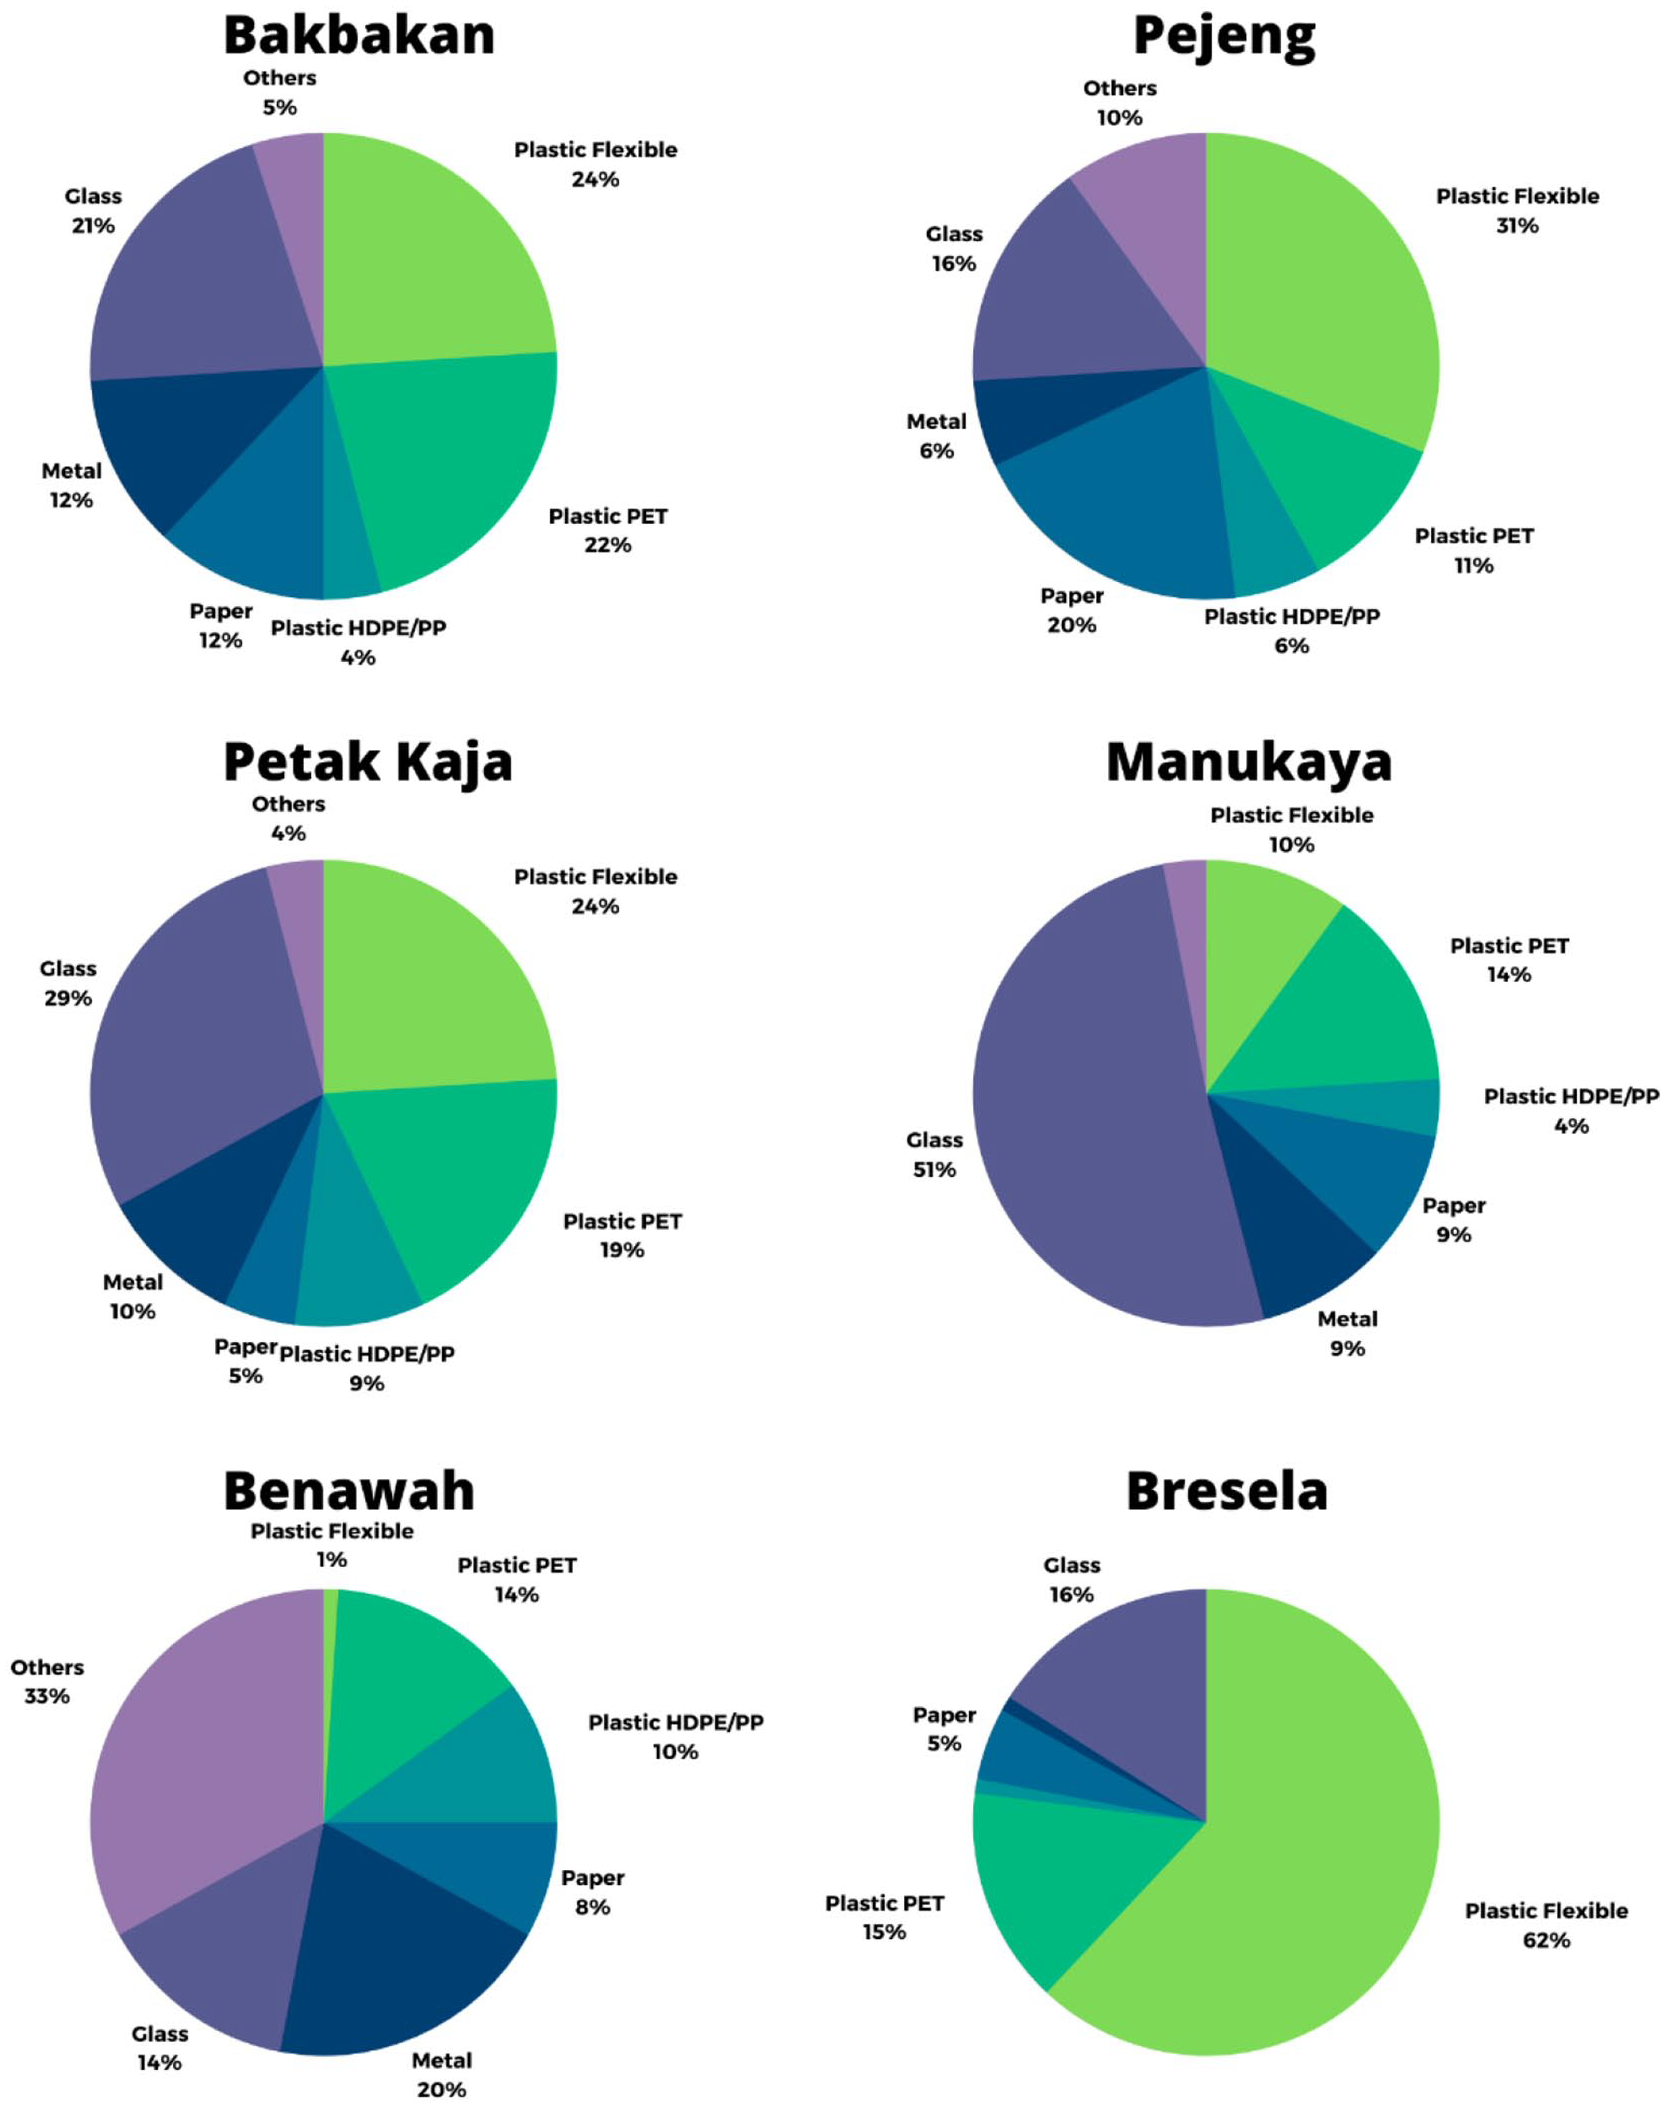
Composition of waste managed in low-risk villages.
In three villages (Bakbakan, Pejeng and Petak Kaja), the percentage of plastic waste is around 50% with flexible plastics making up around 24–31%. In the other two villages, Manukaya and Benawah, the percentage is considerably lower, only about 25–28%. However, in the areas with an extremely low percentage of flexible plastics, like in Benawah, there is a possibility that the plastic waste was burnt or leaked into the environment because flexible plastics have a very low economic recovery benefit (Adane and Muleta, 2011; Ali et al., 2021; Kawamura and Pavuluri, 2010). Bresela has the highest percentage of plastic waste, namely 77% of the total amount of waste, with flexible plastics making up 62% of the total amount of waste. Although the percentage of plastic waste in Bresela is high, the potential of leakage into the ocean is considerably low as the village is located almost 30 km from the nearest shore. However, it does not change the fact that it has a high potential to pollute rivers and the land environment.
Medium and high-risk villages
In the medium-risk category, there are Batuan, Batuan Kaler, Beng and Sidan villages. They are located between 5 to 10 km from the nearest coastline. Although all of these villages have no beach, most of them are direct neighbours with high-risk villages. The percentage of types of waste in every digital waste bank with a medium risk is presented in Figure 5. The villages that have the highest risk of polluting the ocean with plastic waste are located less than 5 km from the coastline. All of the three villages included in this category have direct access to the ocean. They are Lebih, Tulikup and Perangsada, as seen in Figure 5. In the case of Lebih village, it has culinary tourism at its beaches, which can increase the possibility of polluting and leaking plastic into the ocean.
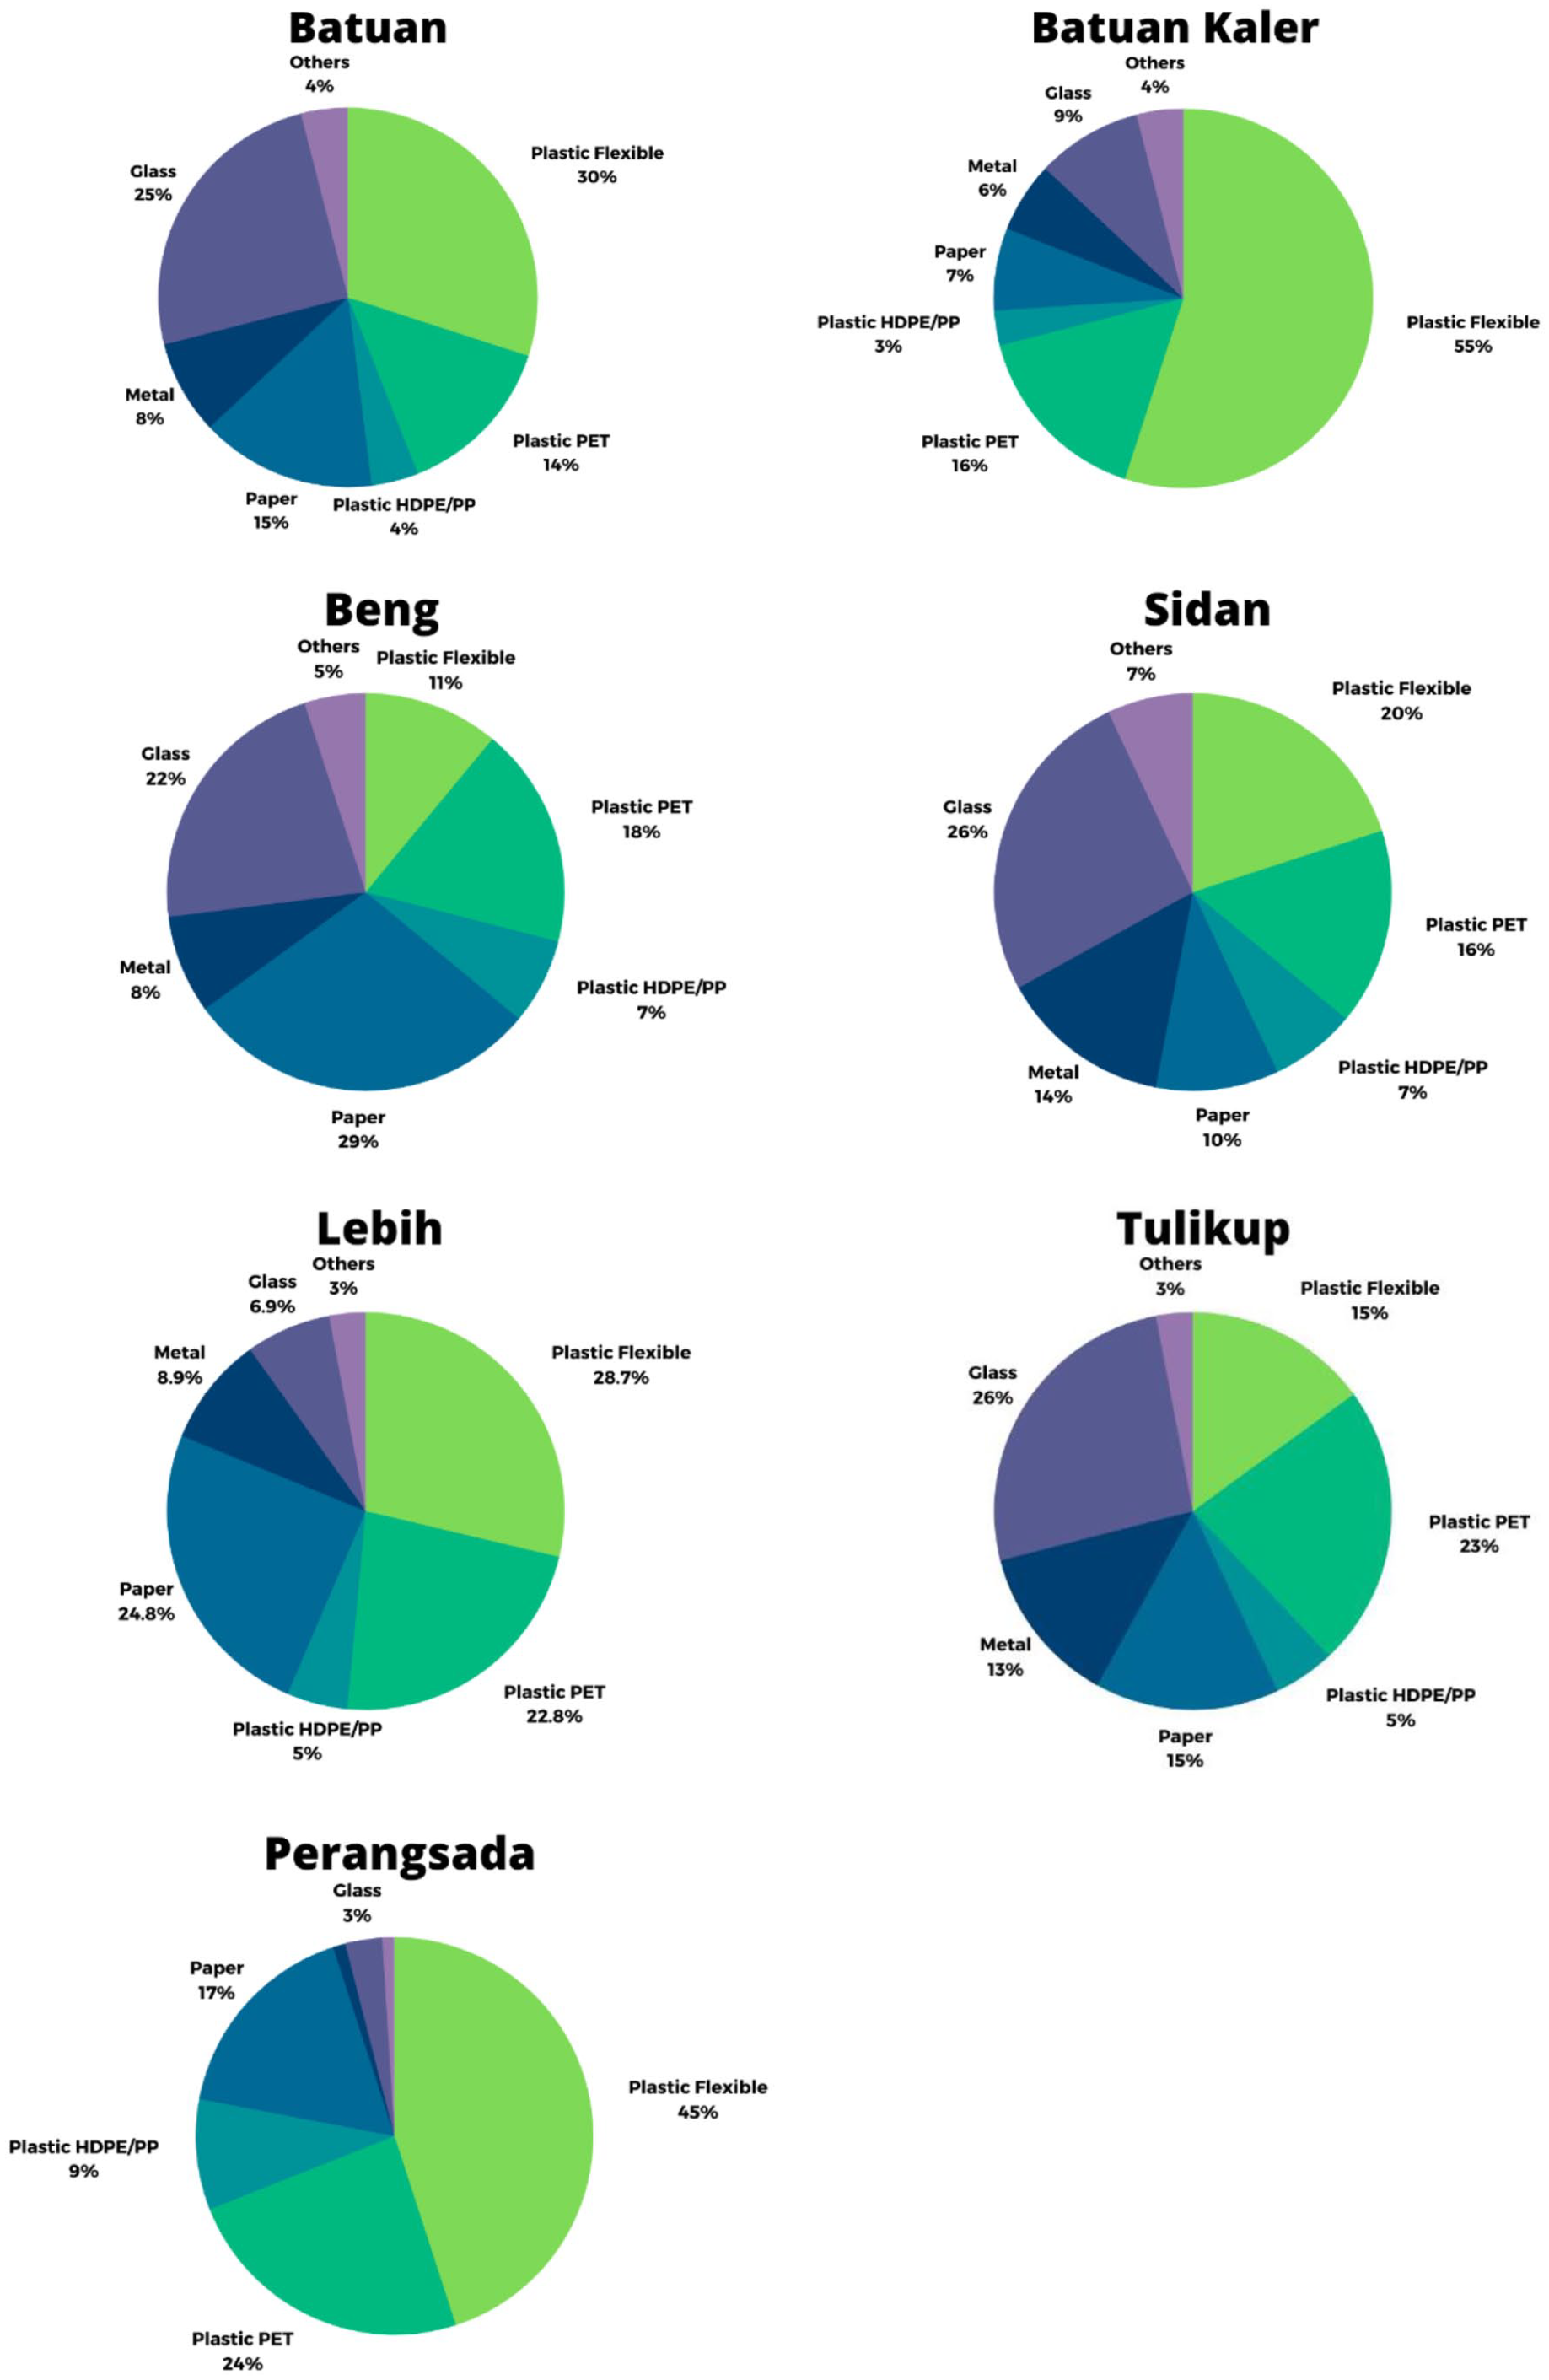
Composition of waste managed in medium-risk villages (Batuan, Batuan Kaler, Beng and Sidan) and high-risk villages (Lebih, Tulikup and Perangsada).
The pattern of the proportion of waste in the medium-risk category is similar for most of the villages. The villages with the highest proportion of plastic waste, namely 36–48%, are Batuan, Beng and Sidan. While the proportions of each type of waste are similar between Batuan and Sidan, Beng shows a different case, with paper making up the highest percentage of about 29%.
However, Batuan Kaler is most distinct compared to the others, in that it has a much higher percentage of plastic waste. There is 74% of plastic waste in this village. Flexible plastics turn out to be the majority of the waste in this village, not only amongst other types of plastic waste, but also among all the other categories. It accounts for 55% of the total amount of waste. It is considered very high, as other villages have no more than 50% of plastic waste in total. This is due to the high participation rate of people in Batuan Kaler.
The high-risk villages show different characteristics in their waste composition. In Lebih village, the total amount of plastic waste is about half of the total amount of waste, with flexible plastics being the dominant constituent at 29%. The amount of plastic waste is almost half of the total amount of waste in Tulikup village, but upon looking into each type, it can be seen that glass waste makes up the highest percentage at 26%. Glass waste has a lower possibility of leaking due to its weight and durability.
Amongst these high-risk villages, Perangsada turns out to be an anomaly considering the percentage of plastic waste that it generates. It accounts for 78% of the total waste. This is the highest not only among the high-risk villages, but also amongst all the other villages. The percentage of flexible plastics is 45%, PET plastics 24% and HDPE/PP plastics 9%. Thus, the amount of plastic waste is considerably high in all of the villages located near the coastline. There is a high potential of plastic leakage into the ocean from these areas if plastic waste is not properly managed.
It is very important to understand the composition of plastic waste in every village, particularly flexible plastics. The first reason is to understand the consumption characteristics of the people. The second reason is, as flexible plastics have a high possibility of polluting the ocean, this shows how effective digital waste management is in reducing potential pollution.
Reduction of potential waste leakage
The IWG in every village can be grouped based on the sub-district. The data were gathered from 97 household samples. The households’ waste was collected and weighed on a daily basis for 8 days in a row. The daily average waste from the households in every sub-district was then calculated. This technique keeps up with the Indonesian standards for surveying waste generation. It can reduce the daily variability factor in waste generation. To gain more details, the organic waste was separated from the inorganic waste, so that the waste composition was obtained. The daily average from our samples in each sub-district was determined to show the potential IWG in each sub-district each day. Table 1 illustrates that the IWG varies slightly between regions. It ranges from around 0.0645 to 0.0765 (kg household−1 day−1). The Payangan sub-district has the highest IWG.
Reduction of potential waste leakage.
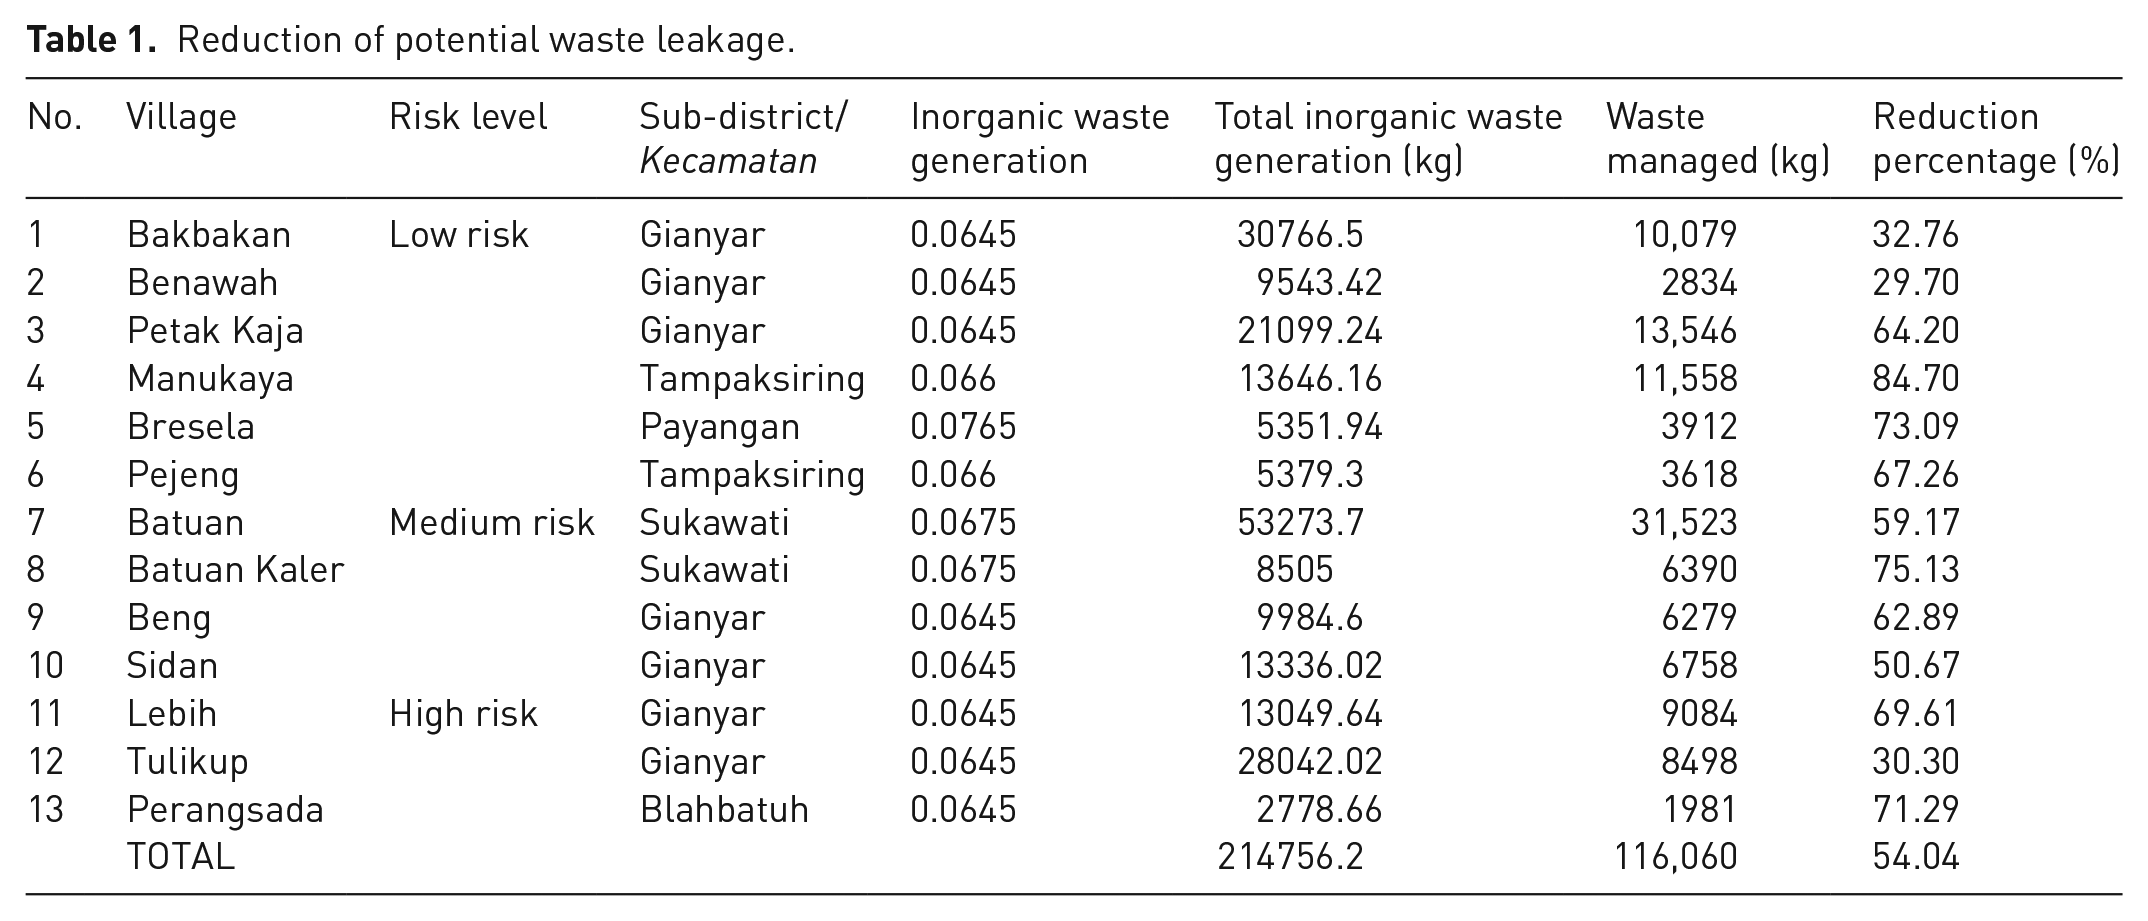
Based on the IWG in every village, the quantity of the total inorganic waste from the customers of the waste bank in every village could be estimated, as presented in Table 1. The total amount of IWG was calculated by multiplying the rates of IWG by the number of customers in every village. The total number of people in the village was not used as it would not be able to show the behaviour changes and separation ability caused by the digital waste bank.
The result was then compared with the amount of waste that had been managed by the waste bank to calculate the reduction. The result is highly varied, namely, from 29 to 84%. The village with the lowest reduction rate was Benawah, at 29.7%, while the village with the highest reduction rate was Manukaya, at 84.7%. Only three villages had less than 50% reduction rate. In the high-risk category, Tulikup had the lowest reduction rate compared to Lebih and Perangsada. It accounts for 30.3% while the others had around 70% reduction rate.
Understanding the amount of waste generation and the waste composition is essential for preventing marine litter leakage as the capacity of the waste management needed can be estimated. Then, comparing the amount of waste generation with the existing reduction at the digital waste bank can show the performance of this management system and help understand the current gap. Furthermore, this digitalization can provide the necessary data for creating integrated, sustainable waste management. Proper integration of waste management is key to marine litter prevention (Renaud et al., 2018).
Every village has a different size of waste bank, which is based on the number of customers, which is highly related to the number of village population. The lower the number of the customers/population, the higher the percentage of reduction. Even so, there are some anomalies, such as Benawah. Meanwhile, the villages with a high population such as Batuan, Bakbakan and Tulikup were unable to achieve a high reduction of potential leakage, as seen in Figure 6.
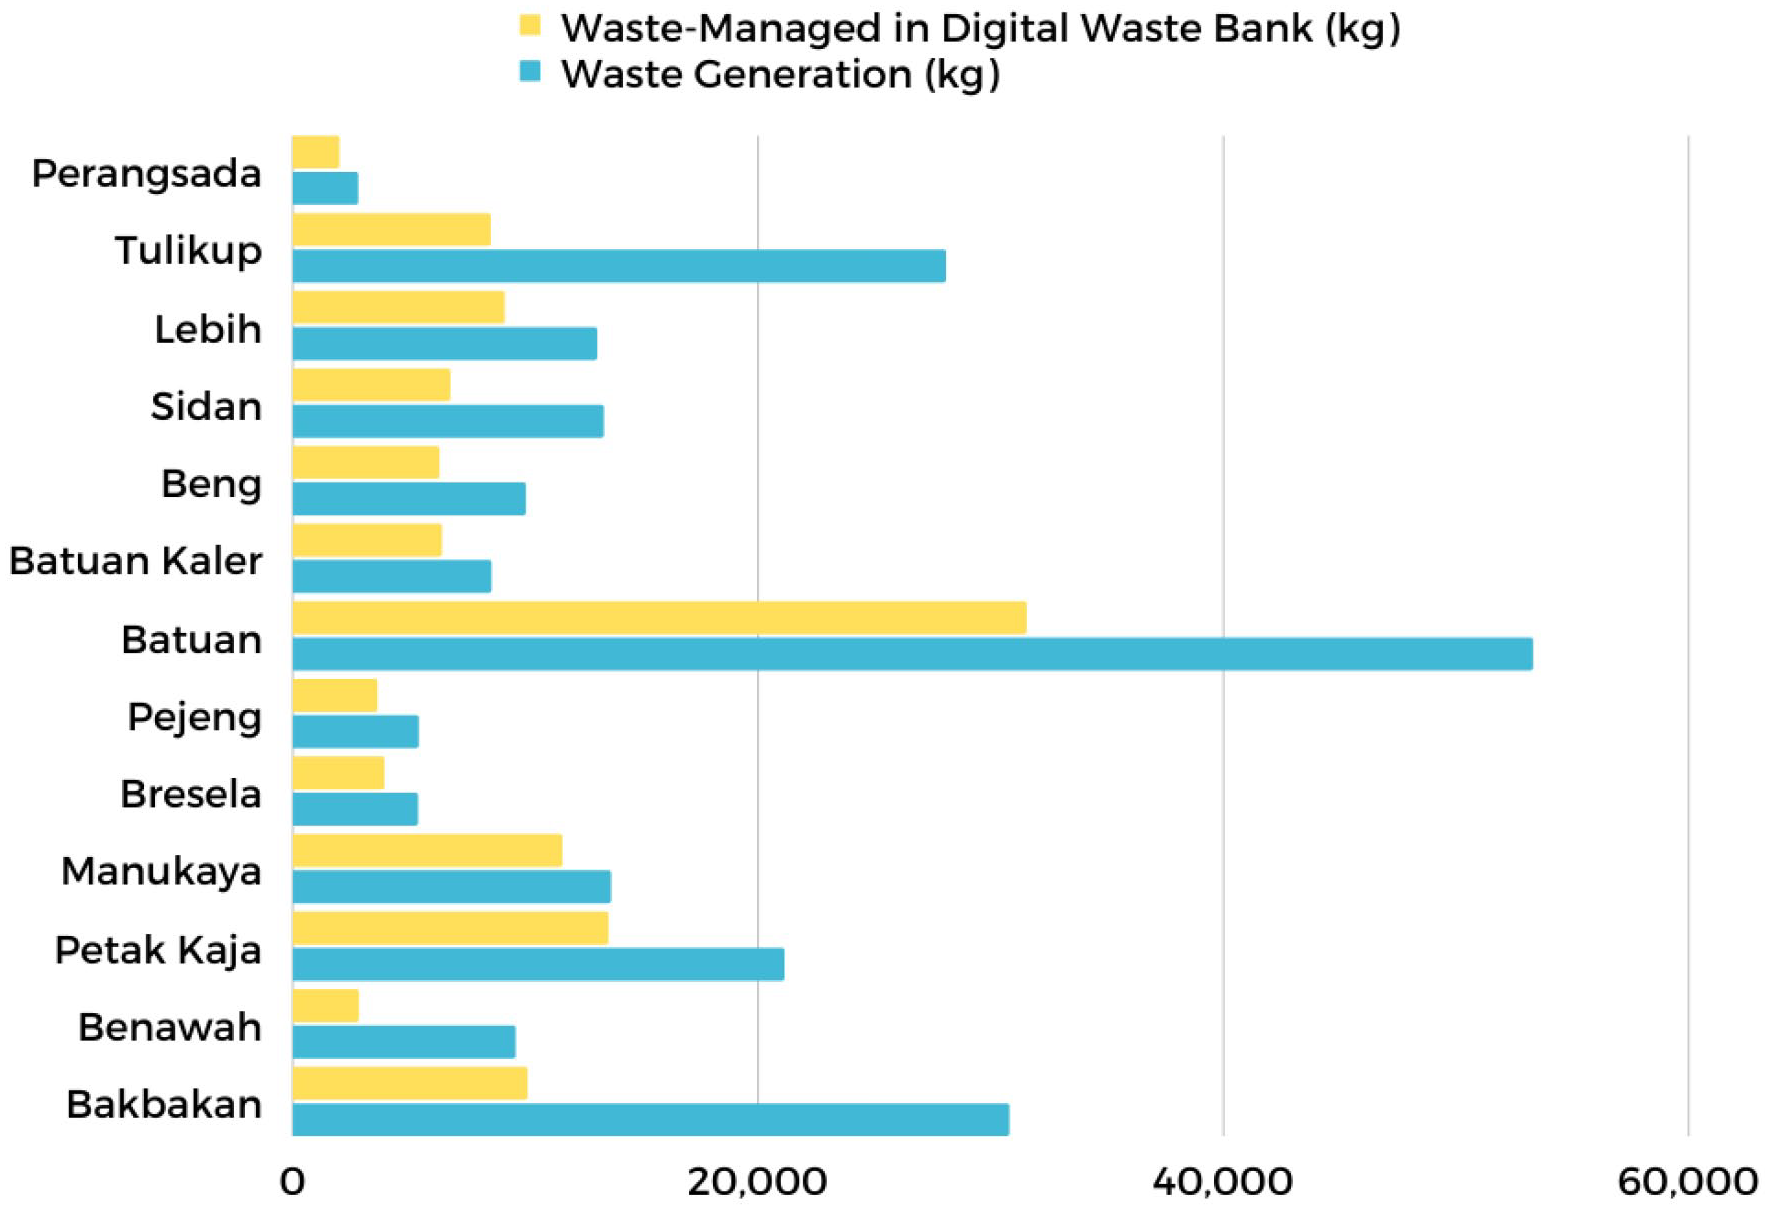
Comparison of IWG to managed waste in the waste bank.
The quality of waste separation depends on the size of the population. In the villages with a high number of population count, education and dissemination need more resources and time in order to improve their separation ability. Thus, a more largely populated village will perform worse on waste separation, resulting in less waste to be stored in the waste bank. Transferable knowledge and information are key points of the digital waste banks as they transform the old paradigm into the new way of waste separation at source. This can also indicate that the higher potential leakage as reflected by the low reduction percentage means that unmanaged waste potentially leaks into waterways and the ocean. This can be overcome by adding more waste bank units in the largely populated villages as collection points and imparting widespread education on digital waste management.
Regarding the study, it appears digital waste banks can considerably reduce the high proportion of flexible plastic waste polluting the ocean. It can be replicated, starting from coastline villages and then continued to other areas having many rivers leading to the ocean. The number of waste bank units or collection points required has to be considered based on population.
Conclusion
The digital waste bank has shown a promising growth in its first year implementation from October 2020 to September 2021. In 1 year, it had grown up to 80 waste bank units that served 5500 households. In general, the amount of waste managed increased from more than 600 kg to almost 13,500 kg in 1 year, but it fluctuated due to several factors, mainly the activity restrictions due to the COVID-19 pandemic. It is clear that adding the number of digital waste bank units will improve the coverage and increase the amount of waste managed.
As for the percentage of plastic waste, most of the villages generated plastic waste at about 50% of their collected waste. Some of the villages had an extreme condition where the plastic waste generated was around 75% of the total waste. On the other hand, a few other villages generated plastic waste amounting to a quarter of their total waste. This pattern appears in all three different categories of risk (Low, Medium and High). Thus, digital waste banks have the ability of collecting plastic waste and preventing it from leaking out as a pollutant.
According to the reduction calculation, digital waste banks can reduce 54% of IWG, although the number varies from 29 to 84% between the villages. The variation is caused by many factors, including the size of the customers/village population. Villages with a high number of customers/population performed worse in reducing IWG which might be the source of waste leakage. Amongst all villages, Tulikup should be treated as a priority as it is located in a high-risk area while also performing on a low reduction rate of only 30.30%.
Thus the priority strategy for preventing ocean plastic leakage is by replicating digital waste bank systems in coastline villages, followed by rural areas which have rivers leading to the ocean. The number of waste bank units should be allocated based on population to provide more affordable and effective access to waste management.
There are some limitations to this research. First, it does not directly calculate the waste leakage. Second, it does not consider any other existing waste management system. Third, it does not provide sufficient information about the waste composition from unmanaged waste. Thus, further research needs to improve on these aspects, so as to create a comprehensive and integrated waste management system.
Supplemental Material
sj-docx-1-wmr-10.1177_0734242X221123490 – Supplemental material for Evaluating the collection and composition of plastic waste in the digital waste bank and the reduction of potential leakage into the ocean
Supplemental material, sj-docx-1-wmr-10.1177_0734242X221123490 for Evaluating the collection and composition of plastic waste in the digital waste bank and the reduction of potential leakage into the ocean by Ida Bagus Mandhara Brasika, I Gede Hendrawan, I Wayan Gede Astawa Karang, I Gusti Agung Indira Pradnyaswari and Ni Putu Oka Mia Krisna Pratiwi in Waste Management & Research
Footnotes
Declaration of conflicting interests
The authors declared no potential conflicts of interest with respect to the research, authorship and/or publication of this article.
Funding
The author(s) disclosed receipt of the following financial support for the research, authorship, and/or publication of this article: The research is funded by Udayana University through CPPU (Calon Perusahaan Pemula Udayana) scheme 2021.
References
Supplementary Material
Please find the following supplemental material available below.
For Open Access articles published under a Creative Commons License, all supplemental material carries the same license as the article it is associated with.
For non-Open Access articles published, all supplemental material carries a non-exclusive license, and permission requests for re-use of supplemental material or any part of supplemental material shall be sent directly to the copyright owner as specified in the copyright notice associated with the article.