
Abstract
The EU’s circular economy concept necessitates increasing the recycling ratio of municipal solid wastes. There are many existing mechanical–biological processing plants in Hungary for the preparation of residual municipal solid wastes (RMSWs). The two most important products of these plants are the bio-fraction and the refuse derived fuel (RDF). Currently, there are problems with both of these material streams in Hungary, since most of the bio-fraction is still landfilled, and the local thermal utilisation of the RDF has not been implemented yet. The high moisture content of the produced bio-fraction and RDF causes difficulties for the downstream operations; therefore, there is recent engineering interest in drying and agglomeration of these materials. The authors have carried out systematic and parallel drying and briquetting experimental series to study the effect of the material, material composition, mass (volume or surface) of the material, particle size distribution and pre-treatment with a cutting mill on drying intensity in a 1 m3 oven and their effect on briquettability by a laboratory briquette press. The initial slope of the relative moisture loss as function of time was determined. Process engineering design methods of convective hot air-drying can be further developed taking into account the research results. Results can be used for the design of the feed of a pyrolysis reactor once reactor experiments have provided the optimal feed requirements.
Keywords
Introduction and literature survey
Waste management companies and municipalities in southwestern Hungary are aiming to meet the EU’s target of decreasing landfilling to below 10% and increasing recycling to above 65% of municipal solid wastes (MSWs). Although selective collection has been continuously improved, there is still a high amount of generated residual MSW. A new mechanical residual municipal solid waste (RMSW) processing plant (20 t hour−1) and an experimental refuse derived fuel (RDF) pyrolysis plant (200 kg hour−1) were built (Faitli et al., 2018, 2020), and now extensive research is being carried out to solve the local utilization of the bio-fraction and the RDF. This facility, the Zalaegerszeg – Búslakpuszta RMSW plant (Hungary), is currently in normal operation, with the produced bio-fraction being temporarily landfilled, whereas the RDF must be transported long distances for energetic utilization. Pilot-scale pyrolysis experiments are in progress and achieving optimal feed (input waste stream) is key to good equipment performance. There are many open questions regarding the products of the pyrolysis, namely are gas, liquid or solid products favourable? This question is also widely examined in the current literature (e.g. Bhatt et al., 2021; Nandhini et al., 2022). Ideally, the entire technological chain should be able to be operated with its own heat. This is the reason why fundamental research on bio-fraction and RDF parallel drying and agglomeration is necessary. This article reports on the technical part of developing the pre-treatment and feeder system for the pyrolysis reactor. The data gained can be used for the economic consideration and process engineering design to be carried out at a later stage.
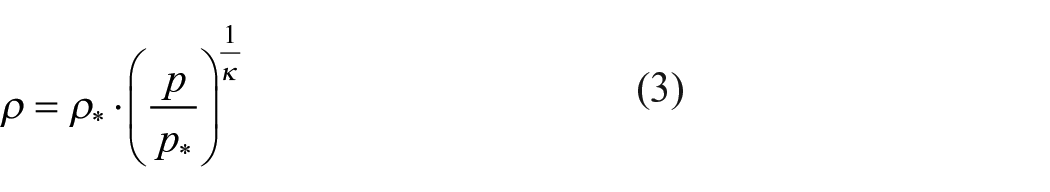
Dryer classification and the selection of the best solid waste drying techniques vary significantly due to the vast range of waste to be dried and the inherent challenges of dealing with non-standardized systems. There are more than 400 types of dryers available (Aghbashlo et al., 2012). In general, biomass dryers may be categorized according to their heat transmission technique and the physical qualities of wet particles. The most regularly used non-batch type dryers include packed mobile bed dryers, rotary dryers, air or flash dryers, conveyor belt dryers and fluidized disc dryers. All of these dryers, including the convective conveyor belt dryer, achieve effective drying; hot or warm air, vacuum, steam or hot or superheated flue gas might be used as the drying medium (Georgiopoulou and Lyberatos, 2017; Verma et al., 2017). Zamrudy et al. (2019) summarised the main non-batch type dryers and their main features for RDF drying before cement plant utilisation. According to Omidi Kashani et al. (2022), the most common batch type methods for RMSW drying can be divided into four general categories: biological, equilibrium, solar and thermal, each of which has advantages and disadvantages. Thermal drying was introduced as the superior method among these methods. Biological drying (Tun and Juchelková, 2019; Yuan et al., 2017) is a waste-drying technique that combines natural and forced aeration with heat produced by the natural aerobic bioconversion of certain organic materials. The primary premise of this process is to use the internal energy generated by the breakdown of organic waste (Zaman et al., 2021). Velis et al. (2009) summarised the state-of-the art of RMSW biological drying. The drying kinetic of biological RMSW drying is also very important (Chen et al., 2009). The first mathematical kinetic model to determine the drying rate of batch type RMSW drying was introduced by Omidi Kashani et al. (2022). Amantea at al. (2023) carried out dynamic analysis of grain quality during drying in fluidised beds. Another research that dealt with the dynamic drying behaviour of non-batch drying of hops during beer production was reported by Sturm et al. (2020). Two different kinds of exponential functions, namely the Page and the Henderson and Pabis models, were fit to the measured drying curves. A special type of biological RMSW dryers is the solar greenhouse biodrying system reported by Ngamket et al. (2021). When RMSW is moved through the technology (non-batch type) for compaction before pyrolysis, then convective drying might be more beneficial. In the case of convective drying, preheated air is passed to the material to be dried so that the material and the drying medium are in direct contact with each other (Sahupalaand and Latuheru, 2022). Convective dryers are also very common in the food industry (Chandra Mohan and Talukdar, 2012; Prvulovic et al., 2007; Singh and Talukdar, 2019). The following described simple design method of convective dryers is well known in the literature (Alamia et al., 2015; Artyukhov et al., 2019; Singh and Talukdar, 2019). The moisture content of the particulate material evaporates and is transported to the environment by the cooled air. A frequently designed convective dryer is the belt dryer, which can potentially be used to dry RMSWs. According to the target moisture content a given mass of moisture (ΔW) has to be evaporated from the particulate matter. The necessary amount of working air is preheated in a calorifier. In this process, the enthalpy of air increases, but the moisture content does not change, that is, xo = x1. When the preheated air meets the granular material, the enthalpy is constant, that is, h1 = h2. Figure 1 illustrates these two processes on the psychrometric chart. The 0, 1 and 2 indexes mark the conditions of the working air. After theoretical considerations, we can write the material balance from which the required dry air mass (L) can be calculated (equation (1) left). GD is the mass of the dry matter of the material to be dried, and y1 and y2 are the moisture mass ratios of the particulate material before and after exposure to the warm air.
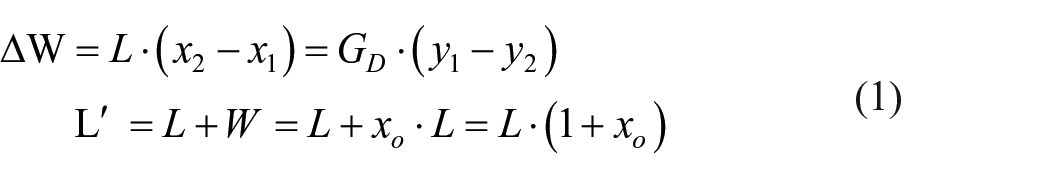
Completely dry air is not available for industrial tasks, so it should be taken into account that only air with a moisture content of xo is available at a given location. Therefore, the real drying air demand (Lʹ) is the sum of the calculated dry air demand and the humidity of the working air (equation (1) right). In the convective dryer, energy must be introduced in one place for drying, that is, the wet air of mass L′ in the calorifer must be heated with heat ΔQ. The required theoretical amount of heat is:

Agglomeration processes can be classified into three general categories namely tumble or growth agglomeration, pressure agglomeration and agglomeration using heat (Borowski, 2021). Pressure agglomeration relies on mechanical application of extreme pressure to force particles join together to form a desired enlarged shape (Shrestha and Singh, 2011; Nurek et al., 2019). Three steps are generally involved in pressure agglomeration: distance reduction between the particles and rearrangement of them, deformation of the particles (which leads to shape and size change) and formation of binding forces. During pressure agglomeration, the compressibility and compactibility of the particles determine the quality of agglomeration products. Compressibility
Compactibility, on the other hand, is the ability of the particles to form new densified compacts. Compactibility can be determined by the use of tensile strength – pressure correlation and specific briquetting work. Two phenomena limit the speed of compaction and hence the capacity of any pressure agglomeration equipment. These are the compressed residual gas/air in the pores and elastic spring back. These can be avoided if compaction occurs slowly enough so that all gas is able to escape from the diminishing pore space (Pietsch, 2008; Quen et al., 2020).
Steps of convective drying on the psychrometric chart.
Based on the literature survey, we can establish that there is extensive literature on equipment for drying and agglomeration of granular materials. The methodology of calculating the necessary heat and working air quantity of convective dryers is also known. The method of measuring the coarse moisture content of granular materials Oven Dried Moisture Content (ODMC) by drying at 105°C in an oven is already a standardised method. However, it is typical that the drying kinetic is not only the equilibrium moisture value is measured. There is also lack of the pressure agglomeration examination as function of the moisture content change. Therefore, the further development of the standard ODMC (oven dried moisture content) test protocol and the development of the dynamic measurement evaluation protocol were necessary. Furthermore, a series of combined experiments had been done where drying and agglomeration tests were carried out in parallel on the same RMSW samples. That is also novel that the effect of material composition, mass (volume or surface) of the material, particle size distribution and pre-treatment with a cutting mill on drying and agglomeration dynamics have been also tested. These tested parameters were selected according to the industrial interest of the commissioning company.
Materials and methods
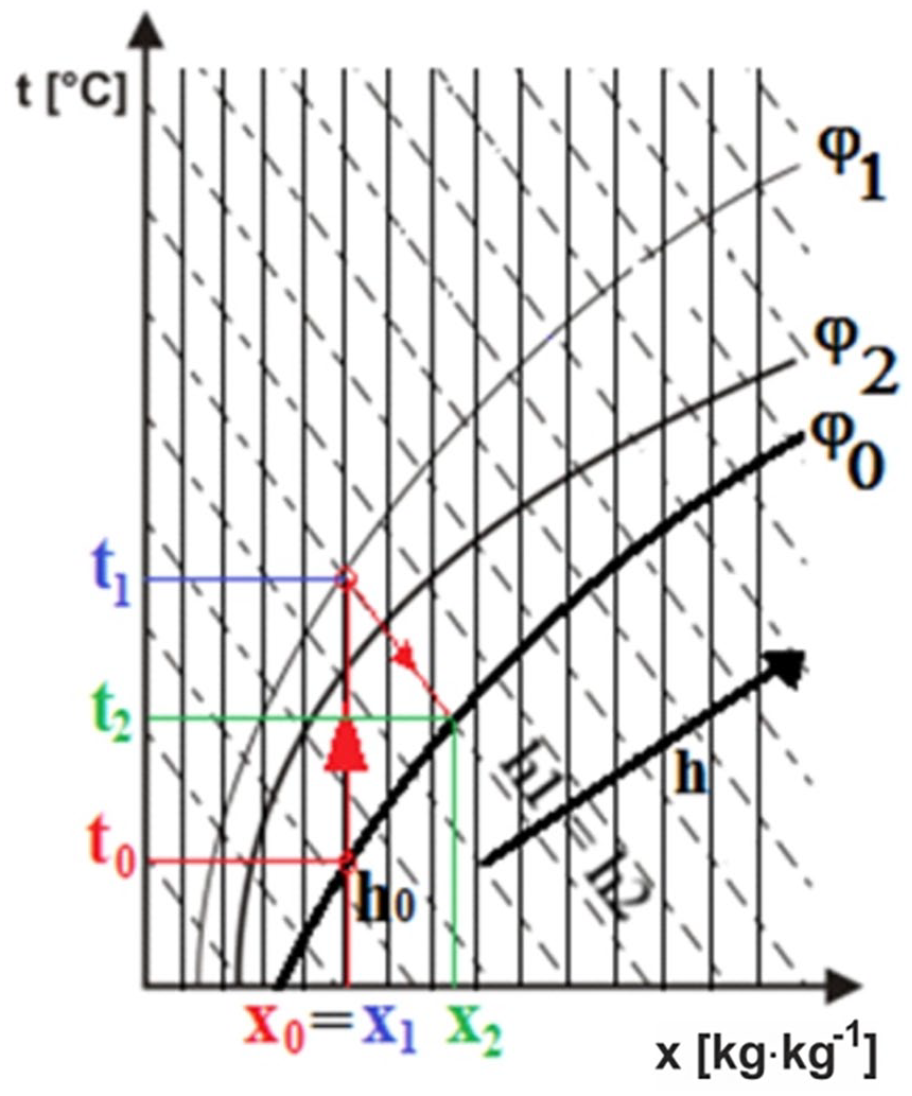
The bio-fraction (approximately 28 kg) and RDF (approximately 13 kg) samples required for the experiments were taken at the beginning of September 2021 at the RMSW processing plant in Zalaegerszeg – Búslakpuszta (Hungary). Prior to the start of the experimental work, the samples were sterilized with a short heat shock to reduce their infectivity and allow for laboratory work. Sub-split samples were placed in an oven preheated to 105°C for 15 minutes (Figure 2).
Sub-split bio-fraction (left) and RDF (right) samples.
Some of the sterilized sub-split samples were hand-sorted to remove metal, stone and glass particles. Two bio-fraction samples of 2 kg each were comminuted in a vertical shaft cutting mill using once 20 mm and then 30 mm opening size screens. Particle size distribution was measured by laboratory hand sieving; material composition was measured by hand sorting. The tested materials and their marking were as follows: RDF (RDF as received after sterilization), BIO (bio-fraction as received after sterilization), Sorted BIO (bio-fraction metal-stone-glass-depleted sorted residue without screening and comminution), Sorted BIO-30 mm (the smaller than 30 mm fraction of bio-fraction metal-stone-glass-depleted sorted residue sieved on a 30 mm opening size screen), Sorted BIO-20 mm (the smaller than 20 mm fraction of bio-fraction metal-stone-glass-depleted sorted residue after cutting milling with a 30 mm screen and being sieved on a 20 mm opening size screen), Sorted BIO-16 mm (the smaller than 16 mm fraction of bio-fraction metal-stone-glass-depleted sorted residue after cutting milling with 20 mm screen and being sieved on a 16-mm opening size screen). In addition, some RDF and bio-fraction mixtures were also tested, where components and their concentrations are marked. Figure 3 shows the measured particle size – distribution functions of the tested samples. The finest granular material is the RDF. Note that the Sorted BIO-30 mm material had not been cut in the cutting mill, instead the coarser than 30 mm particles were removed by manual sieving.
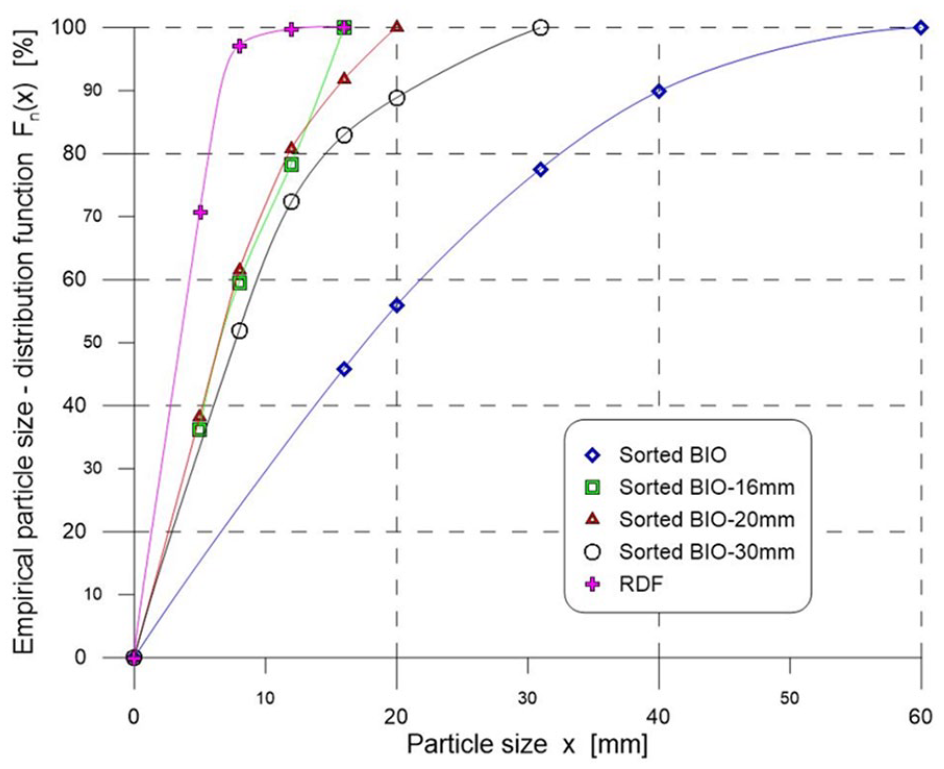
The measured particle size–distribution functions of the tested samples.
Systematic drying experiments were done in a 1-m3 volume oven with moderate air circulation. The intensity of air circulation in the oven was kept constant for all the tests. Tap water was used for calibration tests. During the drying tests, a sample of the test substance with an initial weight of mo was placed in the oven. The initial sample contains both dry matter and moisture. The mass of the sample taken from the oven at a given time is m, so mo–m is the mass loss, that is, the mass of evaporated moisture. The mass of the effluent divided by the initial mass [MC = (mo–m)/mo] gives the relative weight loss or instantaneous moisture content of the sample at a given time. If mass equilibrium is reached, then the ODMC is measured. Figure 4 shows the instantaneous moisture content of different amounts of tap water samples dried in small and big bowls as a function of time. Small bowls were 18 cm and big ones were 26 cm diameter metal plates. Filling height of loosen material was kept constant in the bowls. Bowls were selected according to the sampling nomogram defining the necessary minimal mass of single samples (increment) (Faitli et al., 2019). By this way, two discrete values of mass (volume or surface) of the material were systematically tested. Regarding to the temperature, also two discrete values were systematically tested. The selection of 105°C was evident because this is the standard value of ODMC tests. The value of 65°C was chosen arbitrarily.
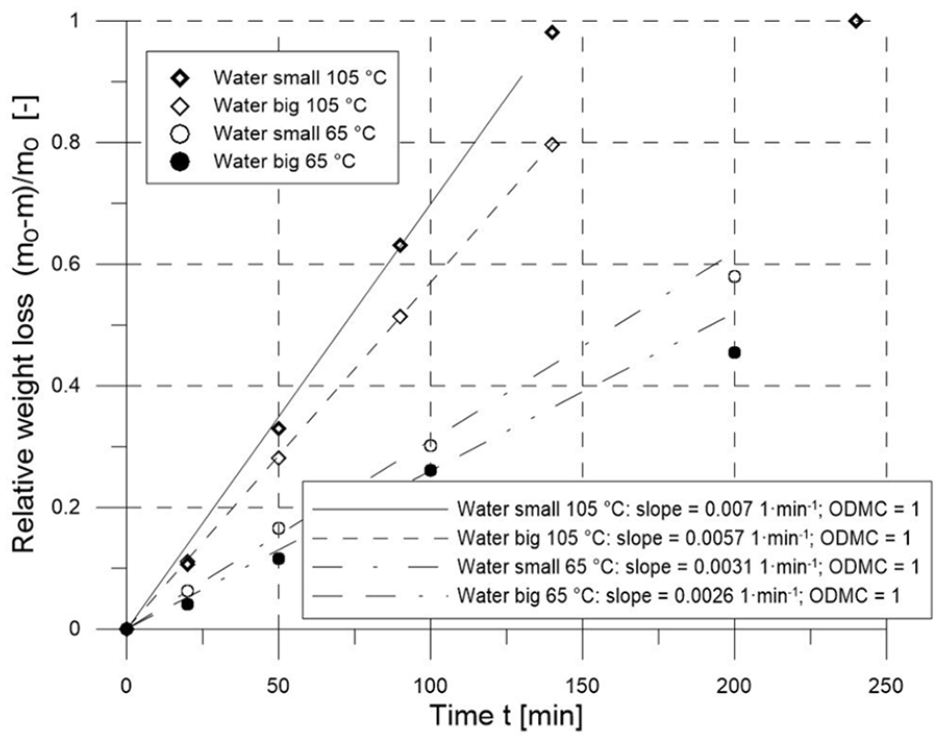
Tap water relative weight loss-time curves for calibration.
It is immediately apparent that at 105°C, the water placed in the smaller bowl was fully evaporated after 140 minutes. In the bigger bowl, 190 minutes was necessary for this. It is also immediately apparent that there is still water left in both bowls after drying for 200 minutes at 65°C, but the moisture content may be estimated by fitting a curve and estimating the steady state. Obviously from the measurement, it can be stated that the moisture content of the measured tap water was ODMC = 1, whereas the dry matter content of it was 0. Several functions were fitted to the instantaneous moisture content – time curves of the measured water. However, neither exponentials (Page and the Henderson and Pabis models) nor the tangent-hyperbolic function fitted well to the measured points. A theoretical drying phenomenon is likely to occur according to some theoretical function, but the case under study is an empirical phenomenon that is strongly influenced by the characteristics of the oven. However, the measurements performed in the same way and in the same equipment can be compared with each other; therefore, the set goal can be examined. For comparability, two main characteristics were determined from each measurement. The first and second measured points were used to determine the initial slope of the instantaneous moisture content – time curves, which is the initial slope of the water loss. If the measured points stabilize over time, the moisture content (ODMC) can also be determined. If sub-splits of a given material are dried with different parameters, the final result, that is, the moisture content, should be the same. The second most important technological question after the necessary heat is the retention time in the dryer, which is well characterized by the initial rate of water loss (slope) parameter. Figure 4 shows the main drying characteristics of tap water samples drying. The developed simple methodology was used for the evaluation of the waste drying tests. It must be mentioned here also that the given moisture content raw materials for the briquetting tests were made by gradual drying in a 1 m3 volume oven.
Briquetting tests were carried out by the laboratory briquette press developed by the Institute of Raw Materials Preparation and Environmental Technology of the University of Miskolc (Figure 5 left). The diameter of the piston press tool was 25 mm, and 5 g of raw sample was fed each time. All briquetting tests were repeated three times. Based on the performed statistical analysis, the population mean was estimated by the sample average and the population standard deviation was estimated by the corrected empirical standard deviation. The so-called relative deviations in percent unit (Sn*·
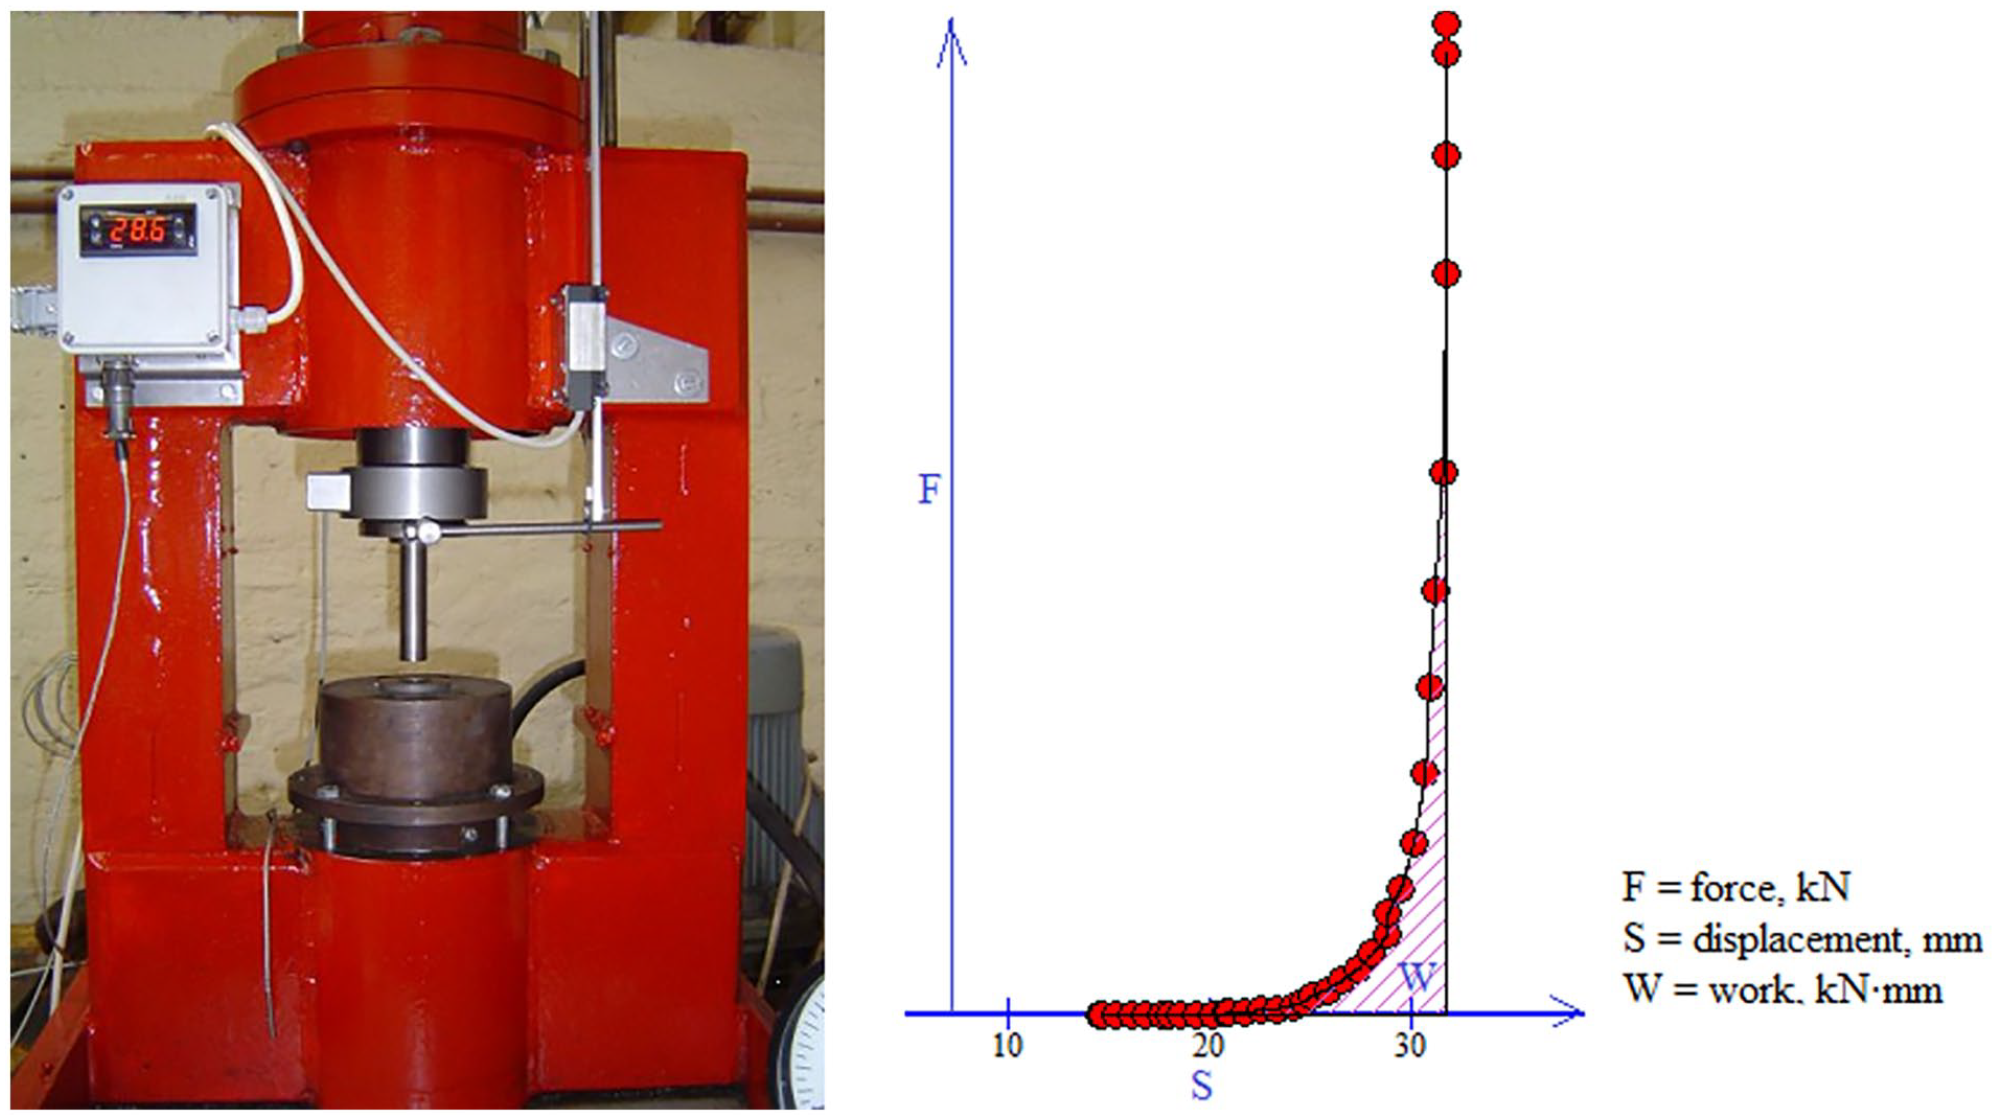
The laboratory briquetting press and the determination of the briquetting work.
The actual position of the press tool was measured by an incremental displacement sensor. Figure 5 right shows a measured force–displacement diagram. The area below this function is the actual briquetting work. The specific briquetting work (Ws) is W over the mass of the briquetted raw sample. The briquette body density was simply measured indirectly by measuring the height by a Vernier calliper and the mass of the known diameter briquettes. The tensile strength
Results and discussion
Figure 6 shows the measured instantaneous moisture content–time curves of bio-fraction samples dried at 105°C and 65°C.
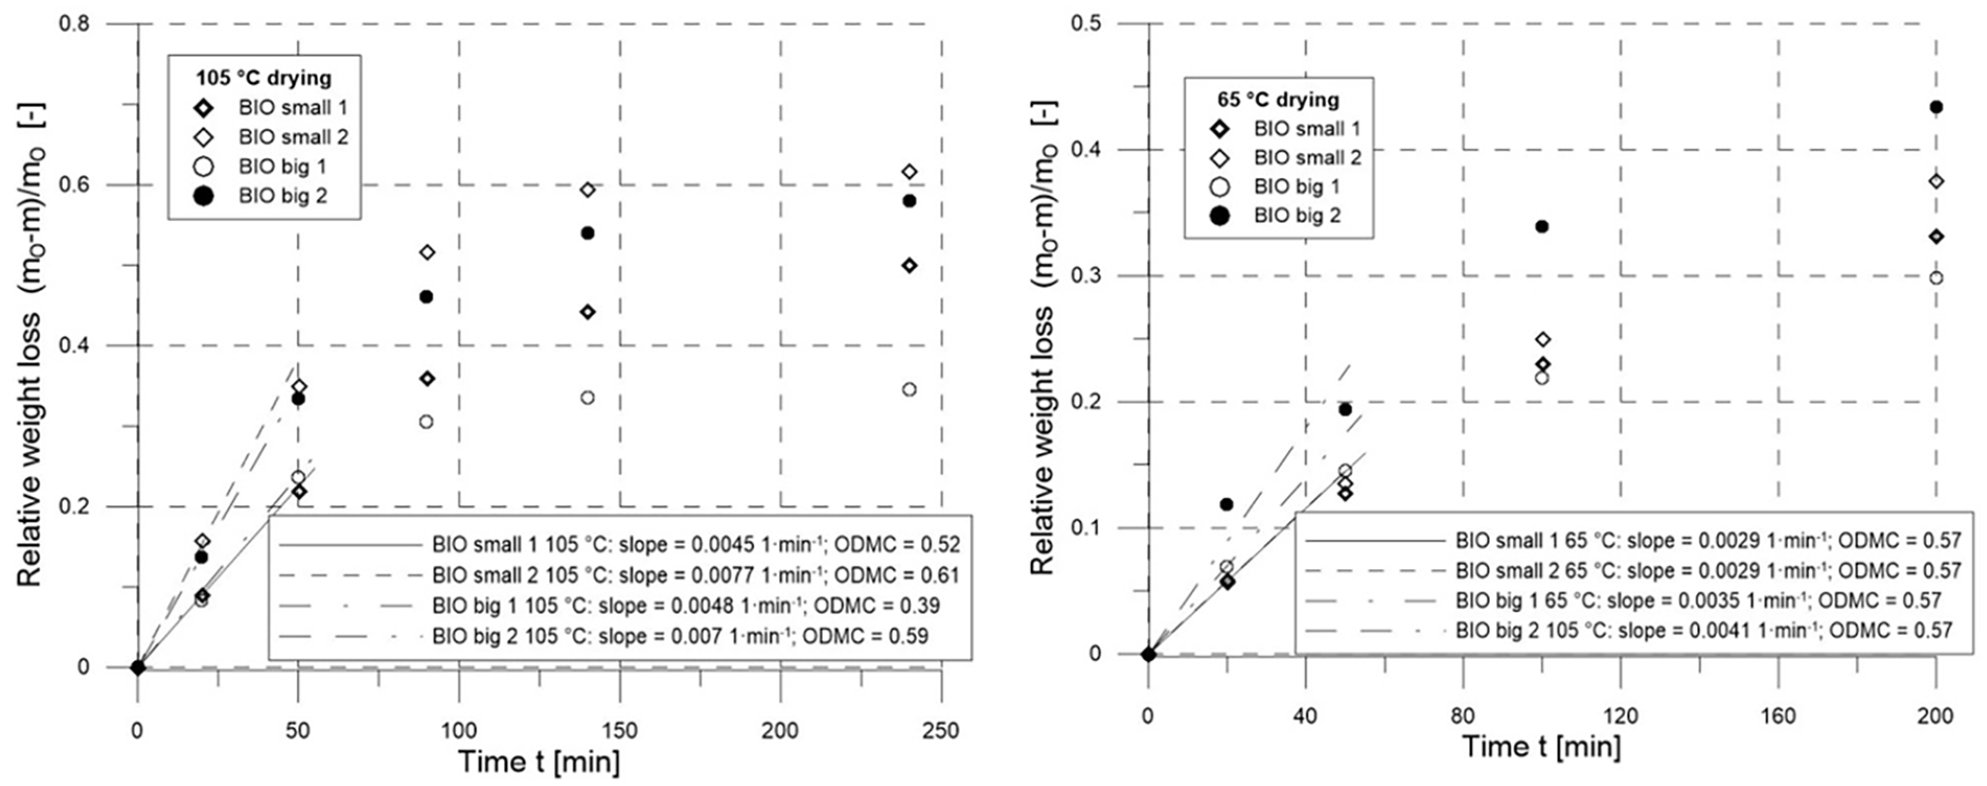
Drying curves of bio-fraction at 105°C (left) and at 65°C (right).
The evaluation of the measurements is complicated by the fact that the sensitivity of the measurements, that is, the smallest difference that the measurement can distinguish, and the heterogeneity of the examined wastes are of comparable magnitude. For the bio-fraction measurements, the measured ODMC values range from 0.52 to 0.61 ODMC. It is considered that the average moisture content of the bio-fraction is approximately 0.57; however, the moisture content of individual samples weighing 60–110 g is scattered. The average moisture content of RDF is approximately 0.38; the measurements are in the range of 0.34–0.44. Taking all this into account, the effect of material quality and temperature on the initial drying can be clearly demonstrated, whereas the effect of sample size cannot be detected from this series of measurements because the sensitivity for this sample size is less than the heterogeneity of the samples. For RDF, at 65°C the average ‘slope’ is 0.0085 1 minute−1, whereas at 105°C it is 0.0165 1 minute−1; therefore, the initial rate of moisture loss is about double at the higher temperature. For the bio-fraction, the average slope at 65°C is 0.003 1 minute-1, and at 105°C, it is 0.0065 1 minute−1; therefore, the higher temperature resulted in double the rate of initial moisture loss for this material as well. Comparing the materials relative to each other, the initial moisture loss rate (slope) of RDF is almost three times that of the bio-fraction at both temperatures.
The aim of the next series of studies was to investigate the effect of particle size with the stone–metal–glass-depleted bio-fraction. Drying curves of three samples with different particle size distributions were measured at two temperatures and two amounts of material. Results are shown in Figure 7. The effect of temperature can be well demonstrated in this case as well; at 105°C, the initial drying rate is as about double that at 65°C. The effect of the particle size distribution is also well demonstrated, although a small variance can be observed for the reasons already described.
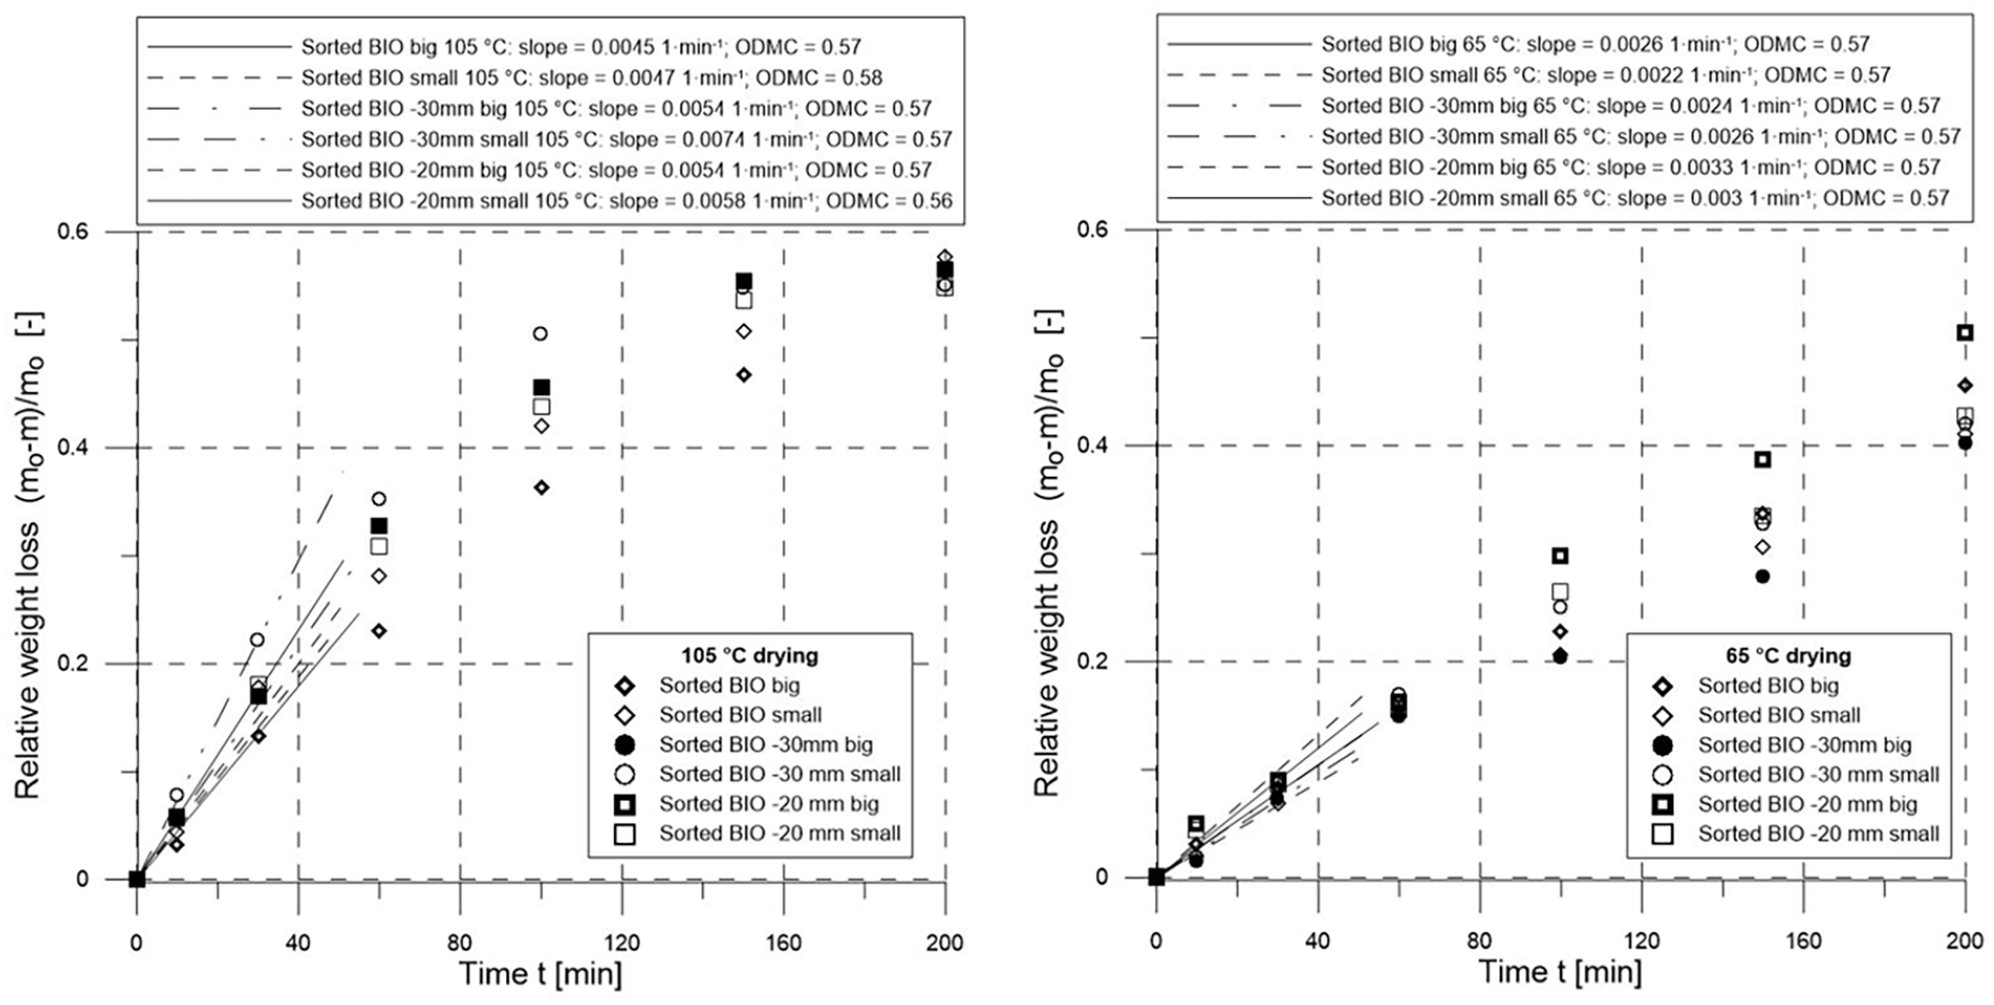
Drying curves of sorted and cut bio-fraction at 105°C (left) and at 65°C (right).
In cases with the same parameters, the 20 mm/30 mm/original ‘slope’ triple numbers, that is, the fine/medium/coarse ratios, are: 0.0054/0.0054/0.0045; 0.0058/0.0074/0.0047; 0.0033/0.0024/0.0026; 0.0033/0.0026/0.0026. The percentages of the finest/coarsest values are as follows: 20%, 23%, 27%, 27% and that means the pre-shredding with the cutting mill with a 20 mm screen resulted in a 25% higher initial water loss rate compared to the unshredded bio-fraction. The effect of particle size distribution on the initial water loss rate is a very complex phenomenon. There is still work to be done to explore the theoretical reasons. Here, we discuss two opposite effects. Shredding also results in the exploration of the material; thus, the initial water loss is more dynamic. The finer-grained aggregate has a smaller pore size, making the loss of hygroscopic water, that is, flow in the pore capillaries, more difficult. In this case, water loss is slower. The particle size distribution of all three examined RMSW fractions can be considered as coarser, so the first phenomenon dominated, which resulted in the approximately 25% increase in initial water loss rate. In this series of measurements, the effect of the amount of material on the drying dynamics can also be demonstrated. The slope percentages with the same parameter (small bowl/big bowl) are as follows: 4.4%, 37%, 7.4%, −15%, 8.3% and −9%. The average increase is 5.5%. The trend is therefore the same as for the reference aqueous measurements, that is, the initial drying rate of the smaller amount of material by weight is higher. As a consequence, the thickness of the material on the belt in the convective belt dryer strongly influences the drying and this parameter is not covered by the already cited and described simple design method of convective dryers. Figure 8 shows the drying curves of mixtures of sorted and shredded bio-fraction and RDF.
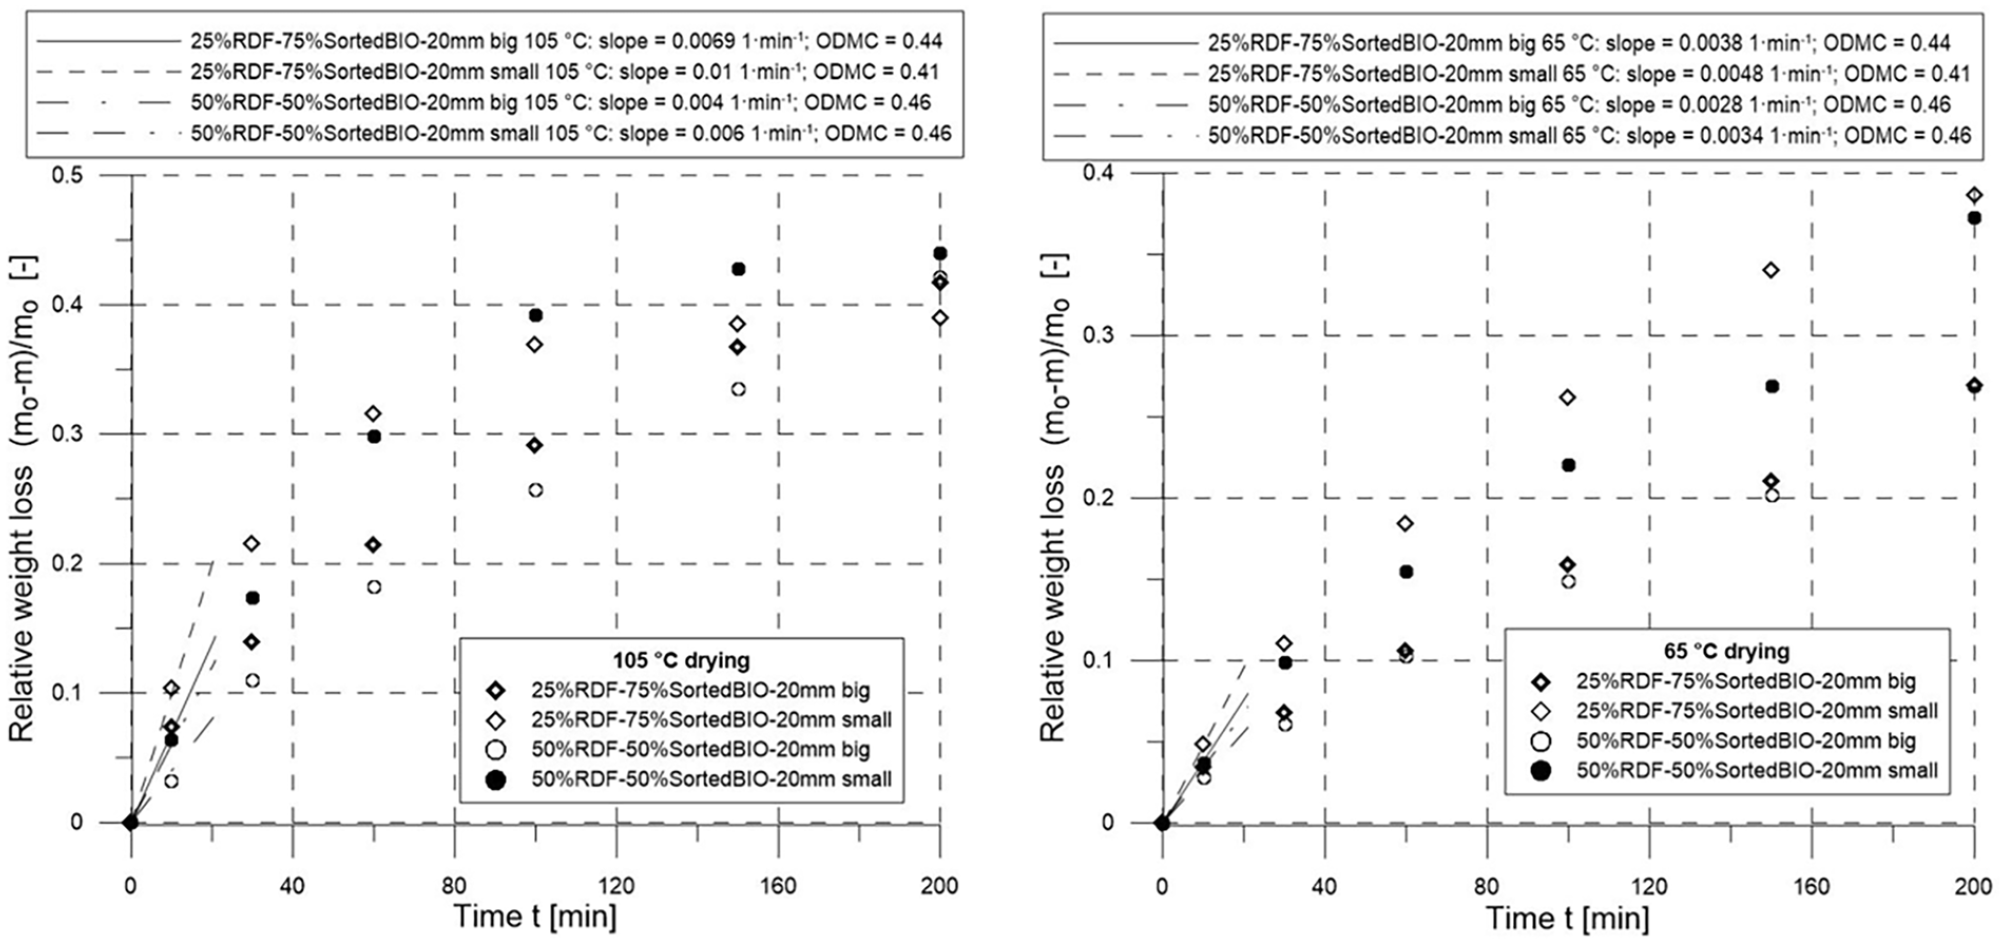
Drying curves of bio-fraction and RDF mixtures at 105°C (left) and at 65°C (right).
The resulting moisture content of two-component mixtures can be easily calculated based on the mass concentration of the components by writing the balance equation of the moisture contents and the dry matters of the components. According to previous measurements, the moisture content of RDF is 0.38 and Sorted BIO-20 mm has a moisture content of 0.57. The calculated resulting moisture content of the 25%–75% mixture is 0.522; the resulting moisture content of the 50%–50% mixture is 0.475. The ODMC values in Figure 8 are lower than this; however, it can be seen that the drying curves of the mixtures have not yet reached the stabilization stage, that is, the samples had not yet dried completely. In the case of mixtures, the ‘slope’ values fall between the ‘slope’ values of the components, that is, here again there is a correlation between the concentration and the initial drying rate. The type of relationship cannot be estimated; it is probably not as easy to calculate the drying rate of the mixture from the proportions of the components as the resulting moisture content. Otherwise, the measurements performed with the mixtures are in line with the previous ones, that is, higher temperature and finer particle size (in the studied range) resulted in faster drying dynamics and a higher amount of material resulted in slower drying dynamics.
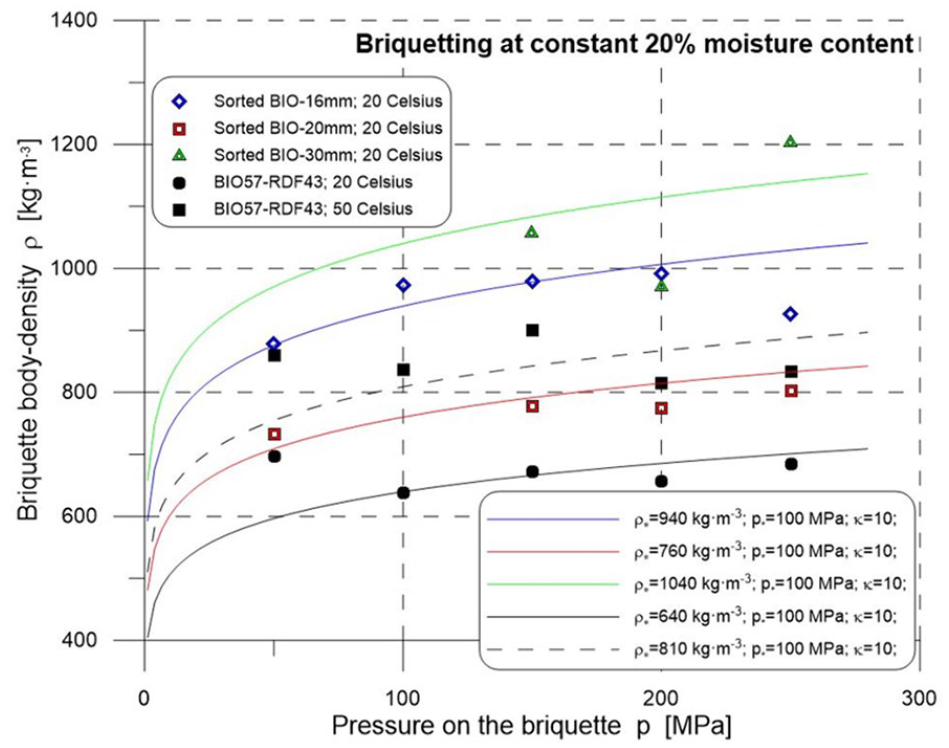
Figure 9 shows prepared bio-fraction and RDF briquettes as examples, and Figure 10 shows the measured briquette body-densities of different prepared bio-fraction samples as a function of pressure at a constant temperature of 20°C.
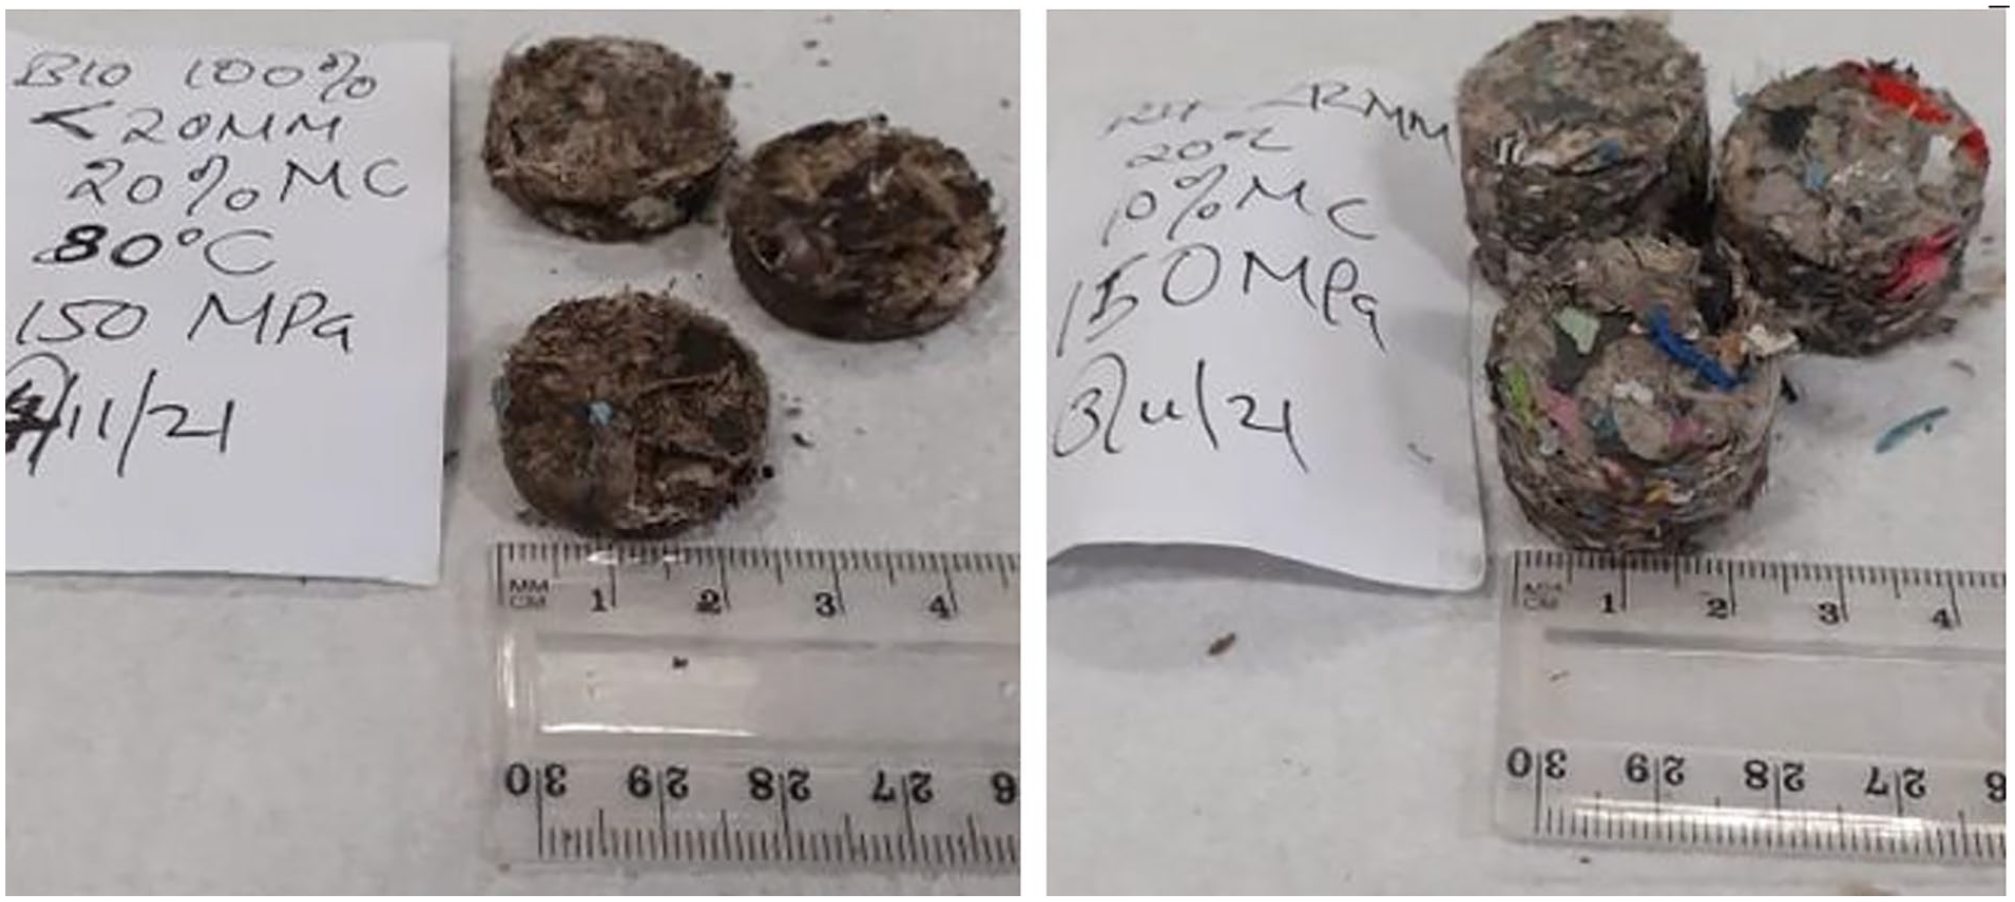
Briquettes. Left: Sorted BIO-20 mm at 150 MPa pressure, 80°C temperature and 20% feed moisture content. Right: RDF at 150 MPa pressure, 20°C temperature and 20% feed moisture content.

The measured briquette body-densities as a function of pressure at constant 20°C temperature.
Figure 10 shows the measured points and the fitted Johanson (equation (3)) equations. The coefficient of determination (R2) values of the fitted equations in Figures 10–12 are in the range of 0.3–0.5, these are low values. However, it is not a question that the Johanson equation fits such agglomeration experiments; rather the general heterogeneous nature of the bio-fraction has caused a kind of scatter in the measured results. Similarly to the Johanson pressure–briquette density function (equation (3)), the same exponential function might be written for the pressure – briquette strength
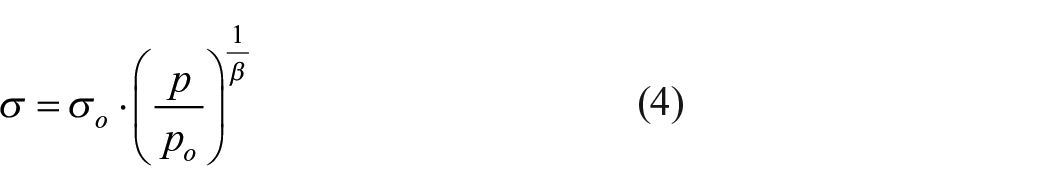
Equation (4) was fitted to the measured briquette strengths and pressure points, and results are shown in Figure 11. These curves and their fitted material parameters, namely the base density
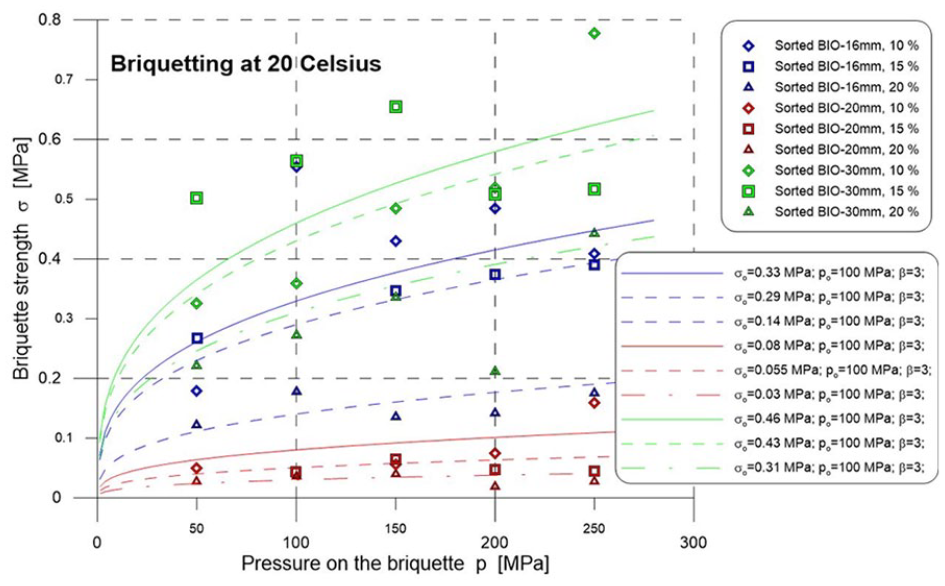
The measured briquette strengths as a function of pressure at constant 20°C temperature.
Measured briquette body density–pressure points at constant moisture content.
The moisture content of the raw sample strongly affects the quality of the produced briquette. The density and strength values of the 20% moisture content are always the lowest, and those of 10% are the highest. The strength of the 15% moisture content briquettes is always smaller than that of 10%, but the body density of the 15% moisture content briquettes is slightly higher than that of 10% in two cases from three. Despite this discrepancy, we concluded that in the tested moisture content range, the lower initial moisture content results in better briquette quality.
Table 1 shows the measured body densities of pressed RDF samples as a function of the briquetting pressure, the moisture content and the temperature. In this case, the original moisture content (34%) RDF material was also tested.
The measured body densities (kg m−3) of pressed RDF samples.
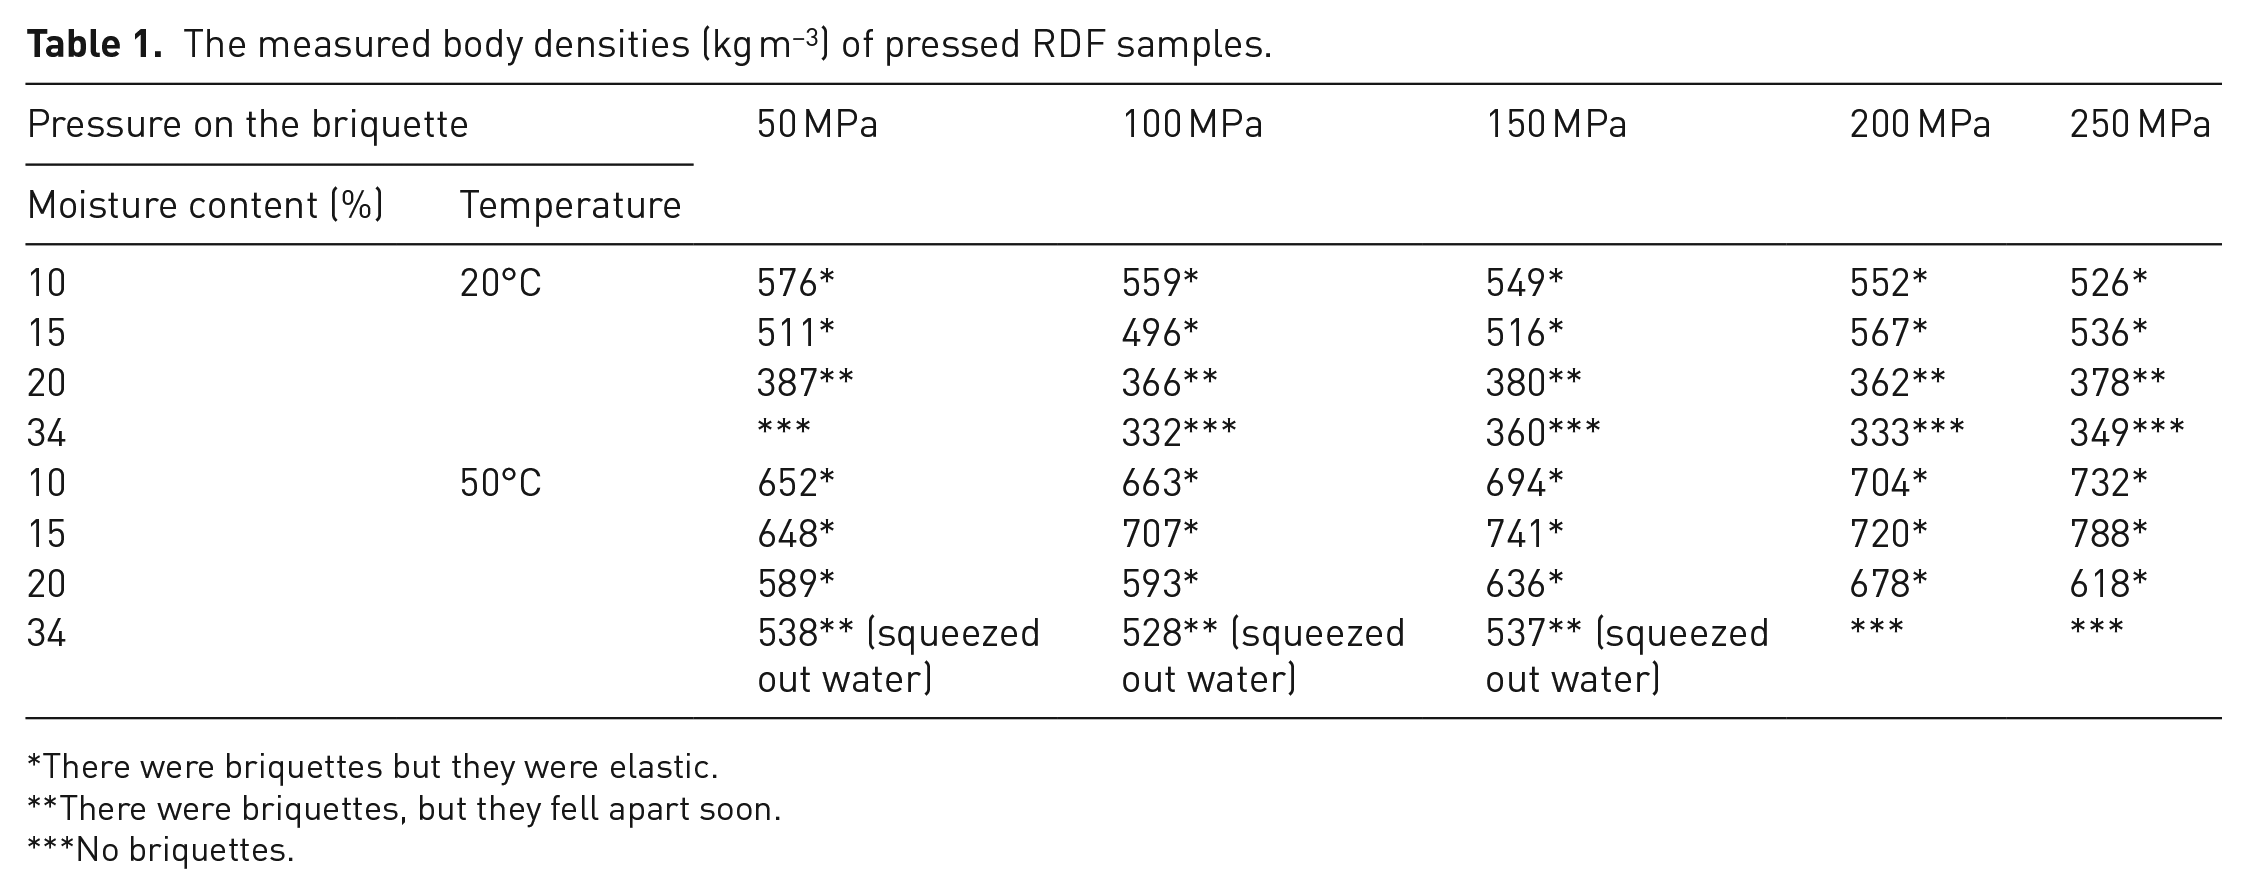
There were briquettes but they were elastic.
There were briquettes, but they fell apart soon.
No briquettes.
The RDF briquette qualities are generally worse than those of the bio-fraction briquettes, namely lower body densities and strengths were measured. However, the general tendencies of the briquetting pressure and the moisture content are similar. In Figure 9, it can be well seen by the naked eye too, that the bio-fraction briquettes are better; the RDF briquettes are looser. Sometimes RDF briquettes were elastic or they fell apart soon after the tests and in some cases water was squeezed out. RDF and bio-fraction mixtures agglomeration was also tested. The experimental mass ratio was set to be the same, the generated RDF–bio-fraction ratio of the Zalaegerszeg – Búslakpuszta RMSW processing plant products, (57% of bio-fraction and 43% of RDF by mass). Figure 12 shows results of differently prepared bio-fraction and the BIO57-RDF43 mixture briquettes properties, when the moisture content was a constant 20%.
At 20°C, the base density
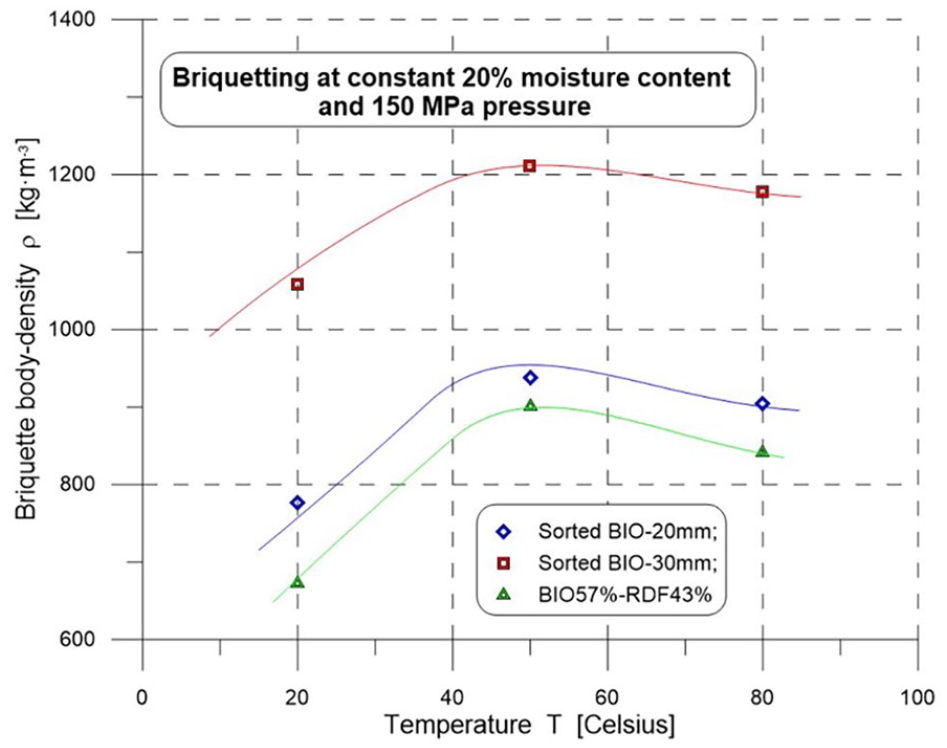
Measured briquette body density–temperature points at constant moisture content and pressure.
As shown in Figure 13 at about 50°C, there is an optimum because the tendencies are very similar at many tests. In this case, only the 20% moisture content and 150 MPa briquetting pressure points are shown for some materials.
Table 2 presents examples of specific briquetting work results.
The specific briquetting work at constant 150 MPa briquetting.
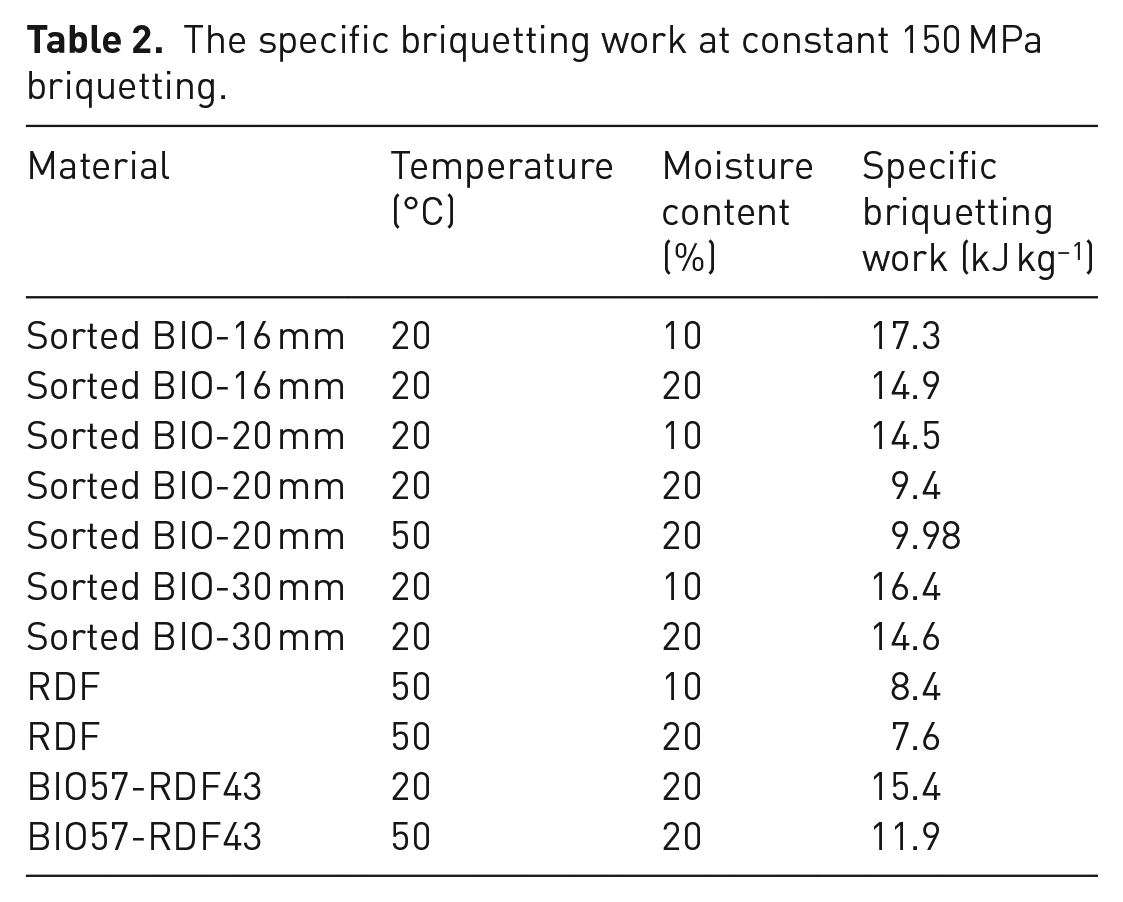
Higher moisture content results in lower specific briquetting work, which might be because the moisture lubricates the surface of the particles, but the briquette quality is worsened by the higher moisture content, as was seen earlier. The effect of the waste material is also shown in Table 2.
The results of the fundamental drying and agglomeration research allow a model calculation to be carried out. Let us calculate the necessary theoretical power of the combined convective drying and agglomeration of 5 t hour−1 capacity BIO57–RDF43 mixture, when the initial 49% moisture content is been lowered to 16% and agglomeration happens there. That means 1.96 t hour−1 moisture has to be removed. Optimal feed parameters of the Zalaegerszeg – Búslakpuszta pyrolysis reactor are still not known. Too much water in the feed is surely not beneficial, and the particles fed (briquettes or pellets) should be neither loose or too compact and hard. Therefore, the model calculation uses the quasi-optimal values of the fundamental research. Let us assume the average ambient air temperature is 16°C and relative moisture content is 70%. According to the psychrometric chart, the absolute moisture content is 0.008 kg kg−1 and the enthalpy is 10 W hour kg−1 of this air. We heat the ambient air in a calorifer up to 50°C, when the absolute moisture content remains the same, but the enthalpy increases to 19.72 W hour kg−1. The necessary quantity of the wet air to be reduced (187 t hour−1), and the theoretical necessary heat power (1.82 MW) can be calculated by equations (1) and (2). During the moisture transfer between the heated air and the bio-fraction RDF mixture, it is assumed that the air becomes vapour saturated; therefore, it cools down to 24°C, its enthalpy stays the same, but its absolute moisture content increases to 0.0186 kg kg−1. The remaining 3.03 t hour−1 and about 20°C dried solids go to agglomeration, where the measured specific briquetting work is 15.4 kJ kg−1 at 150 MPa pressure; therefore, the necessary theoretical briquetting power is about 13.0 kW. These numbers shed light on technological conditions. The necessary energy for the moisture evaporation is much higher than for briquetting, therefore not the optimal briquetting circumstances, rather the allowable maximum moisture content in the pyrolysis reactor determines the target moisture content of the drying process. The pyrolysis reactor optimum circumstance also determines the optimum briquette strength. The suitable briquetting pressure can then be selected on the basis of this fundamental research.
Conclusion
Fundamental drying experiments revealed that drying at 105°C results in about twice the initial moisture loss rate compared to drying at 65°C. When drying RDF and bio-fraction separately in similar equipment with the same capacity, the initial drying rate of RDF is approximately three times that of the bio-fraction. Samples of 50–80 g had an initial drying rate around 5% larger than samples of 100–120 g under otherwise identical conditions. This validates the known fact that the width of the material bed on the drying belt strongly affects drying. The initial drying rate of the −20-mm cutting mill cut stone–metal–glass-depleted bio-fraction is approximately 25% larger than if shredding did not take place. The average moisture content of RDF and bio-fraction mixtures can be easily calculated from the mixing ratio. The initial drying rate of the mixture is between the initial drying rates of the two components separately and is a function of the mixing ratio. This function relationship could not be determined from this measurement.
Briquetting fundamental tests revealed that higher moisture content results in smaller specific briquetting work, possibly due to the moisture lubricating the surface of the particles, and briquette quality – density and strength – is worse for the higher moisture content. Because of the measured Johanson model-like compressibility functions and the compressibility factor value of 10, the briquette density and strength only slightly increases above 100 MPa briquetting pressure; therefore, such high pressures are not necessary.
A model calculation for the theoretical energy demand of 5 t hour−1 mixed bio-fraction and RDF combined drying and agglomeration pre-treatment has been carried out based on the presented results and methodology. The energy required for the moisture evaporation is much higher than for briquetting, meaning that the allowable maximum moisture content in the pyrolysis reactor determines the target moisture content of the drying process, and not the optimal briquetting circumstances. Optimum briquette strength is determined by the pyrolysis reactor optimum circumstances. This research contributes to selecting the suitable briquetting.
Footnotes
Acknowledgements
Authors express their gratitude to the 3B Hungary Ltd. for their professional and economic support for the drying and agglomeration experiments.
Declaration of conflicting interests
The authors declared no potential conflicts of interest with respect to the research, authorship, and/or publication of this article.
Funding
The authors received no financial support for the research, authorship, and/or publication of this article.