
Abstract
Plastic waste has become a major contributor to global environmental pollution. Some of the environmental impacts of plastic waste include littering, the formation of plastic debris in oceans and the contamination of freshwater and terrestrial habitats. Policymakers face great challenges in mitigating plastic waste. Indonesia is considered the second largest contributor of plastic waste in the world. However, existing policies have not addressed this issue. Policies, such as bans on single-use plastic bags and fees on plastic bags, have recently been implemented in some pilot cities, but the results remain unclear. Thus, this study proposes feasible policies to mitigate plastic waste in Indonesia using system dynamics. Specifically, this study seeks to develop a dynamic model of plastic waste mitigation and to propose a policy scenario for plastic waste mitigation. The proposed policies consist of a plastic bag ban, a plastic bag fee, a recycling centre and extended producer responsibility (EPR). The analysis demonstrates that an effective mixed policy instrument for reducing plastic waste depends on the plastic waste type. Regarding plastic bottles, the effective mixed policy is a combination of a recycling centre and EPR. For plastic bags, the effective mixed policies include the following combinations: a plastic bag fee and plastic bag ban, a plastic bag fee and recycling centre and a plastic bag ban and recycling centre.
Introduction
Plastic waste pollution has become a major problem worldwide. Plastics are prevalent worldwide due to their durability, versatility and affordability. There is an annual increase in global plastic production, and most plastic is used for packaging (Luijsterburg and Goossens, 2014). However, the biodegradability of plastic is very slow; thus, it often accumulates in landfills (Geyer et al., 2017). It also generates negative externalities for the environment, including water contamination and plastic debris in the ocean (Jambeck et al., 2015; Walker and Xanthos, 2018). Plastic waste pollution and mitigation remain major challenges for policymakers (Dhanshyam and Srivastava, 2021).
According to previous studies, Indonesia is considered the second largest contributor of plastic waste in the world, following China (Jambeck et al., 2015; Tibbetts, 2015). Indonesia generates approximately 11% of the total plastic waste worldwide, and the ratio of mismanaged waste is relatively high, that is, 83% (Jambeck et al., 2015). Furthermore, 85,000 tonnes of plastic bags are disposed of in the local environment (Ministry of Environment and Forestry of Indonesia, 2020), resulting in pollution in the country’s rivers and oceans. In 2020, 17% of Indonesia’s municipal solid waste was composed of plastic (Ministry of Environment and Forestry, 2020). If this issue is neglected, it can endanger other living creatures (United Nations, 2016). Between 2016 and 2018, several local governments implemented single-use plastic bag ban regulations, including Bali Province, Denpasar city, Bogor city, Banjarmasin city, Balikpapan city, Padang city and Purwakarta Regency (Ministry of Environment and Forestry, 2020). However, the effectiveness of these policies remains unclear.
In response to public environmental awareness, particularly regarding plastic pollution, governments, nongovernmental organizations and industry have launched various environmental programs, including voluntary and regulatory initiatives (Syberg et al., 2021; Wagner and Schlummer, 2020). As a result, Syberg et al. (2021) and Wagner and Schlummer (2020) stated that a circular economy approach is being promoted. In business and entrepreneurial practices, Neumeyer and Santos (2018) and Neumeyer et al. (2020) argued that to decrease environmental degradation, sustainable practices, technologies and processes are necessary. Moreover, Neumeyer et al. (2020) pointed out that business practices must be aligned with the principles of sustainable resources for a circular economy. Regarding regulation, in 1994, Denmark became the first country to implement a levy on plastic bags (Danish EPA, 2013). Subsequently, other countries also started similar plastic reduction policies, such as the plastic bag ban in Bangladesh and the levy on plastic bags in Ireland in the early 2000s (Syberg et al., 2021).
Numerous studies have proposed various waste mitigation policies. Some of these policies include disposal fees (Kinnaman and Fullerton, 1994), subsidies for recycling (Gradus et al., 2017), curbside recycling facilities (Kinnaman and Fullerton, 2000), waste recycling technologies and emission trading (Bing et al., 2015). A combination of policies was suggested by Abbott et al. (2017), Hao et al. (2019), Palmer and Walls (1997) and Ulli-Beer et al. (2007). Palmer and Walls (1997) suggested a deposit-refund policy in the United States. Ulli-Beer et al. (2007) suggested an inertia policy, a prepaid tax with flexible and constant garbage bag charges and unit pricing for burnable and recyclable material in Switzerland. Abbott et al. (2017) suggested curbside and noncurbside recycling in the United Kingdom. Hao et al. (2019) suggested enhancing waste sorting, reducing illegal dumping behaviours, promoting the government’s financial subsidies and raising waste landfilling charges in China. Walker and Xanthos (2018) reported various rates of success in the implementation of a single-use plastic bag ban in many developed countries. A similar study by Rivers et al. (2017) also concluded that disposable bag levies are effective in nudging frequent users toward less use. However, previous studies that focused on examining policy effectiveness have shown various results. For example, Taylor (2019) argued that the regulation of disposable plastic bags might have a leakage effect. A study by Bharadwaj et al. (2019) showed that the plastic bag ban policy in Nepal was ineffective. It can be inferred from previous studies that the implementation of plastic waste policies may have a variety of different effects. Thus, it is important to consider which policies are suitable for implementation.
To formulate and simulate effective policies, system dynamics (SD) is widely used. SD was developed by Forrester in the 1960s and is useful for understanding how a system behaves and how variables are related among themselves (Sterman, 2000). As a decision support system, SD is frequently used to analyse policy implications (Mingers and White, 2010). In the context of waste management, several studies have applied the SD model, for example, in certain waste management stages, such as waste generation (Dyson and Chang, 2005; Kollikkathara et al., 2010), waste source separation (Sukholthaman and Sharp, 2016), construction waste reduction (Hao et al., 2007, 2019), disposal charging fees in construction (Yuan and Wang, 2014), food waste (Tseng et al., 2019), hospital waste (Chaerul et al., 2008), waste recycling (Mafakheri and Nasiri, 2013; Ulli-Beer et al., 2007, 2010) and eco-design policies (Dace et al., 2014). At present, SD has rarely been applied to analyse plastic waste management. The application of SD to plastic waste management is found only in the study by Long et al. (2012), who discussed plastic waste generation, and a recent study by Dhanshyam and Srivastava (2021), who proposed an effective mixed policy for plastic waste mitigation in India. This study builds on the previous research from India by Dhanshyam and Srivastava (2021) to formulate a mixed plastic waste policy that is applicable in Indonesia. In their study, Dhanshyam and Srivastava (2021) employed four key policy interventions: disposal fees, recycling subsidies, investment in curbside recycling facilities and bans on plastic bags. Notably, not all policies proposed in the study by Dhanshyam and Srivastava (2021) are suitable for implementation in other countries, such as Indonesia, even though they are both developing countries. Furthermore, although the effectiveness of plastic use policies varies, this study proposes to adopt the implementation of mixed waste mitigation policies that are currently being considered in Indonesia, such as a plastic bag fee, a plastic bag ban, a recycling centre and extended producer responsibility (EPR).
To summarize, the mismanagement of plastic waste has led to negative externalities for the environment, including water contamination and plastic debris in the ocean. In response to this issue, various environmental programmes and initiatives have been launched, including the promotion of a circular economy and sustainable business practices. Different waste mitigation policies have been proposed, including disposal fees, subsidies for recycling, waste recycling technologies and emission trading. However, the effectiveness of policies may vary, and it is important to consider which policies are suitable for implementation. The implementation of plastic waste policies may have different effects, and to make informed decisions, it is crucial to understand how variables are related to each other in the system. This study aims to create a dynamic model of plastic waste mitigation and to propose a mixed policy scenario for plastic waste mitigation in Indonesia. The policies consist of a plastic bag ban, a plastic bag fee, a recycling centre and EPR. The SD model is developed based on Powersim Studio 10 software and a simulated mixed policy scenario of plastic waste mitigation that will be useful, particularly for decision-makers. The simulation of the plastic waste mitigation scenario is conducted for a 14-year period using mixed policy interventions.
The remaining sections of the article are outlined as follows. In section ‘Literature review’, the plastic waste management policies and SD approach used to create the plastic waste mitigation model are briefly explained. Section ‘An SD model for the formulation of a plastic waste mitigation policy’ describes the process and development of the model. Section ‘Results and discussion’ presents the simulation and validation of the SD model as well as the analysis of the policy scenarios. The conclusions and policy implications are provided in section ‘Conclusions’.
Literature review
Plastic waste generation and management
Plastics are one of the most common products used by people in their daily lives. Plastics have gained popularity in society due to their durability and affordability (PlascticEurope-Association of Plastics Manufactures, 2020). The production of plastic has grown faster than that of any other human-made material (Geyer et al., 2017). Furthermore, Geyer et al. (2017) argued that the global shift from reusable materials to single-use containers has affected the growing market for plastic packaging. Unfortunately, information on plastic biodegradability in the world is lacking (Geyer et al., 2017).
Waste management policies
The previous literature has extensively discussed various waste management policies. Some scholars have suggested waste disposal charging that includes fees (flat fees) and quantity-based fees (Chu et al., 2019). However, the implementation of waste disposal fees is problematic (Cheng et al., 2020; Dresner and Ekins, 2010; Gellynck and Verhelst, 2007; Kinokuni et al., 2021; Usui, 2008; Wu et al., 2015). A study by Kinnaman and Fullerton (1994) suggested that a user fee may be implemented in areas where administrative costs are low, the increase in recycling is significant and the increase in waste dumping is slight. Other waste management policies related to plastic waste are pricing mechanisms (Dikgang and Visser, 2012; Nielsen et al., 2019), single-use plastic bag ban policies (He, 2012; Muposhi et al., 2021; Nielsen et al., 2019), plastic recycling policies (Gradus et al., 2017; Hopewell et al., 2009; Jang et al., 2020) and EPR (Jang et al., 2020; Tibbetts, 2015). The details of each plastic waste policy are described below.
Plastic pricing mechanism policy
Single-use bags that are freely distributed to consumers make them appear cost-free; therefore, consumers tend to consume excessively since they are unaware of the price (Taylor and Villas-Boas, 2016). Thus, it is necessary to change consumer behaviour to reduce the use of single-use plastic bags. The approach is to apply a plastic bag fee or price. The plastic pricing mechanism in this study is defined as charging a fee for a single-use plastic bag. In 2002, Ireland introduced a plastic pricing mechanism, resulting in a 90% reduction after 1 year of implementation (Nielsen et al., 2019). In 2007, Botswana also introduced a pricing policy of plastic bag fees, resulting in a significant decrease in plastic bag demand (Dikgang and Visser, 2012). In 2007, Belgium’s implementation of a fee mechanism through voluntary agreements resulted in an 86% reduction from 2003 to 2011. In Indonesia, a plastic pricing mechanism was implemented in 23 pilot cities in 2016 (Nielsen et al., 2019). A similar plastic pricing mechanism was introduced in Selangor, Malaysia and Israel in 2017 (Nielsen et al., 2019). The effects of the plastic pricing mechanism in various countries have been proven to reduce plastic consumption by 42–90% according to each country that implemented the policy. The reduction effects on plastic consumption after the implementation of the plastic pricing mechanism policy are shown in Supplemental Appendix Table A1.
Single-use plastic bag ban policy
The single-use plastic bag ban policy is defined as a prohibition that prevents retailers from offering single-use bags in stores. A study by Sharp et al. (2010) showed that shoppers were generally opposed to the plastic bag ban policy, but this opposition diminished after the law was implemented. The information provided about the effects of the plastic bag ban policy is less than the information on the effects of the plastic pricing mechanism. One available piece of information is provided by He (2012), who mentioned that the plastic bag ban policy in China had reduced plastic consumption by 49%. Muposhi et al. (2021) conducted a systematic literature review and reported that plastic bag ban policies resulted in limited success in various countries. Nielsen et al. (2019) conducted a study on the success of plastic bag ban policy implementation in Italy (2011) and Sao Paulo, Brazil (2015), finding that policy implementation in Italy and Brazil was able to reduce plastic consumption by 50 and 70%, respectively. The implementation of plastic bag ban policies in other countries, such as India (1999), Bangladesh (2002), Papua New Guinea (2005), Tanzania (2006), Uganda (2007) and Ethiopia (2008), was reported to have no noticeable effect (lack of implementation) (Nielsen et al., 2019). In addition, a plastic bag ban may lead to increased environmental problems, as stated by Nielsen et al. (2019). Examples of plastic bag ban policy implementation and the policy effects are presented in Supplemental Appendix Table A1.
Plastic recycling policy
According to the EU, recycling means ‘any recovery operation by which waste materials are reprocessed into products, materials or substances whether for the original or other purposes’ (European Commission, 2008). Resource recycling is the most efficient way to solve the waste problem in cities (Tong and Tao, 2016). Furthermore, Hopewell et al. (2009) argued that recycling may have impacts on reducing carbon dioxide emissions and the volumes of waste that need to be disposed of. One study found that recycling plastic waste is one of the policies contributing to plastic waste reduction in the Netherlands (Gradus et al., 2017). The study also explained that the Netherlands has a rigid plastic waste policy, as indicated by 50% of plastic packaging being recycled in 2014, which is close to the goal of 52% plastic recycling. In that scheme, the costs for household plastic waste collection, separation and recycling are paid by the packaging industry, with the industry being required to announce the waste volume of plastic packaging. For household waste, the plastic packaging recycling rates in developed countries, such as Germany, the United Kingdom, Belgium, France, Japan and South Korea, are considered high (Jang et al., 2020).
Recycling in Indonesia is often carried out by households and scavengers. In many cities, scavengers collect recyclable materials such as paper, plastic and glass from households and then sell them to recycling facilities or middlemen. Some households also engage in recycling by sorting and selling their own waste. This informal sector is an important source of income for many people in Indonesia and contributes to reducing waste in the country. However, the recycling process in Indonesia is often informal, and informal recyclers face numerous challenges, such as a lack of access to information, infrastructure and protective equipment, which can pose a threat to their health and safety. Despite these challenges, the informal recycling sector plays a crucial role in promoting waste reduction and resource efficiency in Indonesia.
Extended producer responsibility
In EPR, product manufacturers bear the financial responsibility for end-of-life disposal, thereby encouraging them to improve product design, reuse and recycling (Sachs, 2006). EPR was developed by European nations to improve the management of plastic waste and to reduce pollution from plastic waste in marine environments (Tibbetts, 2015). Furthermore, Tibbetts (2015) mentioned that Sweden was the first country to formally outline the principle of EPR in 1990. EPR is described as shifting responsibility for the financial aspect of collecting and recycling waste from municipalities to producers (Diggle and Walker, 2020; Kunz et al., 2018; Tibbetts, 2015). Under an EPR scheme, producers are responsible for managing or disposing of packaging after customers use their products (Tibbetts, 2015). In some US states and some European countries, container-deposit systems are the most common EPR systems that have been implemented (Tibbetts, 2015).
Under the Regulation of the Ministry of Environment and Forestry, the EPR scheme in Indonesia has been explained in detail as a roadmap of waste reduction by producers (Ministry of Environment and Forestry, 2019). Under that regulation, the waste reduction target is 30% by the end of 2029.
Mixed policy scenario
With regard to reducing waste generation in general, the implementation of a mixed policy scenario is found in several countries, such as the United States, Belgium, China, Botswana and South Africa (Nielsen et al., 2019). Dinan (1993) was among the first to assert the effectiveness of a combined policy – a disposal tax and reuse subsidy. Palmer and Walls (1997) concluded that the combined deposit-refund policy is easy to implement compared to the recycled content standard. However, previous studies that discussed the effectiveness of mixed policy scenarios focusing on plastic waste mitigation remain limited. A study by Dhanshyam and Srivastava (2021) stated that single waste mitigation policies, such as disposal fees and recycling subsidies, are less effective, but a mix of such policies is highly effective. Moreover, Dhanshyam and Srivastava (2021), Dinan (1993), Hao et al. (2019) and Palmer and Walls (1997) argued that multiple policies can be applied concurrently to achieve the long-term goal of reducing plastic waste. For example, the implementation of a partial plastic bag ban and plastic bag fee in China in 2008 reduced plastic consumption by 49% after 4 months. Another example is the implementation of a plastic ban for thin plastic bags and a pricing mechanism in Colombia in 2017, which reduced plastic consumption by 35%. The effects of various countries’ mixed plastic waste mitigation policies are shown in Supplemental Appendix Table A2.
The literature on waste management policies has focused on various approaches, such as charging fees, pricing mechanisms, single-use plastic bag bans, plastic recycling policies and EPR. Studies have reported various levels of success with each of these policies, including the plastic pricing mechanism in Ireland, which resulted in a 90% reduction after 1 year, and the plastic bag ban policy in Italy, which resulted in a 50% reduction. Plastic pricing mechanisms and plastic recycling policies have been seen as the most effective policies. However, the effectiveness of these policies has been subject to various limitations, including a lack of implementation, enforcement mechanisms and infrastructure. The literature review suggests that a multifaceted approach combining several policies may be the most effective way to manage plastic waste. Considering that the effectiveness of each policy differs from one policy to another, it can be concluded that there is no ‘one size fits all’ waste management policy. Given that this study is conducted in Indonesia, the proposed policies that will be used for plastic waste mitigation are selected based on implementation in Indonesia. These policies include (1) a plastic pricing mechanism (no free plastic bags), (2) a plastic bag ban, (3) a recycling centre for plastic packaging and (4) EPR.
The application of SD in waste management
SD is widely used in studies related to the economic, social and environmental aspects of a complex system (Hao et al., 2019). The method is considered useful for analysing the interrelationships among variables in complex systems (Sterman, 2000). The use of SD to formulate policy scenarios in environmental studies that can operate as a decision support system for policymakers is increasing. SD models are able to explore ‘what-if’ scenarios and conduct policy tests (Richardson and Otto, 2008). The conceptual model of SD is represented in the causal loop diagram (CLD), whereas the structure of the analysed system is presented in the stock-and-flow diagram.
In analysing various waste management problems from different perspectives using SD, previous studies have obtained exceptional results. Sinha et al. (2016) used the SD model to examine the possibilities of closing the material flow loop in mobile phone products. Au et al. (2018) examined the impacts of government charges on construction waste disposal using SD. Hao et al. (2019) employed SD to analyse the economic value of waste reduction in the construction industry. Xiao et al. (2020) studied the policy impacts on municipal solid waste management using SD. Based on the studies above, SD has been used for various waste management types. However, to the best of our knowledge, few studies have focused on plastic waste management. One recent study conducted by Dhanshyam and Srivastava (2021) discussed a mixed policy that can mitigate plastic waste in India using SD.
An SD model for the formulation of a plastic waste mitigation policy
An SD model is utilized to create efficient policy scenarios for reducing plastic waste. This model makes it possible to examine the interactions between various variables related to plastic waste reduction, and evaluation will be conducted using Powersim Studio 10 software.
Causal loop diagram
Figure 1 illustrates the CLD for the consumption, generation and management of plastic waste. The arrows from the cause factors to the effect factors depict the causal relationships. The direction of causality is denoted by a positive sign (+) and a negative sign (−). An increase in one variable is followed by an increase in another when the positive (+) sign is present, whereas the negative (−) sign indicates the reverse (Dhanshyam and Srivastava, 2021). Subsequently, causality is also indicated by the reinforcing loop (R) and balancing loop (B) within the CLD, with (R) indicating that causality is shown only by either the positive or negative sign and (B) incorporating a reciprocal connection.
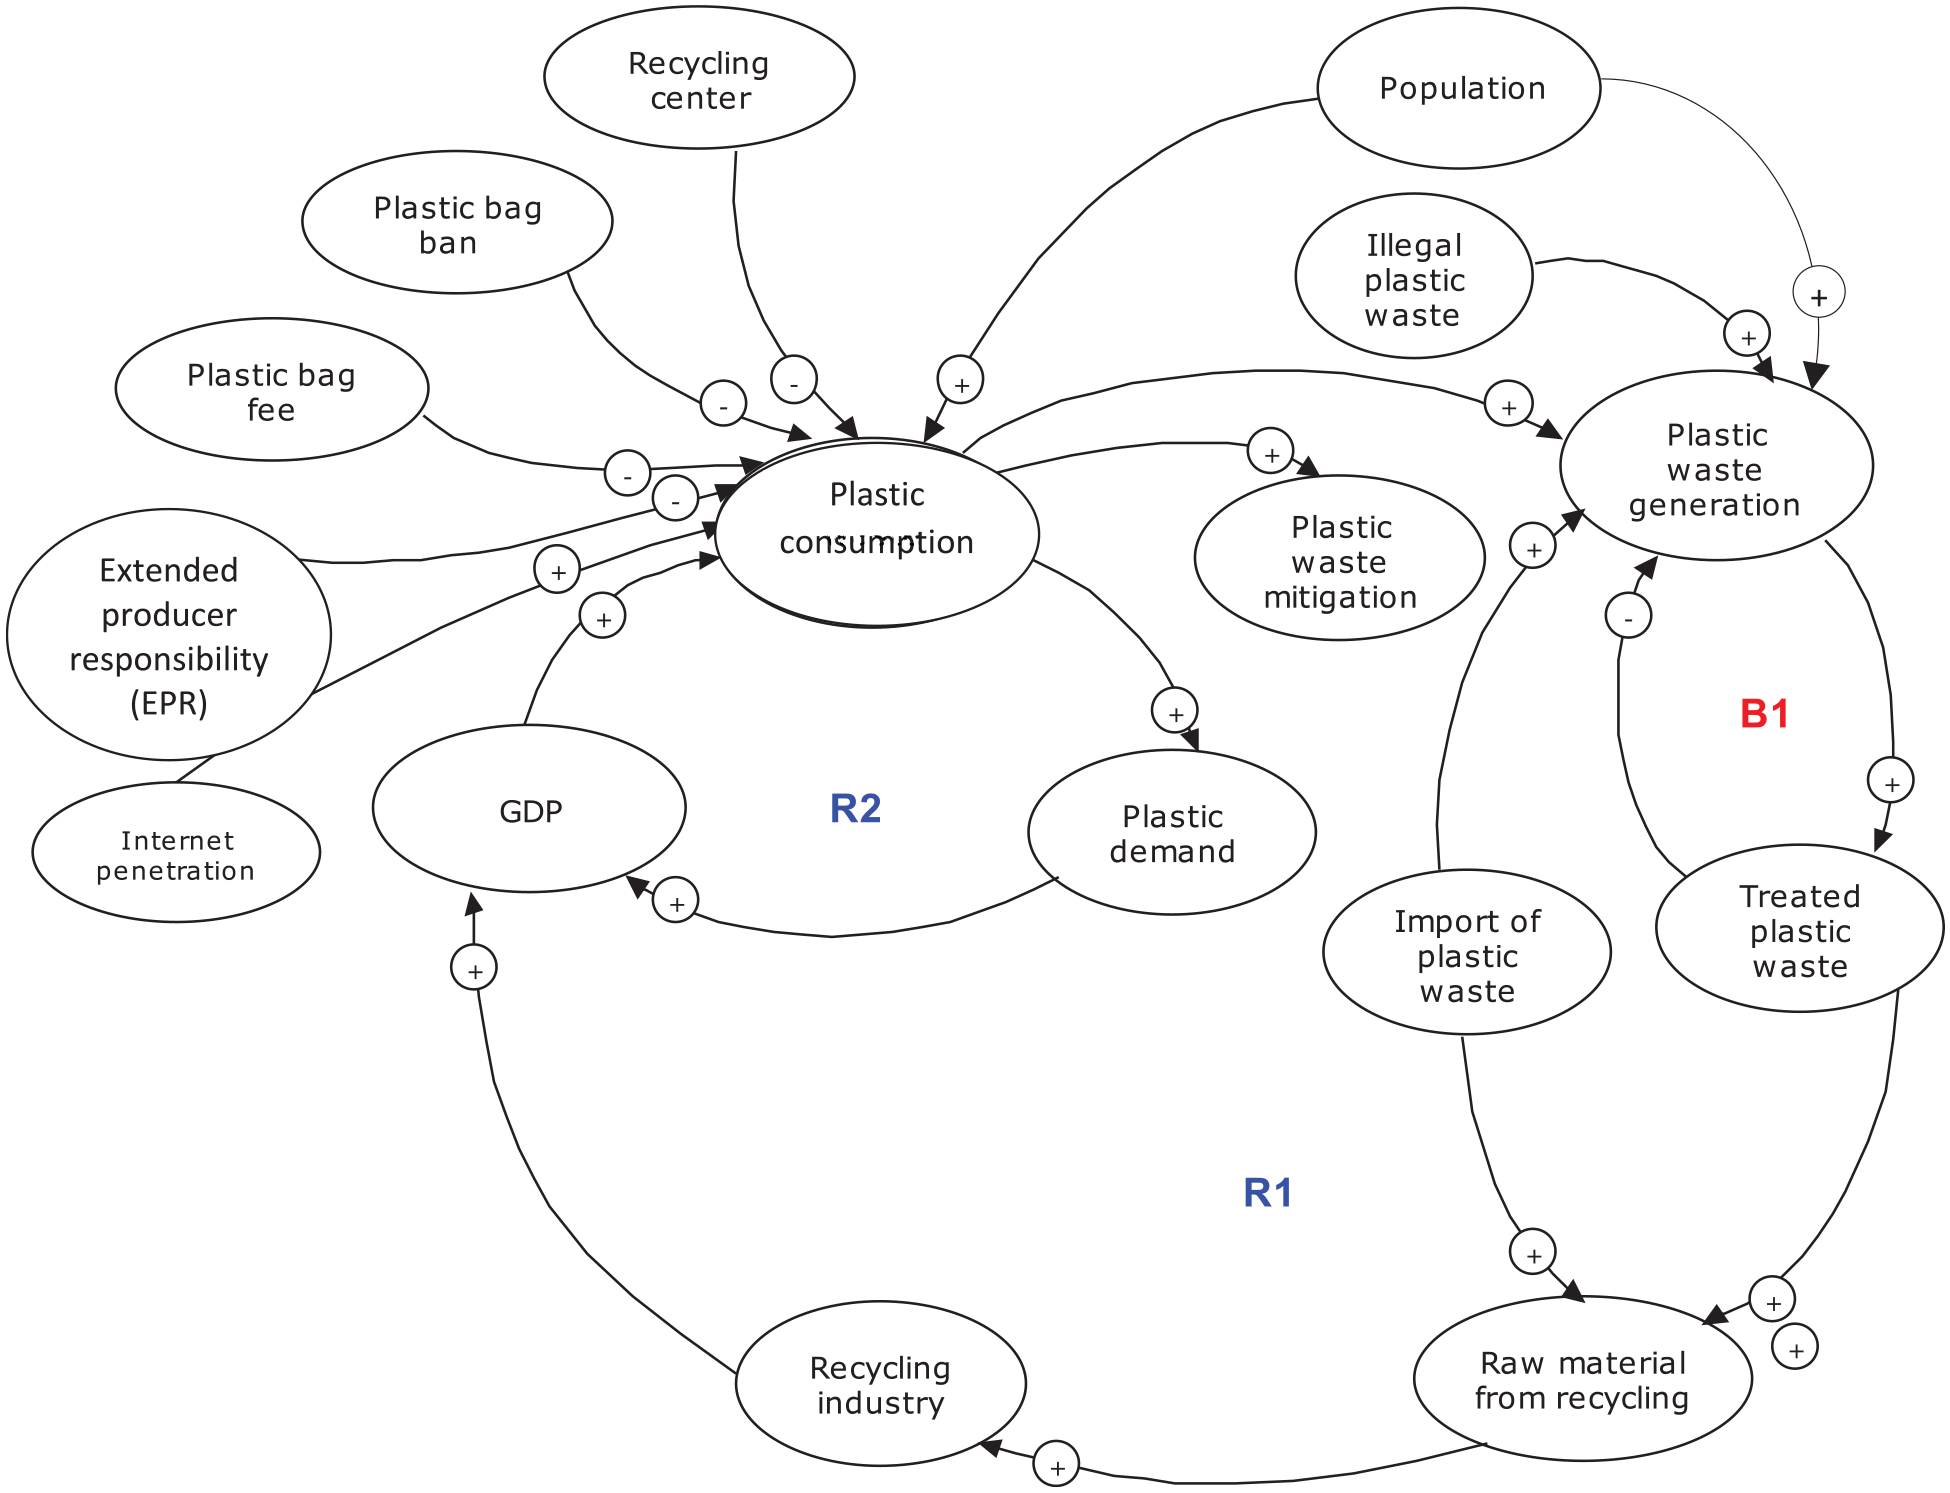
CLD of the consumption, generation, and management of plastic waste.
Waste generation, including plastic waste, is mainly caused by increased consumption. The consumption of goods and services is also influenced by population growth, which ultimately increases total waste generation, including plastic waste. Economic growth, as indicated by GDP growth, may increase per capita income and further affect the increase in consumption, resulting in higher product use, such as food packaging, plastic bottles and plastic bags. The causal loop model consists of three submodels, namely, the plastic waste consumption submodel, the treated plastic waste submodel and the recycling industry submodel. In addition, four proposed policies are added to the CLD.
Plastic consumption submodel
The plastic consumption submodel explains how plastic consumption can affect plastic waste generation. Plastic consumption is influenced by the plastic waste consumption rate, the rate of plastic waste increase and GDP growth. Plastic consumption affects plastic food packaging waste, plastic bag use and plastic bottle use. Jati and Ardi (2020) and Dhanshyam and Srivastava (2021) used variables such as plastic consumption, plastic waste generation and GDP to model the plastic consumption submodel.
Treated plastic waste submodel
In general, treated plastic waste refers to plastic waste that has undergone a processing or treatment method to change its physical or chemical properties for the purpose of recycling, recovery or disposal. Treated plastic waste is influenced by the rate of plastic waste generation, the recycling rate and the amount of plastic waste handled by households, governments, informal sectors and waste banks. Treated plastic waste affects raw materials from recycling, recycling industry growth and recycling industry revenue. Jati and Ardi (2020) used treated plastic waste as a variable to model the treated plastic waste submodel.
Recycling industry submodel
The recycling industry is influenced by the rate of recycling and the availability of raw materials from recycling. The recycling industry affects recycling industry revenue, which subsequently impacts GDP growth. Recycling industry revenue is affected by the recycling product price. Jati and Ardi (2020) and Dhanshyam and Srivastava (2021) used variables such as the recycling industry, the recycling rate and raw materials from recycling to model the recycling industry submodel.
Population submodel
As the population grows, the overall consumption of goods and services also increases as individuals strive to meet their individual needs. The population submodel is included to explain how population growth affects plastic waste generation and then impacts the increase in treated plastic waste. Jati and Ardi (2020) and Dhanshyam and Srivastava (2021) used the population variable to model the population submodel.
In this study, secondary sources, such as the previous literature, databases and reports, were used to gather data. The data on population, population growth and GDP per capita are from the Central Bureau of Statistics, Indonesia. The data on plastic waste consumption are from Our World in Data.
Stock-and-flow diagram
Based on the CLD, all the key variables that affect plastic waste reduction are identified. Figure 2 shows a representation of the stock-and-flow dynamics for waste generation and mitigation with relevant policy interventions. To provide a better understanding of the variables used in the stock-and-flow diagram and their relationships, a detailed list of variables as well as their corresponding types and units is presented in Supplemental Appendix (Tables A3 and A4).
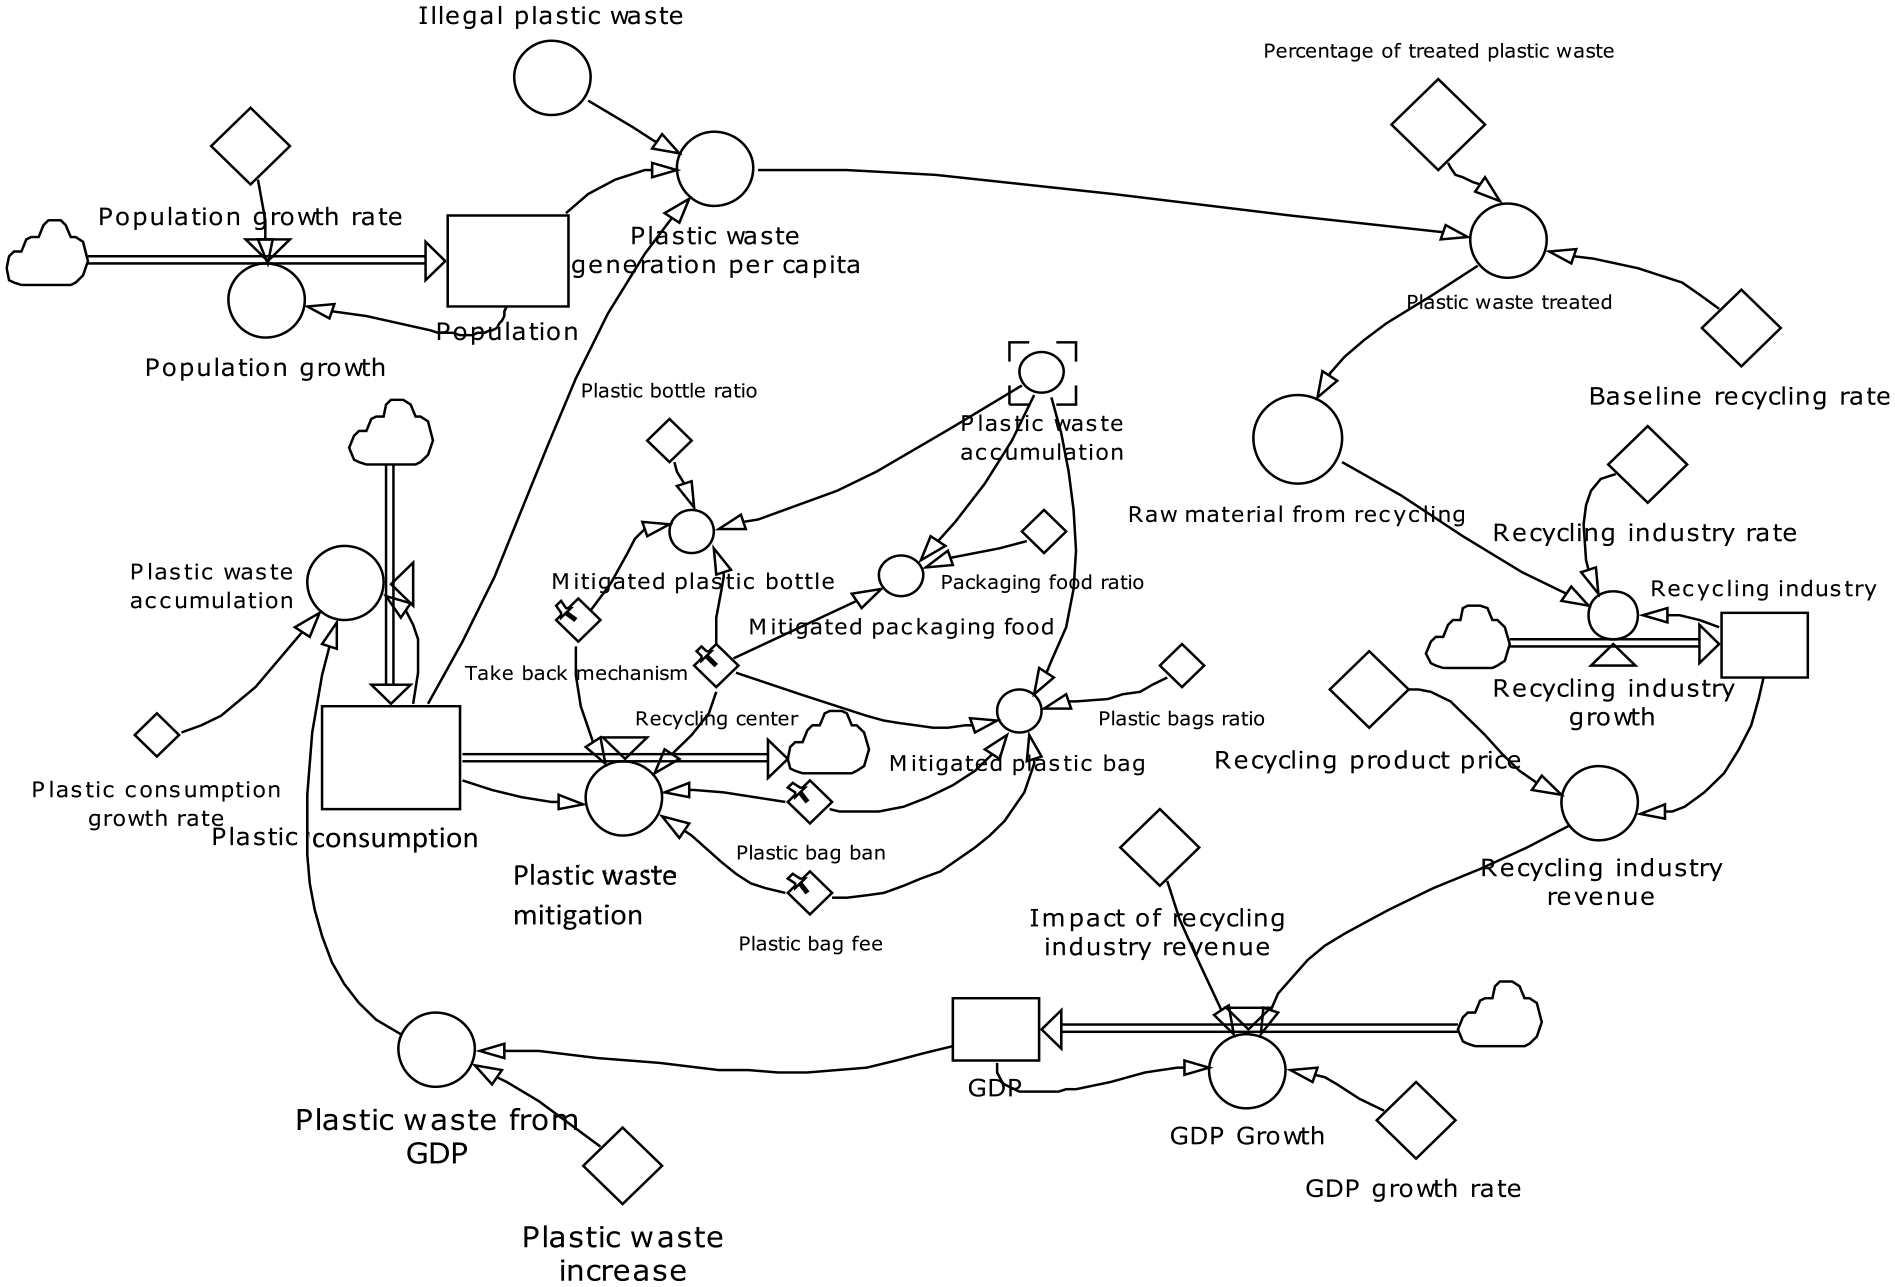
Stock-and-flow diagram of the consumption, generation and management of plastic waste.
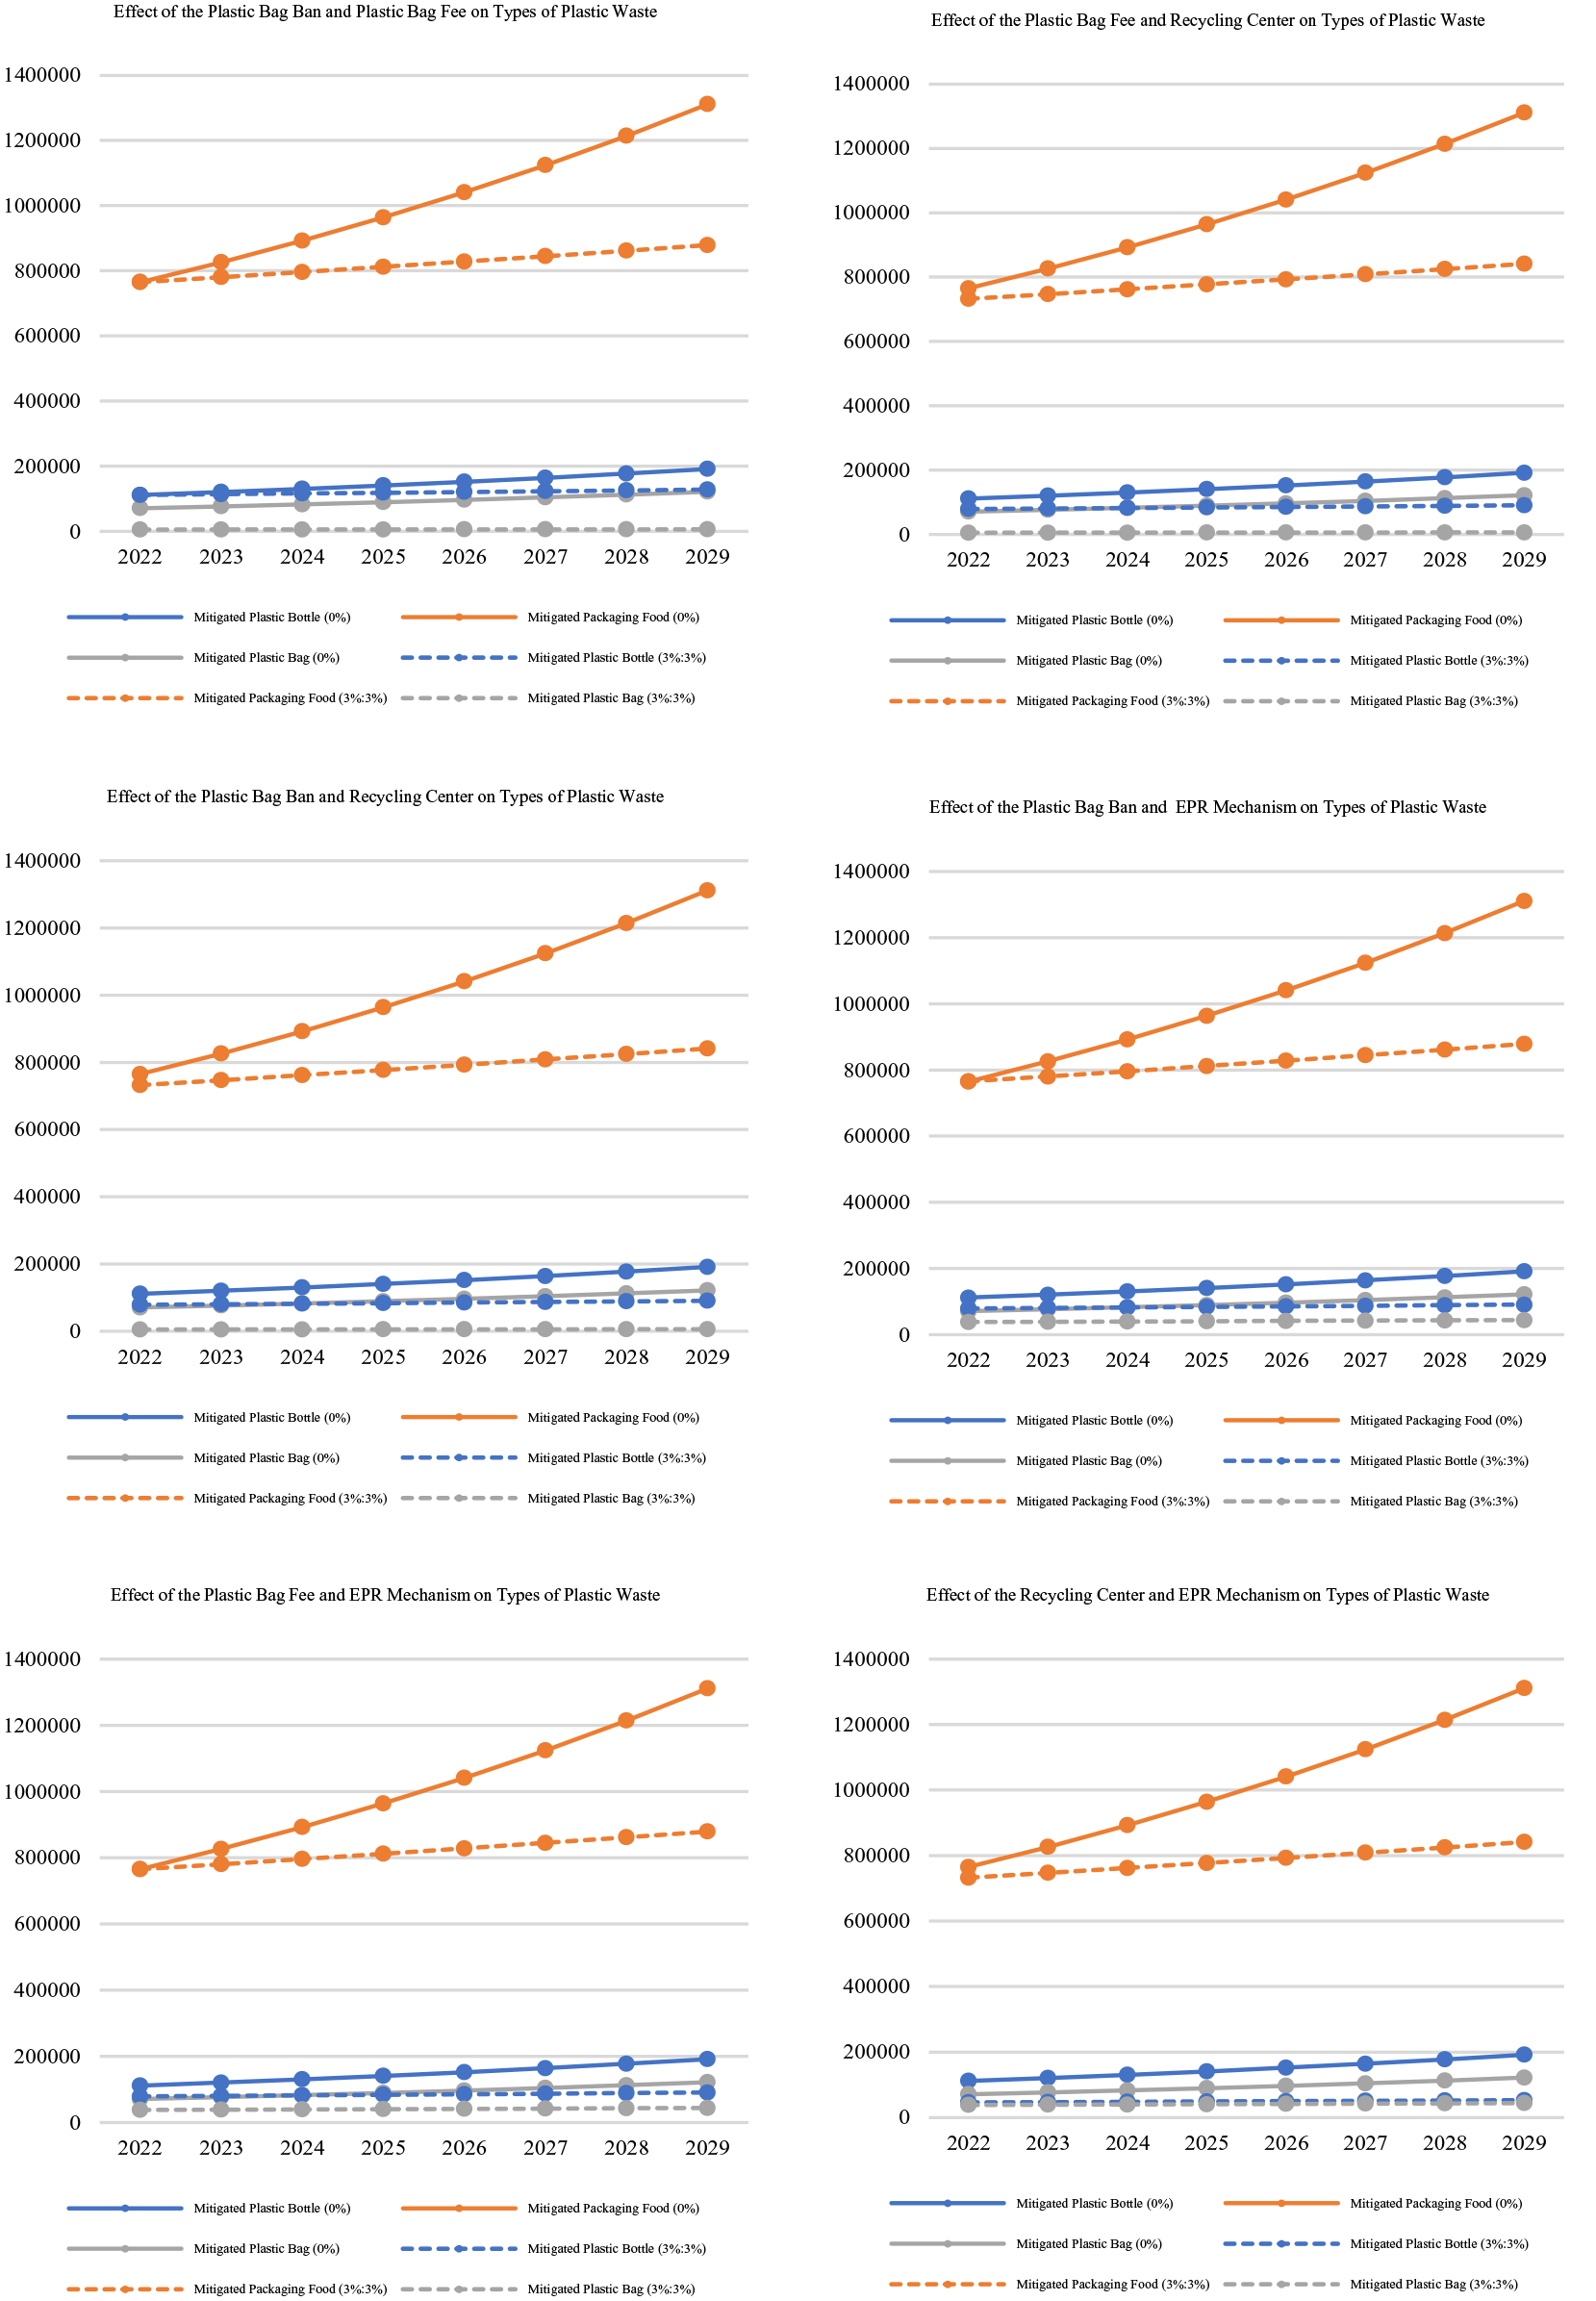
Effects of mixed policy scenarios on plastic waste types.
Policy interventions to mitigate waste have been discussed extensively in the previous literature; however, they differ in terms of cost efficiency (Bohm et al., 2010). In this study, four major policy interventions were modelled. They are (1) a plastic pricing mechanism (no free plastic bags), (2) a plastic bag ban, (3) a recycling centre for plastic packaging and (4) EPR.
Model validation and testing
To evaluate the validity of the model, the output from the simulation is compared to the historical estimates of the variables. The comparison was made for 5 years from 2016 to 2020. The timeframe used for the model validation is considered based on data availability. In accordance with Barlas (1996) and Suryani et al. (2020), accuracy is considered high if the error rate (E1) is ⩽0.05 and the error variance (E2) is ⩽0.3. Therefore, the methods used for model validation and testing are the average mean error (AME) and average variance error (AVE) (Mishra et al., 2022; Santoso et al., 2022; Vanany et al., 2021).

where

where Ss is the normal deviation of simulation and Sa is the normal deviation of data.
Model simulation and scenario analysis
Using the proposed model, different scenarios are simulated in this section. Simulating various policy scenarios is important to determine how the consumption of plastic waste can be reduced based on different scenarios. In this study, there are two types of scenarios: single policy and mixed policy scenarios. The use of both policy scenarios provides a comprehensive comparison of the effects of a single policy scenario and mixed policy scenario. The four single policy scenarios are outlined as follows:
(a) In scenario 1 (S1), a plastic bag fee is introduced, and the current plastic bag price, that is, 200 IDR (equal to 0.010 USD), is adopted.
(b) In scenario 2 (S2), the effect of the plastic bag ban is examined.
(c) In scenario 3 (S3), the effect of implementing the recycling centre policy is examined.
(d) In scenario 4 (S4), the effect of EPR is examined.
Then, combinations of six mixed policies are proposed as follows:
(a) A plastic bag ban and plastic bag fee
(b) A plastic bag fee and recycling centre
(c). A plastic bag ban and recycling centre
(d) A plastic bag ban and EPR
(e). A recycling centre and EPR
(f) A plastic bag fee and EPR
Results and discussion
This study uses the SD model to formulate a policy scenario for plastic waste mitigation. The proposed policies are (1) a plastic pricing mechanism (no free plastic bags), (2) a plastic bag ban, (3) a recycling centre for plastic packaging and (4) EPR. The simulations of each scenario are explained as follows.
Simulation of individual policies
Scenario 1 simulates and analyses the impact of plastic bag fee policy implementation. Currently, some cities are implementing Ministry of Environment and Forestry pilot programs of no free plastic bags, including Jakarta, Surabaya, Yogyakarta, Bali, Sumatera Utara and Kalimantan Timur. The current average price of a plastic bag is 200 IDR (equal to 0.010 USD). According to the Regulation of the Ministry of Environment and Forestry No.75 Year 2019, on the roadmap of waste reduction by producers, the targeted waste reduction by producers by 2029 is 30%. Therefore, this scenario simulates several values to obtain the best results to achieve a 30% reduction in plastic waste. In light of the percentage of the implemented policy, through a trial-and-error test, we found that using 6% can significantly reduce plastic waste by 2029.
The simulation results are presented in Supplemental Appendix Table A5. The results indicate that the implementation of a plastic bag fee that covers 6% of plastic waste consumption can result in a 30% reduction in plastic waste and, more precisely, a reduction of approximately 7.7 million tonnes of plastic waste. Moreover, the implementation of the plastic bag fee policy is effective in reducing plastic bag waste by 94.84%. The impacts of plastic bag fee policy implementation are illustrated in Supplemental Appendix Figure A1.
Scenario 2 simulates and analyses the impact of plastic bag ban policy implementation. Similar to scenario 1, scenario 2 simulates several values to obtain the best results to achieve a 30% plastic waste reduction. The simulation results are presented in Supplemental Appendix Table A6. The results indicate that plastic bag ban enforcement that covers 6% of plastic waste consumption can result in a 30% reduction in plastic waste and, more precisely, a reduction of approximately 7.7 million tonnes of plastic waste. The impacts of plastic bag ban policy implementation are illustrated in Supplemental Appendix Figure A2.
Scenario 3 simulates and analyses the impact of recycling centre policy implementation. Similar to scenario 1, scenario 3 simulates several values to obtain the best results to reduce plastic waste by 30%. The simulation results are presented in Supplemental Appendix Table A7. The results indicate that the implementation of a recycling centre that covers 6% of plastic waste consumption can result in a 30% plastic waste reduction and, more precisely, a reduction of approximately 7.7 million tonnes of plastic waste. Regarding plastic waste types, the implementation of a recycling centre with a coverage of 6% can reduce plastic bottles by 72.28% and plastic bags by 94.84%. The impacts of recycling centre policy implementation are illustrated in Supplemental Appendix Figure A3.
Scenario 4 simulates and analyses the impact of EPR policy implementation. Similar to scenario 1, scenario 4 simulates several values to obtain the best results to reduce plastic waste by 30%. The simulation results are presented in Supplemental Appendix Table A8. The results indicate that the implementation of an EPR policy that covers 6% of plastic waste consumption can result in a 30% reduction in plastic waste and, more precisely, a reduction of approximately 7.7 million tonnes of plastic waste. Moreover, the implementation of the EPR policy is effective in reducing plastic bottle waste by 72.28%. The impacts of EPR policy implementation are illustrated in Supplemental Appendix Figure A4.
Simulation of mixed policies
This section provides a combination of single policy scenarios that have been mentioned previously to determine the best policy scenario. There are six composite mixed policy scenarios, and two policies at a time are considered. The consideration of combinations of only two policies is due to the complexity of each policy. The combined policies are (1) a plastic bag fee and plastic bag ban, (2) a plastic bag fee and recycling centre, (3) a plastic bag ban and recycling centre, (4) a plastic bag ban and EPR, (5) a plastic bag fee and EPR and (6) a recycling centre and EPR.
The simulation results show that any policy combination will contribute to a reduction of 7.7 million tonnes of plastic waste, provided that each policy is implemented with a coverage of 3%. The difference is related to the types of reduced plastic waste in the forms of bottles, plastic packaging foods or plastic bags. The combination of plastic bag ban and plastic bag fee policies will reduce plastic bottles by 32.97%, plastic food packaging by 32.97% and plastic bags by 94.84%. Combinations of either a plastic bag fee and recycling centre or a plastic bag ban and recycling centre will have similar effects on the types of plastic waste reduced. Combinations of either a plastic bag fee and EPR or a plastic bag ban and EPR will have similar effects on the types of plastic waste reduced. The combination of a recycling centre and EPR will reduce plastic bottles by 72.28%, plastic food packaging by 35.84% and plastic bags by 63.90%. The simulation results of the mixed policy scenario are presented in Supplemental Figure 3.
Behaviour validation
The model is validated behaviourally, as suggested by Barlas (1989), by comparing the output of the simulation model with the actual historical estimates of the variable data, with a timeframe of 2016 to 2020 based on data availability. The behavioural test can determine whether the model can reproduce the major behavioural patterns displayed by the existing system (Liu et al., 2020). In accordance with Barlas (1996) and Suryani et al. (2020), accuracy is considered high if the error rate (E1) is ⩽0.05 and the error variance (E2) is ⩽0.3. Therefore, the model is validated by verifying both E1 and E2. As shown in the calculation below, the E1 and E2 values are all less than the criteria suggested by Barlas (1996) and Suryani et al. (2020). Thus, the behaviour of the model is highly valid.
The error rates of variables that have a significant effect on plastic waste mitigation, such as population and plastic waste consumption, are described as follows:
Error rate (E1) of population:

Error rate (E1) of plastic waste consumption:

The error variances of some variables that have a significant effect on plastic waste mitigation, such as population and plastic waste consumption, are described as follows:
Error variance (E2) of population:

Error variance (E2) of plastic waste consumption:

Based on the calculations above, all error rates are less than 5%, and the error variances are less than 30%, which means that the model is valid. A comparison between the data and the model for several variables, including population and plastic waste consumption, is shown in Supplemental Appendix Figures A5 and A6, respectively.
Conclusions
Using SD, this study presents formulation scenarios of plastic waste mitigation policies. The proposed policies are mixed policies. The interactions among several variables involved in plastic waste mitigation are tested dynamically with Powersim Studio 10 software. Using mixed policy interventions, the model simulates Indonesia’s plastic waste stock over a 14-year period. The relationships among plastic waste consumption, plastic waste generation, plastic waste treatment and policy interventions are built from secondary data sources. Using standard testing and validation procedures, the model and results are tested and verified.
The level of mitigated plastic waste is simulated using four policy interventions, including a plastic bag fee, a plastic bag ban, a recycling centre and EPR, under different scenarios of individual policies versus composite policy combinations. By using both 0 and 3% within the scenarios, the analysis shows that the type of plastic waste influences the effectiveness of mixed policy instruments that would reduce the plastic waste stock. For plastic bottles, the effective mixed waste policy is a combination of a recycling centre and EPR, and this combination can potentially reduce plastic waste by 72.28% in 2029. For plastic bags, the effective mixed policies are combinations of a plastic bag fee and plastic bag ban, a plastic bag fee and recycling centre and a plastic bag ban and recycling centre, which can potentially reduce plastic waste by 94.84% in 2029.
The contributions of this study are twofold. Firstly, there are several key suggestions for policymakers or stakeholders in the plastic recycling industry. This study supports the use of mixed policy interventions, such as combining plastic bag fees and plastic bag bans, as effective measures to mitigate plastic waste. The analysis highlights the importance of considering the type of plastic waste when formulating mitigation policies. In particular, the combination of a recycling centre and EPR is effective in reducing plastic bottle waste. Additionally, this study suggests that plastic bag fees and bans, along with the implementation of recycling centres, can help reduce plastic bag waste. These findings indicate the importance of developing efficient recycling systems and implementing comprehensive waste management policies. While the results were tested and verified, further research and monitoring may be necessary to ensure their accuracy and effectiveness over time. Second, the variables used in this study may extend the interrelationships among the variables that affect plastic waste consumption and mitigation, taking into account that each country has a different waste management process.
Despite the significant findings above, this study has several limitations. This study used the proposed policies based on those stated in the National Plastic Waste Reduction Strategic Actions for Indonesia. Future research may explore other feasible policies that can be implemented in developing countries, such as Indonesia. Later, the variables involved in this study may be limited due to the lack of available quantitative data on plastic waste and other associated data. Thus, future studies may add more variables, possibly using primary data collection to increase credibility. Future studies may test the findings and conduct empirical research to gather the required data. Finally, future studies may consider using a time delay function in the relationships of plastic production, plastic consumption and plastic waste generation.
Supplemental Material
sj-docx-1-wmr-10.1177_0734242X241231396 – Supplemental material for Policy scenario of plastic waste mitigation in Indonesia using system dynamics
Supplemental material, sj-docx-1-wmr-10.1177_0734242X241231396 for Policy scenario of plastic waste mitigation in Indonesia using system dynamics by Bagus Fadhilah Apriadi, Rulli Pratiwi Setiawan and Irman Firmansyah in Waste Management & Research
Footnotes
Declaration of conflicting interests
The authors declared no potential conflicts of interest with respect to the research, authorship, and/or publication of this article.
Funding
The authors disclosed receipt of the following financial support for the research, authorship, and/or publication of this article: The authors gratefully acknowledge financial support from the Institut Teknologi Sepuluh Nopember for this work, under project scheme of the Publication Writing and IPR Incentive Program (PPHKI) 2023.
Supplemental material
Supplemental material for this article is available online.
References
Supplementary Material
Please find the following supplemental material available below.
For Open Access articles published under a Creative Commons License, all supplemental material carries the same license as the article it is associated with.
For non-Open Access articles published, all supplemental material carries a non-exclusive license, and permission requests for re-use of supplemental material or any part of supplemental material shall be sent directly to the copyright owner as specified in the copyright notice associated with the article.