
Abstract
This study uses material flow analysis to investigate the amounts and pathways of municipal plastic waste (MPW) in Thailand. The aim is to understand the country’s situation and investigate the effects of Thailand’s Roadmap on Plastic Waste Management 2018–2030, which sets a goal for recycling ‘target plastic waste’ at 100% by 2027. The analysis was conducted using waste statistics between 2008 and 2020 and waste forecasts. Two scenarios of plastic waste management, the business-as-usual, and the national roadmap, were constructed for 2025 and 2030. In 2030, the annual MPW generation is projected to reach 2.19 Mt. Under the business-as-usual (BAU) scenario, the recycling and utilisation rate will be 32.3% of waste generated. About 30.3% of waste generated will not be treated properly and possibly leaked into the open environment. Under the roadmap scenario, the recycling and utilisation rate will increase to 98.4%, while 1.6% of waste generated will not be treated properly. The recycling rate for target plastic waste in 2027 could only reach 67.1% because plastic waste is required as fuel for waste incinerators and industries. With the roadmap fully implemented, certain effects can be foreseen for waste-to-energy and plastic industries. Findings from this study stress on the importance of holistic policy planning, efficient prioritising and allocating of waste as a resource, and cooperation from all sectors for sustainable plastic waste management.
Introduction
One of the world’s most rapidly expanding crises concerns plastic waste. Geyer et al. (2017) estimated that the total production of plastic was 8300 million tonnes (Mt) between 1950 and 2015. Of this amount, 79% deposited into the open environment or landfills. If current production and waste management trends continue, roughly 12,000 Mt of plastic waste will be in the environment or landfills by 2050. Thailand generated almost 2 Mt of municipal plastic waste (MPW) in 2018. Only 33% of the collected amount was recycled and utilised for heat and power generation. Approximately 68% (1.35 Mt) was disposed of without material and energy recovery.
Plastics are difficult to degrade. As a result, it remains in the environment for a long time, for example, 10–20 years for plastic bags and 450 years for beverage bottles (The Ocean Conservancy, 2003). Once degraded, small plastic waste, notably micro- or nanoplastics, can infiltrate the ground or water sources and contaminate ecosystems. This process negatively affects the food chain and human life (Campanale et al., 2020). Plastic waste is the most abundant type of waste found in the oceans. A waste survey conducted in the Gulf of Thailand in 2014–2015 (Department of Marine and Coastal Resources [DMCR], 2015) found that approximately 10 Mt of waste was generated from 23 coastal provinces, and 50% of this amount was improperly managed, which might lead to this portion becoming marine debris. The survey estimated that 0.05 Mt of plastic waste is deposited into the sea each year, and plastic bags were the most identified type of plastic found in the sea.
As the concerns over plastic pollution increased, the Royal Thai Government, through the Pollution Control Department (PCD), has pledged its commitment to combat plastic waste problems in a long-term plan called Thailand’s Roadmap on Plastic Waste Management 2018–2030. This roadmap aims to reduce and replace oxo-degradable plastic, cap seals and microbeads by 2019; and lightweight plastic bags (<36 microns), plastic glass (<100 microns), foam food containers and plastic straws by 2022. It is also planned that by 2027, 100% of these target plastic wastes will be recycled by implementing a circular economy principle (PCD, 2020). However, the roadmap does not have legal penalties. Therefore, some target plastic such as oxo-degradable plastic bags could be still found in local markets (PCD, 2019b).
To materialise this roadmap, the Subcommittee on Plastic Waste Management, a working group under the National Environment Board, had issued the Action Plans for Plastic Waste Management Phase I (2020–2022). The plan’s concept was based on the 3Rs (reduce, reuse and recycle), the circular economy, extended producer responsibility and stakeholder contributions such as public-private partnerships (PCD, 2021a). The subcommittee was restructured in 2020 to become the Subcommittee on Plastic and Electronic Waste Management, with extended responsibilities to work on e-waste and imported plastic waste. Imported waste has been one of the major environmental problems in Thailand following the announcement of China’s ban on importing 24 types of recyclable waste by the end of 2017 and electronic waste by the end of 2018 (The State Council of the People’s Republic of China, 2017). The ban has had a massive impact on the global plastic recycling industry, including Thailand, which experienced an eight-times increase in imported plastic waste in 2018, from 0.15 Mt in 2017 to 0.55 Mt in 2018 (Customs Department, 2018). At the time of this writing, the subcommittee is investigating practical measures to further control plastic waste imports (PCD, 2021b).
It is often found that good quality and systematic data required for planning scientific-based policies for Thailand are not readily available. Therefore, one of the key schemes under Thailand’s plastic waste management plans is developing plastic waste databases. This study, therefore, aims to fill in this gap by analysing MPW flows to provide some background information for policymakers. The objectives of this study are (1) to construct mass flows of MPW for Thailand and (2) to investigate the effects of Thailand’s Roadmap on Plastic Waste Management 2018–2030 on the flow of MPW up to 2030. The effects of the roadmap are studied by comparing two waste management scenarios: the business-as-usual (BAU) and the national roadmap. This study strictly focuses on MPW. Thus, industrial plastic consumption and industrial plastic waste management are included only in the overall material flow of plastic waste, not in waste forecast and waste management scenarios.
Materials and methods
Material flow analysis(MFA)
MFA is a quantitative analytical method that uses the mass balance principle to measure the flows and stocks of materials within a system defined in space and time. All inputs into a system are equivalent to all outputs, including the accumulation or depletion of material stocks inside the system. The theory of MFA and its equations are explained in Supplemental material S1. This study used STAN 2.6.801 software (Cencic and Rechberger, 2008) to analyse plastic waste material flow in Thailand. A qualitative model for the MFA and the system boundary are presented in the Supplemental Information S2.
Data collection and assumption for MFA
Data for plastic production, utilisation, waste generation and disposal were derived from various statistics and databases provided by the Bangkok Metropolitan Administration’s Environment Department (BMA, 2018); Petroleum Institute of Thailand (PTIT, 2018); Pollution Control Department (PCD) (PCD, 2018, 2019, 2020); the Customs Department (Customs Department, 2018); the Plastic Institute of Thailand (PITH, 2018) and related studies including Bureecam et al. (2018) and Chatterjee and Sui (2019).
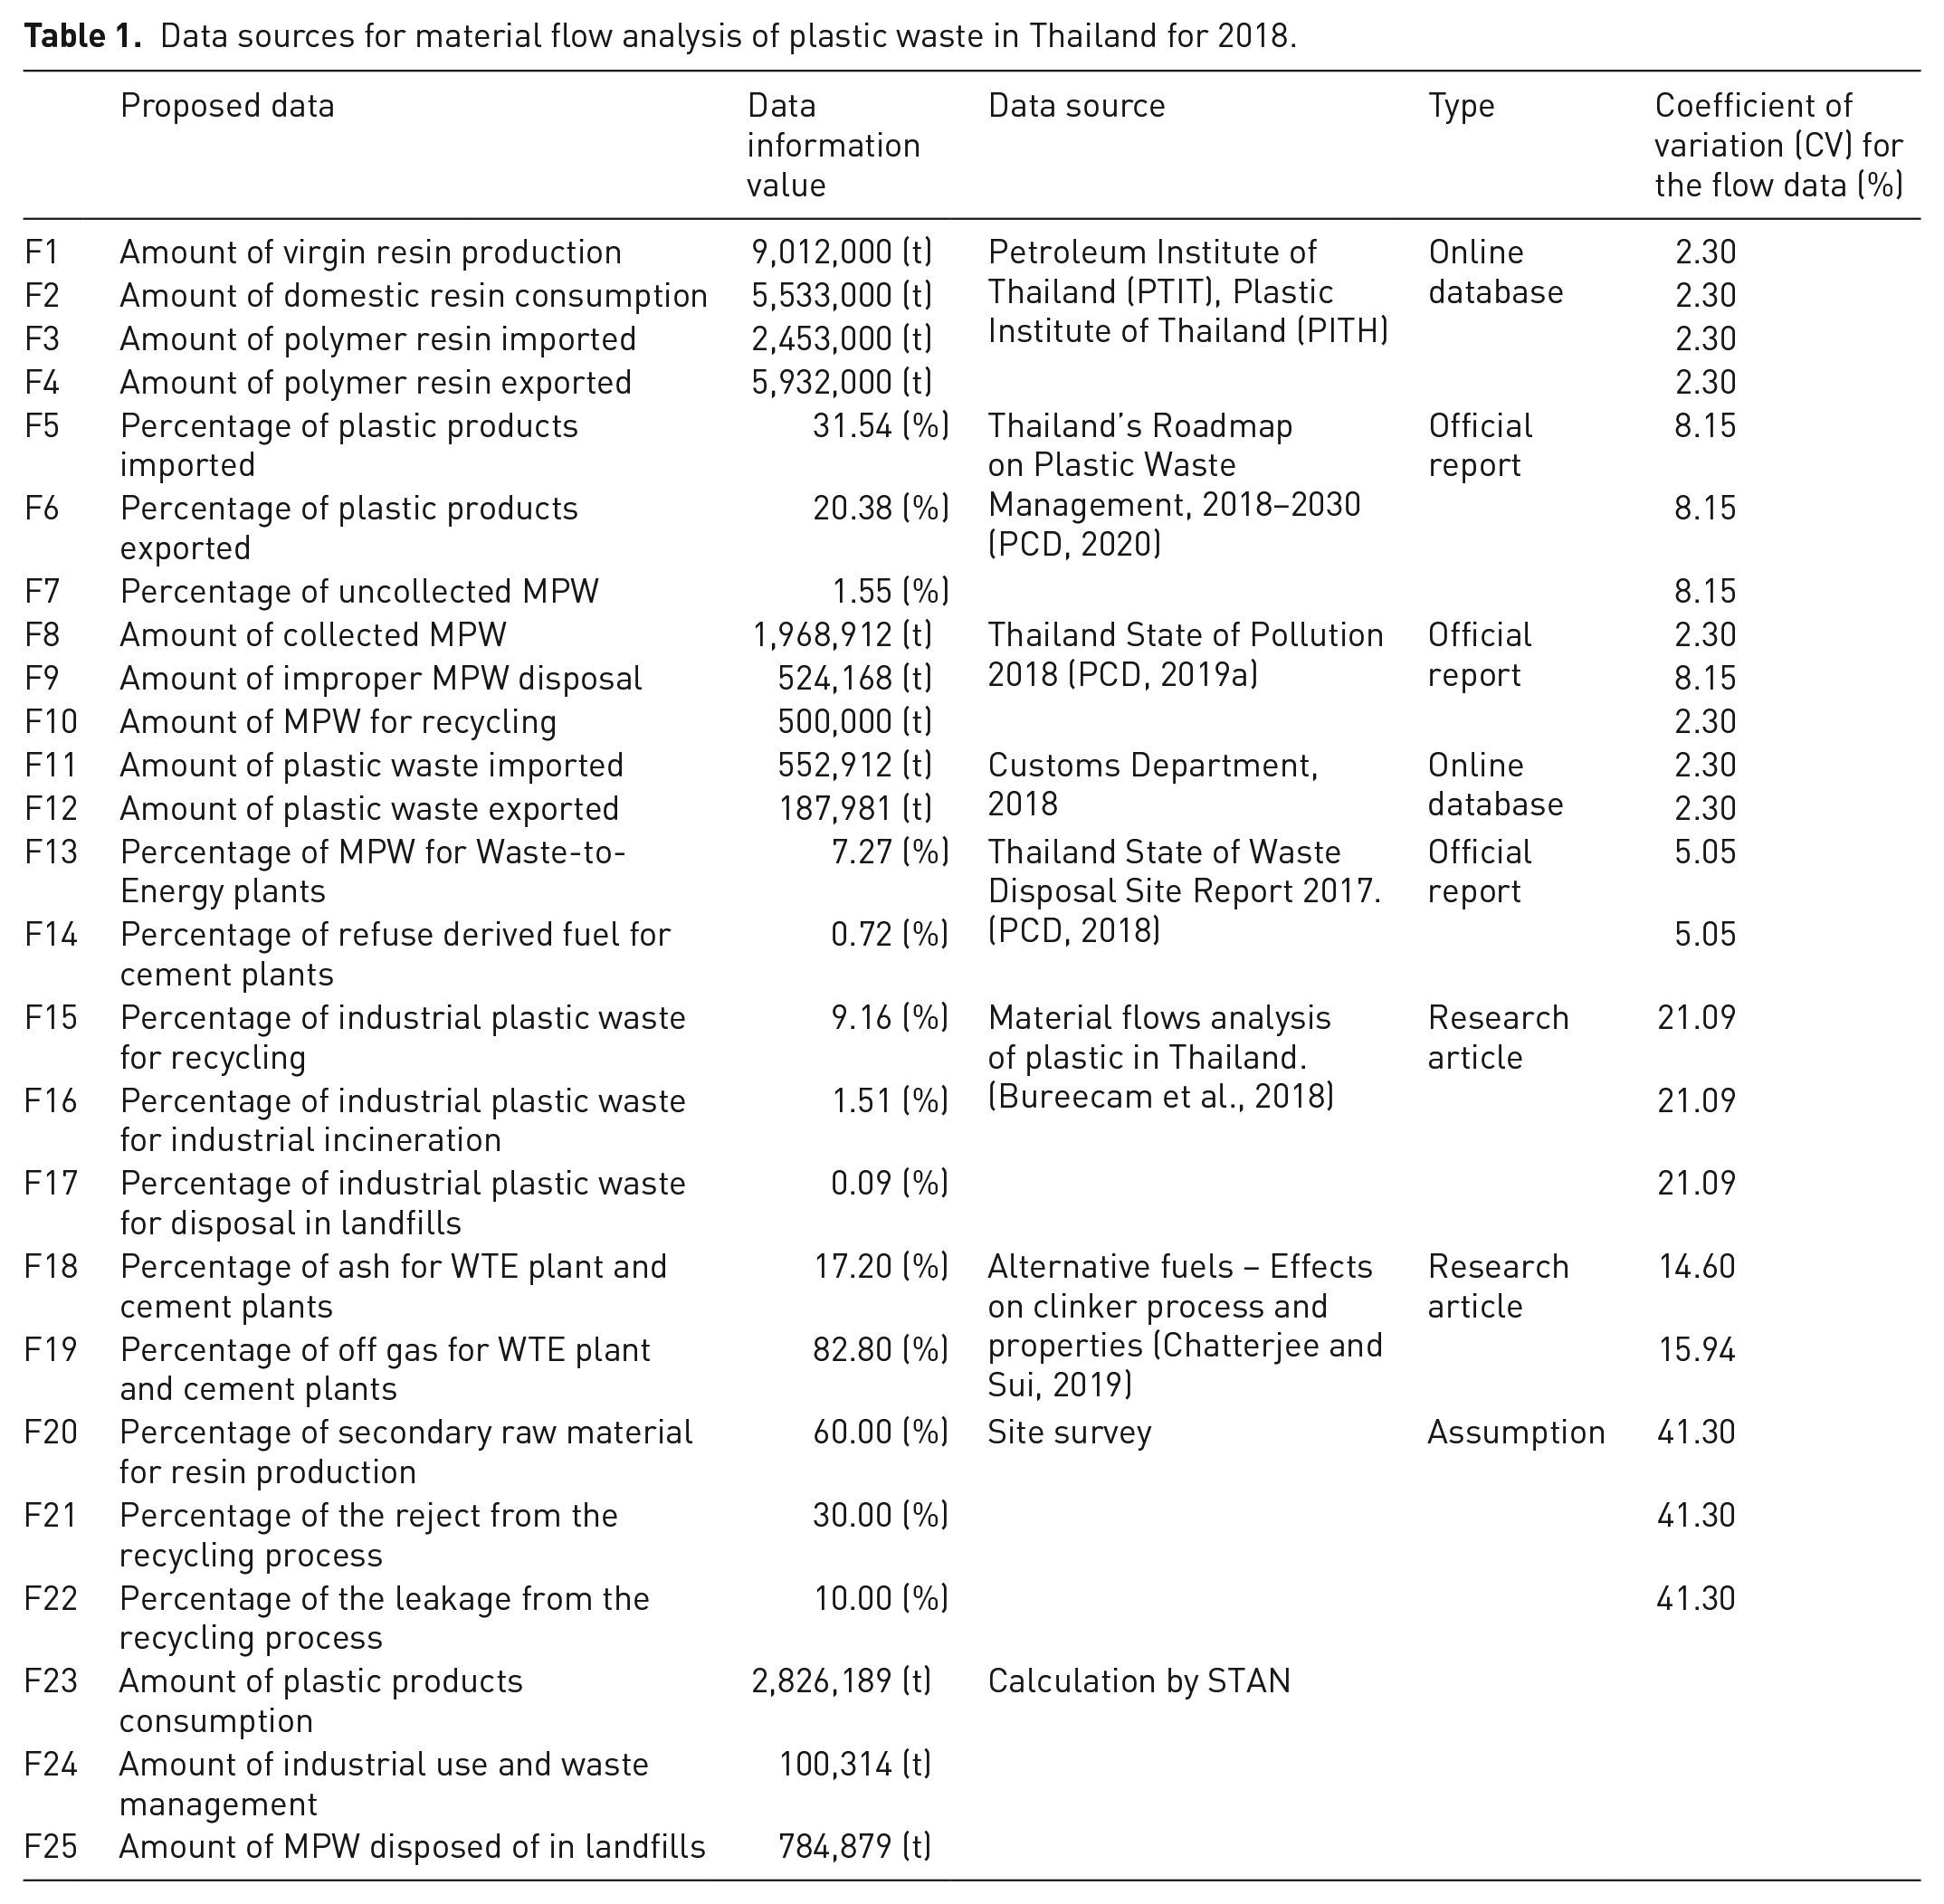
After considering the availability and completeness of all data obtained, we concluded that it was possible to conduct MFA of MPW only for 2018. Table 1 shows a list of data used in the MFA and their sources. The MPW collection and recycling proportions were derived from the Thailand State of Pollution 2018 (PCD, 2019a), while the proportion of energy recovery was extracted from the Thailand State of Waste Disposal Site Report 2017 (PCD, 2018). These proportions were used as a transfer coefficient (TC) in the MFA system.
Data sources for material flow analysis of plastic waste in Thailand for 2018.
Forecasting the amount of MPW generation from 2019 to 2030
To forecast the MPW generation for 2019–2030, this study employed the available MSW forecasts from previous studies and multiplied them by a selected percentage of MPW presenting in MSW (%MPW). The forecasts of MSW generation in tonnes per year were referred to Phongphiphat et al. (2015) and Pudcha (2019). Phongphiphat et al. (2015) forecasted MSW generation by using simple linear regression with GDP per capita data (X1) and the registered population data (X2) as influencing factors. Pudcha (2019) applied a grey model, namely GM (1, 3), using GDP per capita and population density as influencing factors.
The %MPW values were derived from three data sources and prepared for five cases: (A) a %MPW value from PCD (2019); (B) trendline forecasts derived from the %MPW of Bangkok (BMA, 2018), which were measured during 2008–2019; (C) an average derived from the %MPW of Bangkok (BMA, 2018); (D) an average derived from the %MPW from field surveys in three provinces in Thailand (Phongphiphat et al., 2015) and (E) forecasts derived from the forecasting model, GM (1,1), using the %MPW of Bangkok (BMA, 2018). In total, there were 20 models for forecasting MPW.
Uncertainty analysis
For the uncertainty analysis of the MFA, this study followed an approach described in Laner et al. (2016). The uncertainty of MPW generation forecasts was derived from the uncertainty of MSW forecasts and the uncertainty of %MPW. MSW forecasts’ uncertainty was calculated using a prediction interval at a 95% confidence interval. The uncertainty values of %MPW in the cases (A), (C) and (D) were based on the expert judgement suggested in Pipatti et al. (2006). Meanwhile, cases (B) and (E) were calculated by using a prediction interval at a 95% confidence interval. The overall uncertainties of the forecasting results for MPW were derived by multiplying both parts of the uncertainties using equations from Frey et al. (2006). Details of the uncertainty analysis are shown in the Supplemental material S3.
Scenario definition
Two MPW management scenarios, the BAU and the national roadmap, were investigated. Both scenarios began with the same forecasted amount of collected MPW selected from one of 20 forecasting models (explained further in Section ‘Forecasting of MPW in 2025 and 2030’).
Under the BAU scenario, it was assumed that the MSW management system, the proportions of MPW sent to recycling and improper disposal, and the amount of MPW fuelling the energy recovery systems for 2019–2030 were the same as in 2018. Therefore, the TCs in the MFA system of this scenario did not change over time.
Under the national roadmap scenario, it was assumed that:
— The recycling rate for ‘target plastic waste’ was increased to 80% by 2025 and 100% by 2027. The recycling rate for non-target plastic waste remained at a constant rate of 25% until 2030.
— The ‘target plastic waste’ was 73.45% of the total MPW generation. These ‘target plastic waste’ consist mainly of plastic bags (80%), while the rest (20%) are plastic cups, foam food containers, plastic straws and caps that are disposed of without recycling or utilisation (PCD, 2020). The percentage of ‘target plastic waste’ was derived from the PCD (2019), which described that of the total MPW generation, 73.45% was disposed of in dumpsites, landfills or incineration plants; 1.55% was uncollected, and only 25% was recycled.
— The improperly disposed of MPW would decrease in the future, following the national master plan (PCD, 2015), from 40% in 2018 to 5% by 2025. Furthermore, this study also assumed that improperly disposed of MPW would be zero during 2026–2030.
— The efficiency of the recycling system in Thailand would increase in the future, resulting in a constant reduction of rejects, from 30% in 2018 to 15% in 2030, and a constant reduction of plastic waste leakage from the recycling facilities from 10% in 2018 to 0% in 2030.
— The amounts of oxo-degradable plastic, cap seals and microbeads were not considered in this scenario as they were banned by 2019.
— The amount of MPW utilised for energy recovery was set to the same levels as those in 2020 (PCD, 2021c) and remain constant until 2030.
For both scenarios, the calculations were conducted for each year between 2021 and 2030. This data facilitates a detailed analysis of the changes in MPW. However, only the MFA for 2025 and 2030 were illustrated in this study.
All scenarios started at MPW generation (post-consumer) because the amount of MSW generation used for estimating MPW was the most reliable and accurate dataset among all other datasets in our MFA. Furthermore, there was limited information about the amount and type of plastics that remained in the households. Thus, it was impossible to formulate a reasonable estimate of households’ stocks. In addition, the forecasting of MPW generation used the actual historical data of the MSW generation, which already included the effects of stock changes. Thus, to minimise uncertainty, we excluded stocks from the MFA system of the scenario analysis.
Results and discussion
The material flow of plastic waste in Thailand, 2018
The MFA of plastic waste in Thailand is shown in Figure 1. The values displayed are rounded to three significant digits. The exact values of input data are listed in Table 1.
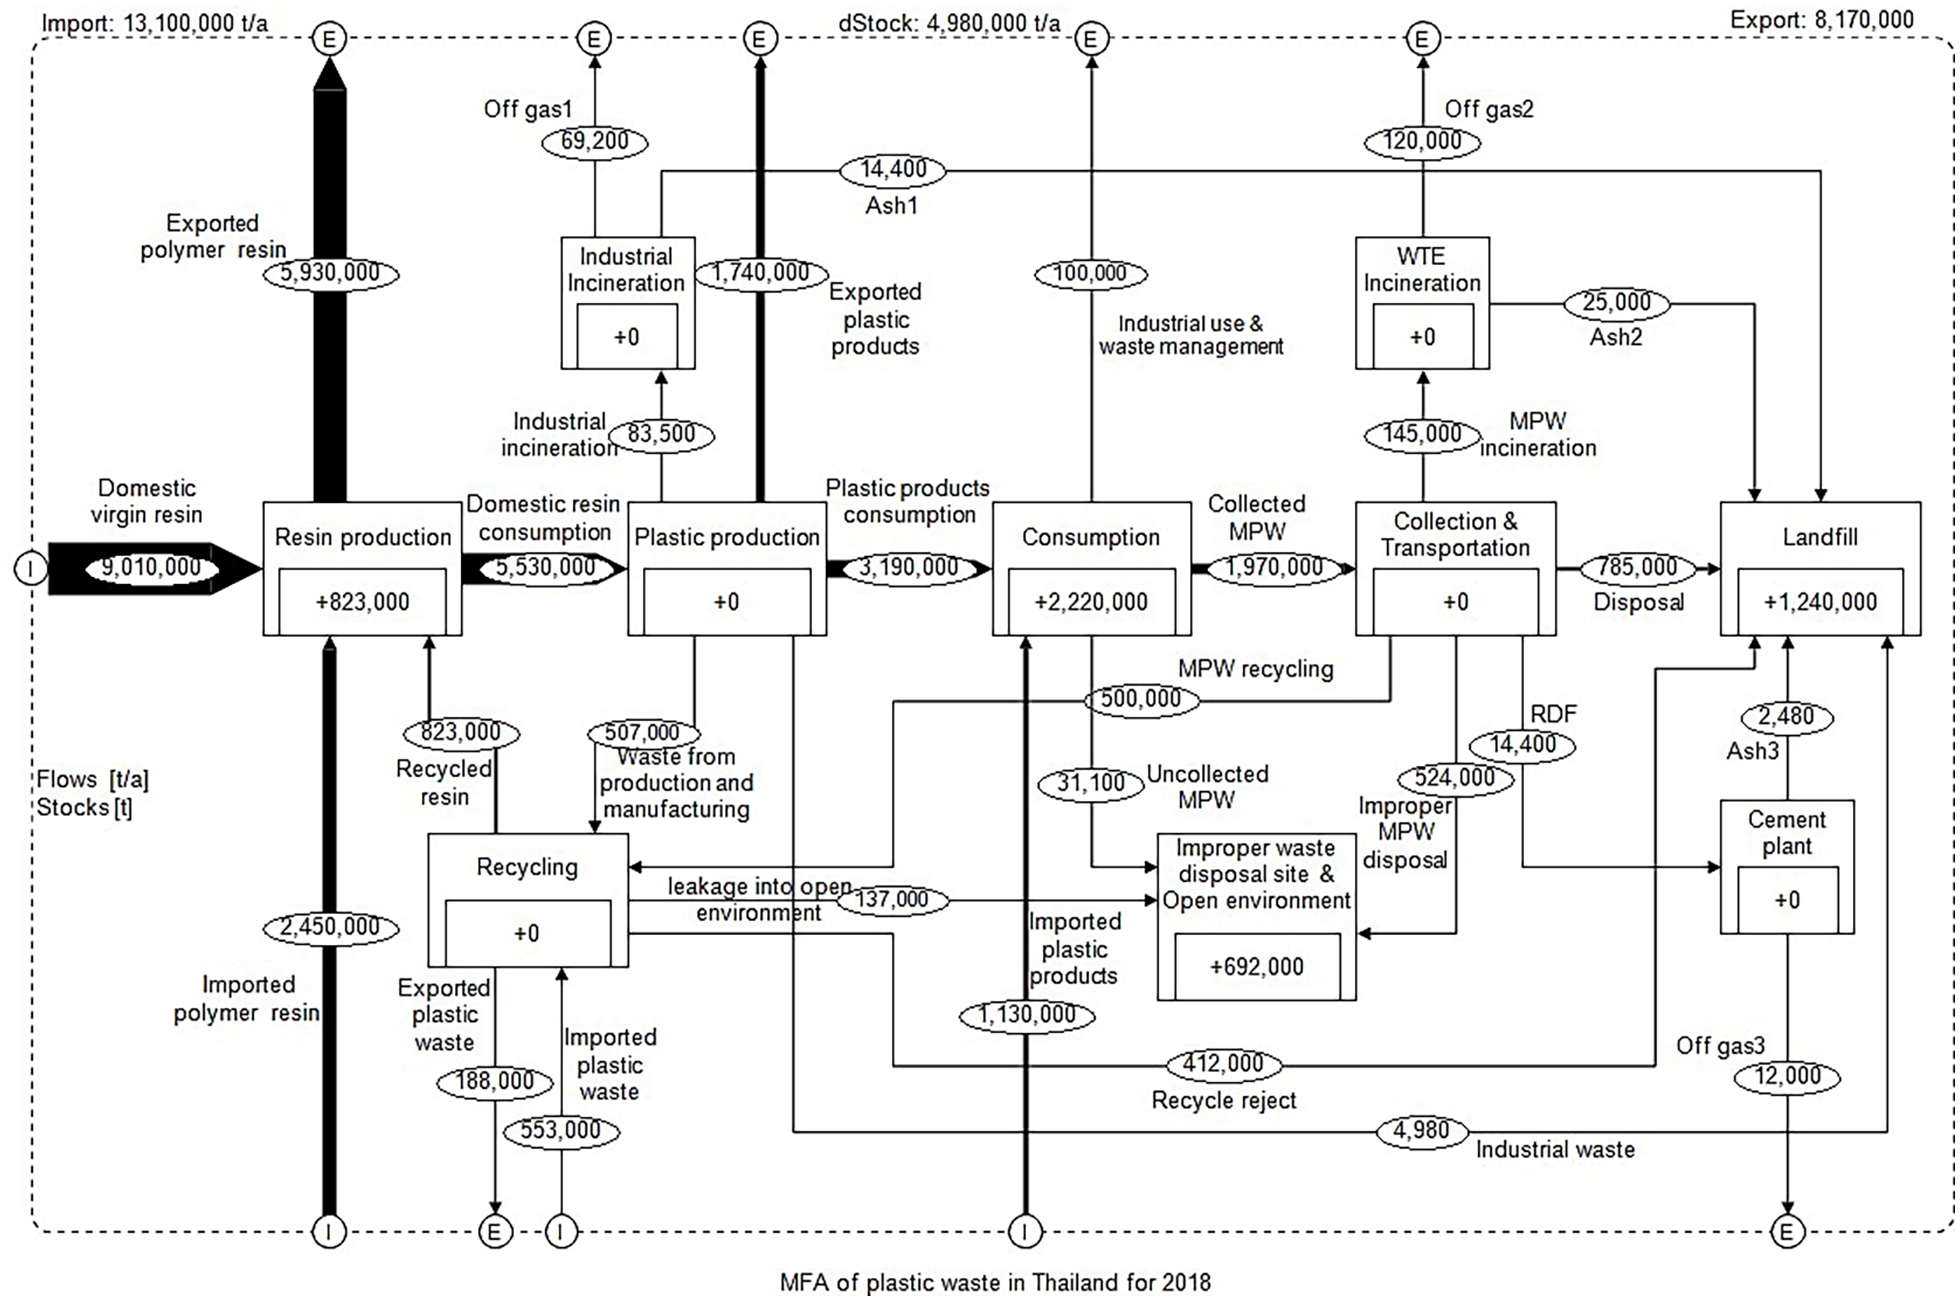
MFA of plastic waste in Thailand for 2018.
Plastic production
The flow of plastic begins with the production of 9.01 Mt of domestic virgin resin. In addition, Thailand imported some 2.45 Mt of polymer resin and used another 0.82 Mt of recycled resin. About 5.93 Mt of polymer resin was exported. The remaining 5.53 Mt was consumed domestically. The annual amount of polymer resin exported had been higher than the amount imported during 2012–2017 (PITH, 2018). In 2019, Thailand ranked 11th globally for plastic resin export (PITH, 2019). The exports of plastic products are expected to increase continuously.
The polymer resin was used to produce various plastic products, the main proportion of which was converted to packaging products, reaching 42.0%, or 2.32 Mt (PITH, 2018). Meanwhile, the global plastic packaging production was 146 Mt in 2015 (Geyer et al., 2017). Thus, the share of Thailand was approximately 1.6% of 2015 global production.
Outflows of the plastic production process included the export of 1.74 Mt of plastic products and the treatment and disposal of 0.59 Mt of pre-consumer plastic waste obtained from the production process. The amount of pre-consumer plastic waste and its proportions in recycling, energetic utilisation and landfill disposal were estimated by referring to the ratios from Bureecam et al. (2018). In general, national statistics on industrial waste have often focused on hazardous waste, electrical equipment and electronic waste. These data were compiled by the Department of Industrial Works and presented by PCD. To improve plastic waste management, it is necessary for Thailand to improve the data systems related to plastic waste not only from the MSW but also from the industrial sectors.
Plastic products consumption
The remaining 3.19 Mt of plastic products from the production process and another 1.13 Mt of imports were consumed domestically. Therefore, the total domestic plastic product consumption was 4.32 Mt.
MPW collection and transportation
After consumption, 0.1 Mt of industrial plastic waste, such as plastic wrap, was generated. This industrial waste was managed separately by industrial sectors. Its precise amount has never been estimated openly and transparently. As a result, the MFA system calculated the amount of industrial plastic waste. It will be helpful for future policy planning if this amount of industrial plastic waste is further investigated and disclosed as part of an official government report.
There were 2.22 Mt of plastic products considered as stocks in the consumption process. This stock could be non-single use plastic and plastic with a lifetime of more than 1 year, such as electric appliances, footwear, hoses and tubes, woven sacks and other durable materials. A study by Mutha et al. (2005) indicated that the estimated mean service lifetime of plastics products in India was 8 years. Therefore, 2.22 Mt of plastic products may become waste in 2026. The quantities and types of plastic waste in stock could be identified more precisely if there were more in-depth studies on plastic consumption and plastic waste composition carried out in Thailand.
The amount of MPW was estimated to be 2.00 Mt, representing almost half of the total domestic plastic product consumption. The MPW followed one of two pathways: 1.97 Mt was collected in the collection and transportation process, and the remaining 0.03 Mt of MPW was not collected. Meanwhile, plastic waste generated in the same year in Japan and the Republic of Korea was 8.91 Mt (Plastic Waste Management Institute [PWMI], 2019) and 9.33 Mt (Lee, 2021), respectively. These amounts were markedly higher than in Thailand as both amounts include up to 50% of plastic waste from the industrial sector. Despite the large quantity of waste produced, 84% of total plastic waste generation in Japan and 94% of plastic waste from the industrial sector in Korea were utilised. As of 2018, only 33.5% (1.97 Mt) of collected MPW in Thailand was recycled and utilised for energy recovery.
Bureecam et al. (2018) predicted that with 7.01 Mt of plastic consumption in 2020, uncollected waste could rise to 0.50 Mt, and improper waste disposal could rise to 0.60 Mt. Continued consumption of disposable products along with population growth will lead to a continual increase in plastic waste (Ghosh and Agamuthu, 2019). However, the figure for uncollected waste by Bureecam et al. (2018) was almost 17 times higher than the figure in this study for 2018 due to database and method differences. Bureecam et al. (2018) compiled plastic waste data from primary and secondary sources, including survey questionnaires and interviews with key stakeholders, in 11 provinces from 2013–2014. These data were used as representative of the country. However, the methodology used for calculation was not clearly explained.
Recycling process
About 0.50 Mt of collected MPW (25% of the collected MPW) was sent to the recycling process. Most of these MPW were plastic bottles (PCD, 2019a). Meanwhile, the EU-28 plus Norway and Switzerland (EU28 + NO/CH) recycled 32% of collected plastic post-consumer waste in the same year (Plastics Europe, 2020).
Inputs into the plastic recycling process consisted of MPW, industrial waste from the plastic production process and imports. The recycling process rejected those plastic waste that was contaminated or unrecyclable, up to 30% of the total input. This study estimated that about 10% of the total input leaked into the open environment (0.14 Mt). As a result, 0.41 Mt of plastic waste was rejected from the recycling process and sent to landfills. Finally, the remaining plastic waste was processed into recycled plastic resin, amounting to 0.82 Mt. This amount did not include the recycled products from post-consumer waste in the industrial sectors. Thus, this value did not represent the overall recycling rate in Thailand. Again, this stresses the importance of data from the industrial sector to track the country’s waste management system efficiently.
Due to the unavailability of the data for the recycling rejects ratio, this study assumed the rate (30%) based on the author’s previous interviews with recycling factories. The recycle reject ratios can vary greatly depending on the purity of the plastic waste input. The recycling rejects ratio reported by the plant managers ranged from less than 30 to 70% (Phongphiphat, 2018). The reject ratio and destination of rejects are worth exploring because the amount of these rejects will be increased in the future following the growth of the recycling industry. Similarly, data on the ratio of waste leakage from the recycling process into the open environment was lacking. Leakage still exists as evidence can be found around some recycling factories, which we estimated as 10% of the total recycling input. The extent of leakage should also be further investigated to improve the accuracy of MFA.
A total of 0.82 Mt of recycled resin, which was subsequently used as secondary raw material for plastic production, was derived from calculations. This figure has high uncertainty and needs improvement. In addition, the import of about 0.55 Mt of plastic waste was the actual data (Customs Department, 2018), which is almost four times compared to 2017 and was due to China’s ban on imported recyclable waste from foreign countries.
MPW utilisation for energy production
Approximately 0.15 Mt of MPW was used for power generation, and another 0.01 Mt in the form of RDF was used at cement plants. Combined with the energetic use of plastic waste in industrial sectors, the overall utilisation accounted for 0.24 Mt, showing a poor total energy recovery. The rate for energy recovery from collected MPW in Thailand was 8.1%. It was much lower than the energy recovery rate at 42.6% of collected plastic post-consumer waste in the EU28 + NO/CH in the same year (Plastics Europe, 2020) and 65.03% of the total plastic waste discharge in Japan in the same year (PWMI, 2019). However, more waste-to-energy projects will be installed in Thailand due to energy policies such as the Alternative Energy Development Plan 2018–2037 (AEDP2018) and the Power Development Plan 2018–2037 (PDP2018). PDP2018 promotes more electricity generation from waste to reach 900 MW by 2037 and increases other thermal utilisations from waste to 495 ktoe by 2037 (Energy Policy and Planning Office Ministry of Energy [EPPO], 2020). Meanwhile, the lack of RDF markets is usually a significant challenge for the current extension of RDF production plants (Thinsantisuk, 2019), even if the government continuously supports the municipalities’ construction budgets. Therefore, Thailand needs to improve this issue and plan for further management.
Disposal and leakage into the open environment
Two last outflows of the collection and transportation process comprised the improper disposal of 0.52 Mt and the landfill disposal of 0.78 Mt of MPW. The amount of MPW improperly disposed of, the uncollected MPW and the leakage from the recycling process accounted for a total of 0.69 Mt of MPW possibly released into the open environment. A study by CIWM/WasteAid UK (2018) suggested that plastic wastes entering the oceans would be 50–70% of the improper disposal of MSW in developing countries. Since the amount of the improper disposal of MSW was reported as 7.32 Mt (PCD, 2019a), Thailand’s plastic waste would be entering the oceans up to 3.66–5.12 Mt. This range was notably higher than the result from MFA (0.69 Mt). Our result could be underestimated because it did not include waste from industrial sectors and non-monitored plastic wastes such as those off-the-record items and illegal imports. Lack of reliable waste information, such as the actual amount of uncollected waste, could also be the reason. Furthermore, a large sum of smuggled electronic waste and contaminated plastic waste imports were not yet included in this study.
The Ocean Conservancy and McKinsey (2015) suggested that over 90% of marine plastics come from land-based sources. Thailand is now paying more attention to this issue. Many projects have been initiated to mitigate plastic waste leaking into the ocean in the last 5 years. Moreover, Thailand’s action plans to combat marine debris will be in force in 2023 (Thai Post, 2021; Public Relations Department [PRD], 2021).
At least 1.20 Mt of MPW was disposed of in landfills in 2018. If this amount of waste were used to produce energy, it could produce 2.16 TWh of electricity. This result was based on the assumption that 1 t of plastic waste could produce 1.8 MWh of electricity (Themelis and Mussche, 2014). Similarly, if the improperly disposed MPW was used to produce energy, it could produce 1.25 TWh of electricity. These numbers pointed out many opportunities and potentials for increasing waste utilisation in Thailand. Unexploited energy from waste is common in developing countries. A study in Nigeria estimated that the improperly disposed of plastic waste in 2018 could have produced 7.1 TWh of electricity (Olusunmade et al., 2019).
Uncertainty analysis
The uncertainty analysis results for the MFA in the form of coefficients of variation (CVs) are presented in Table 1. It was found that the CVs were higher for the flow data related to recycling F20–F22 (41.3%), industrial plastic waste F15–F17 (21.1%) and residues from energy recovery activities F18 and F19 (14.6–15.9%). The CV values for other data were lower, ranging from 2.3–8.2%. For life cycle inventory data, the CVs ranging from 2–20% can be identified as high-quality data, and the CVs ranging from 25–100% as low-quality data (Laner et al., 2016; Weidema and Wesnæs,1996; Lloyd and Ries, 2007). Therefore, the quality of data related to recycling and industrial plastic waste should be improved to reduce the uncertainties of this MFA. It is essential to develop a systematic data collection in the country, particularly for plastic recycling activities. The calculation for CVs is shown in the Supplemental material S4.
Forecasting of MPW in 2025 and 2030
The forecasting results of 20 models, shown in Table 2, indicated possible MPW ranges from 1.99–8.78 Mt per year for 2025 and 1.98–9.54 Mt per year for 2030. The minimum amounts were derived from the case (A), the %MPW reported in PCD (2019). The maximum amounts were derived from the case (D), the %MPW obtained from field surveys.
Forecasts of MPW generation for 2025 and 2030.
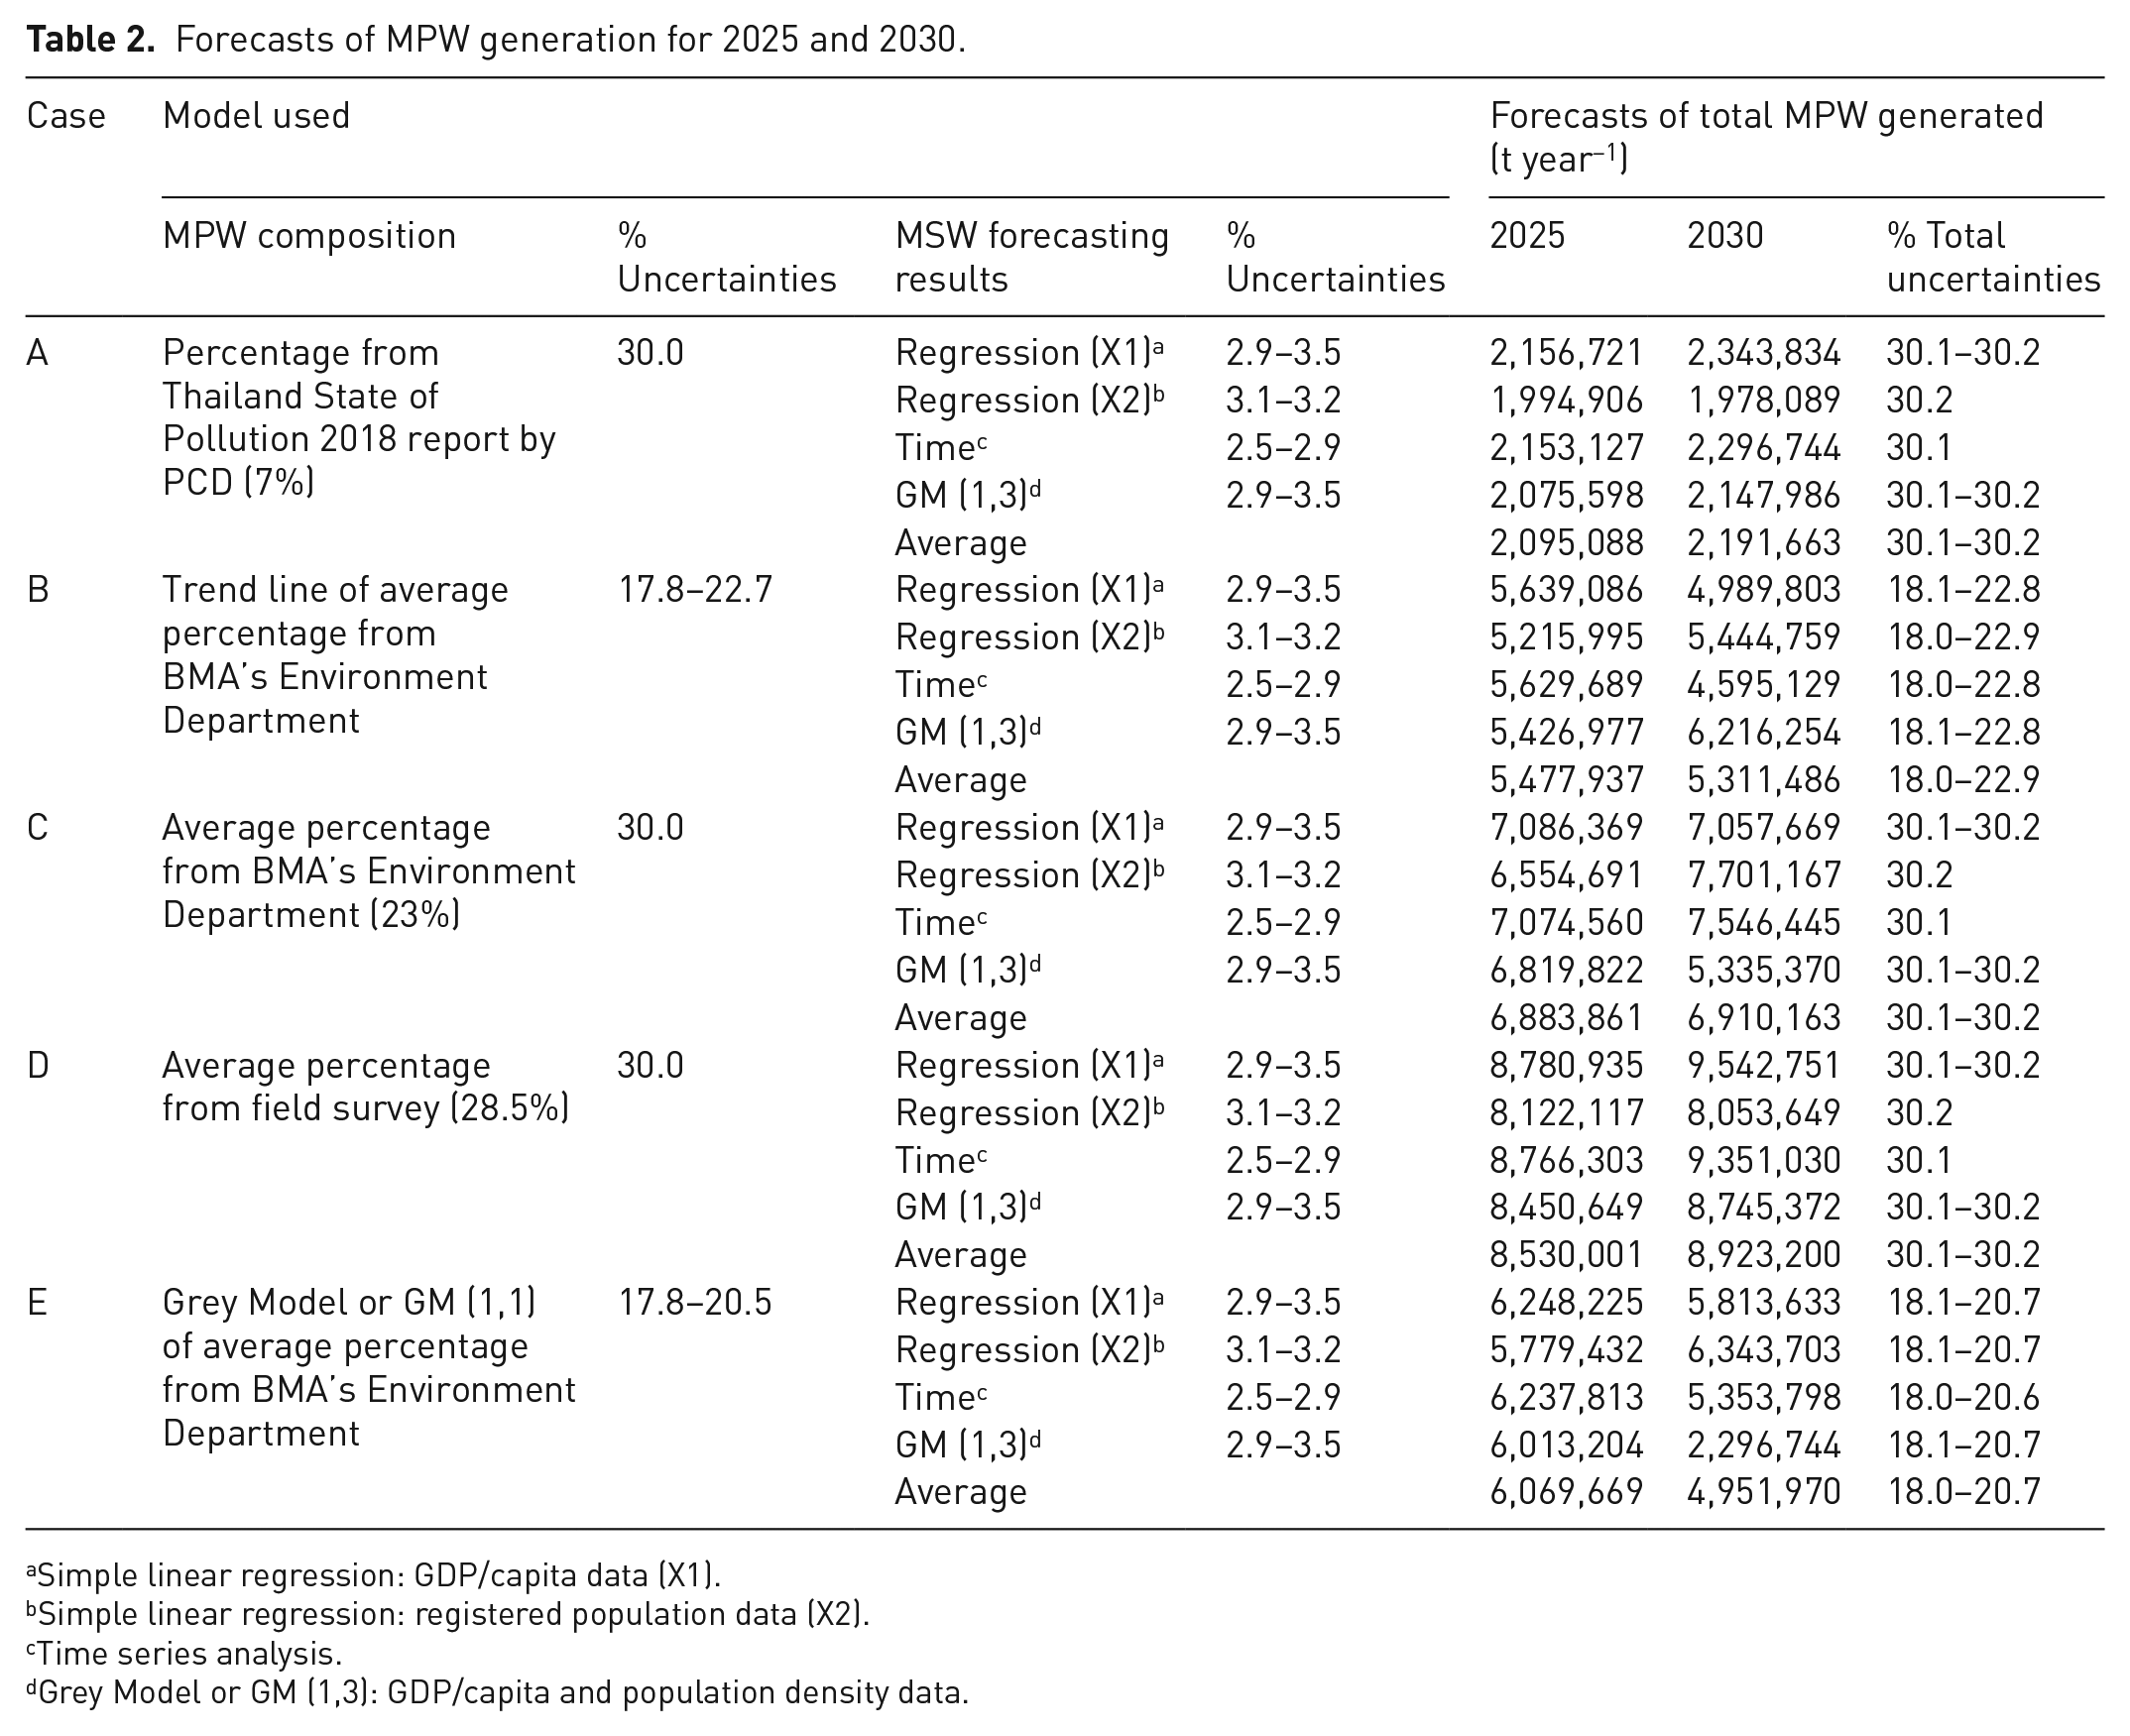
Simple linear regression: GDP/capita data (X1).
Simple linear regression: registered population data (X2).
Time series analysis.
Grey Model or GM (1,3): GDP/capita and population density data.
Case (A) was selected for further scenario analysis because: (1) its %MPW was derived from an official PCD report, and (2) it was in line with all national waste policies that were planned based on PCD statistics. Hence it will allow readers and policymakers to apply and compare our results directly to the national plans and targets. Therefore, the MPW forecasts for 2025 and 2030 were 2.09 and 2.19 Mt year−1 respectively, with total uncertainties of 30.1–30.2%. The detail of the uncertainty analysis is shown in the Supplemental material S4.
Lebreton and Andrady (2019) suggested that the total MPW generated in Thailand could reach 3.1–3.3 Mt by 2020, 3.8–3.9 Mt by 2040 and 3.8–4.1 Mt by 2060. These figures were higher than those in case (A) due to the differences in the %MPW: 15% in Lebreton and Andrady (2019) and 7% in this study. However, these figures were within the range between cases (A) and (E). It has been speculated that the %MPW in Thailand will substantially reduce in the coming years. This is due to the public and private sectors’ plans to reduce the use of single-use plastic bags (Department of Environmental Quality Promotion [DEQP], 2019).
Business-as-usual scenario for 2025 and 2030
Under the BAU scenario, the MFA of MPW in Thailand for 2025 and 2030 can be constructed as shown in Figures 2 and 3, respectively. The values displayed in these figures are rounded to three significant digits. The input data are listed in the Supplemental material S5.

MFA of MPW in Thailand for 2025 – BAU scenario.
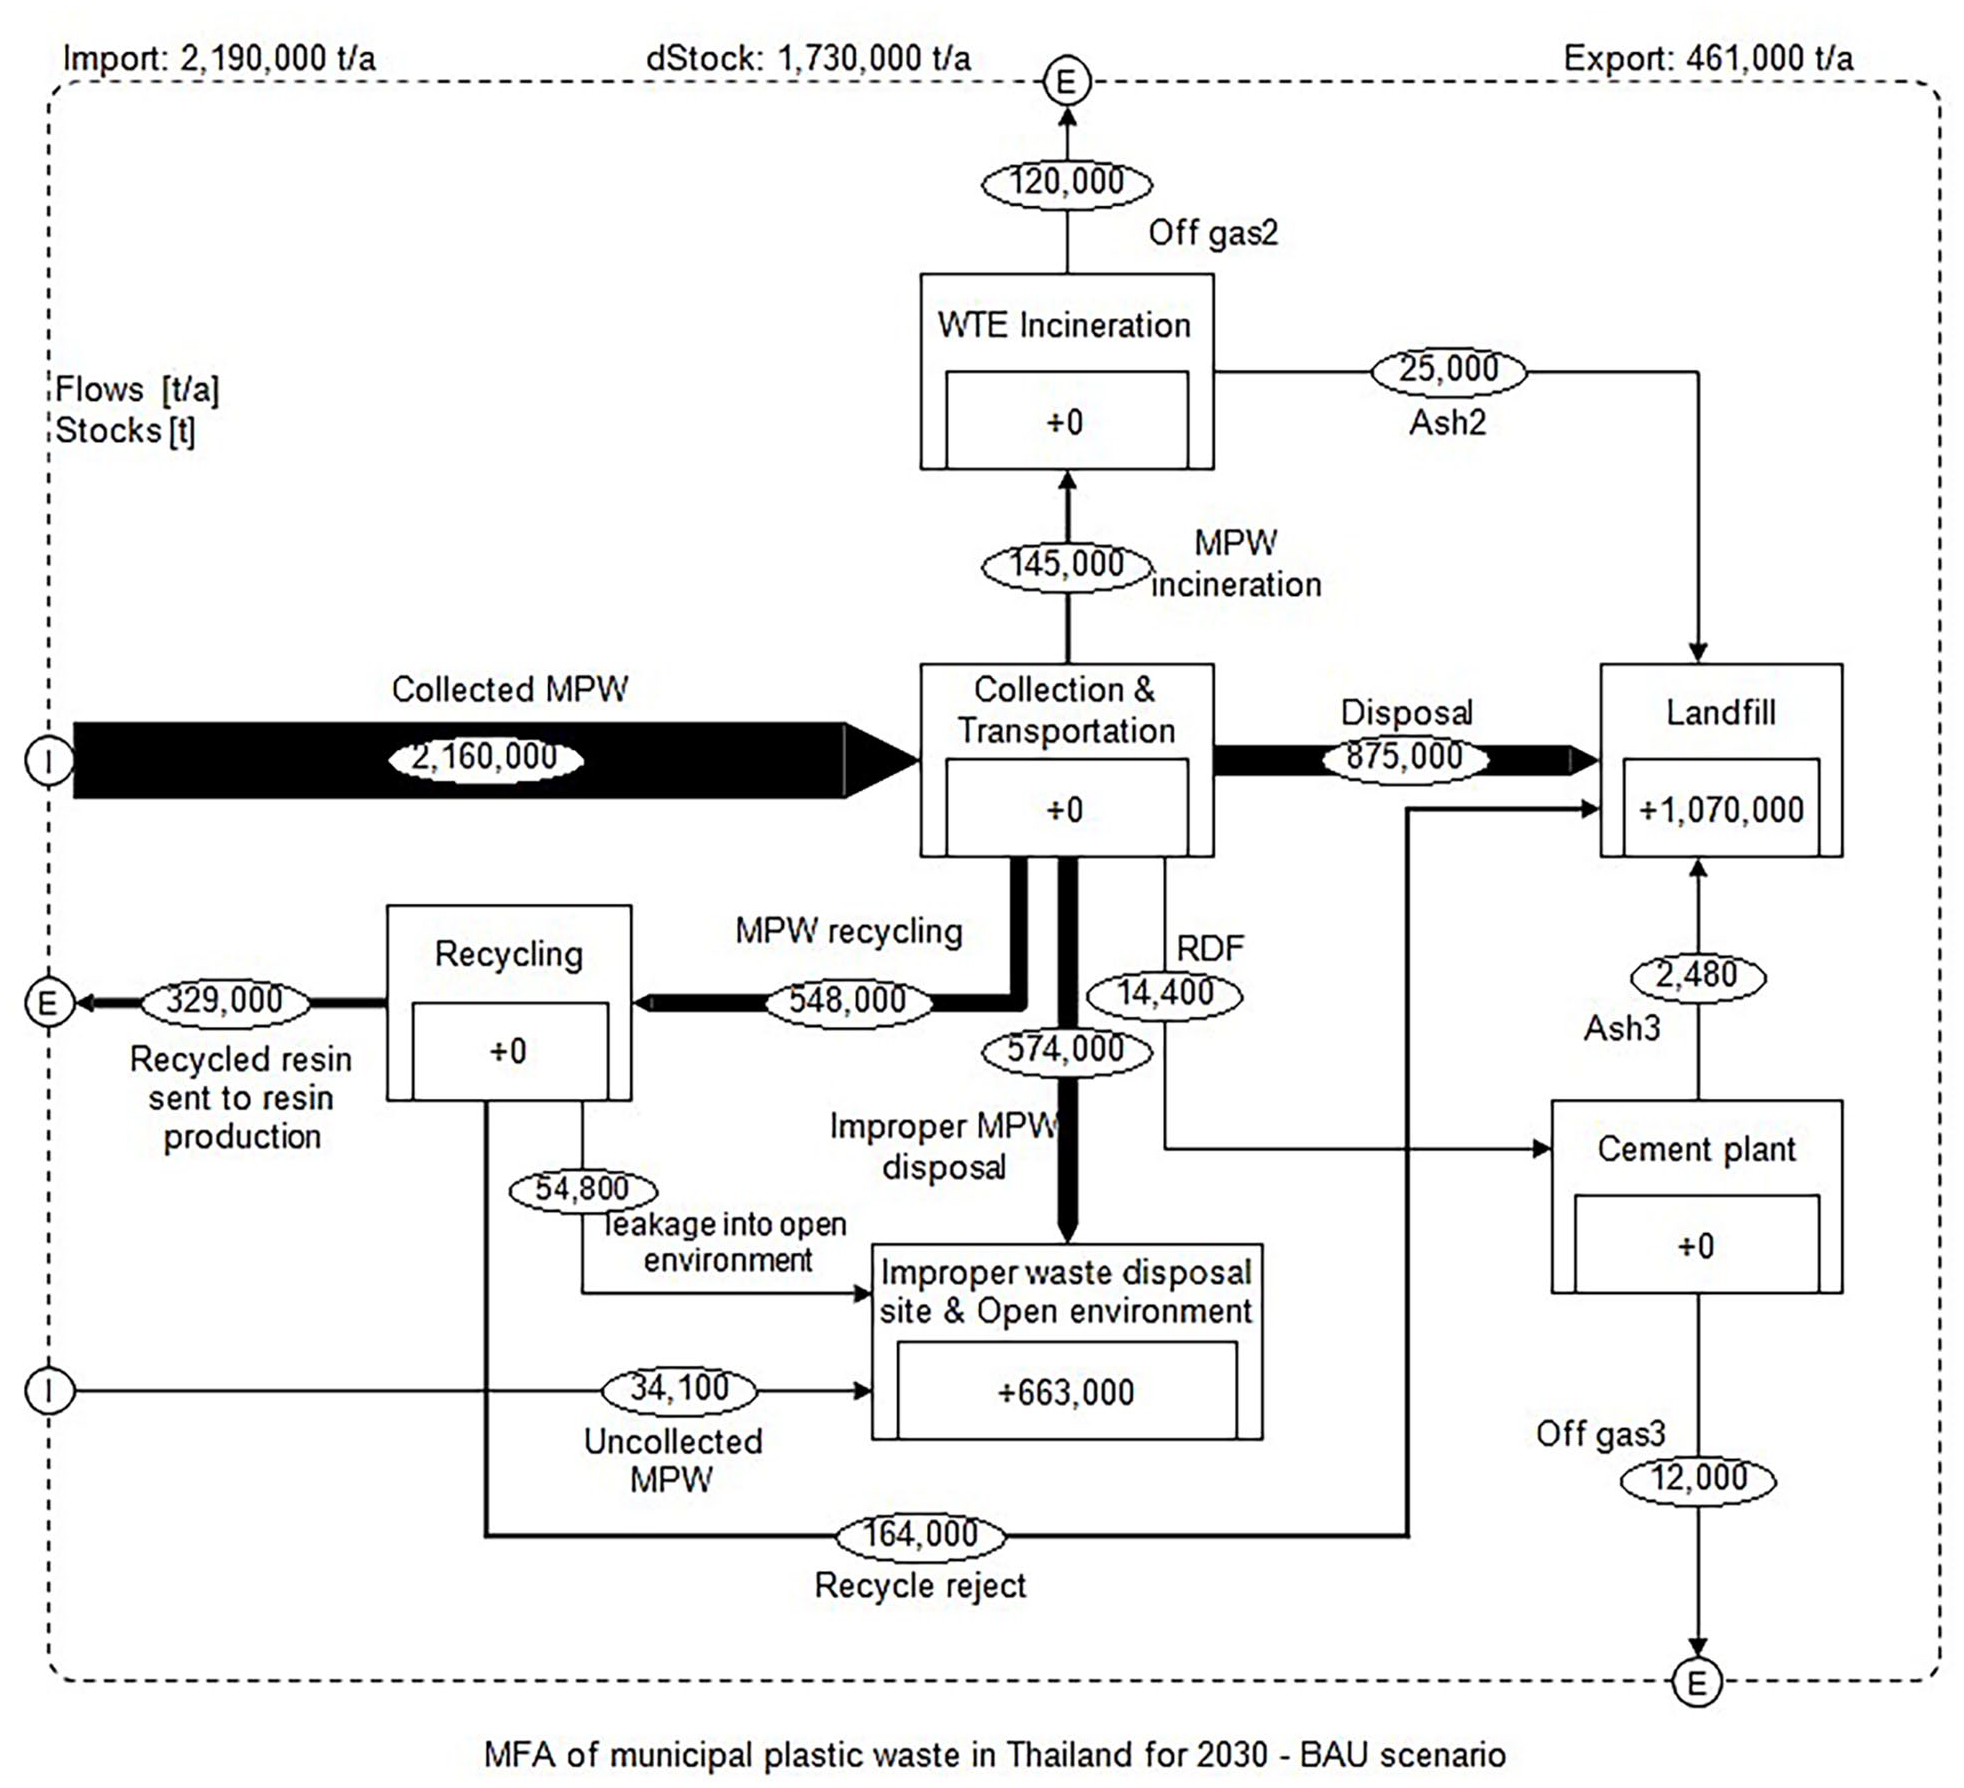
MFA of MPW in Thailand for 2030 – BAU scenario.
This study predicts that Thailand will generate 2.19 Mt of MPW in 2030. Of this amount, 98.4% will be obtained in the collection and transportation process, while 1.6% will not be collected. These percentages remain constant throughout the study period for both scenarios. Thus, the uncollected MPW was projected to be around 0.03 Mt annually. In 2030, approximately 25.0% of MPW generated will be recycled, 6.6% will be incinerated for power generation and another 0.7% will be processed into RDF for cement plants. The overall amount of MPW recovered for material, and energy utilisation in 2030 will be only 32.3% of MPW generated (0.71 Mt).
Meanwhile, 30.3% of MPW generated or 0.66 Mt will come from improper disposal of MPW and leakage from the recycling process. This amount of MPW might be disposed of improperly by open burning, dumping on lands, rivers and ocean and other illegal approaches, and subsequently leaked into the open environment. Starting from 2018, the accumulated amount of MPW leaked into the open environment could reach 8.26 Mt in 2030.
The results indicate that there will be 1.07 Mt of MPW and its residues requiring landfills in 2030, equivalent to 48.7% of MPW generated. Starting from 2018, the accumulated amount of MPW disposed of in landfills will reach 13.34 Mt in 2030. This amount of MPW will strain local authorities who are responsible for MSW disposal. If 13.34 Mt of MPW is recycled, it could produce up to 8.01 Mt of recycled resin. On the other hand, if it is fired in a WTE incinerator, it could produce electricity up to 24.02 TWh.
National roadmap scenario for 2025 and 2030
Under the national roadmap scenario, the MFA of MPW in Thailand for 2025 and 2030 can be constructed as shown in Figures 4 and 5, respectively. The values displayed in these figures are rounded to three significant digits. The input data are listed in the Supplemental material S5.
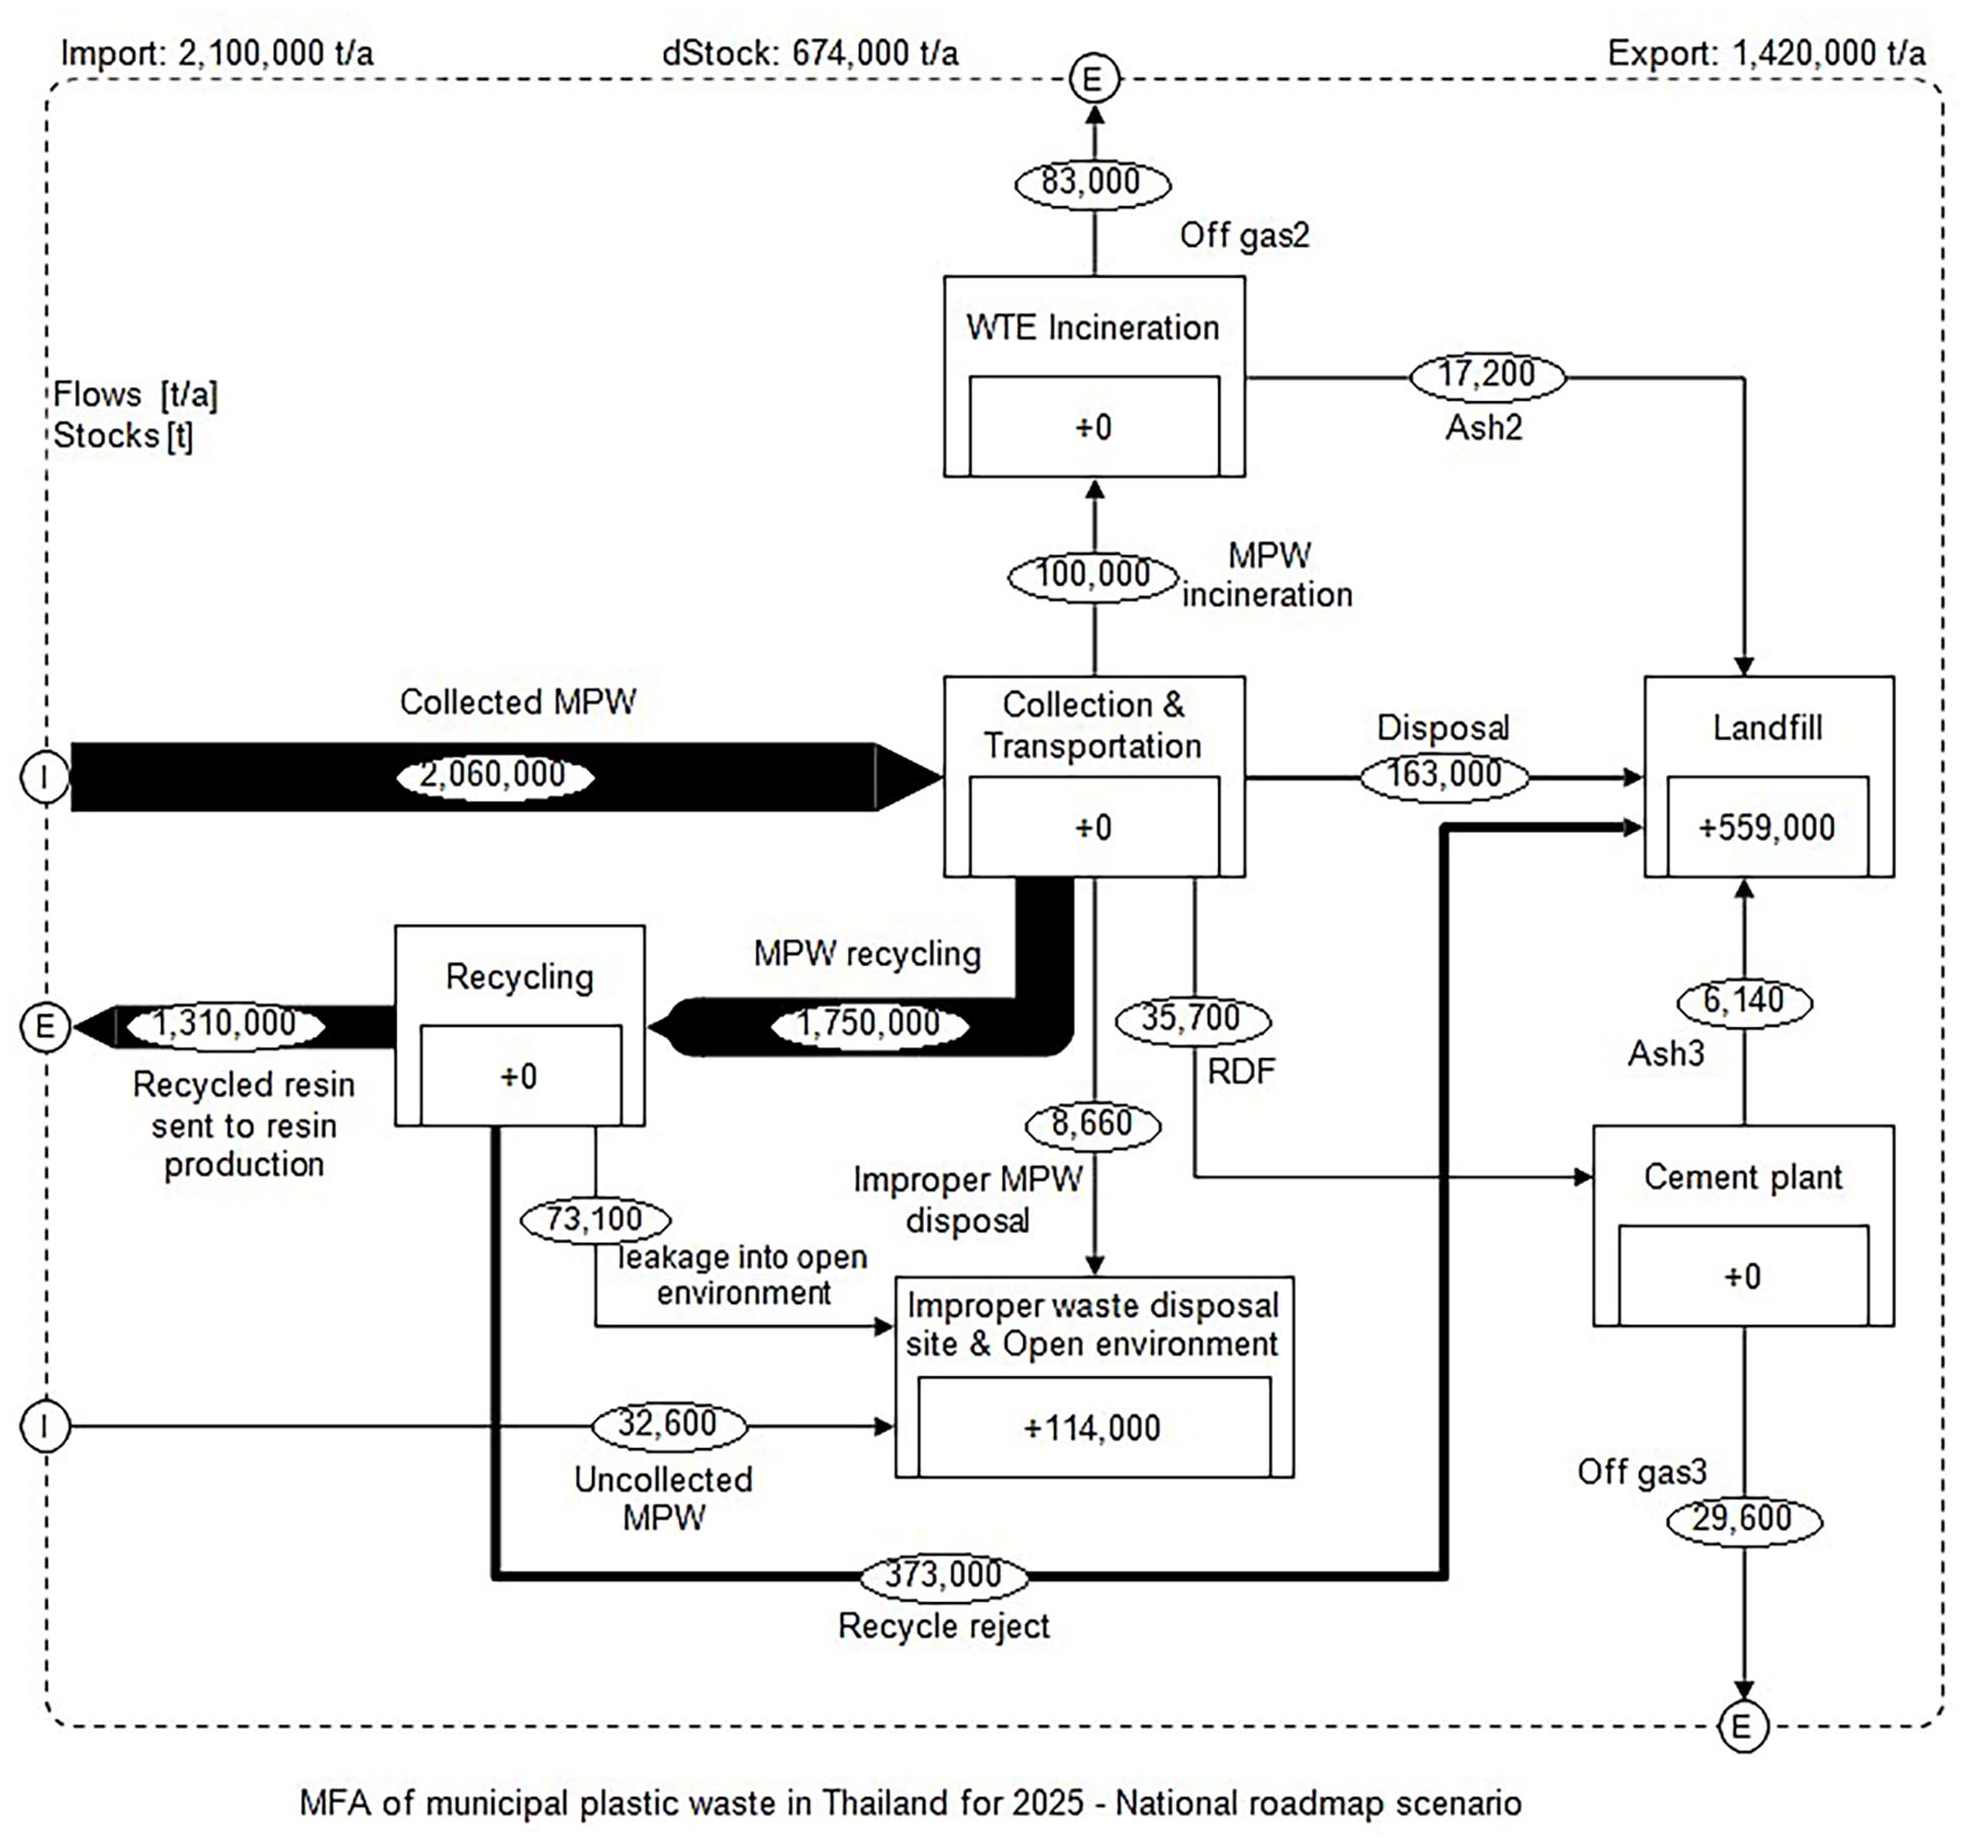
MFA of MPW in Thailand for 2025 – National roadmap scenario.
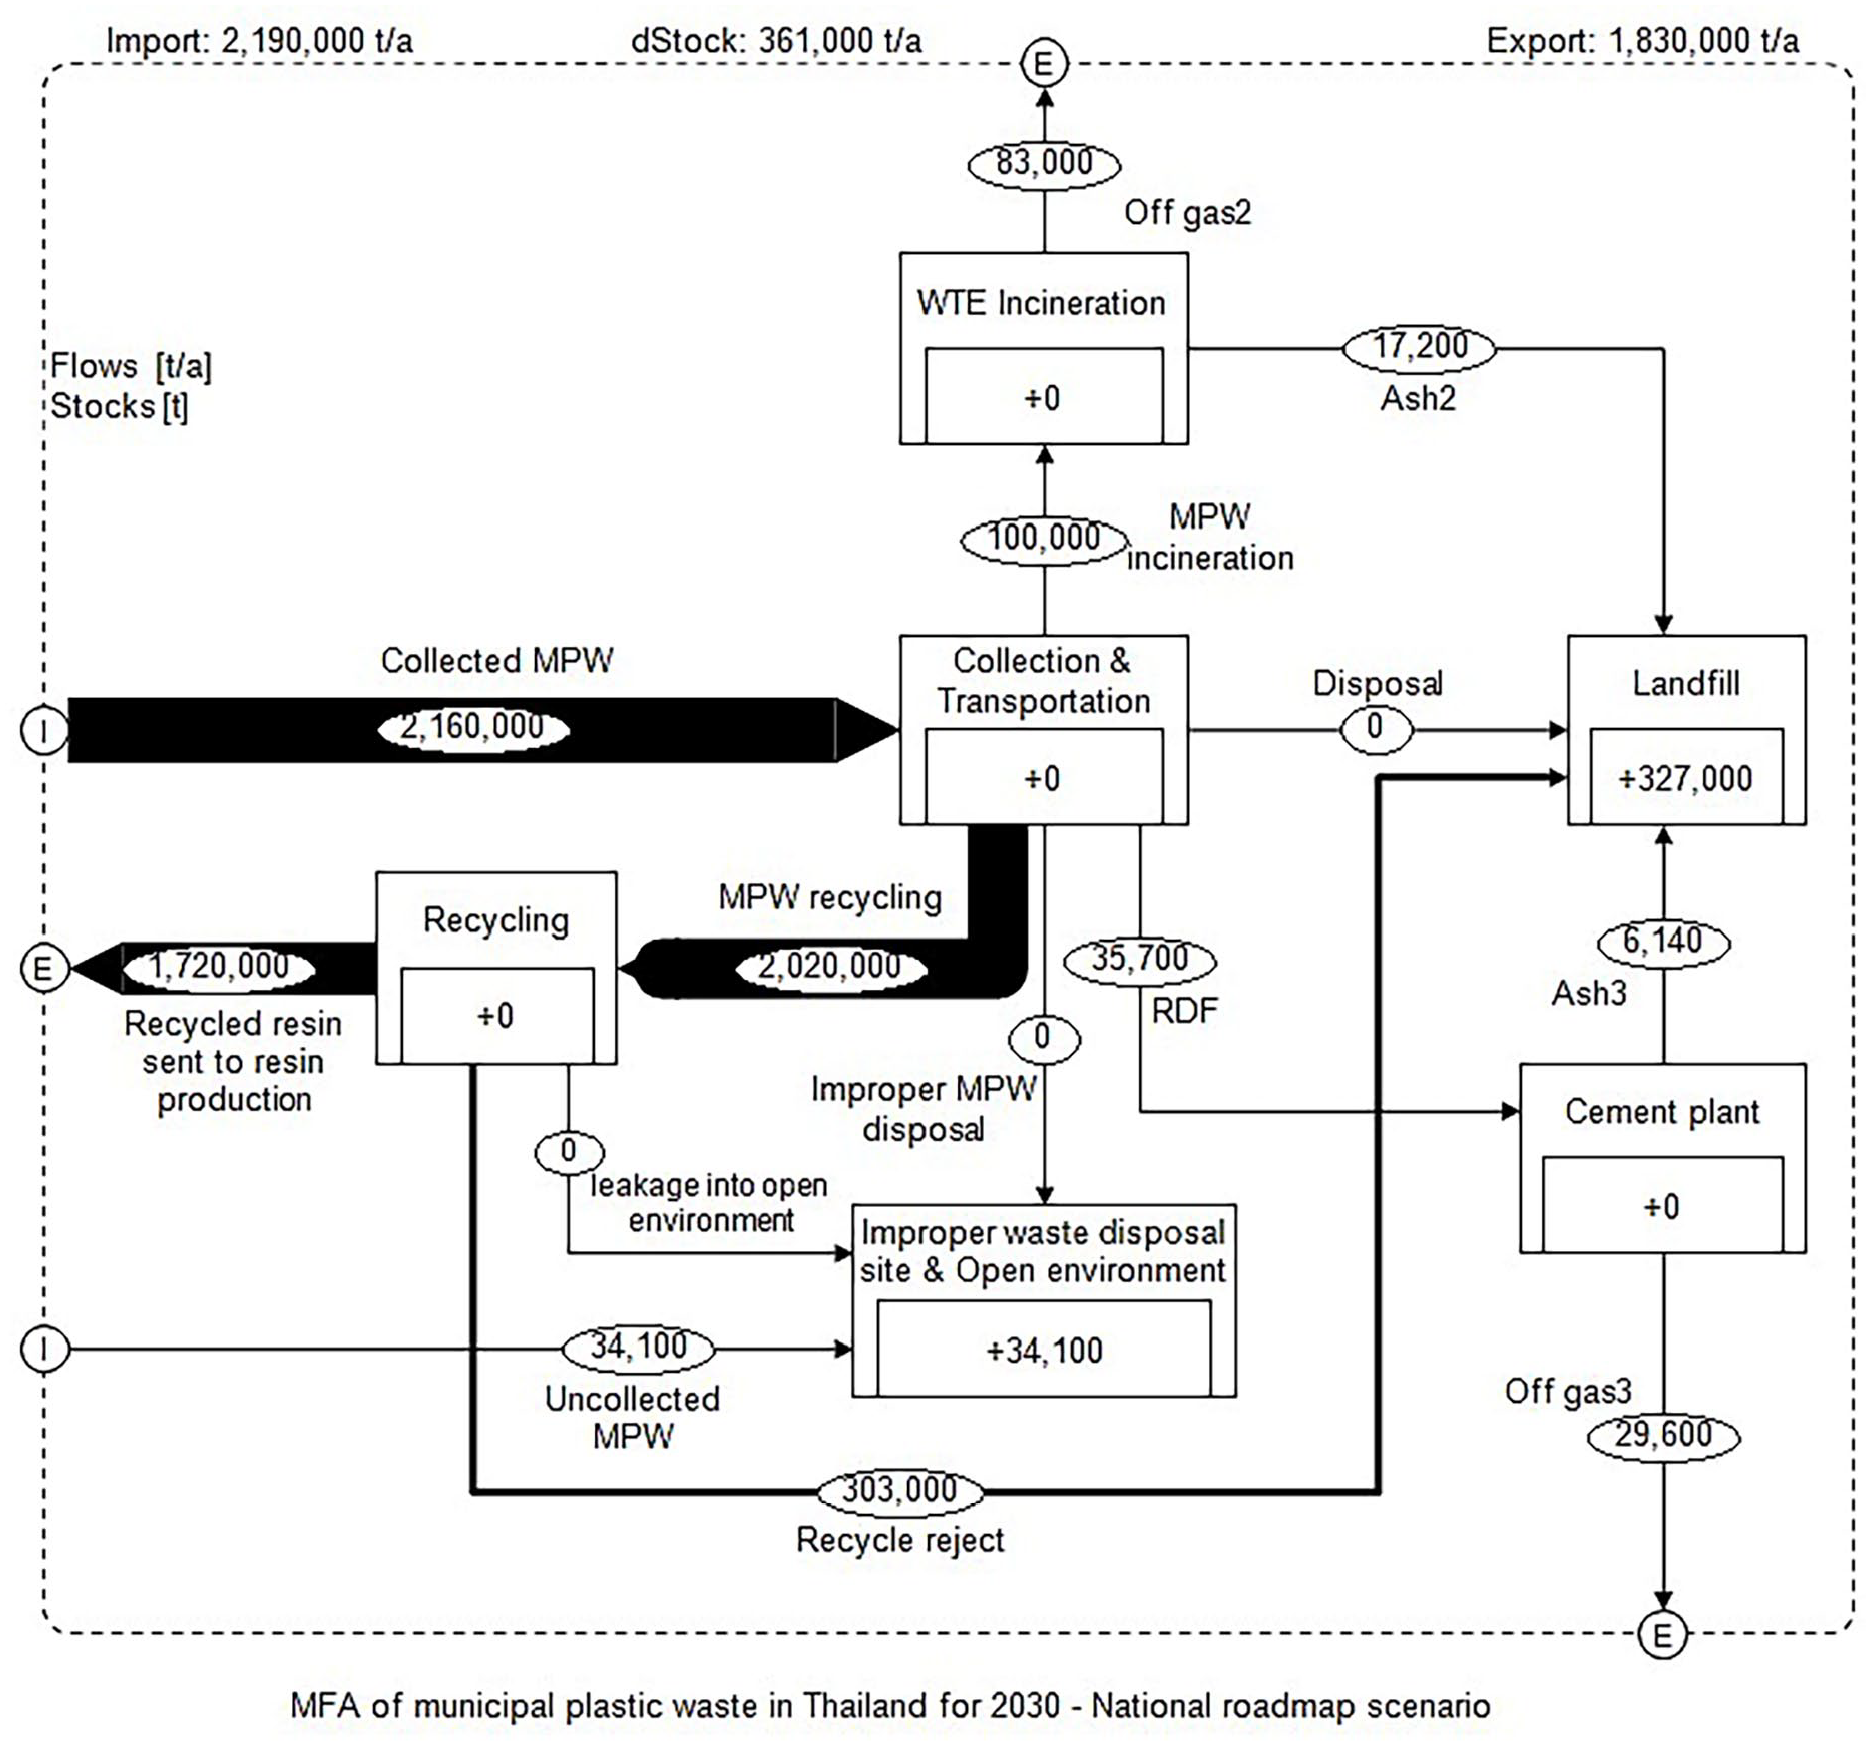
MFA of MPW in Thailand for 2030 – National roadmap scenario.
In this scenario, the total recycling rates of MPW, including both target and non-target portions, will be 92.2% of the MPW generated in 2030. As the efficiency of the recycling process increases, the amounts of rejects and waste leakage decreases. Thus, recycled resin sent to the resin production process has a higher TC. By 2030, the amount of MPW leakage from the recycling process will be zero.
The amount of MPW used in WTE incinerators and cement plants was set to a constant level as of 2021. To ensure the continuous operation of these facilities, we assumed that the required amount of MPW for energy recovery was given priority. The possible recycling rates of MPW for the future years were calculated after the amount of MPW required for energy recovery was subtracted. As a result, the recycling rate will not meet the recycling target of the roadmap. The maximum possible recycling rate for 2027 will be only 92.1%, with 67.1% from the target plastic waste and 25.0% from the non-target plastic waste.
The recycling process will produce at least 1.72 Mt of recycled resin (78.4% of the MPW generated), which is 5.2 times the production in the BAU case in 2030. The government and all stakeholders in the waste management, plastic, and petrochemical industries should be prepared to accommodate the supply changes. Currently, many municipalities operating RDF production plants face difficulties selling their RDF products. Therefore, the preparation and development of markets that can help match RDF sellers and users and a system for RDF quality control must be actively supported. The overall amount of MPW recovered for material and energy utilisation in 2030 will be 98.4% of MPW generated, approximately three times the amount in BAU scenario.
Meanwhile, the amount of MPW that will be improperly disposed of and possibly leaked into the open environment will be 0.03 Mt (1.6% of MPW generated), a reduction of 94.9% compared to the BAU scenario. This amount is solely from the uncollected MPW. This number can be lower if the efficiency of the waste collection system is increased.
In addition, the amount of collected MPW sent to landfills will be zero. Only 0.33 Mt of recycling rejects and combustion ash (14.9% of MPW generated) will require landfills. However, there will still be MPW in landfills and the open environment due to accumulated stocks from previous years. From 2018 to 2030, there will be 8.58 Mt of MPW accumulated in landfills, a reduction of 35.7% compared to the BAU scenario. Furthermore, there will be at least 2.82 Mt of MPW disposed of improperly and possibly leaked into the open environment. This is a reduction of 65.9% compared to the BAU scenario.
Conclusion
MFA is a useful tool that can be applied to analyse and support decision-making related to waste management. It helps estimate unknown data by balancing processes in the system. STAN software quickens the calculation and can present flow results in Sankey-style, which aids the visualisation of our hypothesis and its outcomes. The results from MFA can help us understand the effects of the national roadmap on MPW flows. However, a more accurate MFA is desirable to allow tracking and managing MPW to become more efficient. A systematic data acquisition and collection system in Thailand should be significantly improved, especially for the %MPW and the inputs and outputs from the recycling process.
The results of the forecasting and MFA showed that plastic waste pollution requires careful policy planning and management. The forecast for MPW generation in Thailand for 2030 is 2.19 Mt. Under the BAU scenario, the recycling and utilisation rate of MPW was only 32.3% in 2030. About 48.7% of MPW generated will be sent to landfills, while 30.3% of MPW generated will not be treated properly and might leak into the open environment. Under the roadmap scenario, the recycling and utilisation rate of MPW will increase to 98.4% in 2030. Only 14.9% of MPW generated will be sent to landfills, a 69.4% reduction compared to the BAU scenario. The possible amount of MPW leaked into the open environment will reduce to 1.6% of MPW generated. This amount could be further reduced if the efficiency of waste sorting at the source and the recycling process improves. Under the roadmap scenario, the recycling rate for ‘target plastic waste’ in 2027 could only reach 67.1% because MPW is required to fire existing waste incinerators and industries. Our study showed that the national targets for waste management could cause some limitations to achieving the waste-to-energy targets. The government and key stakeholders in plastic industries, waste recycling and waste-to-energy industries and other relevant public sectors must collaborate and agree on a sustainable path for plastic waste management. The results of this study will help policymakers plan and adapt environmental policies. Improving information systems to be comprehensive and transparent together with serious environmental controls through regulatory certifications could lead to more accurate flow analysis and facilitate further plastic waste utilisation. For further study, the authors recommend using updated percentages of plastic waste composition and conducting sensitivity analyses.
Supplemental Material
sj-docx-1-wmr-10.1177_0734242X221126376 – Supplemental material for Investigation of plastic waste management in Thailand using material flow analysis
Supplemental material, sj-docx-1-wmr-10.1177_0734242X221126376 for Investigation of plastic waste management in Thailand using material flow analysis by Salita Kamsook, Awassada Phongphiphat, Sirintornthep Towprayoon and Soydoa Vinitnantharat in Waste Management & Research
Footnotes
Declaration of conflicting interests
The authors declared no potential conflicts of interest with respect to the research, authorship, and/or publication of this article.
Funding
The authors disclosed receipt of the following financial support for the research, authorship, and/or publication of this article: The authors would like to express their gratitude to The Joint Graduate School of Energy and Environment (JGSEE), King Mongkut’s University of Technology Thonburi and the Center of Excellence on Energy Technology and Environment (CEE), Ministry of Higher Education, Science, Research and Innovation (MHESI) for the financial support provided to perform this study. The Author would like to thank Bangkok Metropolitan Administration (Environment Department), Plastics Institute of Thailand, Pollution Control Department of Thailand, and Center of Excellence on Hazardous Substance Management (HMS) for supporting data to use in this study; and to Asst. Prof. Dr.Komsilp Wangyao, Dr. Sujitra Vassanadumrongdee, and Dr. Rotchana Intharathirat for their guidance.
Supplemental material
Supplemental material for this article is available online.
References
Supplementary Material
Please find the following supplemental material available below.
For Open Access articles published under a Creative Commons License, all supplemental material carries the same license as the article it is associated with.
For non-Open Access articles published, all supplemental material carries a non-exclusive license, and permission requests for re-use of supplemental material or any part of supplemental material shall be sent directly to the copyright owner as specified in the copyright notice associated with the article.