
Abstract
Discharge from unrestricted tobacco products with filters (TPF) causes environmental damage. To reduce TPF litter quantities, Directive (EU) 2019/904 requires TPF producers to proportionally contribute to the costs of discarding their products in public waste collection systems, including litter waste ones. An appropriate output-based cost model requires assessing TPF quantities in relevant waste streams. Currently, there is no comprehensive data available on TPF quantities in municipal solid waste (MSW). Therefore, a case study was conducted to quantify TPF in MSW. This study aimed to determine TPF quantities (1) in residual waste from four German district types and (2) in waste from public collection systems for three settlement structures within Trier City. Relevant waste streams from public collection systems, namely waste from public waste receptacles, street-cleaning waste and sinkhole residues, were identified. For both sampling campaigns, consideration was given to extrapolating the results to a larger scale. The results showed that the average specific TPF quantities in residual waste were 277.7, 271.8, 193.3 and 204.5 gi− 1a− 1 in the selected city district, urban district, densely populated rural district and sparsely populated rural district, respectively. Extrapolation of these results to Germany yielded a specific TPF quantity in residual waste of 250.3 gi-1a-1. The average specific TPF quantities in waste from public waste receptacles, street-cleaning waste and sinkhole residues were 12.2, 47.4 and 9.9 gi−1a− 1, respectively. The results could contribute to cost model development based on Directive (EU) 2019/904.
Keywords
Introduction
The discharge of tobacco products with filters (TPF) into the environment causes severe environmental damage since toxic components contained in the filters can be leached (Bialous et al., 2017; Kadir and Sarani, 2015; Novotny and Slaughter, 2014; Wright et al., 2015). For this reason, a report commissioned by the World Health Organization in 2017 demanded that the costs of cleaning and discarding TPF should be allocated to consumers and producers (Bialous et al., 2017). Within this context, Directive (EU) 2019/904, which addresses the reduction in the impact of certain plastic products on the environment, requires TPF manufacturers to proportionally contribute to the costs of discarding TPF in public waste collection systems (The European Parliament and the Council of the European Union, 2019). To this end, extended producer responsibility (EPR) was introduced (The European Parliament and the Council of the European Union, 2019). Single-use plastic (SUP) products covered by the EPR framework, among others TPF, are addressed in Annex E of Directive (EU) 2019/904 (The European Parliament and the Council of the European Union, 2019). The costs must include awareness-raising measures, cleaning up, transport and treatment of litter from the affected products as well as costs of data gathering and reporting (The European Parliament and the Council of the European Union, 2019).
Per Directive (EU) 2019/904, European member states must transpose cost contributions for TPF into national law by 5 January 2023 (The European Parliament and the Council of the European Union, 2019). However, a critical challenge in the transposition procedure is the development of a cost model for products discarded in public waste collection systems. One approach to establishing these costs is to determine SUP-product quantities in public waste collection systems (output-based cost model; European Commission, 2021). A valid methodological approach must be employed to generate reliable data that can be extrapolated to the regional or national scale. A detailed description and derivation of the theoretical-methodological approach applied in this article can be found in the first part of our article series (Spies et al., 2023).
Data for TPF in MSW derived from the literature
Municipal Waste Europe has reviewed the data available for different European countries pertaining to litter waste to determine the disposal costs for SUP products following Directive (EU) 2019/904. The results show that most countries do not collect annual data on litter amounts. When the disposal costs for litter waste are calculated, the costs usually refer to the total amount of litter generated. There is no differentiation of products in Annex E of Directive (EU) 2019/904 (Municipal Waste Europe, 2020).
Different approaches can be used to improve the available data for TPF in MSW. One approach is on survey. Surveys can address consumers or stakeholders. When addressing consumers, the goal is often to better understand the propensity or reasons for littering (Al-Khatib et al., 2009; Fehr et al., 2014; Moqbel et al., 2019). For example, data obtained from a Swiss survey show a high consumer willingness to discard TPF on the ground because correct disposal is laborious (Fehr et al., 2014). A German survey addressed stakeholders such as public waste-management institutions (slightly less than 50% of the total survey participants) and city, municipal and district administrations and waste authorities (~30% of the total survey participants; Belke et al., 2020). A total of 75.4% of respondents answered that TPF are often/always disposed of as litter (Belke et al., 2020). Here, it is evident that subjectivity and the nature of the survey questions could lead to data biases. In some studies, surveys have been combined with sampling observations (IPE Institut für Politikevaluation GmbH (Institute for Policy Evaluation), 2020; Scott et al., 2021). Because of the high sampling and analysis effort related to waste from public collection systems, the Institute for Policy Evaluation recommends a procedure to collect annual data on TPF in public waste, including surveys and observations of smokers (IPE Institut für Politikevaluation GmbH (Institute for Policy Evaluation), 2020). The procedure determines the amount of TPF smoked in public via surveys and the amount of TPF discarded as litter via observations of smoking behaviour in public places (IPE Institut für Politikevaluation GmbH (Institute for Policy Evaluation), 2020). A method for the observation and documentation of TPF litter behaviour has been previously described in the literature (Patel et al., 2013). However, the development of the survey and the selection of suitable observation places are at least partly subjectively influenced. Moreover, the TPF mass shares in waste from public collection systems cannot be derived without further data.
In addition to consumer-oriented data collection, data generation regarding the actual TPF disposal quantities in public areas offers another approach. A distinction can be made between visually inspecting and physically sampling littered objects. A general visual classification of public areas was conducted based on the Local Environmental Audit and Management System (LEAMS) methodology in Scotland (Bedford, 2022; Keep Scotland Beautiful, 2022). Selected public areas were divided into five grades to assess the presence of litter (Bedford, 2022; Keep Scotland Beautiful, 2022). A similar approach was used in the study by Farzadkia et al. (2023), in which littered waste items were visually counted in Iran. These studies evaluated the littering conditions in public areas. Data on TPF masses in waste from public collection systems are usually not collected.
Studies involving sampling approaches often evaluate the TPF quantity in specific hotspots or sensitive areas. Therefore, sampling areas include beaches (Araújo and Da Costa, 2021; Marine Conservation Society, 2022; Novotny and Slaughter, 2014; Oigman-Pszczol and Creed, 2007; Ribeiro et al., 2021), riversides (Kiessling et al., 2019; Rossi et al., 2023) or roadsides (Crabb and Lessack, 2014; Moriwaki et al., 2009). Studies on specific TPF hotspots such as bus stops (Oliver et al., 2014) or streets associated with nightlife (Becherucci and Seco Pon, 2014) also exist. Some of the mentioned studies are connected to population participation (Kiessling et al., 2019, 2023; Marine Conservation Society, 2022; Novotny and Slaughter, 2014). The TPF quantity is often expressed as the number of TPF items per area or the number of TPF items relative to the total number of littered items. Regarding the TPF item share in the total number of littered item on beaches, the following values have been reported: 38.4% (Araújo and Da Costa, 2021), 44% (Oigman-Pszczol and Creed, 2007), 19% (Novotny and Slaughter, 2014) or 15.5–24.1% (Ribeiro et al., 2021). These values exhibit significant fluctuations, and the results highly depend on the selected sampling area and methodology. In sensitive areas and litter hotspots, these studies can contribute to the measurement of the clean-up effort associated with TPF litter. However, they do not provide an overview of the TPF quantity in different MSW streams, such as waste from public collection systems. Moreover, mostly item counts, and no mass-related data for TPF have been reported. Since waste quantities are usually expressed as mass-related quantities, extrapolation of item counts to the national scale is not possible without additional data.
A few studies have been performed in which the TPF quantity was determined in waste from public collection systems (Gellenbeck and Reuter, 2020; Hietler et al., 2017; ). Gellenbeck and Reuter (2020) conducted a study in Germany to determine the costs for the disposal of TPF in waste from public collection systems. A TPF mass share for Germany of 1.3 wt% was determined by Gellenbeck and Reuter (2020) including public waste receptacles (from streets and green areas), street-cleaning waste, sinkhole residues and litter from green areas. A Belgian study commissioned by a local government combined the results of different studies regarding the composition of littered waste in Belgium (Interwaste/Recover, 2018; Municipal Waste Europe, 2020). However, products were not differentiated based on Annex E of Directive (EU) 2019/904 (Municipal Waste Europe, 2020). An Austrian study analysed litter collected with population participation over 4 days (Saubers Salzburg) (Hietler et al., 2017). TPF accounted for 0.4 wt% of the total littered waste mass (Hietler et al., 2017).
In conclusion, an objective and representative database for the TPF quantity in MSW is provided only to a limited extent. Most previous studies on the TPF quantity in MSW refer only to certain MSW streams, such as litter in specific areas or do not focus on products defined in Annex E of Directive (EU) 2019/904 such as TPF.
Objectives and research questions in this study
To improve the TPF quantity database, this study aimed to determine the TPF quantity in different MSW streams, including residual waste and waste from public collection systems. In waste streams, a small quantity of TPF occurs, often with a small size per item. Therefore, custom sampling and analysis requirements are necessary. In this article, a previously developed theoretical approach based on these requirements was applied to determine the SUP-product TPF quantity in MSW (Spies et al., 2023). The obtained results could contribute to the development of a cost model for TPF based on Directive (EU) 2019/904 to fulfil the EPR guidelines. Hence, the following research questions (RQs) can be derived:
RQ 1. How can the developed theoretical method be applied to determine the SUP-product quantity in MSW exemplified by TPF?
RQ 2. What is the TPF quantity in residual waste depending on the district type, and how can it be extrapolated to Germany?
RQ 3. What is the TPF quantity in waste streams from public collection systems depending on the settlement structure of a city?
RQ 4. What are the characteristics of TPF contained in different MSW streams?
In this article, the applied sampling method is first described. Subsequently, the sampling and analysis results are presented.
Material and methods
To determine the TPF quantity in MSW and to achieve reliable results, a suitable sampling and analytical method must be adopted. Therefore, a previously developed theoretical approach (Spies et al., 2023) was applied to obtain the specific SUP-product quantity of TPF. The applied sampling and analysis procedure is described below. In the first step, possible TPF disposal routes are identified. Waste streams with a relevant TPF quantity, namely residual waste and waste from public collection systems, are selected for sampling. In the second step, representative sampling areas are determined, and suitable sampling procedures are outlined. Then, the sample preparation and analysis procedures are described.
TPF disposal routes
To determine the TPF quantity in MSW, TPF disposal routes were identified, and relevant waste streams were selected for sampling. TPF can be found in both private and public MSW streams. Waste streams from public collection systems with a relevant TPF quantity include waste from public waste receptacles, street-cleaning waste and sinkhole residues (sometimes also referred to as gully or drainage pit residues). These waste streams mainly occur in cities and were analysed due to their high relevance to cost determination based on Directive (EU) 2019/904. Street-cleaning waste and sinkhole residues were classified as litter waste. Other inner-city waste streams include waste from green areas and waste from non-publicly maintained areas. Both waste streams were excluded in this study, as representative sampling was hindered by the characteristics of these waste streams or the responsibility of their waste management. The most relevant TPF quantities in household waste can be found in residual waste. Therefore, residual waste was sampled to perform a plausibility check of the results. Other household waste with small TPF quantities was excluded from this study. In addition to managed areas, TPF are discarded in the environment, mainly outside towns, without regular cleaning intervals. A representative analysis is barely possible in this area. Therefore, these TPF were excluded in this study.
Representative sampling areas
Regarding the sampling concept, a distinction is made between residual waste and waste from public collection systems. The Federal Republic of Germany was chosen as the extrapolate region for the residual waste analysis results. All chosen sampling areas occur in Rhineland-Palatinate. Rhineland-Palatinate exhibits a mean proportion of 17.7% of regular smokers (Statistisches Bundesamt (Federal Statistical Office), 2018). The German average smoking rate is 18.8% (Statistisches Bundesamt (Federal Statistical Office), 2018). Thus, the average smoking rate in Rhineland-Palatinate approximately corresponds to the German average value (Statistisches Bundesamt (Federal Statistical Office), 2018).
Representative sampling areas for residual waste
As a basis to select residual waste sampling areas, the district-type classification of the Federal Institute of Germany for Research on Building, Urban Affairs and Spatial Development was adopted (Bundesinstitut für Bau-, Stadt- und Raumforschung (BBSR) (Federal Institute for Research on Building, Urban Affairs and Spatial Development), 2018). This classification distinguishes between core cities and three county types. The region around the German city of Trier was chosen as a representative region for all district types (compare Figure 1(a)). As shown in Figure 1(a), 68.3% of all German inhabitants live in urban areas (Bundesinstitut für Bau-, Stadt- und Raumforschung (BBSR) (Federal Institute for Research on Building, Urban Affairs and Spatial Development), 2022).
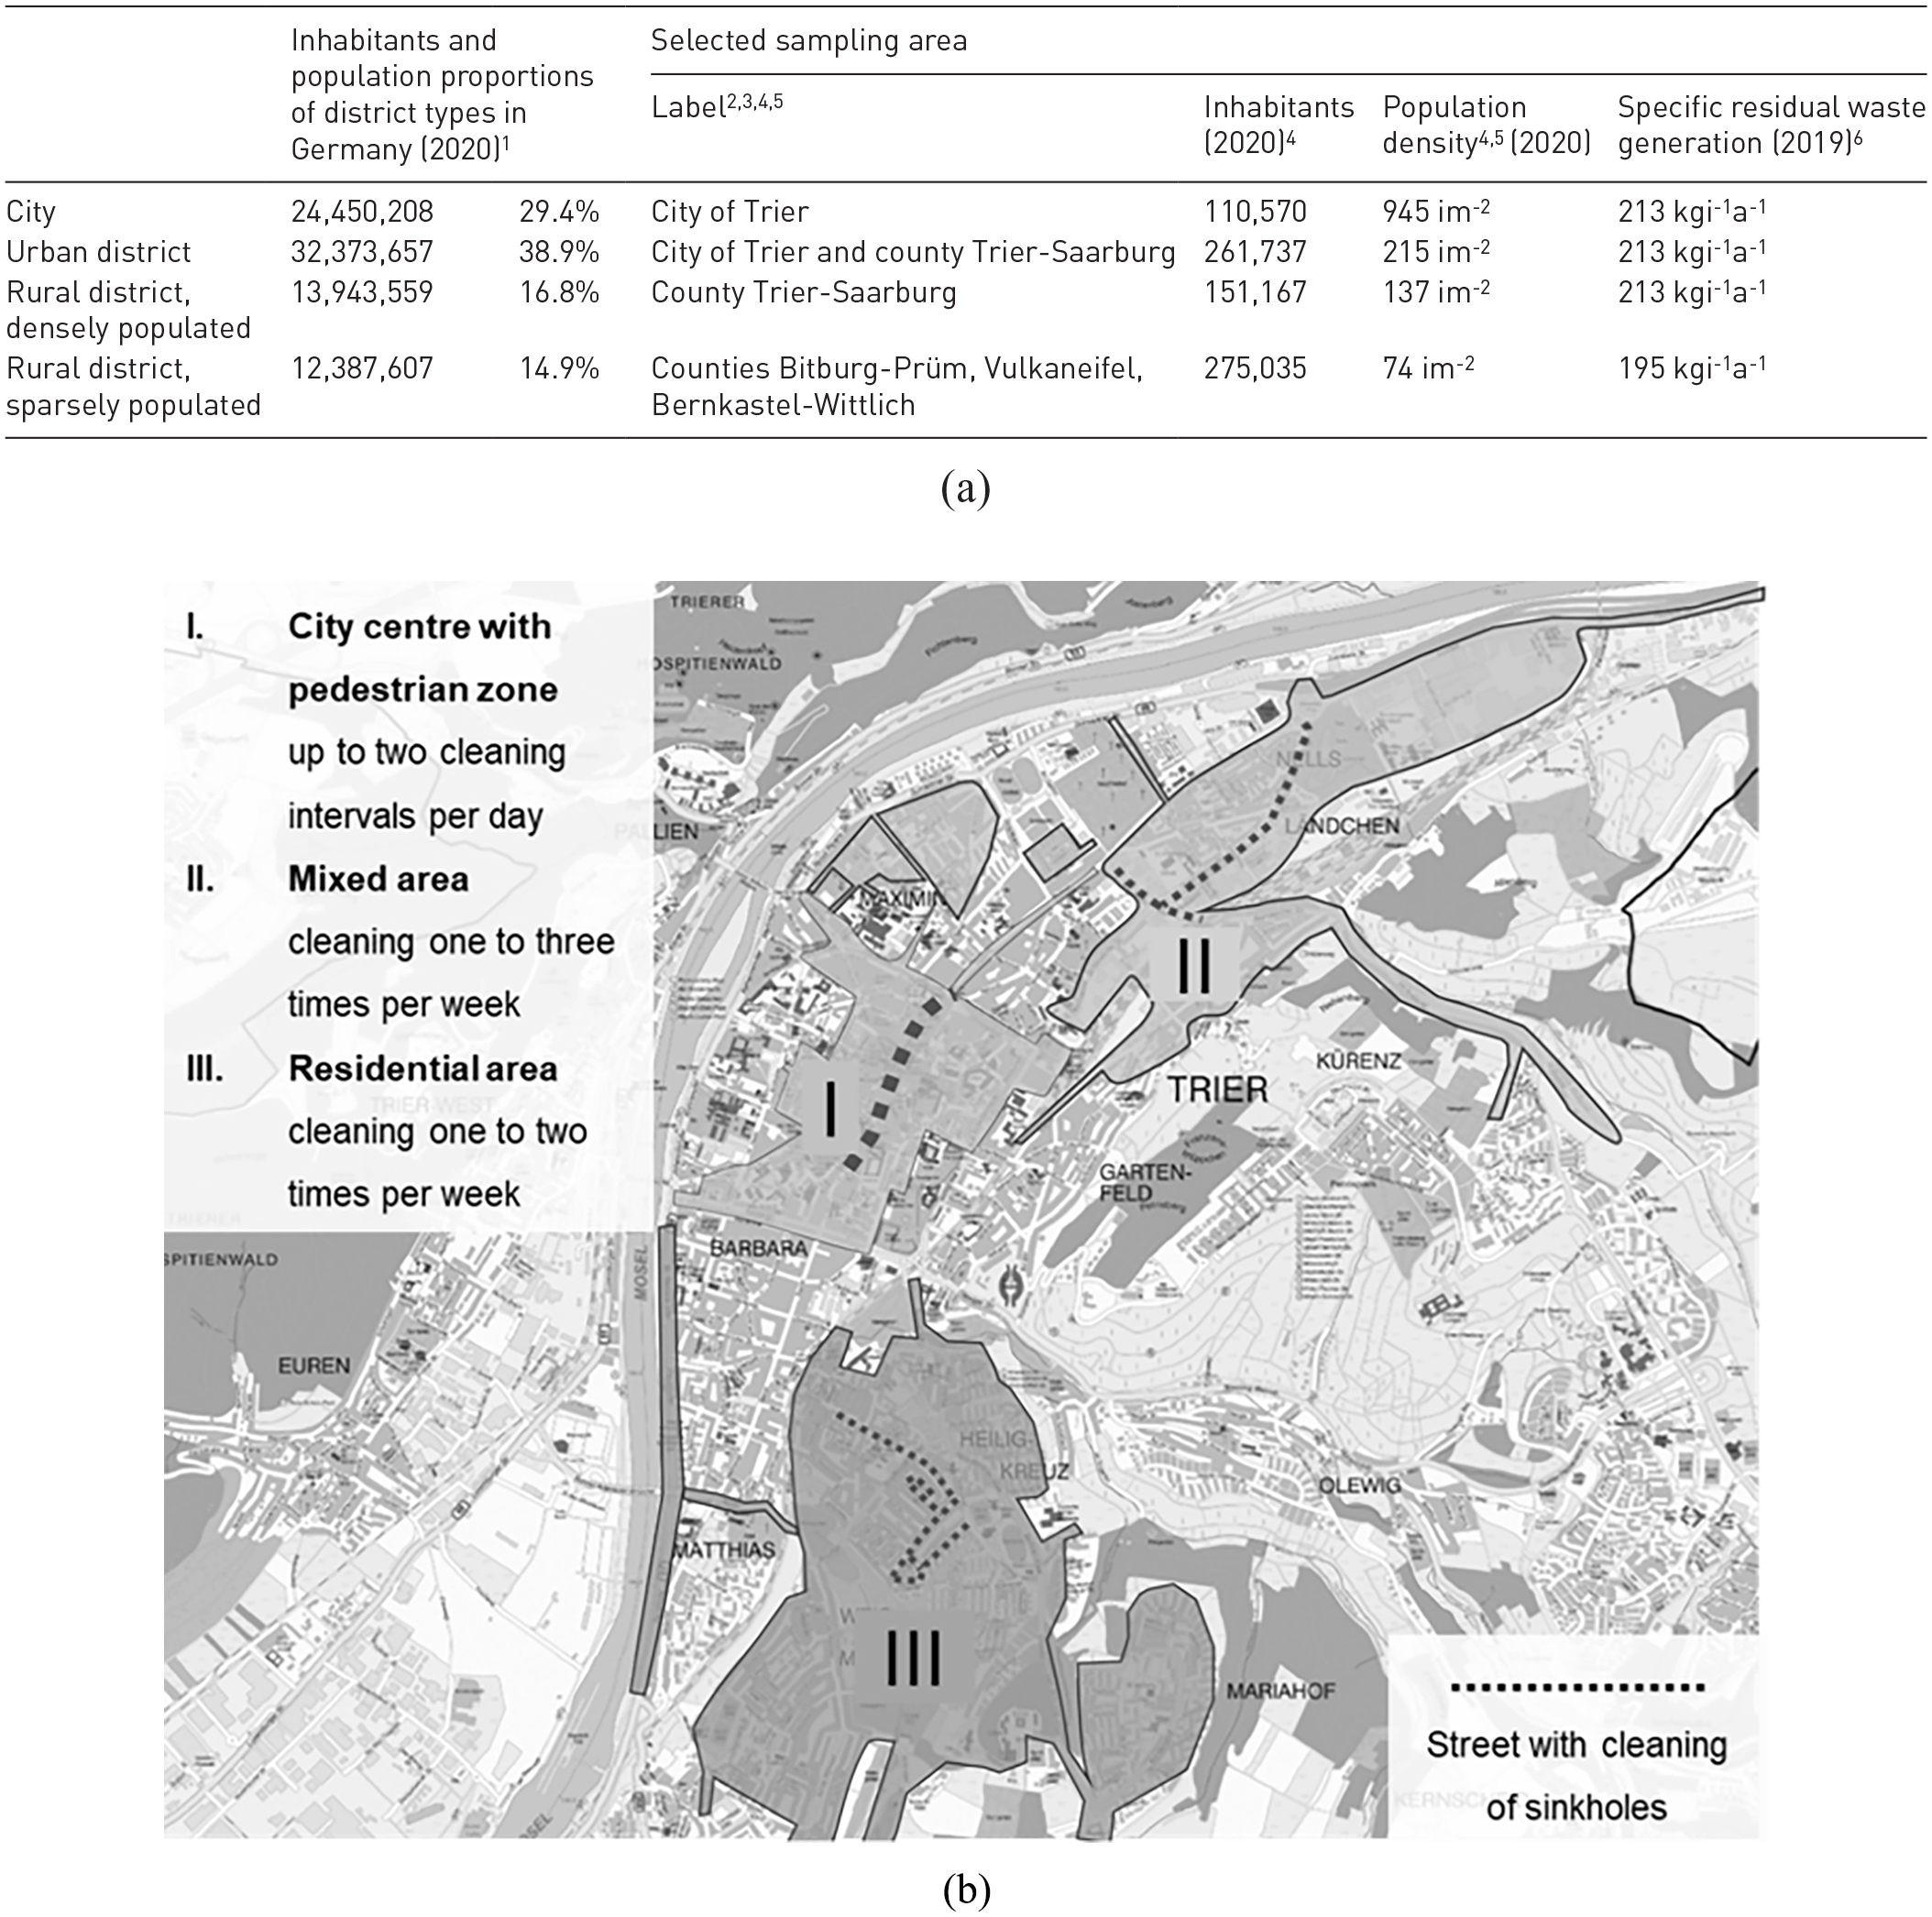
Selected sampling areas for the sampling of (a) residual waste by district type classification according to the BBSR and parameters of the selected districts (1Bundesinstitut für Bau-, Stadt- und Raumforschung (BBSR) (Federal Institute for Research on Building, Urban Affairs and Spatial Development), 2022),2Bundesinstitut für Bau-, Stadt- und Raumforschung (BBSR) (Federal Institute for Research on Building, Urban Affairs and Spatial Development), 2018), 3Bundesinstitut für Bau-, Stadt- und Raumforschung (BBSR) (Federal Institute for Research on Building, Urban Affairs and Spatial Development), 2020), 4Statistisches Bundesamt (Federal Statistical Office), 2020b), 5Statistisches Bundesamt (Federal Statistical Office), 2020a), 6data provided by the regional municipal waste-management company A.R.T. Trier), (b) waste from public collection systems for three settlement structures and cleaning intervals (class I, II and III) in the city of Trier (map adapted from Stadtverwaltung Trier (2020), classification according to cleaning class based on data from the regional municipal waste-management company A.R.T. Trier).
For extrapolating the results, specific TPF quantities in residual waste for each district type must be determined. The population proportions given in Figure 1(a), and the specific TPF quantities per district type can be used to calculate a weighted average for the specific TPF quantities in Germany. It is assumed that TPF quantities in residual waste are equally distributed within each district type, and the sampled district types are representative of Germany (Spies et al. 2023).
If the inhabitant-specific residual waste quantities were weighed according to the number of German inhabitants living in the different district types (compare Figure 1(a)), the specific residual waste quantity in the selected sampling area would reach 210.2 kgi−1a−1 in 2019. This value is significantly higher than the German average of 160 kgi−1a−1 (Statistisches Bundesamt (Federal Statistical Office), 2021) because except for Vulkaneifel, the selected district types do not provide a region-wide kerbside system for biowaste. Instead, there is the option of discarding biowaste in a bring system. However, a similar consumer behaviour regarding TPF disposal in residual waste was assumed throughout Germany. The assumption is that even if biowaste were jointly collected with residual waste, the specific TPF quantity [kgi−1a−1] in residual waste discarded by the consumer would remain unchanged. Therefore, it is deduced that the specific TPF quantity [kgi−1a−1] in residual waste can be calculated in the selected district types and extrapolated to Germany. However, TPF mass shares in residual waste cannot simply be transferred to other regions.
Representative sampling areas for waste from public collection systems
In the selected sampling area, waste from public collection systems can only be sampled in Trier City since access to data on the waste quantity in public collection systems only exists for the city district type. In counties, street cleaning is only performed by the community in inner-city districts. In residential areas, property owners are often responsible for street cleaning. The waste disposed of by property owners is declared as household waste and not separately documented. Therefore, the waste from public waste collection systems were not sampled for the respective county types.
In the sampling of waste from public collection systems, the settlement structure within a city generates a significant impact. In Trier City, three settlement structures with different cleaning classes (class I, II and III) and related cleaning intervals were chosen, including a city centre with pedestrian areas (class I), a mixed area (class II) and a residential area (class III). The selected settlement structures exhibit different intervals for street cleaning and waste collection from public waste receptacles. Class I is associated with public cleaning services three to seven times per week and partly additional emptying of public waste receptacles up to two times per day. Within class II, 43% of street metres are cleaned (cleaning of streets and public waste receptacles) once a week, 54% of street metres are cleaned twice a week and 3% of street metres are cleaned three times a week. Within class III, 70% of street metres are cleaned once a week and 30% of street metres are cleaned twice a week. The chosen areas are shown in Figure 1(b).
To sample sinkhole residues, specific streets in each settlement structure were selected (compare Figure 1(b)). Litter waste not captured by street cleaning can be found in sinkholes. Therefore, all TPF discarded in public waste collection systems can be found in streets where street-cleaning waste and sinkhole residues were sampled. The sinkholes were emptied half a year prior to the sampling campaign.
Sampling procedure
After representative sampling areas were selected, a sampling procedure was developed. All samples were collected in 2020. Some of the sampling campaigns were impacted by COVID-19-related measures. During sampling, the low-vegetation period was chosen to eliminate seasonal influences as much as possible. The generated data, therefore, present the baseload of the TPF quantity in MSW.
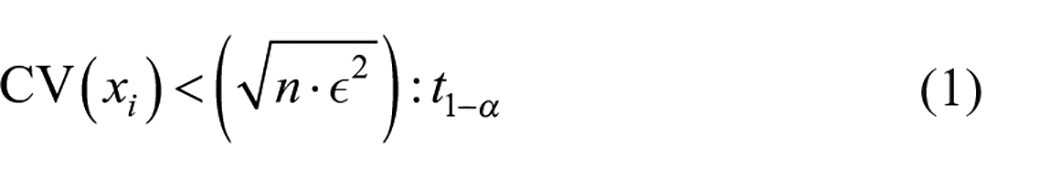
The sample number must be sufficient to represent the variance in the target parameter (Landesamt für Umwelt, Landwirtschaft und Geologie (State Office for the Environment, Agriculture and Geology Saxony), 2016). The variance in waste streams can be measured by the coefficient of variation. The statistical background of determining a reliable number of samples is described elsewhere (Spies et al., 2023). With n samples, the relative maximum random deviation ϵ and the Student factor t1-α, the coefficient of variation CV(xi) can be calculated according to equation (1) (Landesamt für Umwelt, Landwirtschaft und Geologie (State Office for the Environment, Agriculture and Geology Saxony), 2016). The Student factor for a two-sided t-distribution t1–α considering an error probability of 5% with unlimited degrees of freedom f → ∞ is 1.96 (Landesamt für Umwelt, Landwirtschaft und Geologie (State Office for the Environment, Agriculture and Geology Saxony), 2016; Mühl, 2017; Hedderich and Sachs, 2018). A relative maximum random derivation of 10% can be assumed if the MSW stream is generated on a regular basis (Landesamt für Umwelt, Landwirtschaft und Geologie (State Office for the Environment, Agriculture and Geology Saxony), 2016), which is given for all sampled waste streams.
Sampling procedure for residual waste
Before sampling, residual waste was pretreated in a mechanical-biological waste treatment (MBT) plant in Trier-Mertesdorf (Germany). Approximately 300 tonnes of residual waste was collected in each district type over 3 days. Due to the close cooperation with the local waste-management company, the residual waste origin could be precisely determined. The pretreatment process of MBT plant Trier-Mertesdorf includes temporary storage for 2–3 days and a biodrying process for a minimum of 9 days. In the biodrying process, a loss of at least 33 wt% (water and biomass) occurred, resulting in a remaining water content of approximately 20 wt%.
The residual waste was sampled after regular pretreatment at the MBT plant. The residual waste from the counties was sampled from the running stream on a conveyor belt. From experience, a volume of 90 L per sample was chosen. The residual waste originating from Trier City was sampled during sorting plant operations. Due to accessibility limitations, sampling was only possible from the <40 mm fraction. A sample volume of 10 L was chosen (Bund/Länder-Arbeitsgemeinschaft Abfall (LAGA) (Federal/State Waste Working Group), 2001). Preliminary investigations have shown that TPF occur in the <40 mm particle-size range. Therefore, the change in the sampling procedure did not affect the results. Regarding the particle-size distribution of residual waste from Trier City, preliminary investigation data were used to back-calculate the original sample quantity.
Twenty-five samples of residual waste were collected in each district type. With the use of equation (1), the coefficient of variation can be calculated based on the number of samples. The collection of 25 samples results in a coefficient of variation of 25.5% for each district type. Due to significant deviations in the analysis process, one sample from Trier City and one from the sparsely populated rural district were excluded. This resulted in a reduced coefficient of variation of 24.9%.
Sampling procedure for waste from public collection systems
Street-cleaning waste stemming from each settlement structure was collected for 1 week. Waste from public waste receptacles was collected for 1 week at the city centre and for 2 weeks in the residential and mixed areas due to the smaller amounts of waste generated in these areas. Waste from each settlement structure and each waste stream was separately stored in containers. All collected masses, including water from street cleaning, were reported.
To ensure a representative amount of waste during the collection period, the weight of waste from public waste receptacles (Supplemental Material 1(a)) and street-cleaning waste (Supplemental Material 1(b)) for each settlement structure was determined over 13 weeks with a portable vehicle scale. Quantities from individual vehicles and waste streams are not recorded during regular operation. Each settlement structure contains different sweeping districts. One sweeping district in each settlement structure was assessed for both waste streams. Trier contains one sweeping district in the city centre, two in the mixed area and six in the residential area. Average waste masses of 2800 kg from waste receptacles and 10,700 kg from street cleaning were weighed on a weekly basis. Thus, it was ensured that the collected quantities for sampling corresponded to the average waste generation amounts, and the partially applied COVID-19 restrictions had as little influence as possible on the sampling results.
Most of the public waste receptacles in the selected settlement structures of Trier City are equipped with ashtrays. TPF from ashtrays were separately sampled. An overview of all waste receptacle types in Trier is given in Supplemental Material 2. The number and volume of each type of public waste receptacle are provided in Supplemental Material 3.
The sinkhole residues were sampled by a standard cleaning procedure. The sampled masses represent the sinkhole residues accumulated over half a year since the cleaning procedure occurs twice a year. At the city centre, 94 gullies were selected for sampling, 109 were selected in the mixed area and 114 were selected in the residential area.
The waste streams from each settlement structure were sieved to 40 mm with a mobile round-hole drum sieve. Sieving ensured a suitable loosening and homogenisation effect. The samples were collected from the running stream (<40 mm). The collected mass of the sinkhole residues at the city centre was an exception. Due to the high street-cleaning interval, only approximately 1 kg of waste per sinkhole and a total quantity less than 100 kg were obtained. Therefore, the entire mass was used for further analysis.
Regarding the waste stemming from public waste receptacles and street cleaning, 20 samples per district were obtained. With the use of equation (1), the calculated coefficient of variation was 22.8%. In terms of the waste from public waste receptacles in the mixed and residential area, 180 and 250 kg, respectively, were collected over 2 weeks. After sieving to 40 mm, the entire sieve underflow was sampled for sieving and sorting analysis. As a result, seven samples were collected in the residential (coefficient of variation: 13.4%), and four samples were obtained in the mixed area (coefficient of variation: 10.2%). Due to the smaller average collected masses of the sinkhole residues, 12 samples were collected per settlement structure. This resulted in a coefficient of variation of 17.6%. Due to the resulting upper particle size of 40 mm, a volume of 10 L per sample was selected (Bund/Länder-Arbeitsgemeinschaft Abfall (LAGA) (Federal/State Waste Working Group), 2001).
Sample preparation and analysis
All samples were analysed at the technical lab of the Chair of Anthropogenic Material Cycles (ANTS) at RWTH Aachen University.
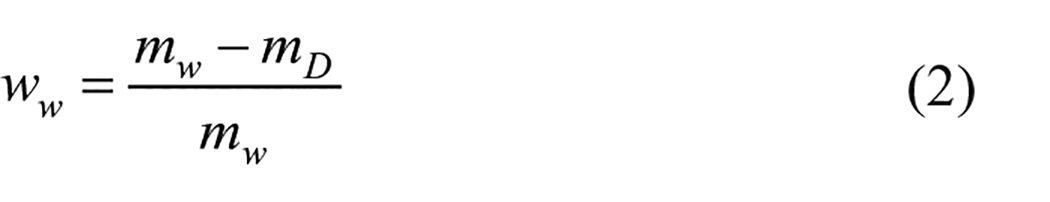
All residual waste samples contained remaining moisture. The remaining moisture did not influence the subsequent sieving and sorting analysis results. The public waste receptacle, street-cleaning waste and sinkhole residue samples were dried in a drying oven. The water content ww was calculated with equation (2) according to DIN EN 12880 with wet sample mass mw and dry sample mass mD (European Committee for Standardisation, 2000).
In manual analysis, the sorting effort can be reduced by sieving. If the TPF particle size is known, only the relevant particle-size classes must be sorted. Preliminary investigations have shown that the particle size of TPF ranges from 6.3 to 20 mm. Therefore, sieving to 20 mm with a drum sieve was first performed. Application of the drum sieve guarantees a favourable loosening effect. Afterwards, the samples were sieved to 10 and 6.3 mm with a box sieve. The technical specifications of the analytical sieves used are given in Supplemental Material 4. The 6.3–10 mm and 10–20 mm particle-size classes were manually sorted. The analytical procedure is shown in Figure 2.
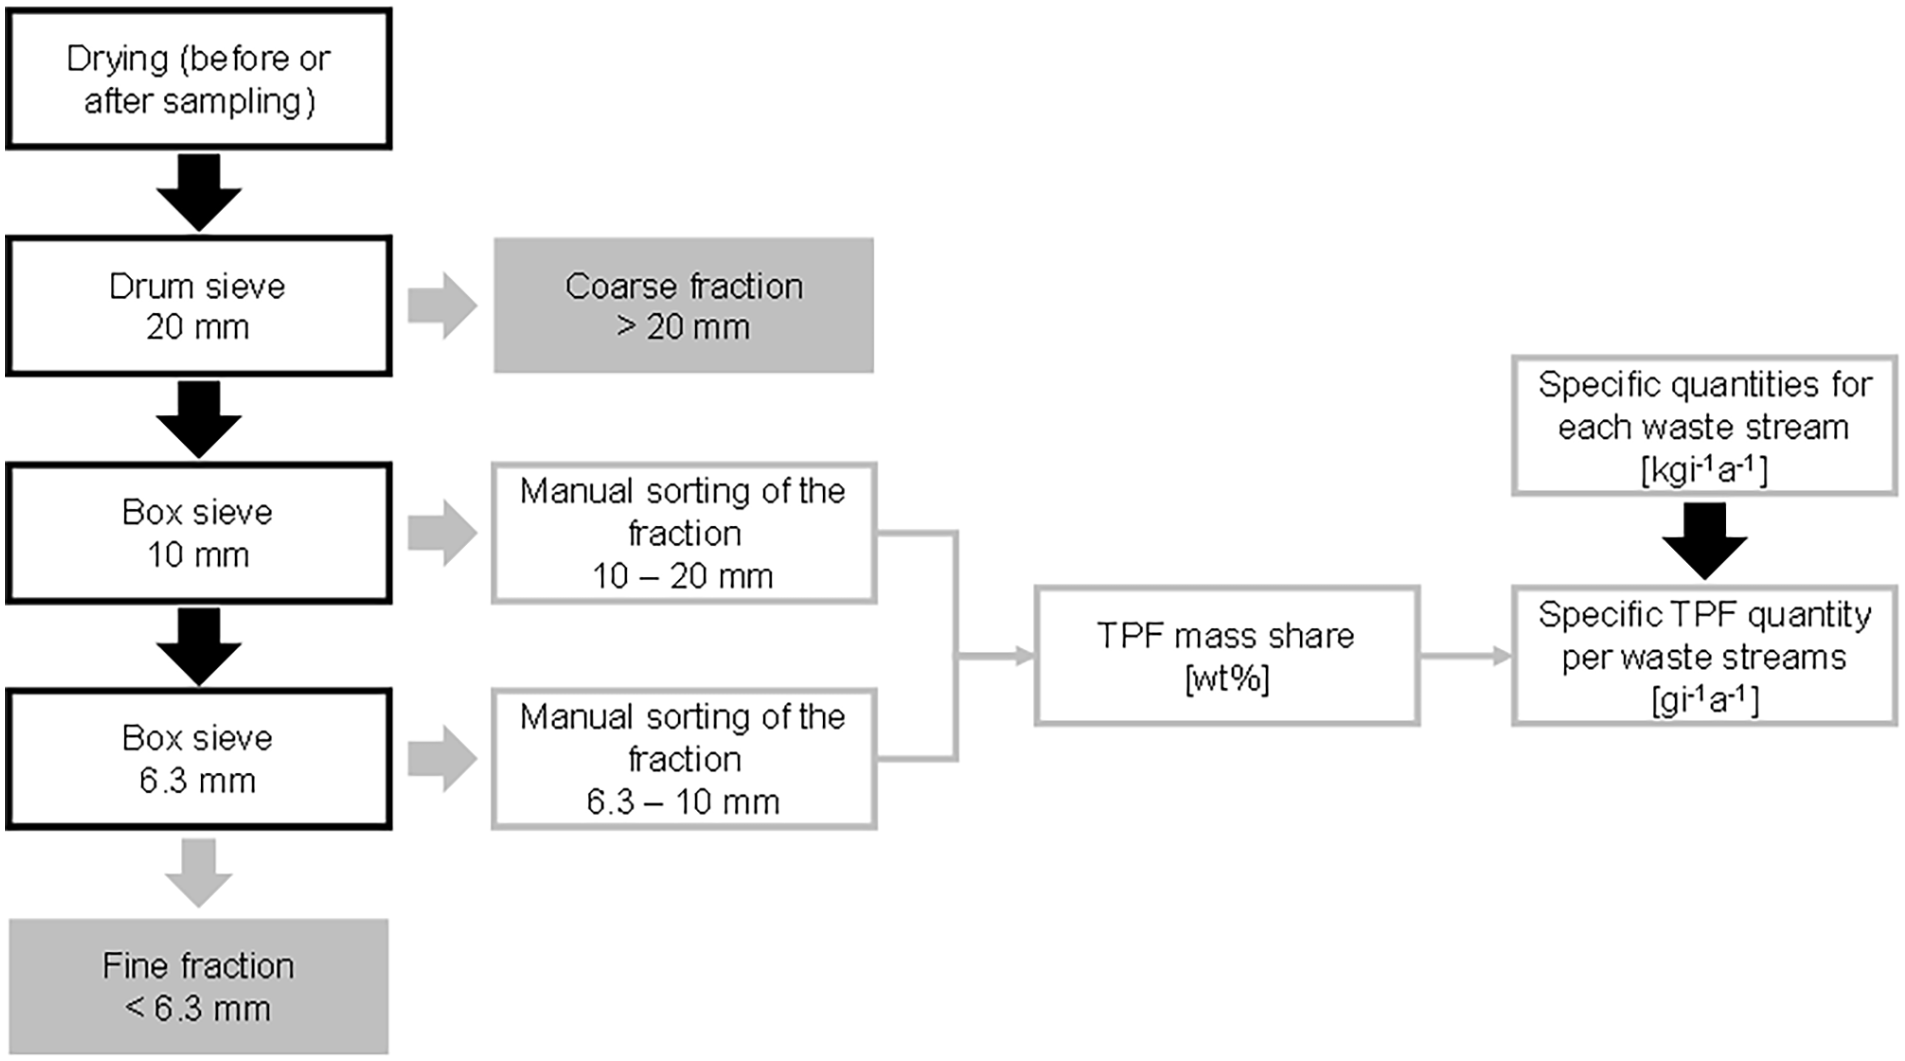
Flowchart of the conducted analyses to determine TPF quantities in MSW.
The TPF mass of each sample was determined. To calculate the TPF mass share, the mass was related to the original sample quantity using the determined water content. Preliminary investigations of the water absorption capacity of TPF were conducted to back-calculate the water content in the substrate. For this purpose, TPF were embedded in different substrates with defined water contents. The substrates were sealed, and the TPF were left in the substrates for 3 days. Subsequently, the TPF weight was determined. The water content was calculated using the wet and dry masses according to equation (2). The results showed that the substrate nature exerted only a minor influence on the TPF water absorption capacity. On average, the different substrate water contents corresponded to the water contents in the contained TPF. The assumption that the water content is equal between the substrates and TPF is thus reasonable.
In regard to residual waste (
R
), the specific TPF quantity MTPF,R,Di can be calculated with the TPF mass share related to the original sample mass cTPF,R,Di for each district type (Di) and the specific residual waste generation amount
Regarding waste from public collection systems, the TPF mass share related to the original sample mass cTPF,Ti,Si can be used to calculate the specific TPF quantity MTPF,Ti,Si in each waste stream (Ti) and settlement structure (Si). Therefore, the specific waste quantity in each waste stream MTi can be calculated by the total mass per waste stream and year mTi and the population of Trier E (2020, 110,676) (Statistisches Bundesamt (Federal Statistical Office), 2020b). Combined with the mass per waste stream collected for each settlement structure for 1 year mTi,Si and the total mass collected for each waste stream for 1 year mTi, the specific TPF quantity can be calculated according to equation (4).
Results and discussion
The sampling and analysis results are first presented and discussed for residual waste and afterwards for waste from public collection systems.
Residual waste
During residual waste sampling, residual waste was collected over 2 weeks. The average residual waste quantity delivered to the MBT plant in Trier-Mertesdorf from January 2017 to July 2020 for the selected district types is provided in Supplemental Material 5. The distribution of the waste container size in the selected districts is given in Supplemental Material 6. The input and output masses of the MBT plant in Trier-Mertesdorf during the sampling campaign and the resulting water losses are shown in Figure 3(a). Regarding the residual waste stemming from Trier City, the water loss in the biodrying process was 33 wt%. The residual waste stemming from the other districts exhibited water losses of 38 wt% each. The average sample mass obtained after the pretreatment process was 14.2 kg. All samples contained remaining moisture.
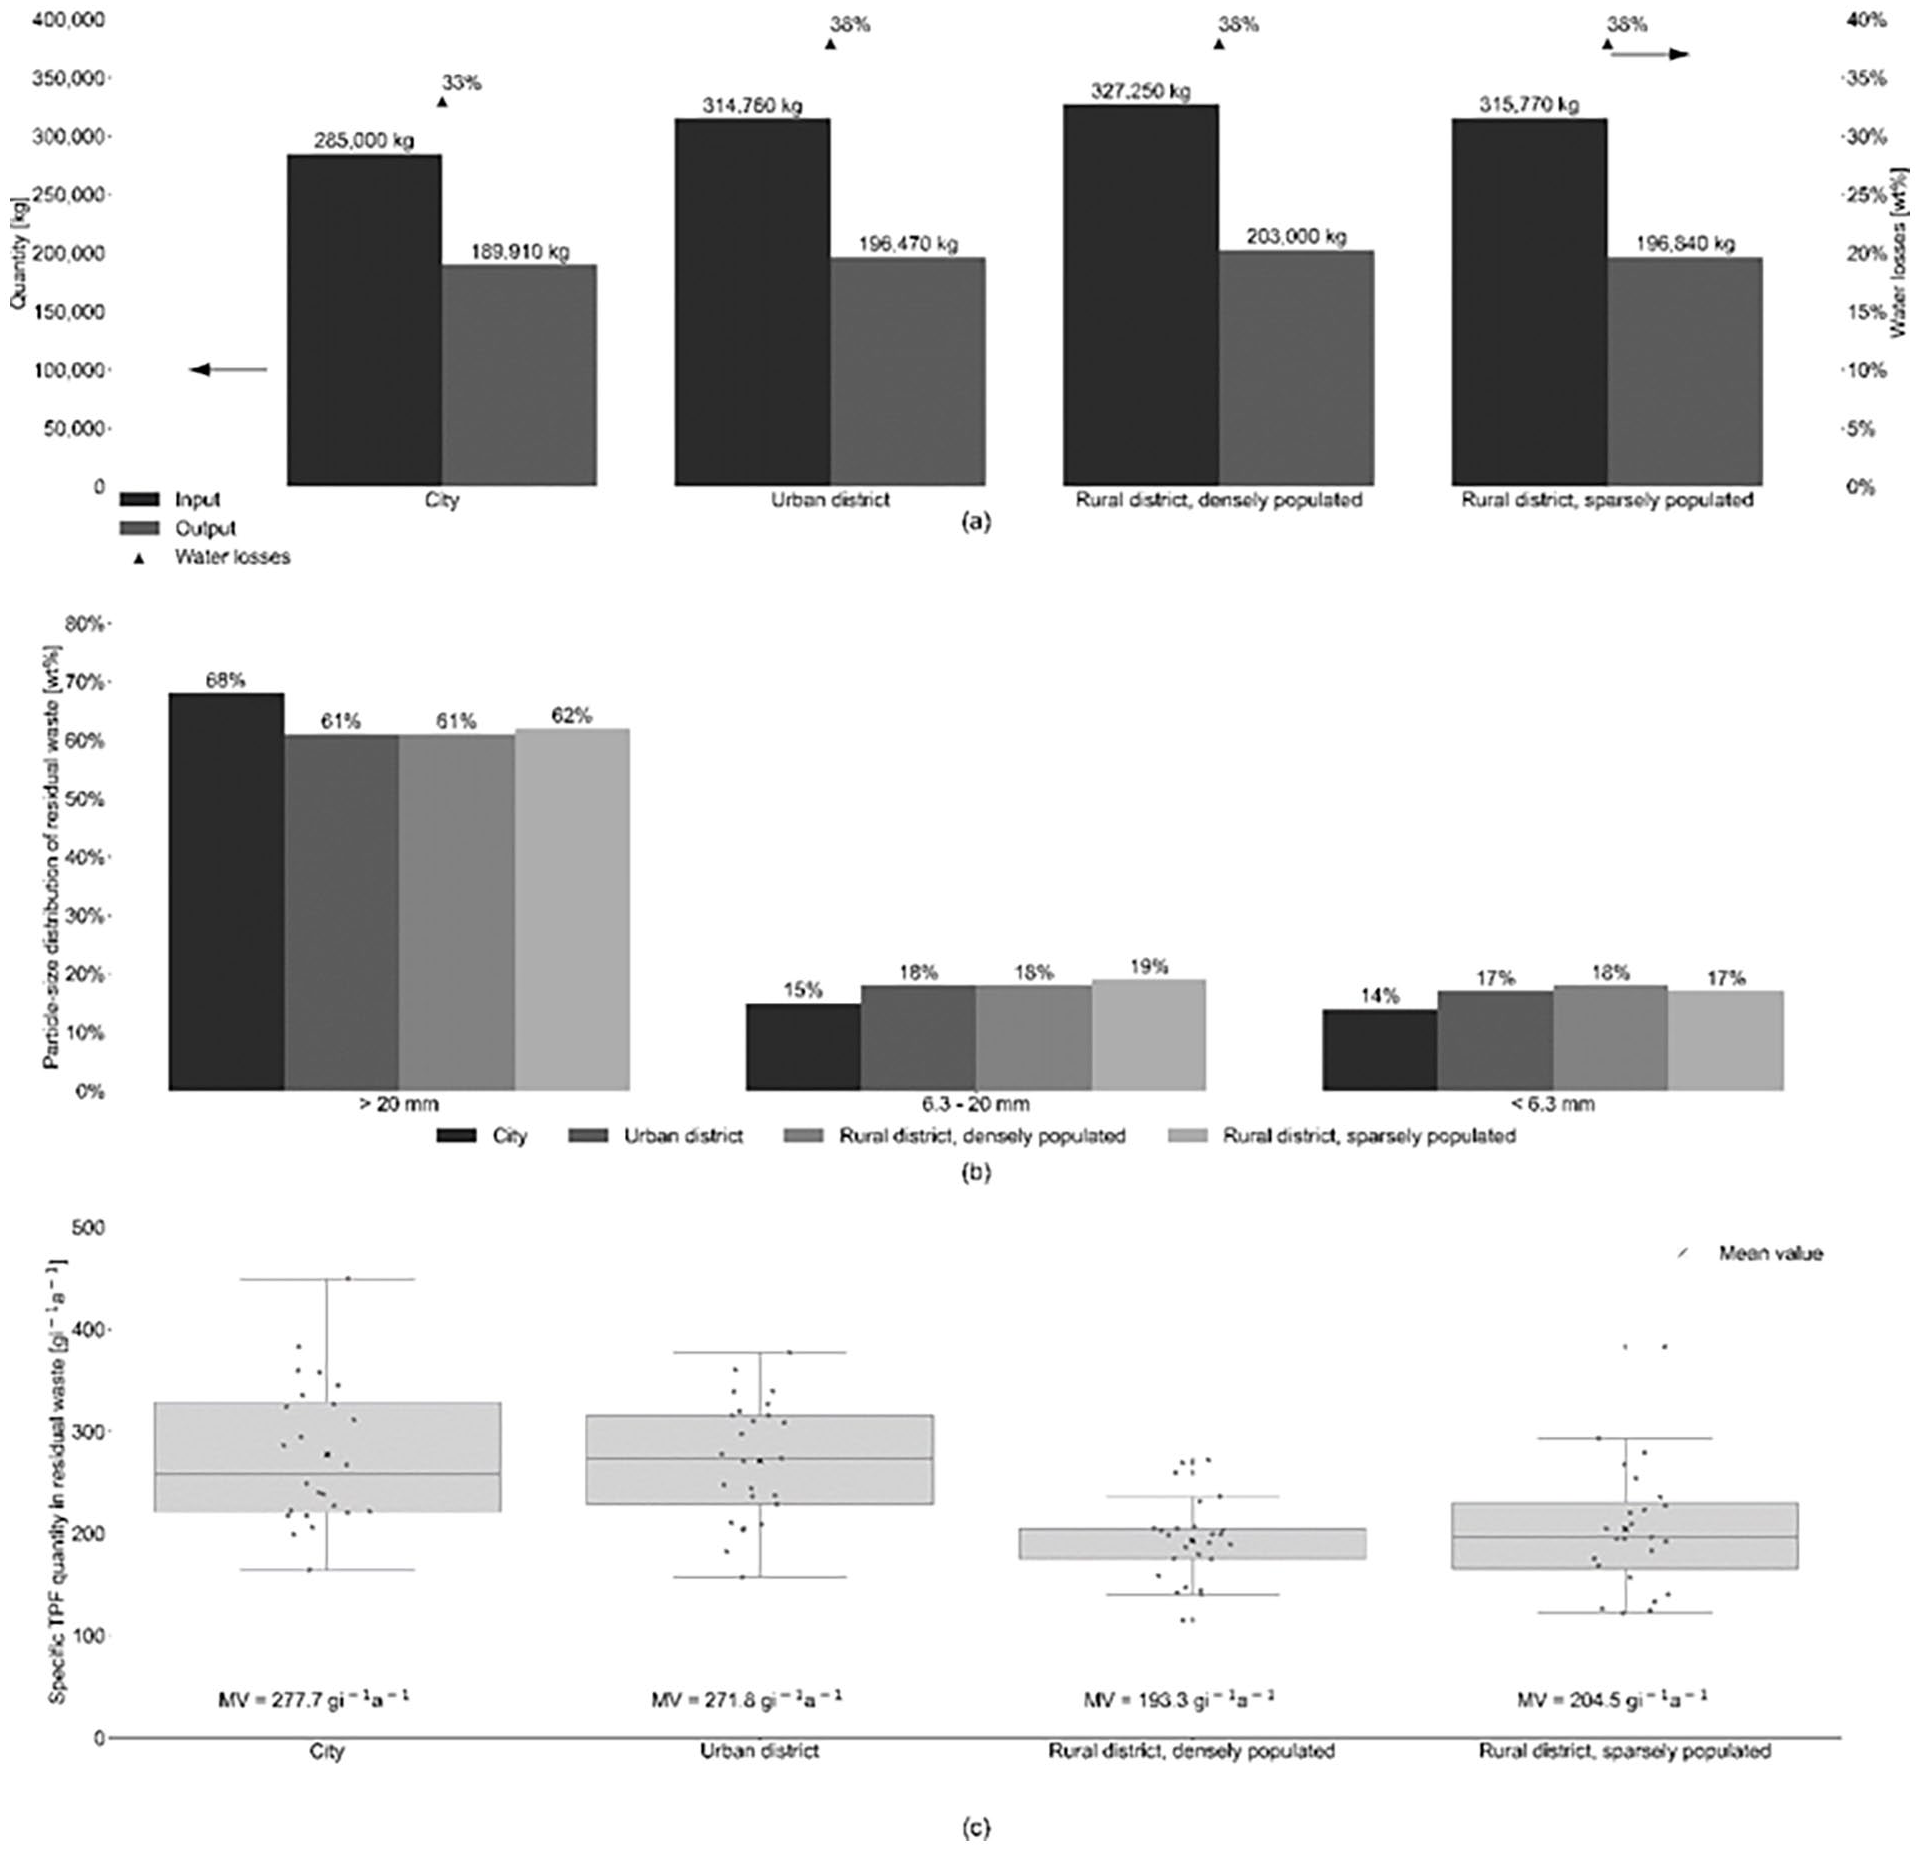
Results of the sampling campaign for residual waste by district type classification according to the BBSR including (a) input and output of the MBT plant and resulting water losses, (b) particle-size distribution and (c) distribution and mean values (MV) of the specific TPF quantity in residual waste per inhabitant and year (boxplot with boxes from the lower to the upper quartile and whiskers with a maximum of 1.5 times of the interquartile range).
The particle-size distributions of all samples after sieving are shown in Figure 3(b). On average, there was a loss of approximately 3 wt%. The >20 mm fraction accounted for the highest mass share rate among all samples. This demonstrates that the sorting effort on TPF in residual waste can be reduced dramatically by sieving to 20 mm.
The 6.3–10 mm and 10–20 mm particle-size classes were manually assessed. The distribution and mean values (Figure 3(c)) of the specific TPF quantity in residual waste (cf. equation (3)) showed that the TPF quantity was partially correlated with the urbanisation degree. Only in the sparsely populated rural district was the specific TPF quantity of 204.5 gi−1a−1 (0.105 wt%), corresponding to a specific residual waste quantity of 195 kgi−1a−1, slightly greater than that in the densely populated rural district. The highest average specific TPF quantity and the most significant fluctuation were observed for the residual waste from Trier City. The specific TPF quantity was 277.7 gi−1a−1 (0.131 wt%) with a specific residual waste quantity of 213 kgi−1a−1. The same residual waste quantity could be found in the urban and densely populated rural districts. The specific TPF quantities were 271.8 gi−1a−1 (0.128 wt%) and 193.3 gi−1a−1 (0.091 wt%), respectively.
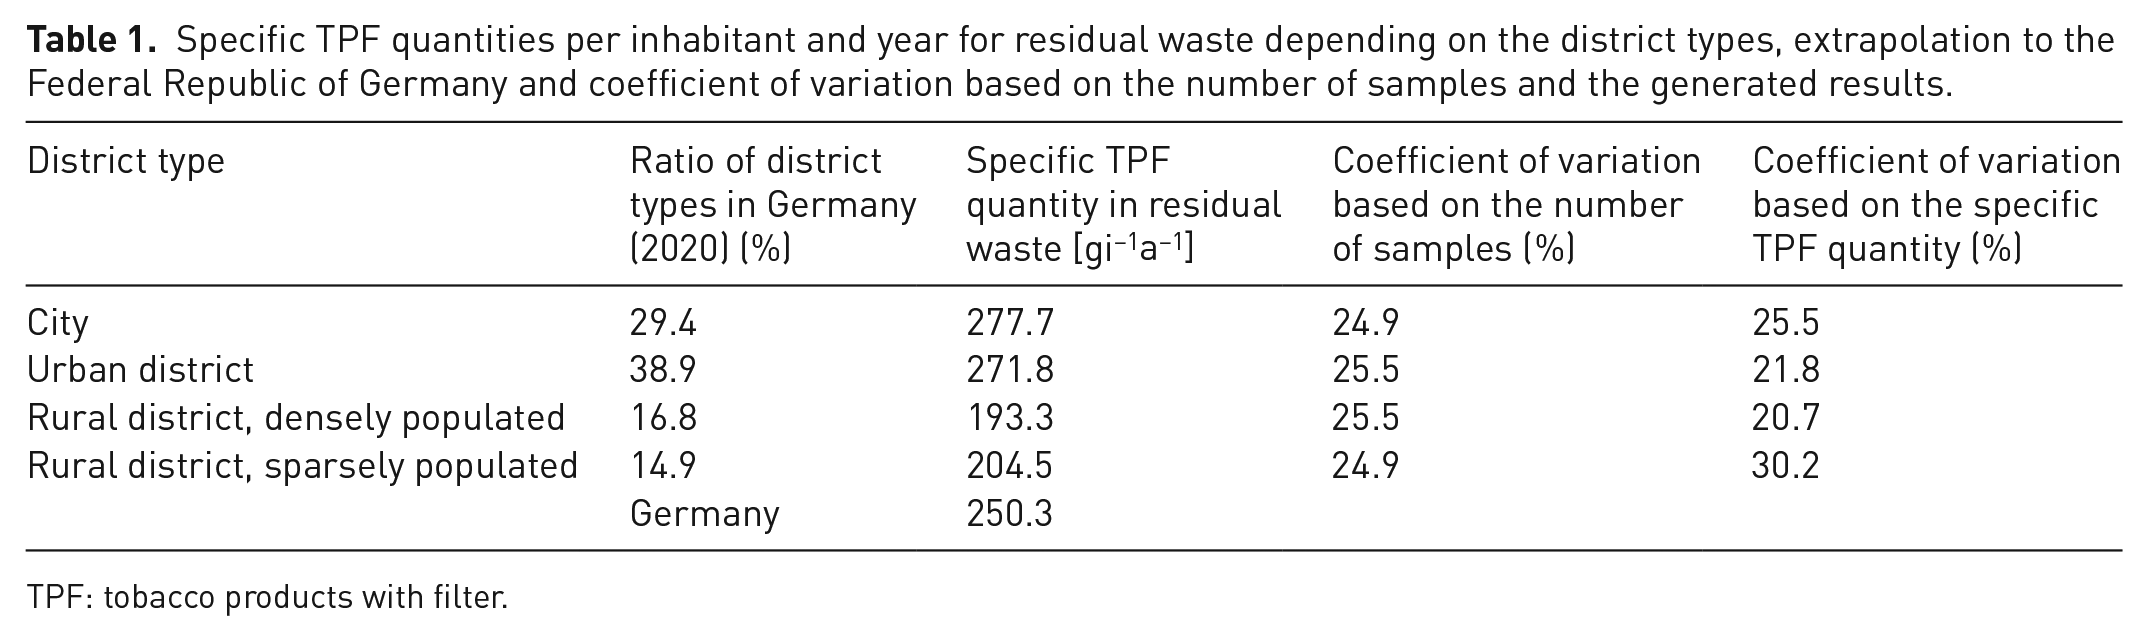
With the TPF quantity in each district type and the number of inhabitants per district, the average specific TPF quantity in the Federal Republic of Germany can be extrapolated. The results are shown in Table 1. The average specific TPF quantity in residual waste for Germany was 250.3 gi−1a−1.
Specific TPF quantities per inhabitant and year for residual waste depending on the district types, extrapolation to the Federal Republic of Germany and coefficient of variation based on the number of samples and the generated results.
TPF: tobacco products with filter.
The coefficient of variation based on the sample number and the determined specific TPF quantity are shown in Table 1. In the urban district and the densely populated rural district, the coefficients of variation calculated based on the TPF quantity were lower than those calculated based on the sample number. Hence, the results were valid. In Trier City, the resulting coefficient of variation was 0.6% higher than that based on the sample number. Due to this slight deviation, the results still achieved satisfactory significance. The resulting coefficient of variation in the sparsely populated rural district was approximately 5% higher than that calculated based on the number of samples. Therefore, the applicability of the results is limited due to the difference between the assumed and calculated coefficient of variation.
The results show that a representative sampling of TPF quantities in residual waste is possible. However, much effort is required to distinguish residual waste from different district types. Due to the high coefficient of variation for the sparsely populated rural district, a second sampling campaign is recommended to validate the TPF quantity in residual waste. Additionally, further sampling could show seasonal fluctuations. These fluctuations were not considered in the present study. In general, with further sampling and an increasing number of samples, the accuracy of the results increases. However, the economic cost associated with the accuracy level must be considered.
Since there is no comprehensive objective and representative database for TPF quantities in MSW, the results can be used to perform a plausibility check. For this purpose, the determined TPF quantities in residual waste can be compared to the TPF quantities in waste from public collection systems. In addition, the results represent a baseline load for TPF quantities in MSW from households. Comparable analysis should be conducted in future to quantify the effect of awareness-raising measures introduced by EPR under Directive (EU) 2019/904. Here, the output-based approach, which involves waste sampling, has a clear advantage over the input-based approach, which is based on the quantities put on the markets.
Waste from public collection systems
During the sampling campaign, street-cleaning waste and sinkhole residues experienced additional water losses. Before screening to 40 mm, the collected masses were unloaded, and water was drained via a wastewater collection system. Extreme water contents ranging from 50 to 60 wt% occurred because vehicles with water tanks are often used for street cleaning. Depending on the weather conditions, much water could accumulate in street-cleaning waste and, thus, in the samples. These influencing factors vary greatly, and thus the excess water in the sample also varies. To provide comparable data, the presented TPF mass shares and specific quantities were related to the sample masses after static drainage.
The <40 mm proportion of the waste from public collection systems is shown in Figure 4(a). The sinkhole residues from the city centre were not sieved because of the small overall collected quantity. Due to a determined mass share rate of 7 wt% for the > 20 mm fraction, a similar particle-size distribution could be assumed relative to sinkhole residues from the other settlement structures. Figure 4(a) shows that the sorting effort for waste from public waste receptacles could be reduced by sieving to 40 mm. Regarding street-cleaning waste and sinkhole residues, sieving mainly generated a loosening effect.
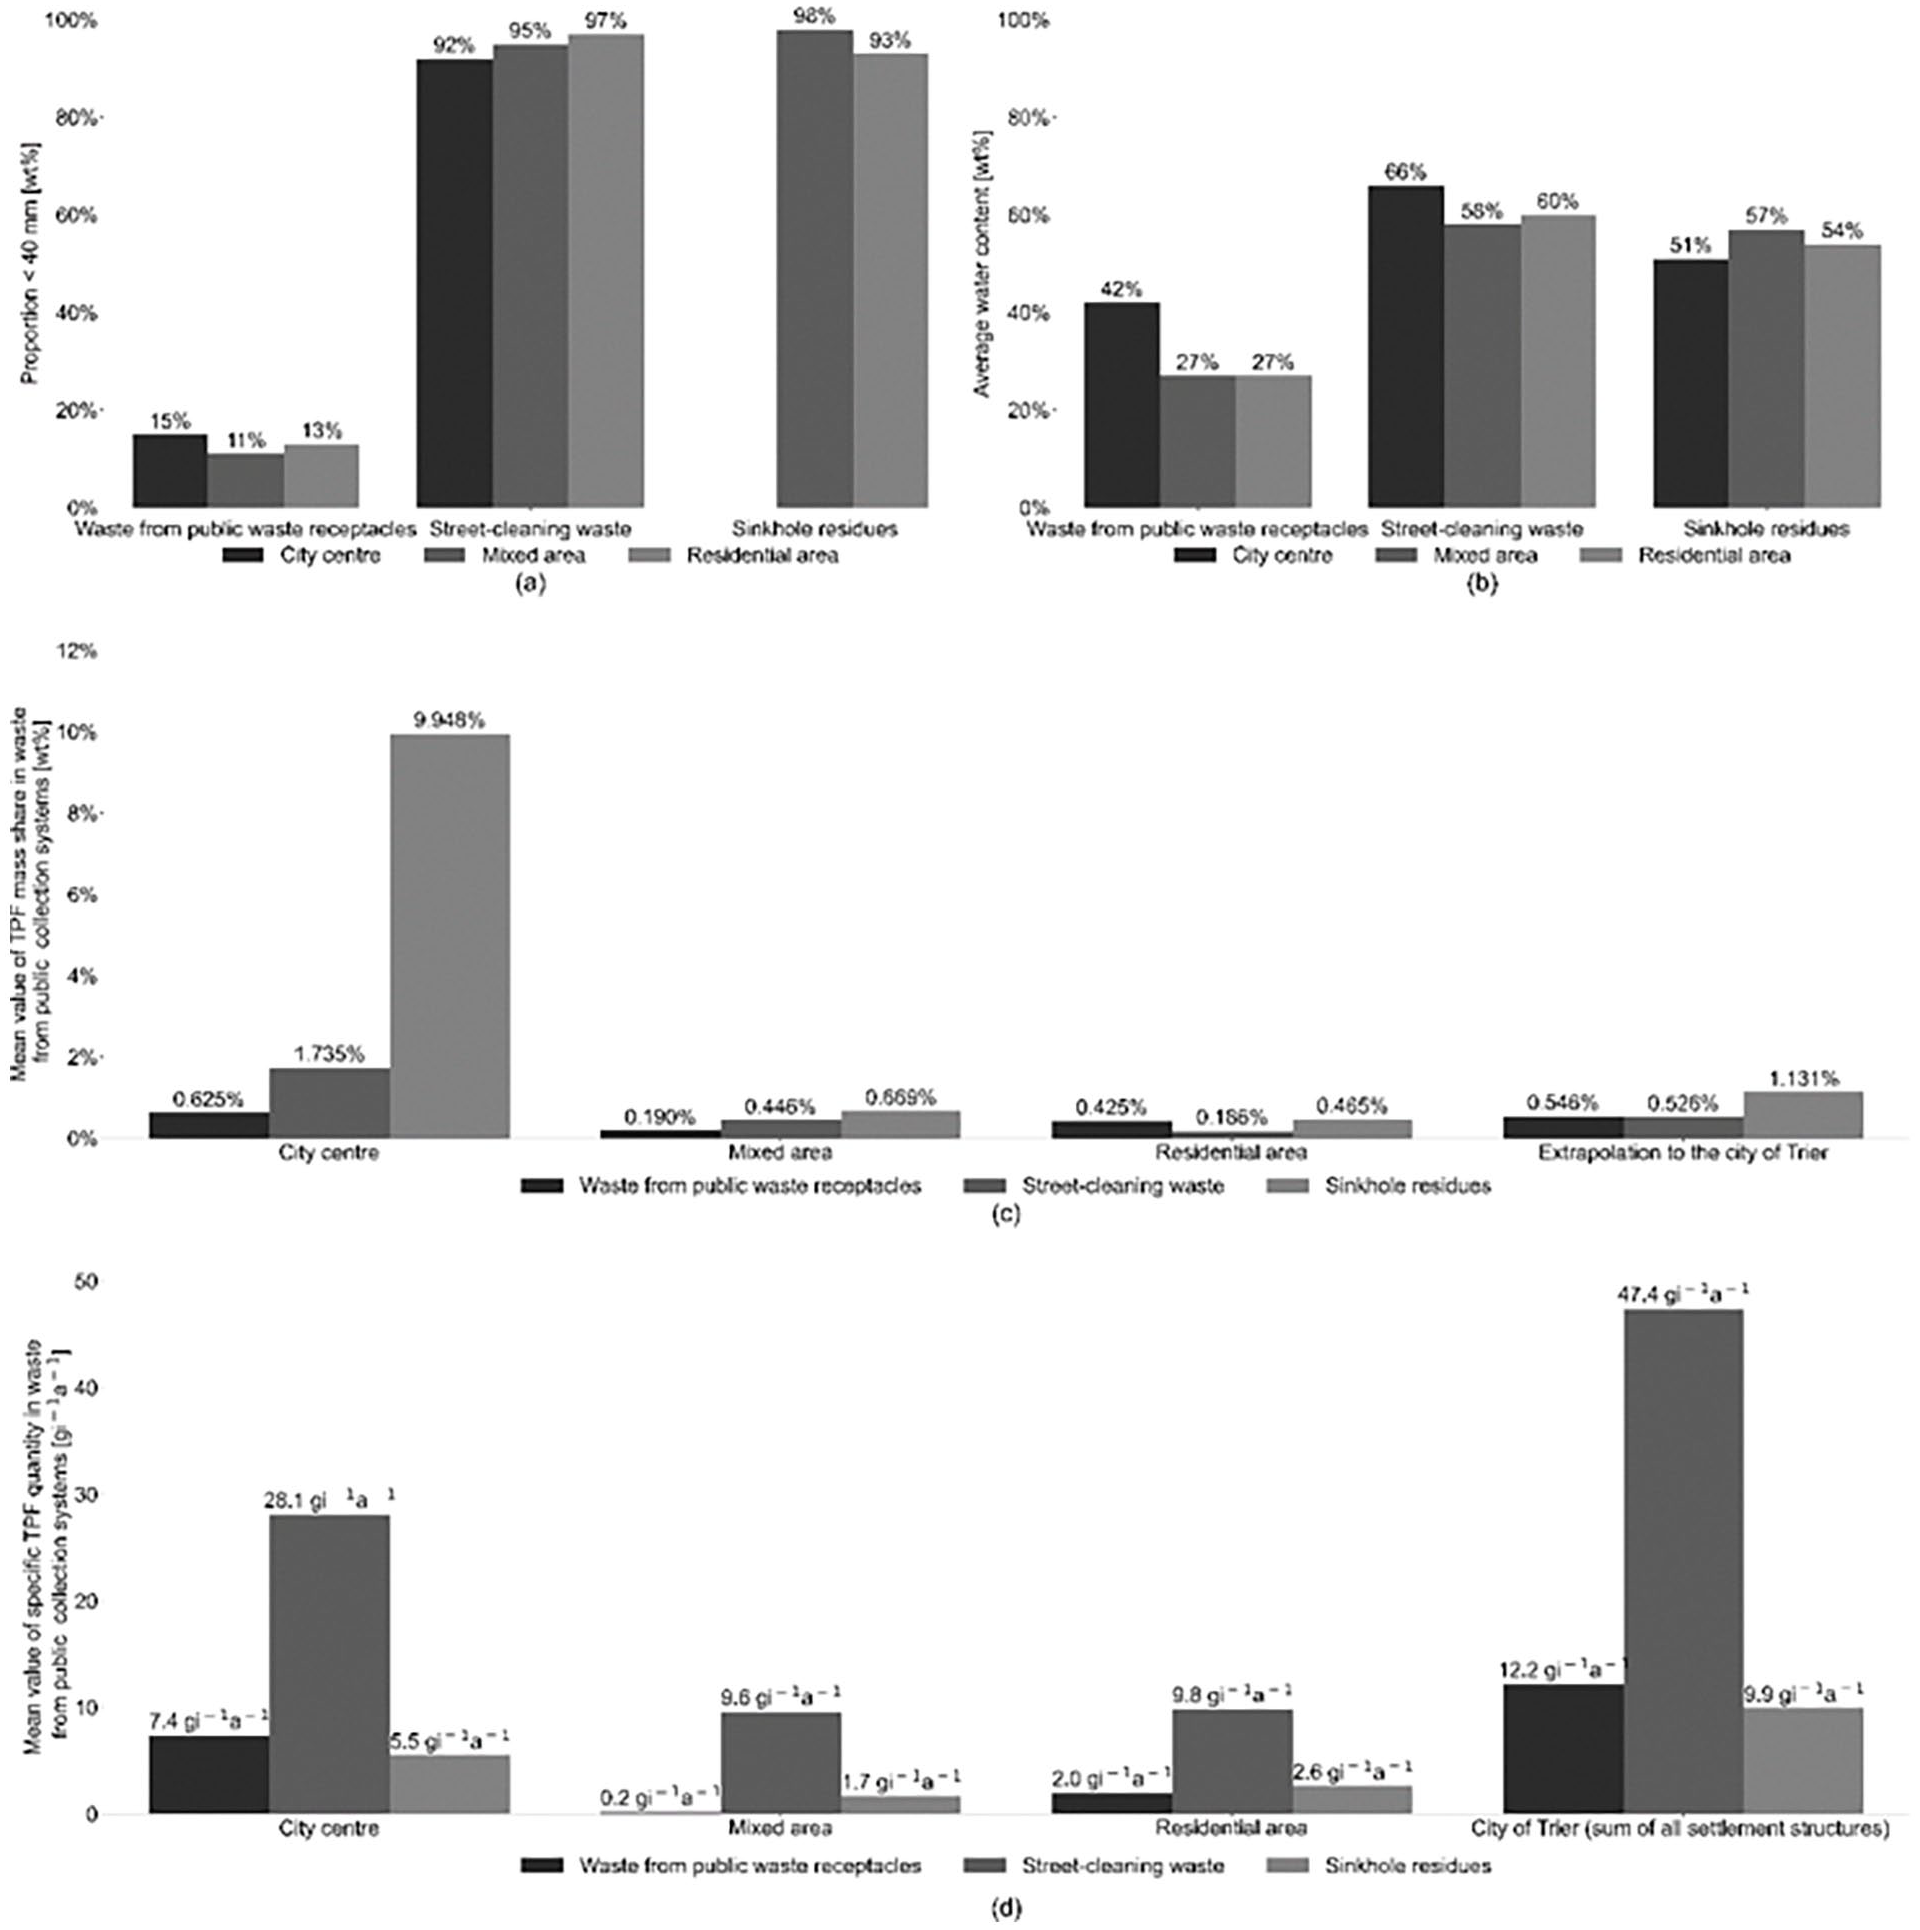
Sampling campaign results for waste from public collection systems in Trier City by settlement structures with (a) particle-size distribution (<40 mm), (b) water content after static drainage, (c) average TPF mass shares and extrapolation to the city of Trier and (d) average specific TPF quantities and extrapolation to the city of Trier.
The average water contents of the samples from public collection systems after static drainage are shown in Figure 4(b). The street-cleaning waste samples contained the highest water content, and the public waste receptacle samples contained the lowest water content.
Based on the >40 mm proportion (shown in Figure 4(a)) and the water content (shown in Figure 4(b)), the average TPF mass shares were calculated. The resulting average TPF mass shares are shown in Figure 4(c). TPF separately collected from ashtrays were included in the calculation for the waste from public waste receptacles. Extrapolated mean values were calculated for the city of Trier by weighting the annual waste quantity generated for each settlement structure. In addition, since the TPF quantity depends on the collected mass per waste stream, the specific waste quantity was considered. Notably, 2.23, 9.02 and 0.87 kgi−1a−1 of waste from public waste receptacles, street-cleaning waste and sinkhole residues, respectively, were generated.
Specific TPF quantities for each waste stream and settlement structure are shown in Figure 4(d). The TPF quantity was calculated according to equation (4). The specific TPF quantities for each settlement structure can be interpreted as a reflection of the proportion of all inhabitants of Trier City. The specific TPF quantities per settlement structure can be summed to calculate the total quantity per inhabitant and year for each waste stream in Trier City. Regarding street-cleaning waste and sinkhole residues, the three settlement structures shown in Figure 4(d) represent the total specific quantity of discarded TPF per year in public collection systems. Regarding waste from public waste receptacles, 52 tonnes year−1 were collected near a cycling path. Regarding the waste stemming from the cycling path, the weighed mean TPF mass share of waste from waste receptacles across the three settlement structures (compare Figure 4(c)) was obtained. Thus, the mean specific TPF quantity for waste from public waste receptacles in Trier City was calculated.
Among all waste streams, the highest specific TPF quantity was found at the city centre, and the lowest specific TPF quantity was found in the mixed area. Among all settlement structures, the highest specific TPF quantity was determined in street-cleaning waste. Compared to the results of Hietler et al. (2017), which determined 0.4 wt% TPF in littered waste from Salzburg, the TPF mass share in street-cleaning waste is approximately 0.5 wt% slightly higher, but in a similar range. Compared to the average determined TPF quantity in residual waste of 250.3 gi−1a−1, the resulting total TPF quantity for a city of 69.5 gi−1a−1 seems plausible. The results show that about one-fifth of the TPF quantities identified were discarded in waste from public collection systems. Although a TPF mass share of almost 10 wt% was detected in city centre sinkhole residues, only a specific quantity of 5.5 gi−1a−1 was determined for this disposal route because of the low collected mass per year. More than half of the specific TPF quantity in waste from public collection systems was discarded at the city centre.
The coefficient of variation based on the sample number according to equation (1) and the resulting coefficient of variation based on the distribution of the determined specific TPF quantity are listed in Table 2. The comparison showed that larger sample numbers should have been obtained for nearly all waste streams and settlement structures. A sufficiently large number of samples were collected for sinkhole residues at the city centre, but in this case, the entire collected quantity was analysed. Overall, the waste from public collection systems showed significant heterogeneity depending on the settlement structure and waste stream. Representative sampling must be performed over more than one sampling campaign per waste stream. Again, a trade-off should be achieved between the data accuracy required and the economic effort.
Coefficient of variation based on the sample number and the generated results for waste from public collection systems by settlement structure.
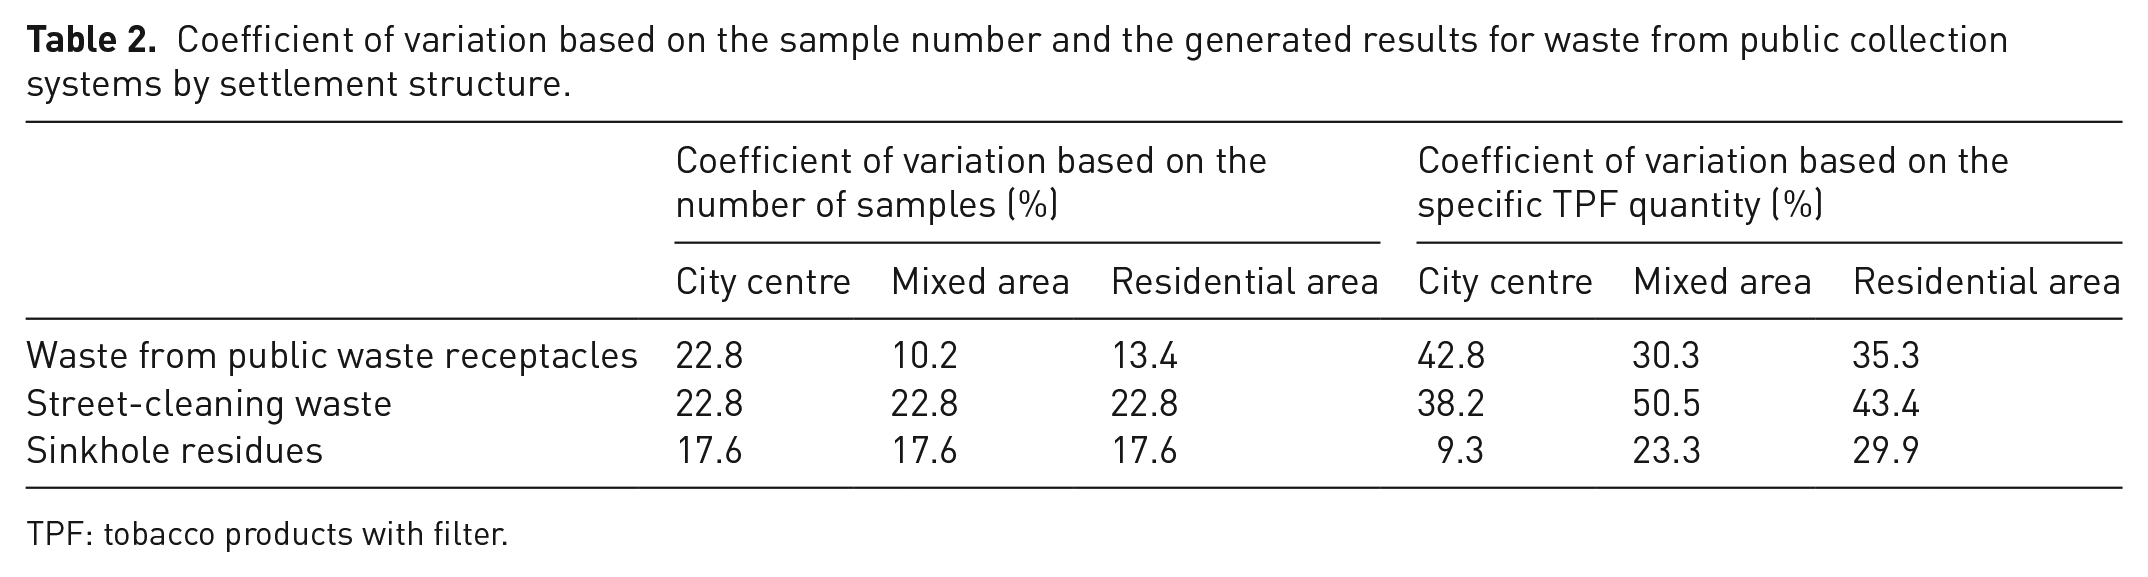
TPF: tobacco products with filter.
The results refer to the city of Trier, a large German city with over 100,000 inhabitants. Further sampling considering smaller city types and rural areas is recommended. Notably, the determined specific TPF quantities cannot directly be transferred to inhabitants from smaller settlement structures. However, for smaller city types and rural areas, there must be a control regarding to what extent public cleaning systems exist and how much of the cleaning tasks are transferred to property owners. In addition, further sampling could address geographical differences within Germany.
In conclusion, the results for waste from public collection systems provide a basis for an output-based cost calculation according to Directive (EU) 2019/904. However, the collected quantities of waste from public collection systems should be validated with waste quantities from other cities. Consideration should be given to whether a distinction can be made according to the type of waste from public collection systems. In the next step, a survey of the cost rates for the respective public collection systems within Germany is necessary to develop a cost model. For this purpose, data on the respective administrations and waste management companies must be collected.
Comparison of TPF between the different MSW streams
Discharged TPF occur in different qualities and shapes depending on the disposal environment. To comprehensively characterise TPF from the different waste streams, TPF were weighed and counted for each sample. Thus, the mean TPF weight per sample was calculated. Figure 5(a) shows the distribution of the average TPF weight per sample for the sampled waste streams. The TPF mass mean value was 387, 490, 472 and 381 mg for residual waste, public waste receptacles, street-cleaning waste and sinkhole residues, respectively. The different TPF weights resulted from the individual water content in each waste stream and the different types of mechanical stresses exerted onto TPF. In the case of contact with humidity and the application of biological degradation processes, the paper component of TPF can be lost. The loss of TPF paper could reduce the weight. In addition, mechanical stress could influence the variability of the weight per TPF unit. Mechanical stress can be applied, for example, through street-cleaning machines. Moreover, different types of TPF exist, whereas the filters of rolled cigarettes are usually smaller and lighter. The influence of the particular waste stream on the TPF appearance is shown in Figure 5(b). The results show that the weight of a produced TPF cannot directly be assumed to be the same weight as a discarded TPF in different waste streams. TPF weights even within one waste stream have high fluctuation ranges. An average weight should therefore be determined over as many data points as possible.
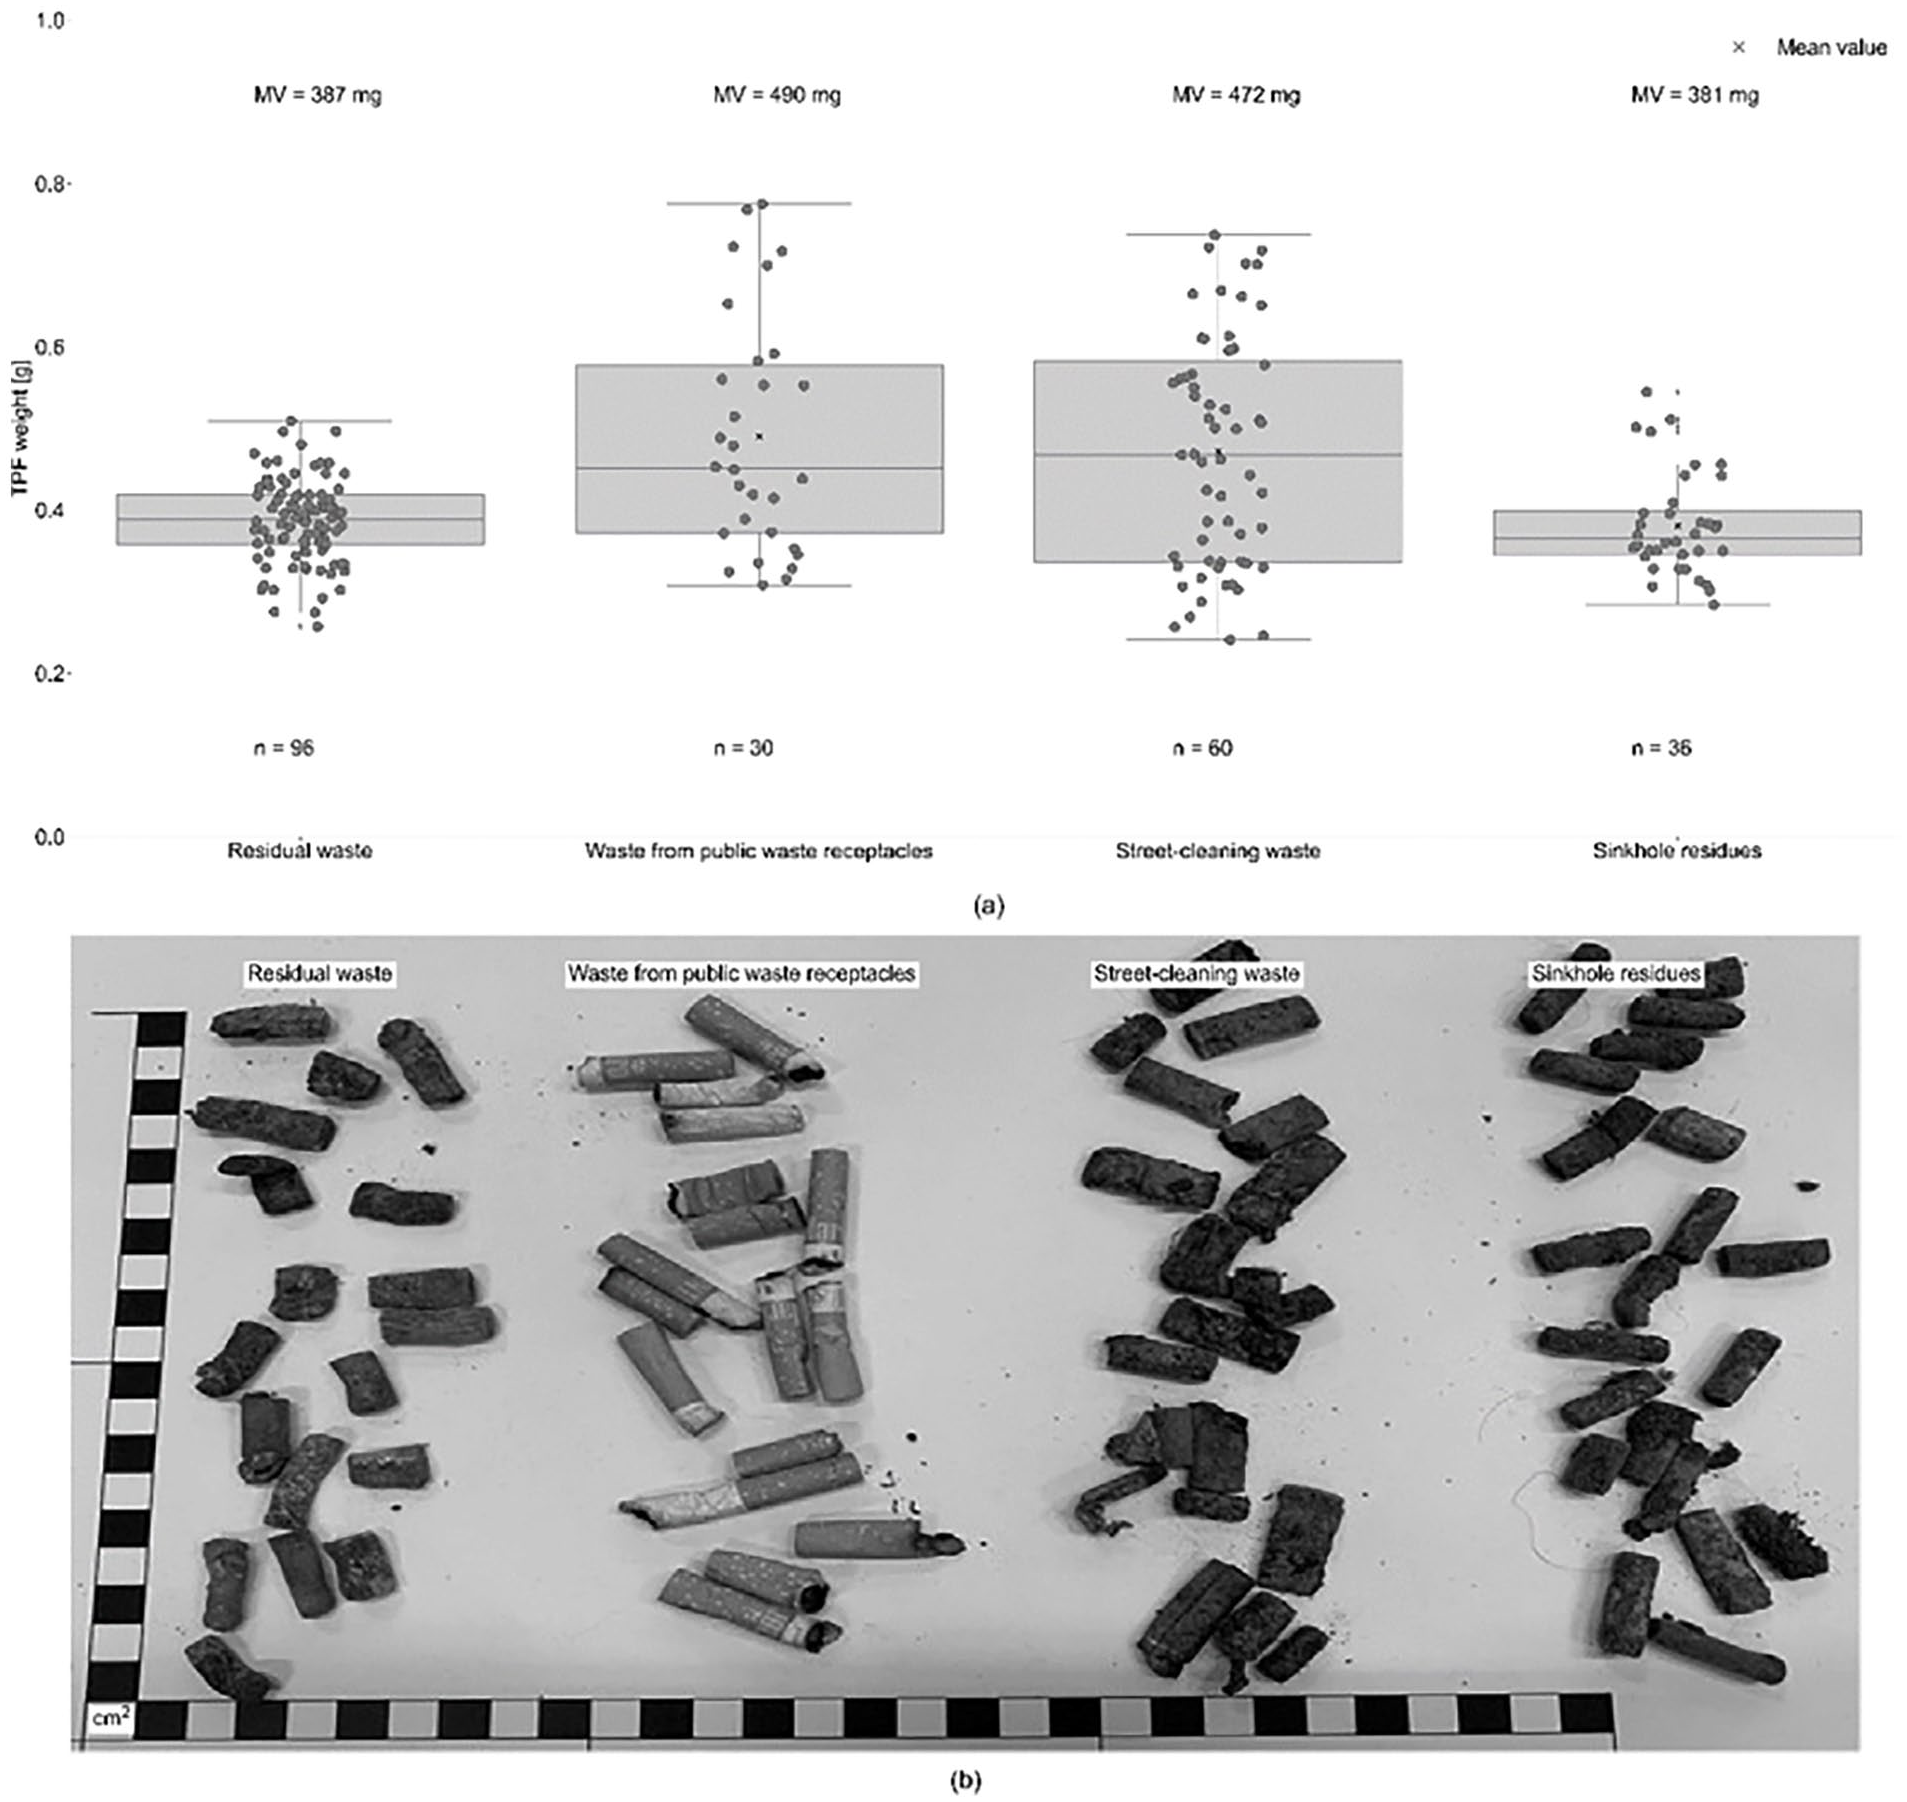
Comparison of TPF from residual waste and waste from public collection systems by (a) weight distribution and MV of the average TPF weight per sample (boxplot with boxes from the lower to the upper quartile and whiskers with a maximum of 1.5 times the interquartile range), and (b) photo of TPF from the sampled waste streams.
Conclusion
According to the EPR introduced by Directive (EU) 2019/904, producers of TPF must bear the costs of discarded TPF in public collection systems. For an appropriate output-based cost model, the TPF quantity in relevant waste streams must be determined. The TPF sampling and analytical methods applied were based on a theoretical approach (RQ1). It was shown that the specific TPF quantities in residual waste tended to increase with increasing degree of urbanization. Specific TPF quantities in residual waste of 277.7, 271.8, 193.3 and 204.5 gi−1a−1 were determined for the selected city district, urban district, densely populated rural district and sparsely populated rural district, respectively. Extrapolating the results to the Federal Republic of Germany yielded a specific TPF quantity in residual waste of 250.3 gi−1a−1 (RQ2). Regarding waste from public collection systems, the highest specific TPF quantity was found in waste from the city centre. The calculated specific TPF quantities in waste from public waste receptacles, street-cleaning waste and sinkhole residues were 12.2, 47.4 and 9.9 gi−1a−1, respectively (RQ3). The analyses show that TPF weights depend on the waste stream to which they are exposed. (RQ4). The results can contribute to improving the current database on TPF quantities in MSW.
In summary, determining TPF quantities in MSW requires high sampling and analysis effort, especially for waste from public collection systems. To achieve statistically representative results, a large sample number is necessary. Therefore, more than one sampling campaign should be conducted to determine the costs resulting from the disposal of TPF in public collection systems. However, the results show that determining an output-based cost model is possible with presentable effort. In addition, continued sampling in the future can help to evaluate the success of the awareness-raising measures. This represents an advantage of the output-based cost model. To calculate the resulting costs based on Directive (EU) 2019/904, the determined TPF quantities must be combined with the total costs of public waste collection systems. For this purpose, statistically representative costs of public collection systems must be determined. A distinction should be made between different city sizes since property owners are partly responsible for street cleaning in smaller cities. Moreover, data collection of the costs for public collection systems should consider geographical differences within Germany. Directive (EU) 2019/904 aims to reduce TPF littering by charging for public collection systems. Therefore, in addition to assisting with cost calculations, the results can help to verify the success of the measures and thus contribute to TPF litter reduction in Germany.
Supplemental Material
sj-docx-1-wmr-10.1177_0734242X231200091 – Supplemental material for Methodology to quantify single-use plastic products in municipal solid waste Part 2: Quantification of tobacco products with filters in Germany
Supplemental material, sj-docx-1-wmr-10.1177_0734242X231200091 for Methodology to quantify single-use plastic products in municipal solid waste Part 2: Quantification of tobacco products with filters in Germany by Alena Maria Spies, Jonathan Geldmacher, Cristina García López, Thomas Pretz and Karoline Raulf in Waste Management & Research
Footnotes
Declaration of conflicting interests
The authors declared the following potential conflicts of interest with respect to the research, authorship, and/or publication of this article: This publication was prepared using data from contract research. pbo was commissioned to carry out an open-ended and objective scientific study on the subject of ‘Tobacco filters in municipal waste’ based on the guidelines of scientific practice. The contract research was commissioned by the Association of the Tobacco Industry and Novelty Products (Bundesverband der Tabakwirtschaft und neuartiger Erzeugnisse (BVTE)), the German Cigarette Association (Deutscher Zigarettenverband (DZV)), Philip Morris GmbH (PMG), the Association of the Cigarette Paper Processing Industry (Verband der Zigarettenpapier verarbeitenden Industrie (VZI)) and the Association of the Cigar Industry (Bundesverband der Zigarrenindustrie (BdZ)) to the Institute for Tobacco Research (Institut für Tabakforschung GmbH (IfT)) as project sponsor. In this context, pbo was commissioned by the Institute for Tobacco Research (Institut für Tabakforschung GmbH (IfT)). The Chair of Anthropogenic Material Cycles (ANTS) was commissioned via a subcontract from PBO.
Funding
The authors received no financial support for the research, authorship, and/or publication of this article.
Supplemental material
Supplemental material for this article is available online.