
Abstract
Despite the government’s policies and objectives, Malaysia lags behind in sustainable waste management techniques, particularly recycling. Bins should be located conveniently to encourage recycling and reduce waste. The current model of bin location-allocation is mostly determined by distance. However, it has been identified that previous studies excluded an important factor: litter pattern identification. Litter pattern is important to identify waste generation hotspots and litter distribution. Thus, we proposed the within cluster pattern identification (WCPI) approach to optimize the recycle point distribution. WCPI gathers the information on litter distribution using geotagged images and analyses the pattern distribution. The optimal location for recycle bin can be identified by incorporating k-means clustering to the pattern distribution. Since k-means faces the non-deterministic polynomial-time-hard challenge of selecting the ideal cluster and cluster centre, WCPI used the total within-cluster sum of square on top of k-means clustering. The proposed location by WCPI is validated in terms of accessibility and suitability. Furthermore, this study provides further analysis of carbon footprint that can be reduced by simulating the data from geotagged images. The results show that 10,323.55 kg of carbon emission can be reduced if the litter is sent for recycling. Thus, we believe that locating bins at an optimal location will embark on consumer motivation to dispose of recycled waste, reduce litter and lessen the carbon footprint. At the same time, these efforts could transform Malaysia into a clean and sustainable nation that aims to achieve Agenda 2030.
Introduction
Agenda 2030 increases the resolve to pursue the journey of sustainable development more aggressively. Thus, Malaysia has aligned sustainable development goals (SDGs) principles with the 11th Malaysia Plan (2016–2020) and 12th Malaysia Plan (2021–2025), which will entrench SDGs in all facets of Malaysia’s development. It is mentioned in the SDG indicator of 12.5.1 that by 2030, substantially reduce waste generation through prevention, reduction, recycling and reuse (United Nations, 2020).
Sustainable consumption and production (SCP) were introduced into the 11th Malaysia Plan as a critical approach to achieving green growth and addressing environmental sustainability. One of the keys to achieving SCP is by increasing the recycling rate for solid waste. It was aimed that by 2020, the recycling rate is rise to 22% from 17.5% in 2016. A recent press release by the Department of Statistics Malaysia (2020) shows that Malaysia’s recycling rate in 2019 has exceeded the set target of 28.1%. However, practicing solid waste recycling in developing countries like Malaysia is still challenging compared to developed countries. Developed countries have achieved a high rate of above 50% of waste recycling. As Malaysia prepares to project itself as a developed nation, it is important to narrow the gaps and enhance the waste management situation in Malaysia to be on par with other developed countries.
Rampant litter has long been a problem globally, especially in developing countries. Heaps of trashes dumped on streets are not only unsightly, and they are dangerous too, posing health hazards to people and threats to the environment. In Malaysia, it is common to have empty water bottles, cans, plastic bags, cigarette butts and other rubbish strewn on the roadside and in public spaces. Numerous efforts and policies are implemented to prevent litter in public settings. For example, implementation of certain fines and consents, cleaning campaigns and public awareness (Cao et al., 2016), designing and locating of smart bins with sensors in city centres (Nagalingeswari and Satamraju, 2017) and promotion of antilitter campaigns (Hughes et al., 2019). However, the effectiveness of such measures can vary from one place to another.
Over the years, the litter problem has only gotten worse even though public littering is prohibited by Malaysian law and act. Malaysia is categorized as one of the most successful developing countries in Southeast Asia in terms of economic growth and development. This contributes to the factors of population migration to the urban areas. Due to this migration, Malaysia has to experience a huge transition, and it has become a challenging task to handle solid waste management. The government has introduced a policy and legislation for solid waste management. The policies are the Enactment of Solid Waste Management and Public Cleansing Act (Act 672) and Solid Waste and Public Cleansing Management Corporation (Act 673). National Solid Waste Management Policy is one of the listed plans to support SDG Keys No. 11: Make cities and human settlements inclusive, safe, resilient and sustainable (Economic Planning Unit, Malaysia, 2017). Another national plan is the Solid Waste and Public Cleansing Management Corporation Strategic Plan, 2014–2020, to support Goal 12: Ensure SCP patterns through Responsible Consumption and Production. However, the policy implementation on solid waste management looks delicate and doubtful. Landfilling is still the main solid waste disposal approach, and the recycling rate among Malaysian is low and still left behind compared to the neighbouring countries. According to the Government Activist Circular, an organization specializing in packaging and food waste research, Malaysia’s polyethylene terephthalate (PET) bottle recycling rate is very low. Only 16% of PET bottles in Malaysia are collected for recycling purposes (Chung, 2019; Jereme et al., 2014). The report also added in 2018 that about 660,000 t of PET bottles were dumped at landfills or leaked into the environment.
There are several unresolved problems related to recycling management in Malaysia. Developing countries, such as Malaysia deal with improper collection services, such as low collection coverage and irregular collection services. This has led to difficulties in tracking back the recycling rate. Another factor contributing to the low recycling rate is the unavailability of recycling facilities. According to Tiew et al. (2019), the lack of easy access to recycling facilities, such as recycle bins, recycle centres and reverse vending machine is an obstacle to the Malaysian community to practice recycling. Studies have found that recycling is time-consuming and may determine the intensity of recycling activities (Ho, 2018; Kattoua et al., 2019; Matsumoto, 2018). To overcome this issue, several researchers suggested providing convenient facilities and infrastructure to impact people’s motivation and behaviour towards recycling (Bahçelioğlu et al., 2020; Conke, 2018; Munguía-López et al., 2020; Stoeva and Alriksson, 2017; Xiao et al., 2018).
Several studies suggested that bins should be located strategically to reduce litter and promote recycling (El-Hallaq and Mosabeh, 2019; Letelier et al., 2021; Rathore et al., 2019). This approach manipulates the appearance of recycling bins in common areas to attract consumers to dispose of recycling waste. The location of bins is important to consumers. It should be easily accessed where there is a higher generation of waste because it affects the consumer’s recycling behaviour (Geertman and van Gent, 2018). More travel may be required if bins are not strategically located or more bins are required for the densely populated area (Miller et al., 2016).
Location is often considered one of the most important factors leading to the success of many systems. Ebrahimi et al. (2017) has performed a location-allocation analysis to provide a potential solution to find the optimal locations for the bin. Their study subdivided the weight of waste demand for each building entrance. Meanwhile, the weight of waste allocated to waste bins was identified. Then, the portion demand for each entrance is calculated and mapped based on its location. The analysis determined the potential areas for placing additional recycling and trash bins and resolved the lack of bin coverage.
Another study by Boskovic and Jovicic (2015) and Boskovic et al. (2016) proposed a model based on the total amount of waste generated per week for residential and commercial activities. The total generated waste had a significant influence on the optimal collection point. The author claims that significant savings can be achieved by adopting the proposed model. In the actual case study, the number of collection points may be reduced by 24%, thus reducing the number of waste bins by more than 33% and it leads to the analysis of CO2 reduction where 4.5 t have been reduced.
A study by Rathore et al. (2019) considers different factors in their location-allocation model. The model considered several factors such as multiple types of sources, waste bins, waste types and safety and rag-picking. The study is aimed to provide efficient service to the entire targeted site. Data from an Indian municipality is used to demonstrate the effectiveness of the newly constructed model. Based on the test, the model could reduce the collection points up to 15% and reduce costs by about 25%. The overall results suggest that implementing the proposed model could reduce 25% of the carbon emission by the waste truck.
Meanwhile, Erfani et al. (2017) use the total amount of solid waste generated in each district in Mashhad, Iran, as one of the parameters or location-allocation models. The study also incorporates the number of population and vehicle routing problems for the collection point. It is mentioned in the study that, based on the results, significant improvements and savings were made through the proper application of the model. The total number of crew members was reduced from 24 in the current collection system to 14 in the improved system offered by the model (a reduction of 41.70%).
Selecting the appropriate site or location for recycle bin distribution is a complex problem. It requires an extensive evaluation process because it is challenging to develop a selection criterion that can precisely describe the preference of one location over another. Various models of bin location-allocation are developed using multiple parameters, such as walking distance and proximity to a normal waste bin. Studies conducted by Sheau-Ting et al. (2016) and Bergman (2017) concluded that the optimal distance to access the recycle bins is between 500 and 650 m. In addition, studies by Struk (2017), Digiacomo et al. (2018) and Leeabai et al. (2021) show that waste separation motivation is increased if the recycling bins are reached within walking distance. However, none of the current approaches incorporates pattern identification in their study. According to Wu et al. (2018) and Lu et al. (2020), spatial distribution patterns play an important role in various applications, such as population genetics, widespread contagious disease and many more.
Additionally, the spatial pattern was not addressed as a parameter or element in any model. The current model does not consider the actual location or the litter hotspot. In certain cases, when the visual analysis is insufficient, the spatial pattern can explain the quantification of spatial data (Scott, 2015). This is directly relevant to this research, as trash distribution must be quantified to make assumptions for subsequent analytical procedures. The spatial pattern has been widely applied in various research and application. Understanding a phenomenon’s distribution requires an understanding of its spatial pattern. For example, a recent study shows that analysis of spatial patterns identifies several factors of tourism development in the Yellow River Basin, China, such as location, terrain and cultural resources (Zhang et al., 2020). Also, the spatial pattern has been used to identify and analyse the spatial distribution of marine debris along the Thondi coast, Palk Bay, Southeast coast of India (Perumal et al., 2021). Another study also shows that spatial pattern is used to detect geographic factors related to the prevalence of COVID-19 infection (Jesri et al., 2021). The identification of spatial patterns is important since the spread of COVID-19 can affect public health. This proves that spatial pattern is important to assist our understanding of phenomena and their connection and correlation. In this study, the spatial pattern would provide insight into where litter occurs, how the litter distribution aligns with other features in that area and the potential connections and correlations. Due to this factor, it is believed that identifying litter patterns will add an advantage to the proposed algorithm for recycle bin location-allocation model. Bins that are strategically placed are believed to reach the target client and promote recycling behaviour effectively.
Another approach for location selection is by using the clustering-based location-allocation method. The clustering method will serve as the location-allocation method to determine the location of the bin and its coverage area. There is various clustering algorithm for machine learning. However, k-means can be considered the most popular clustering algorithm due to its simplicity, versatility and ease of implementation in various applications (Zhao et al., 2018). For example, Anagnostopoulos et al. (2015) adopted a k-means clustering algorithm to cluster the bins into a set of partial clusters. The algorithm aims to provide efficient solutions for waste collection problems by managing the trade-off between the immediate collection and cost.
Meanwhile, Vu and Kaddoum (2017) use a k-means clustering algorithm to make the working cluster of each garbage truck for the collection system. The system is used to monitor and predict each trash bin’s status daily. However, the authors claimed that k-means is a naive algorithm. The algorithm clusters the data into k clusters even though k is not the right number to be used. Therefore, users need to pre-determine the right number of clusters when using k-means clustering. Besides that, the k-means algorithm is facing a non-deterministic polynomial-time (NP) hard problem, which requires repetitive iteration and produces more than one cluster centre in the same group (Cohen-Addad et al., 2019; Friggstad et al., 2019). Thus, this research aims to provide a new approach to identifying the optimum location of recycling bins, specifically in Malaysia, by considering litter pattern identification. The combination of the k-means clustering algorithm and the total within-cluster sum of square (WSS) is applied in the WCPI approach to finding the optimal location. With the combination of litter pattern distribution, clustering and the total Within-Cluster-Sum-Square (WCSS), WCPI could identify the optimal location of recycle bin placement in the Iskandar Region, Malaysia.
Materials and methods
Three main areas are chosen as study areas: Kulai, Iskandar Puteri and Johor Bahru, Malaysia. These areas are chosen since it is located in Iskandar, Malaysia. Iskandar Malaysia is a visionary economic region in Johor that was established in 2006 as one of the catalyst development corridors to spur the growth of the Malaysian economy. The Low Carbon Society Blueprint for Iskandar Malaysia 2025 is a written document presenting comprehensive climate change mitigation (carbon emission reduction) and policies (low carbon society actions and subactions). The plan also described detail strategies (measures and programs) to guide the development of Iskandar Malaysia towards achieving its vision of a strong, sustainable metropolis of international standing by 2025.
In this study, three main approaches are used to identify the optimal recycle bin location. The approaches are spatial pattern, k-means data clustering and WCSS. The combination of these approaches is named within cluster pattern identification (WCPI). WCPI begins with geotag data collection. The process of WCPI is designed dedicatedly for waste management to identify optimal locations for recycling points or bin distribution. There are three phases involved in WCPI: Phase 1: Geotagging Litter Distribution, Phase 2: Litter Pattern Identification and Phase 3: Data Clustering. Figure 1 shows the whole process of WCPI. The WCPI technique is not only concerned with the location of litter but also considers the litter patterns. It is critical to understand the litter patterns in a given area (i.e. clustered, random or dispersed). As a result, the identified litter will be clustered according to the litter type, allowing for easy identification of data clustering before the litter bin’s location is determined. This way, recycling bins will be placed more systematically and accurately according to the type of litter found in a given area.
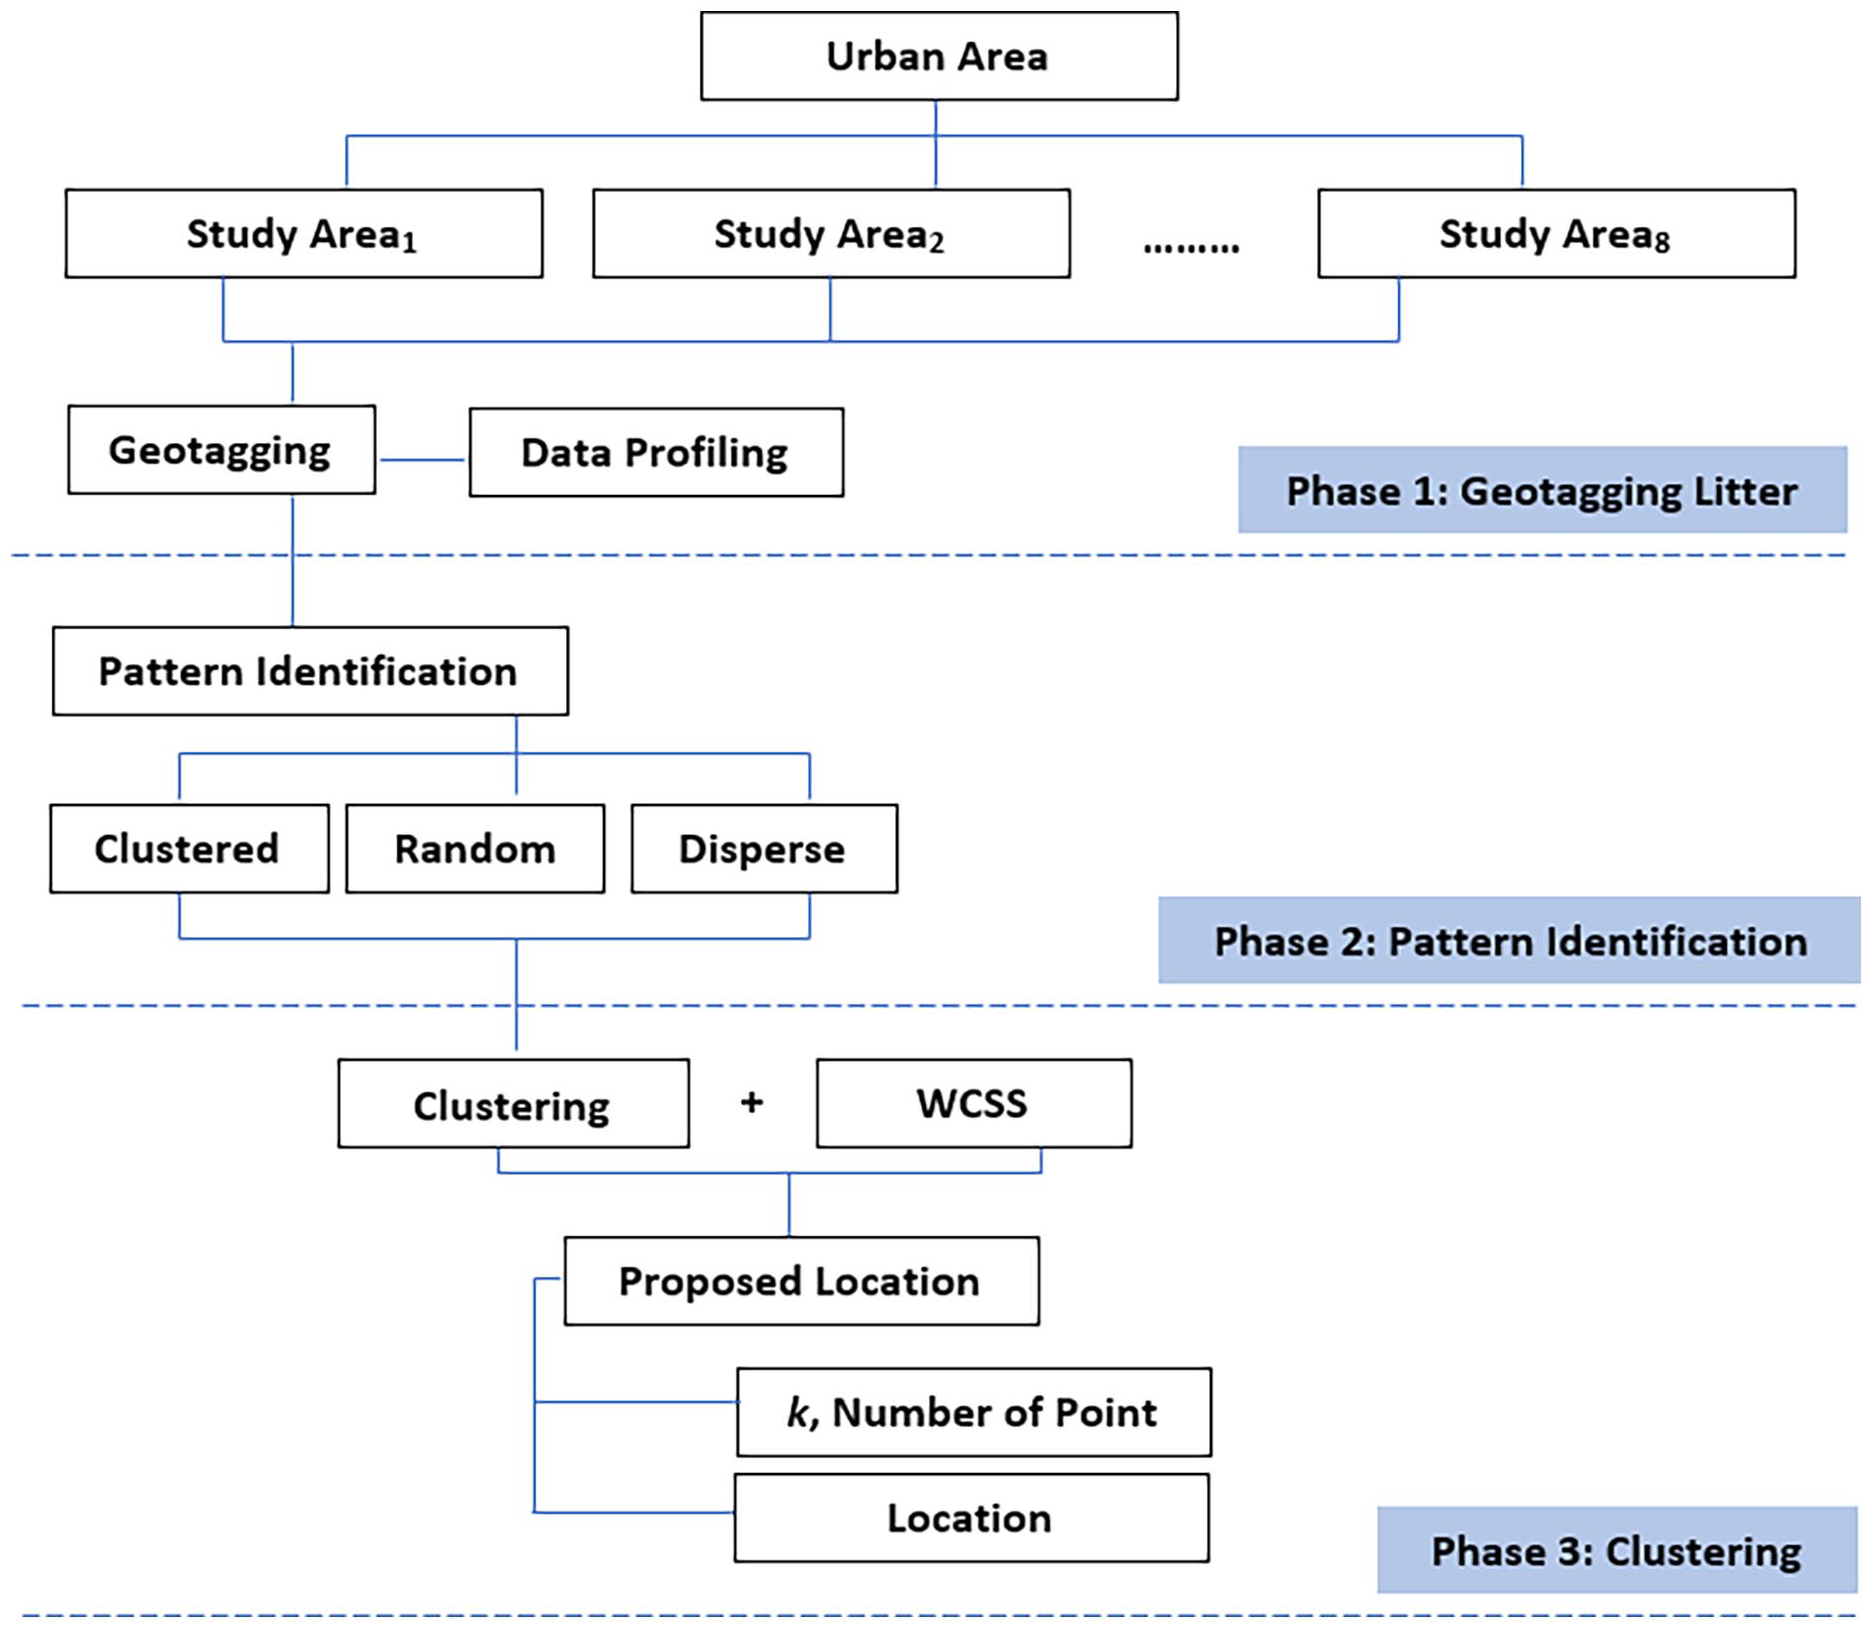
Within cluster pattern identification process.
In this study, the methodology begins with geotagging the litter using smartphones in eight study areas. Then the next phase is data analysis, and the last phase is data clustering. The litter distribution is gathered around the study areas for a certain district under the administration of Kulai, Iskandar Puteri and Johor Bahru, Malaysia. Data analysis is performed using the distribution of recycling points based on the litter clusters. Clustering is used to suggest the best location of the recycle bin based on the distribution of litter and the analysis of the litter pattern in each spatial distribution of the neighbourhood. Details for each phase are explained in the following section.
Phase 1: Geotagging litter distribution and data profiling
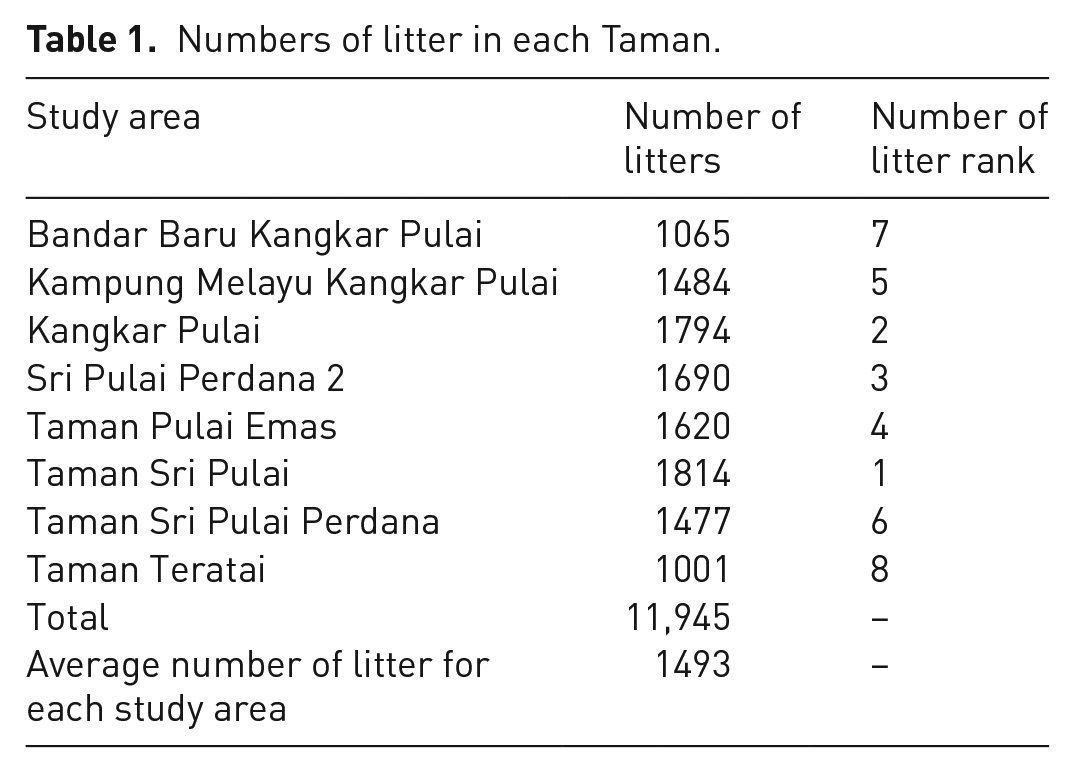
Phase 1 started with the boundary identification for eight study areas in Johor Bharu, Malaysia is identified. The boundary areas are Bandar Baru Kangkar Pulai (BBKP), Kampung Melayu Kangkar Pulai (KMKP), Kangkar Pulai (KP), Sri Pulai Perdana 2, Taman Pulai Emas, Taman Sri Pulai (TSP), Taman Sri Pulai Perdana (TSPP) and Taman Teratai (TT). Based on the study area, each litter in the public space is captured using smartphones equipped with Assisted Global Positioning System (A-GPS). This process is known as geotagging. The combination of smartphone networks and a Global Positioning System antenna can determine and fix the phone’s location. Litter needs to be captured distinctly to acquire its location. The coordinate system used is the World Geodetic System 1984 (WGS84), with the latitude and longitude coordinates. Thus, each set of coordinates (latitude, longitude) captured represents the litter’s location. Figure 2 shows some images of litter found in the public spaces during the geotagged activity. Table 1 shows the number of litter images captured for each study area. Based on the table, the highest number of litter captured by the smartphone is 1814 for the TSP study area. The lowest number of litters is 1001 from the TT study area. The total number of litters for eight study areas is 11,945 and the average number of litters captured for each study area is 1493 litter.
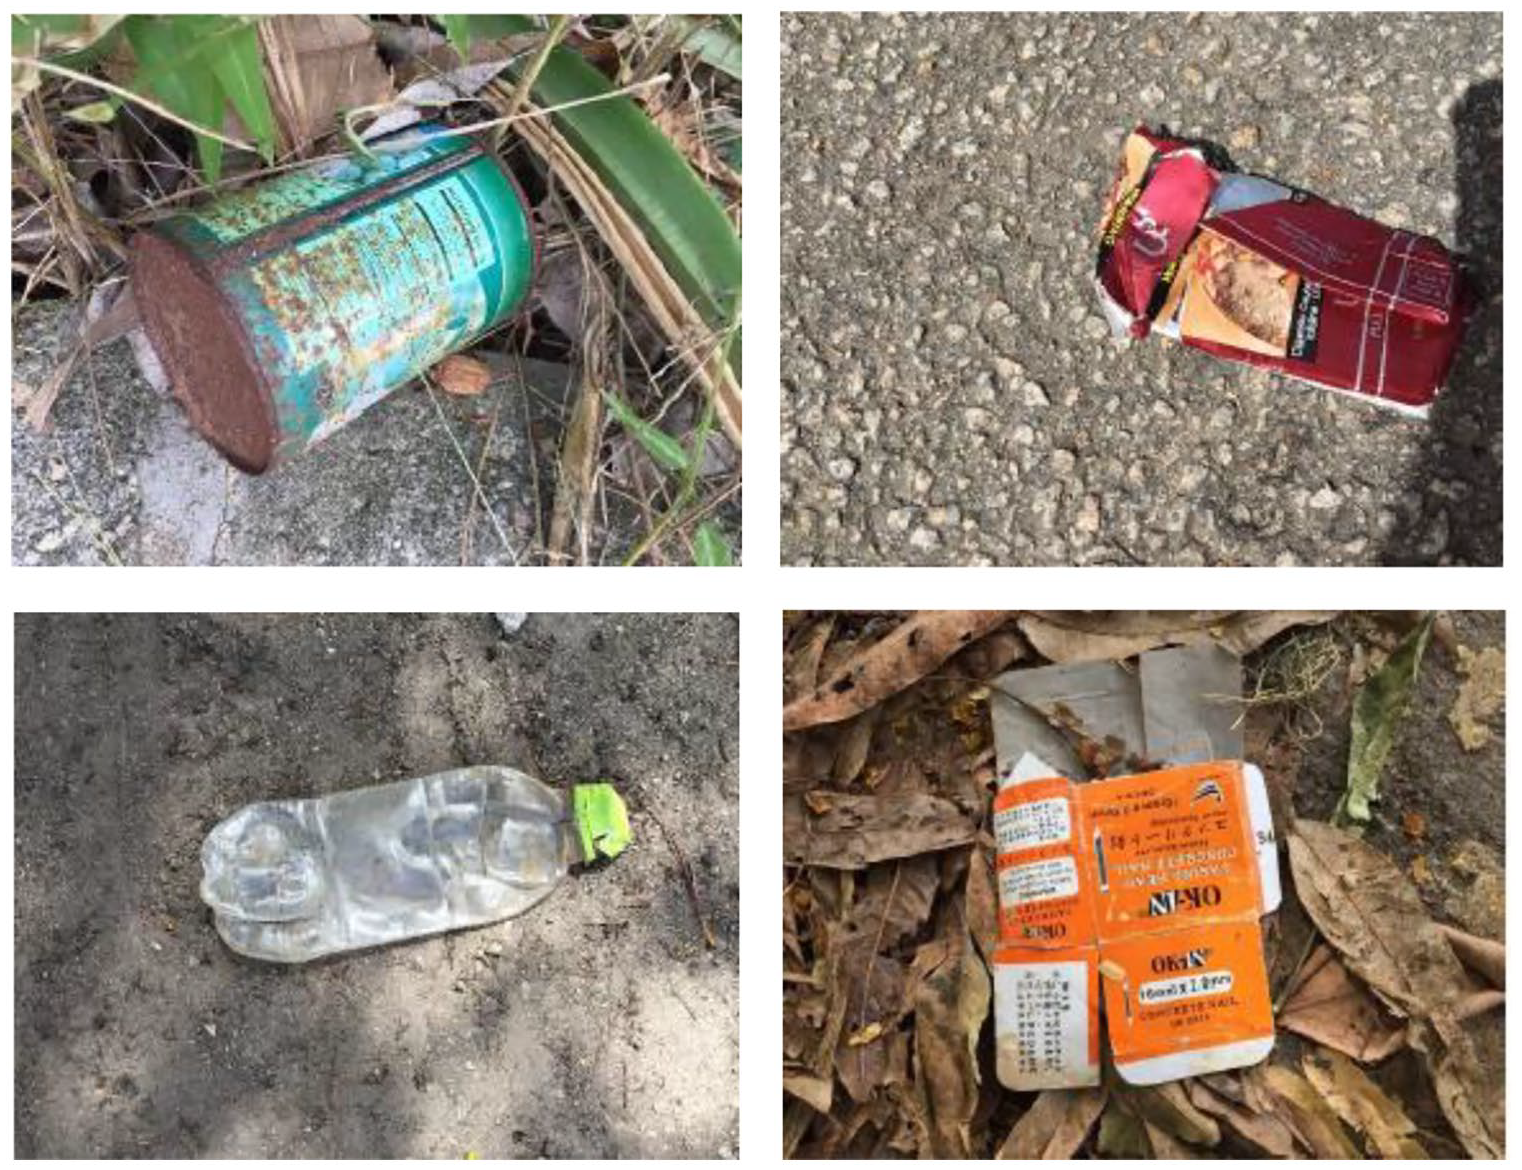
Litter in public spaces.
Numbers of litter in each Taman.
Location data of the geotagged image is extracted from the image’s exchangeable image file format metadata. Litters are mapped individually and represented as a points data set. Figure 3 shows the litter point distribution for eight study areas which are BBKP, KMKP, KP, Sri Pulai Perdana and Part of Kangkar Pulai (SPPKP), Taman Pulai Emas and Taman Pulai Jaya (TPETPJ), TSP, TSPP and TT. These points are mapped onto the OpenStreetMap layer. Points are grouped based on study areas with different colours.
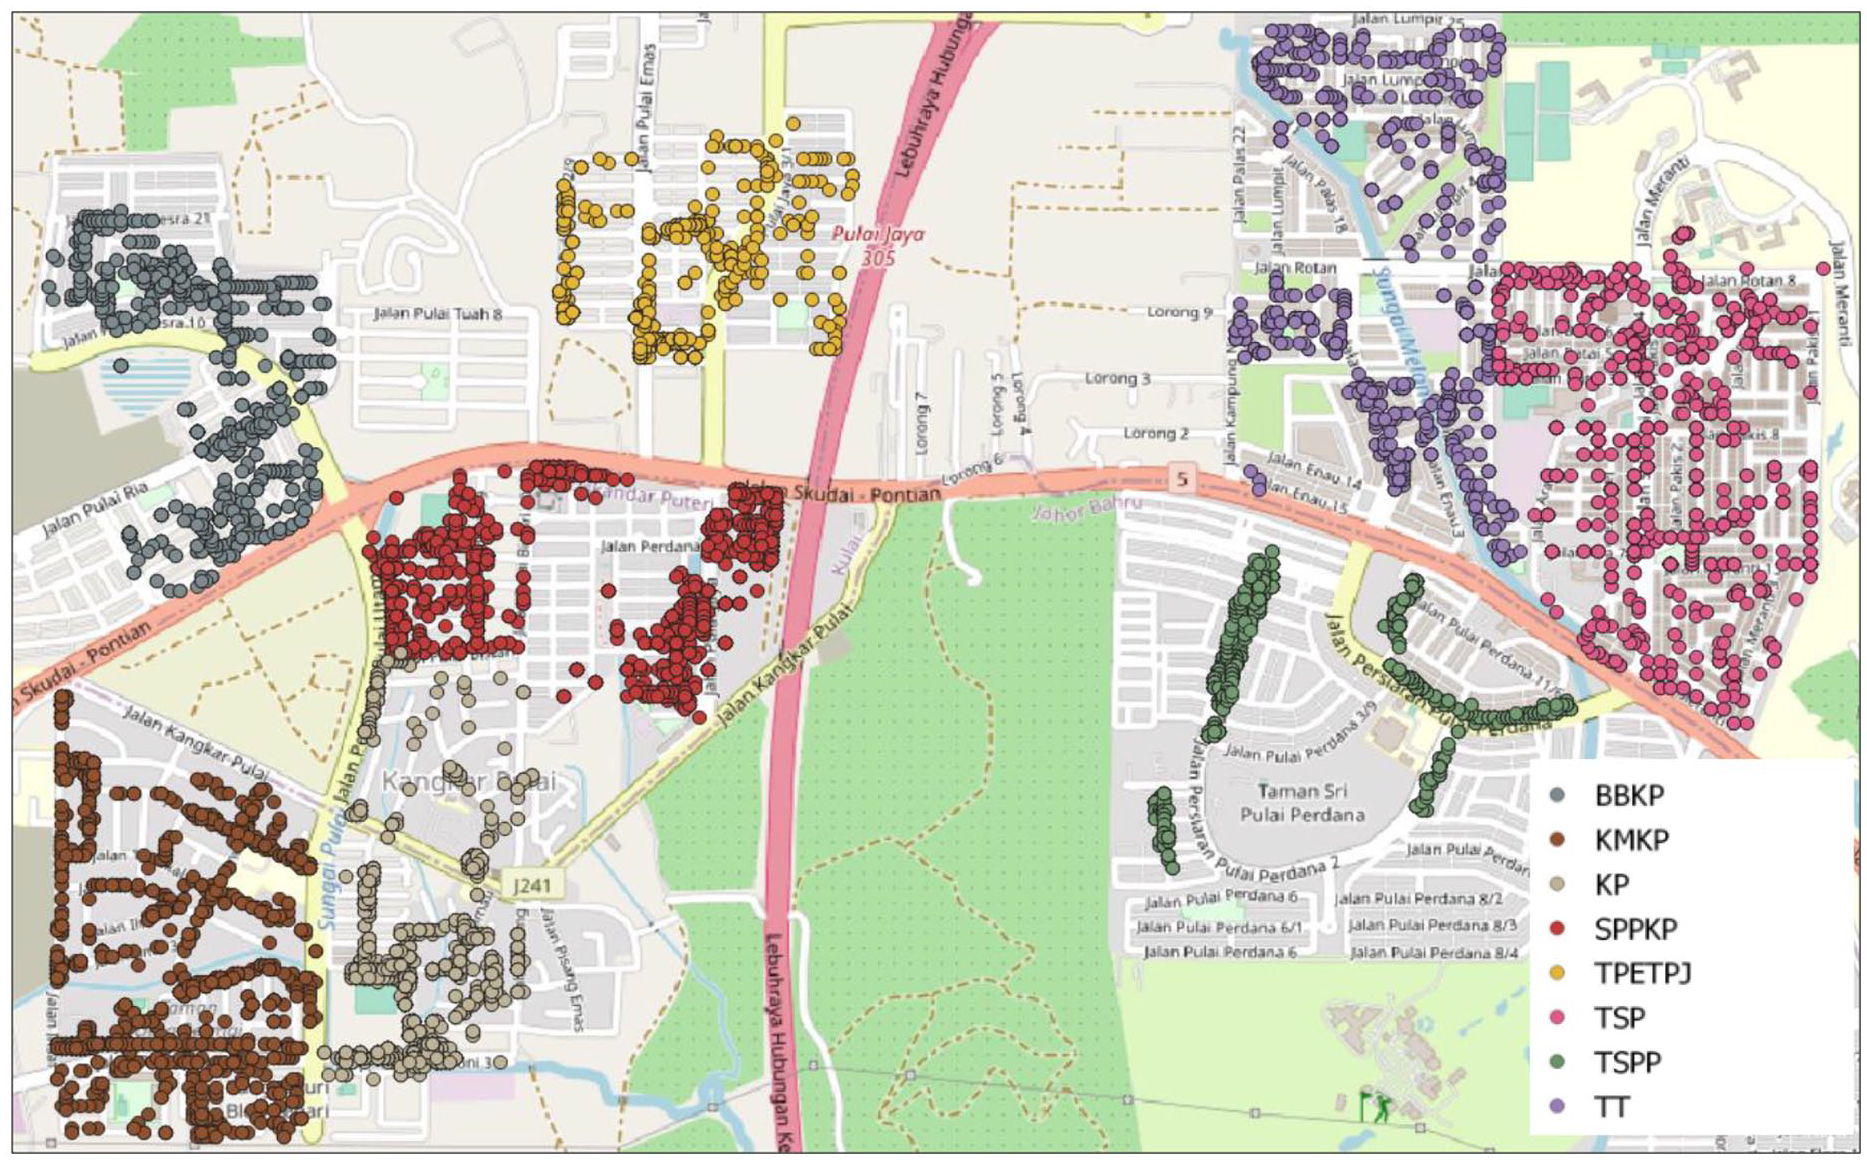
Location of litter distribution of each study area.
The data acquired is then extracted into rows and columns. Each image is inspected for details, such as litter kind, geographic location and material composition before being exported to a spreadsheet. Based on this information, the statistic for recyclable and nonrecyclable can be projected, and material can be analysed. For future planning, this insight can be used as a benchmark for suitability for recycling, especially for areas with a high number of recyclable litter. Besides that, litter materials can be used to forecast the recycling cost. According to Genc et al. (2019), different recyclable litter materials require different recycling processes such as plastic cleaning and separation cost for plastic, scrapping for aluminium and crushed, melted and moulded for glass. The acquired data is projected in Figure 4. Figure 4(a) shows the recyclable and nonrecyclable litter profile for each study area. From the figure, more than 50% of the litter is recyclable, indicating that the recycle point distributions are required for each area. Figure 4(b) shows the projected number of different recycling materials. Figure 4 shows that most of the disposed of litter around the study area are plastic, followed by paper and glass. Based on the profile and statistic in Figure 3, it can be concluded that each study areas require a recycling point to increase recycling activity and, at the same time, reduce waste disposal.
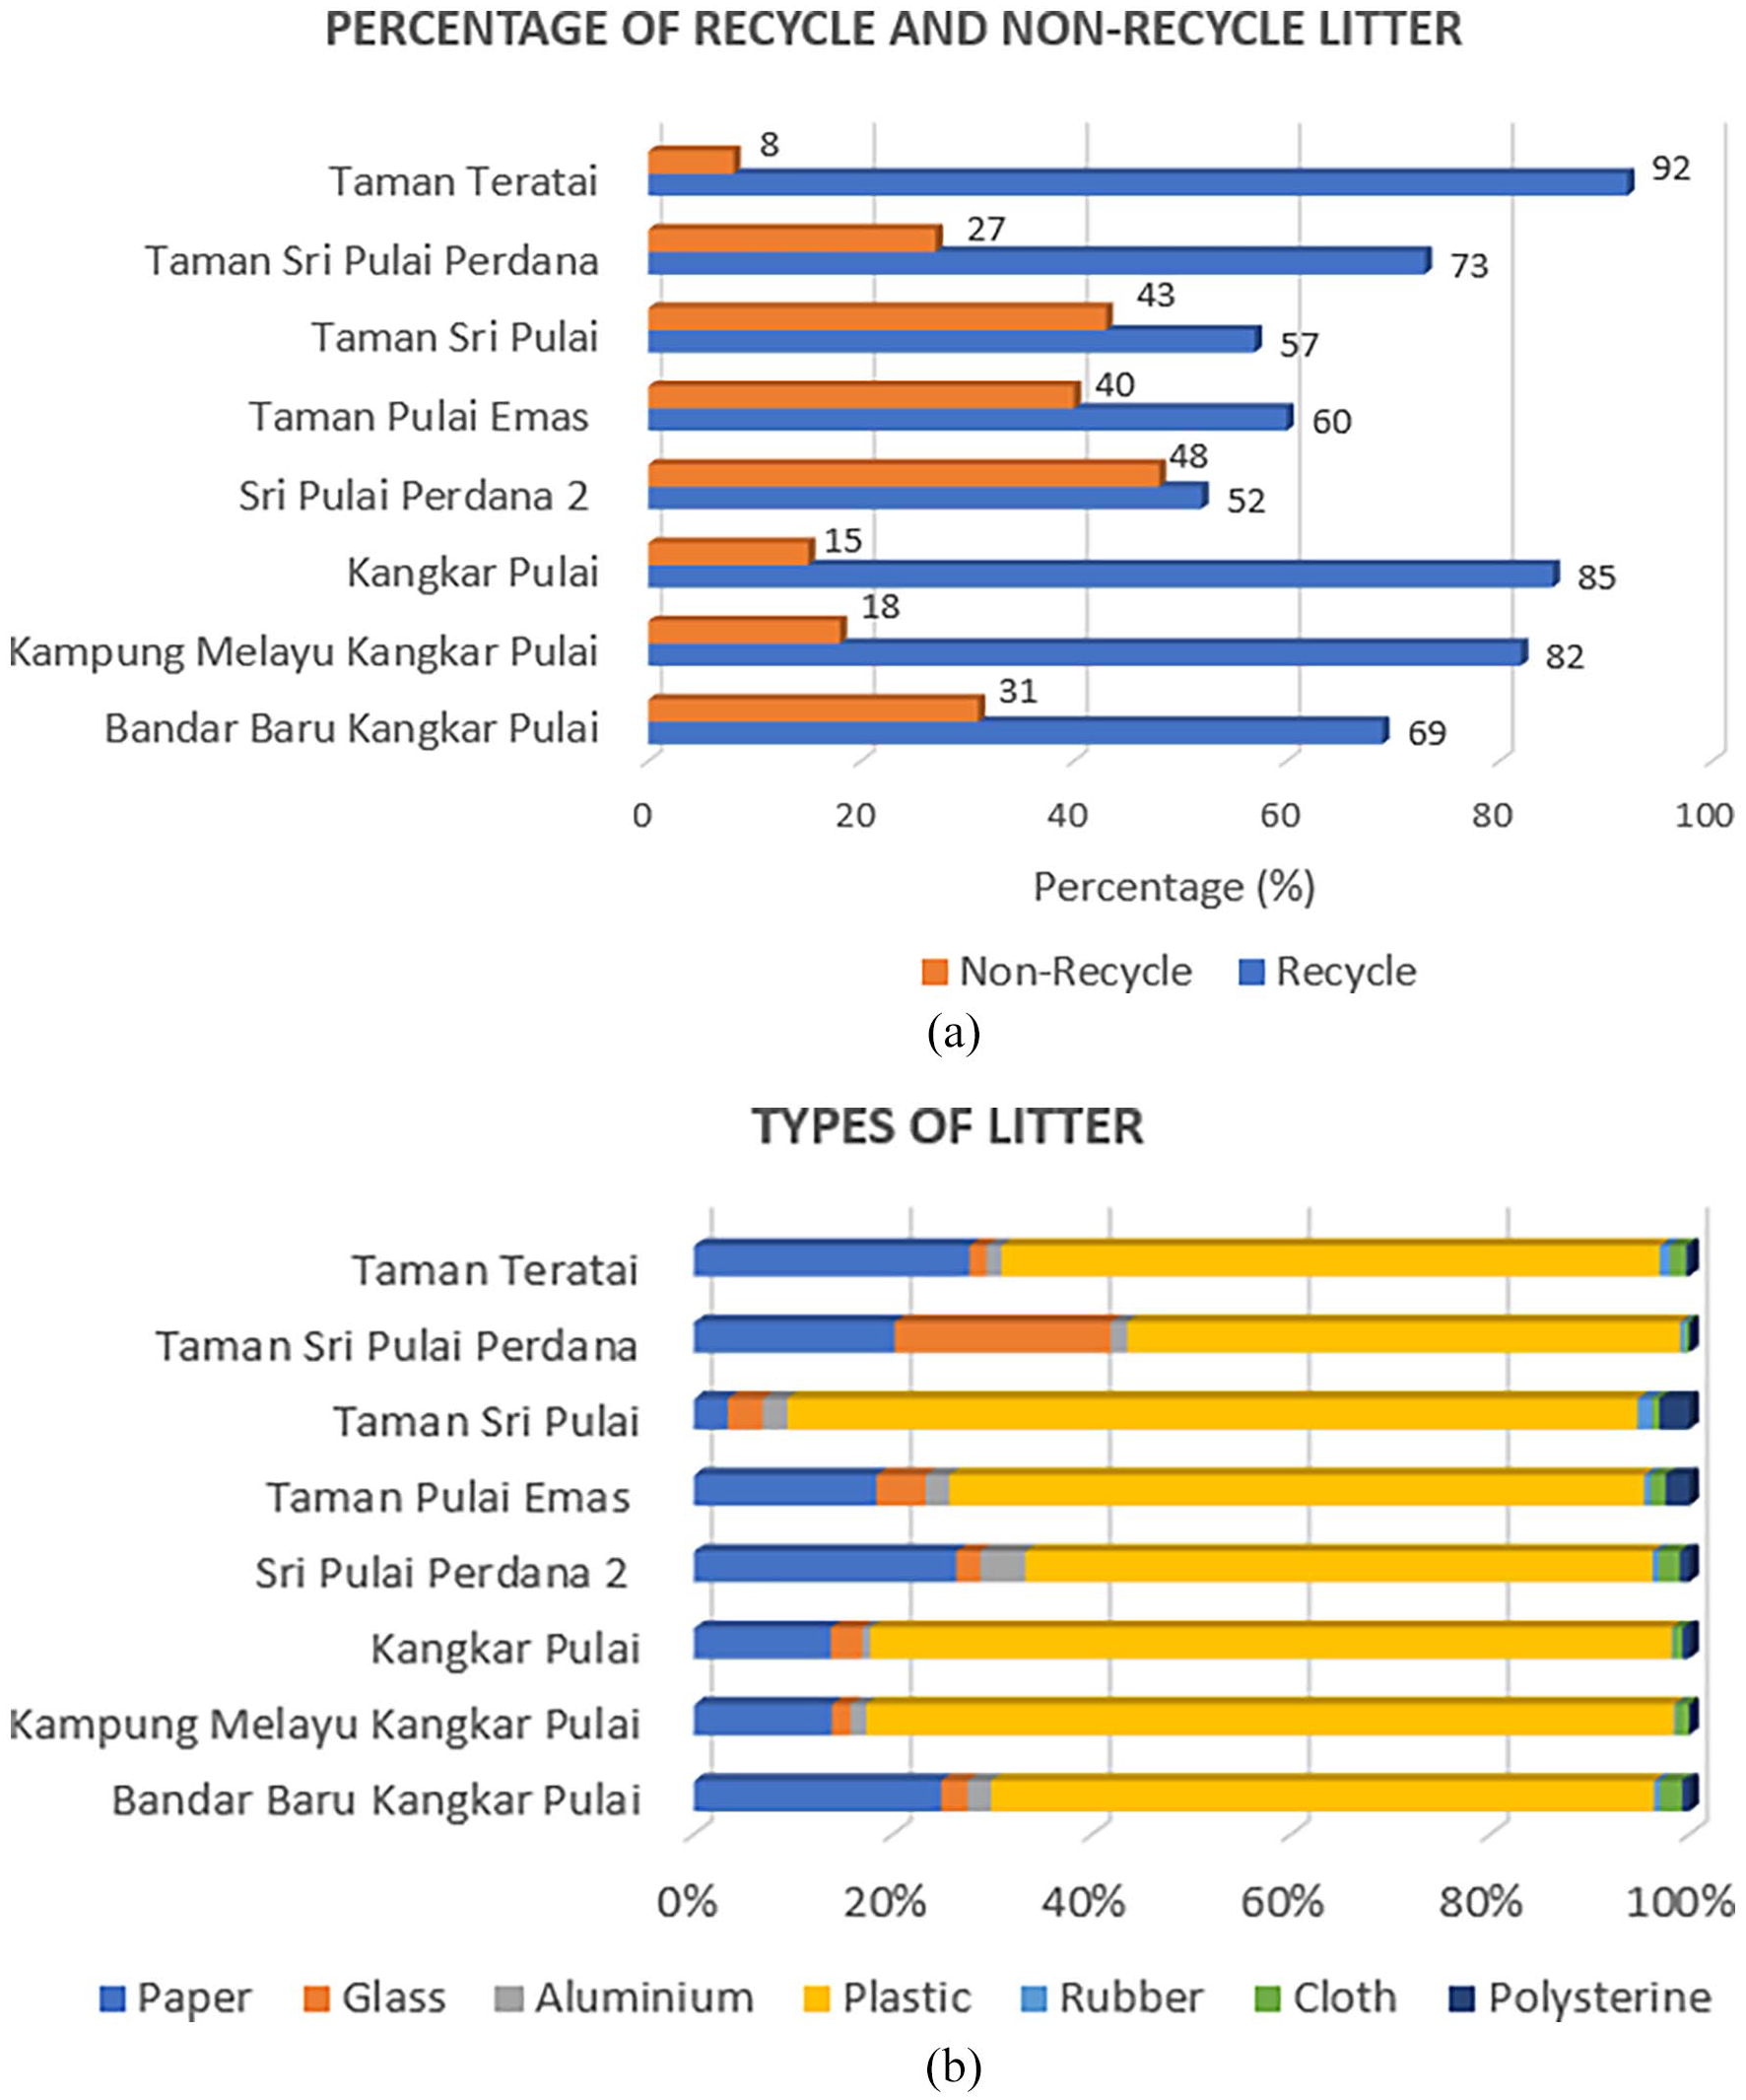
(a) Percentage of recyclable and non-recyclable litter and (b) types of litter of each study area.
Phase 2: Litter pattern identification
Understanding spatial patterns is a basic of spatial analysis. Therefore, Phase 2 of WCPI uses nearest neighbour analysis to determine the frequency of litter in one area. Nearest neighbour analysis can measure the distribution and define the distribution of points. In this study, the nearest neighbour analysis aims to show the pattern of recyclable litter, whether it is a cluster, random or dispersed. This pattern distribution will subsequently affect the number of bins located in the study areas. If the litter pattern is clustered, several group clusters can be formed in the next clustering phase. If the pattern is random, normally only one or few clusters can be formed, and a dispersed pattern can usually be associated with one group cluster. Furthermore, description of locating the recycle bin based on group cluster is explained in Phase Data Clustering.
In this study, the average nearest neighbour is used to test the statistical significance based on the size of the study area. The average nearest neighbour summary output is observed mean distance, expected mean distance, nearest neighbour ratio, z-score and p-value. The following equations explain the average nearest neighbour formulation.
The average nearest neighbour for a set of points is explained in equation (1):

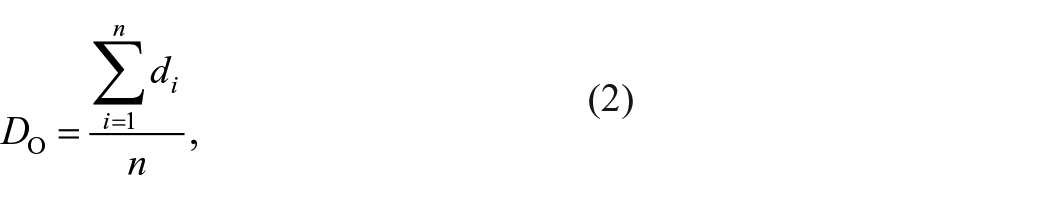
where Do is the observed mean distance between two features and their nearest neighbour:
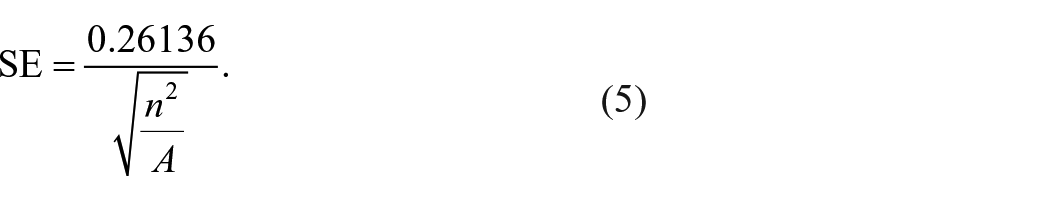
Where DE is the expected mean distance for the features given a random pattern.
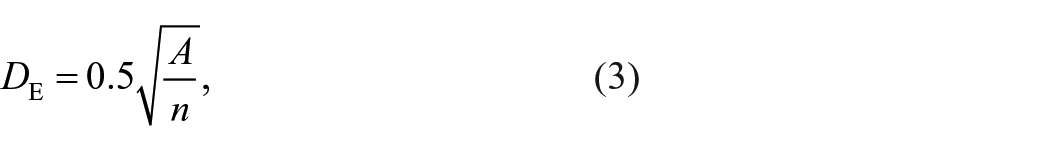
where n corresponds to the total number of features and A is the total study area. Based on the observed mean distance and expected means distance, the average nearest neighbour ratio can be obtained to measure the average distance between neighbours in a hypothetical random distribution. If the ration value is <1, the pattern exhibits clustering. Meanwhile, if the ratio is more significant than one, the pattern is more likely to be random or dispersion. Other factors that can be considered to quantify the clustering degree are the z-score and p-value. z-Score and p-value are statistical hypotheses that indicate whether to reject the null hypothesis. Usually, the null hypothesis (Ho) is defined as ‘no cluster exists on the point distribution’. If the p-value is very small, the Ho can be rejected because it represents a very small probability that the observed pattern is based on the result of random chance.
Meanwhile, the z-score is a standard deviation. A very high or low (negative) z-score is associated with a very small p-value. The z-score for the average nearest neighbour can be calculated as described in the equation:
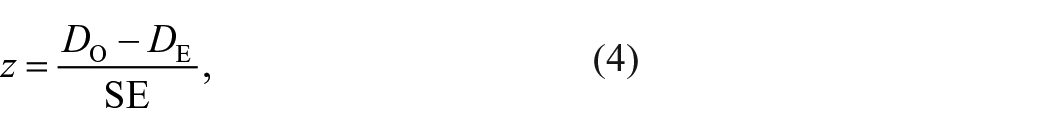
where:
Phase 3: Data clustering
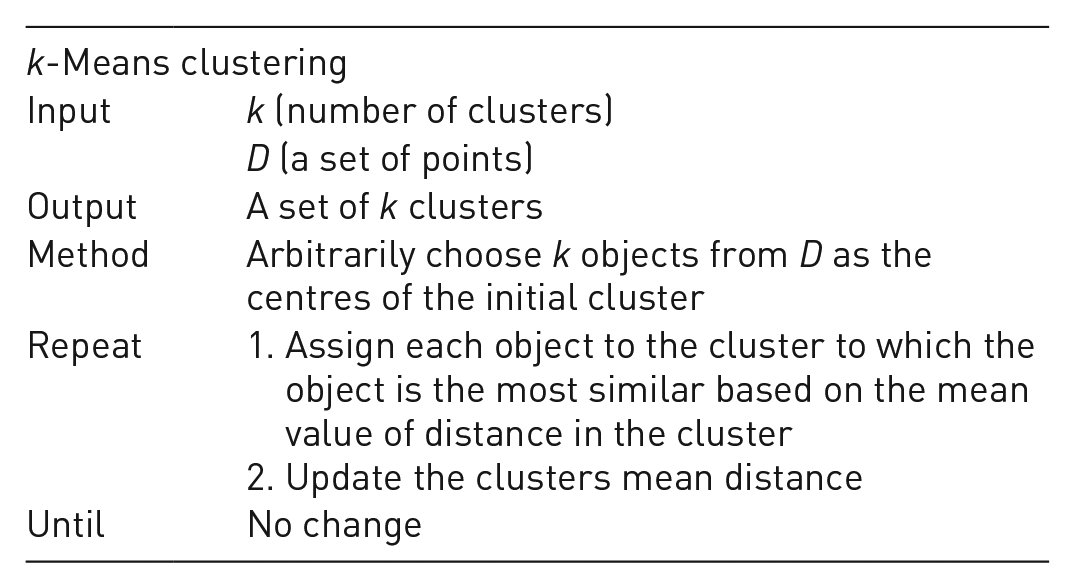
Based on the litter pattern generated from the average nearest neighbour analysis, several group clusters can be detected. Cluster analysis is used to form the group clusters. Cluster analysis is one of the most convenient methods or approaches in spatial statistical analysis. Various types of cluster analysis have been used in data analysis for various applications. One of the well-known clustering algorithms is k-means. k-Means can be considered the most popular clustering algorithm due to its simplicity. Previous studies have adopted the k-means algorithm for different applications, such as geo-marketing (Azri et al., 2016b), database organization (Azri et al., 2016a), wireless sensor framework (Azri et al., 2019) and location-allocation problem (Kim et al., 2018). However, the drawback of k-means is that it is a NP hard problem (García et al., 2018; Tîrnăucă et al., 2018; Wang et al., 2019). The NP-hard problem would produce more than one cluster centre in the same group. According to Azri et al. (2016a), this will cause repetitive data entries, leading to multipath queries, increasing the system storage or memory and leads performance degradation. The k-means clustering algorithm can be described as follows.
k-Means require repeated iterations while dealing with n data points (Arthur and Vassilvitskii, 2006). The process will exponentially increase due to the bad selection of initial centroids C. This is the reason that causes the overall time complexity of k-means exponential in n. It is challenging to determine a suitable value and the number of times to repeat the algorithm execution. Furthermore, the repetition of iteration is not a good choice, especially while dealing with a huge dataset and producing numbers of group clusters (Nidheesh et al., 2017).
Thus, in this study, the elbow method of WCSS is adopted during the clustering process. Each cluster consists of measuring and comparing the distances between the data points within a cluster and its centroid. Calculating the WCSS would be an optimal way of finding out the proper number of clusters (Nainggolan et al., 2019; Regla et al., 2019). WCSS is the sum of squares of the distances of each data point to their respective centroids in both clusters. The elbow method can find the optimal value for k based on the Elbow point graph. The graph shows a set of k values for each k value against WCSS. The data were divided into numerical attributes according to several clusters based on the distance clustering algorithm by k-means Clustering. The selection of the centre values on clustering depends on the outputs of k-means.
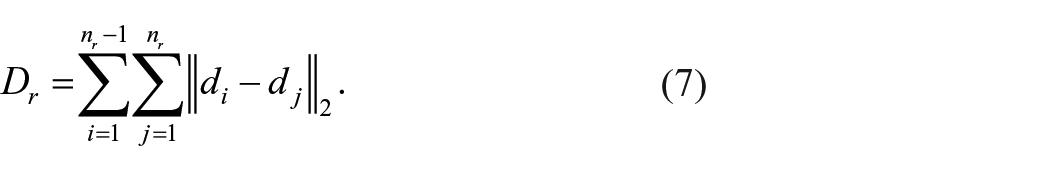
The average WCSS is mathematically based on the points inside the average distance cluster. The number of clusters is k, the number of points in cluster r is nr and Dr is the sum of all points in a cluster distance:
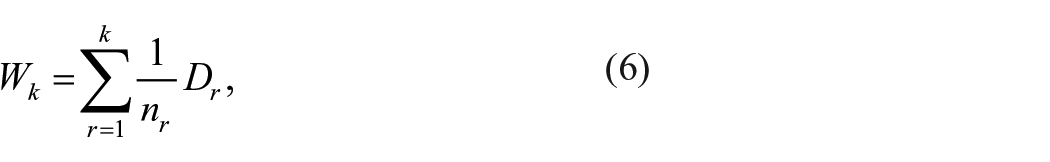
where
Using a gap statistic approach to differentiate the k-means clustering method, identify an appropriate reference distribution and choose the number of clusters (Tibshirani et al., 2001). By plotting the number of clusters and WCSS, the number of k can be identified when the plot is starting to decrease or stagnant.
Carbon footprint estimation
One of the aims of the SDG is to reduce carbon emissions. By recycling litter and waste, landfilling can be avoided, and land resources could be saved. Later, they can be utilized for other vital purposes. Thus, in this study, the total emission of CO2 is calculated for the collected litter. The computation is based on the assumption that all recyclable litter in Phase 1 is recycled and remanufactured. Production of new products would result in energy digestate. Thus, recycling would save natural resources and reduce carbon footprint.
It has been found that the 2000 ml PET bottles, compared to the other options, have the lowest carbon footprint for most environmental impacts, such as water use and waste disposal, in a study in the United Kingdom. The glass bottle was also considered to be the least preferred choice among manufacturers. The carbon footprint of aluminium cans and 500 ml PET bottles would be equal if the glass bottles were reused just three times. However, if PET bottles were to be recycled at a rate of 60%, the glass would have to be recycled 20 times in order to be on par. The study summarized that the total carbon footprint of a 500 ml PET bottle is 293 g of CO2, a 750 ml glass bottle is 555 g of CO2 and 330 ml aluminium can is 312 g of CO2 (Amienyo et al., 2013). Meanwhile, a study from China calculates the carbon footprint emission of copying paper. Based on the study, it is found that the carbon footprint of 1000 kg of copying paper was 647.89 kg CO2 (Yue et al., 2017). Other materials that have been found during the data collection in Phase 1 are rubber or latex and cloth. For concentrated latex production, almost 70% of the carbon footprint originates from rubber cultivation. The carbon footprint of 200 rubber gloves was approximately 42 kg of CO2 (Usubharatana and Phungrassami, 2018). By estimating that one piece of rubber glove is 1 g, thus the carbon footprint for 1 g of latex is 0.21 kg CO2. Meanwhile, for the cotton t-shirt, the average carbon footprint produces 0.015 kg per t-shirt (Sandin et al., 2019). Table 2 summarizes the materials of recyclable litter and the total carbon footprint per gram.
Type of litter and carbon footprint produced.
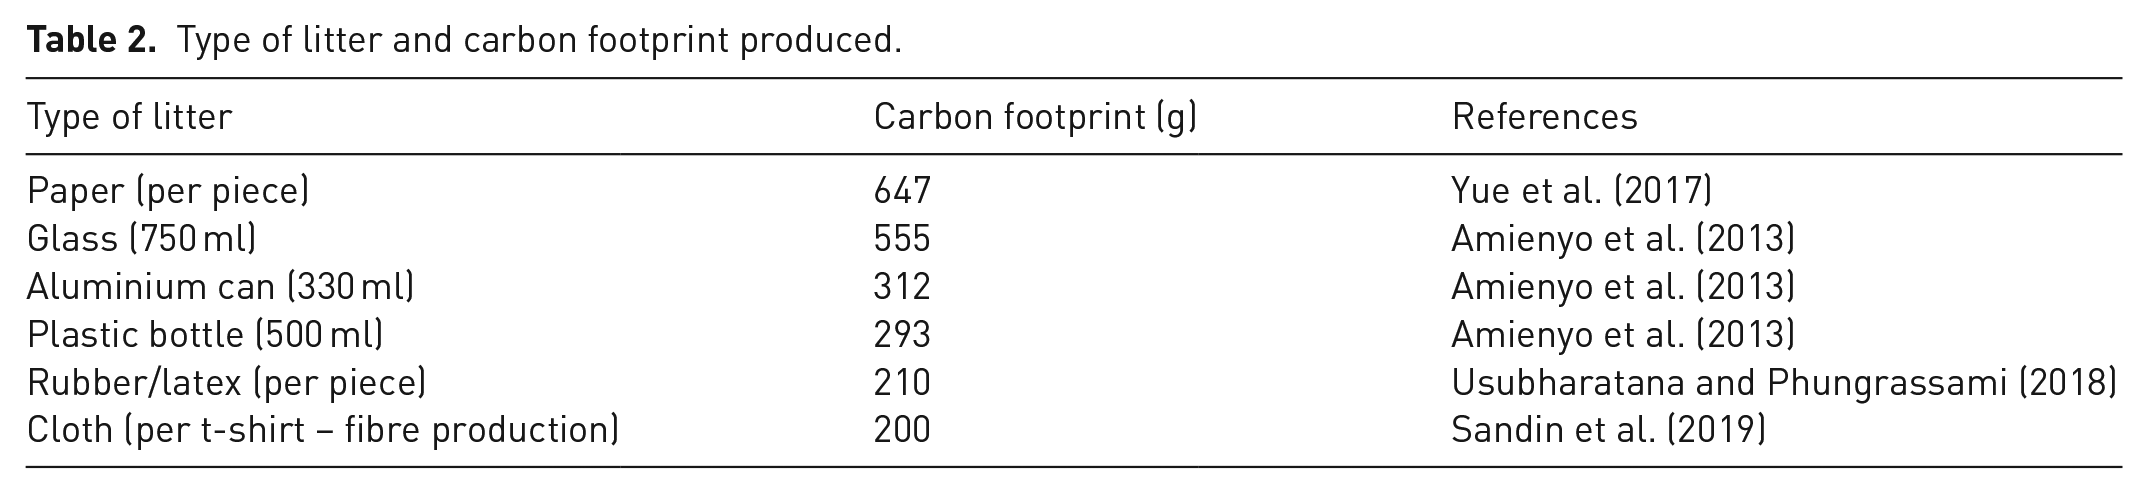
Based on Table 2, estimate calculation will be made based on a number of litters collected from Phase 1. Collected litter in Phase 1 will be categorized based on the type of litter; paper, glass, plastic bottle, rubber/latex and cloth. The total carbon footprint can be estimated by simply multiplying a number of captured litter by the carbon footprint in Table 2. Following equation (8) shows how to calculate the estimated number of carbon footprints.

where Nl is the number of litters.
Results and discussion
Litter pattern identification
Average nearest neighbour is performed on the litter distribution. Geotag data is used as a data input to perform the analysis. Two study areas are presented and compared. The study areas are BBKP and TSPP. A summary of all eight study areas is presented in Table 2.
Bandar Baru Kangkar Pulai
The value of the nearest neighbour ratio is 0.248, which is <1. The ratio indicated that the litter pattern in BBKP is clustered. Based on the report summary, the return value of the z-score is −42.737, which inclines towards the negative sides of standard normal distribution. The (negative) z-score is either very high or very low in the normal distribution, which correlates with a very small p-value. The p-value (probability) obtained for BBKP is 0, which is very small, which means that the observed spatial pattern is the result of random processes and may reject the null hypothesis (Ho). Based on this pattern distribution, it can be concluded that litter at the BBKP study area is concentrated at the exact point location and produces a cluster pattern. Based on this pattern, it is expected that the suggested location of recycle bins will be placed nearby to one another.
Taman Sri Pulai
Another analysis is performed for the litter dataset of the TSP study area. A number of 1814 litters are used as data input. The analysis shows that the pattern of point distribution is clustered. The report summary for the analysis can be obtained from the Table 3. The value of the nearest neighbour ratio is 0.057, which <1. The z-score return value is −58.635, which correlates with the small p-value, which is 0. Thus, the same conclusion can be summarized for the litter data of TSP. The litter is thrown at the exact point location and cause the clustered pattern.
Report summary of nearest neighbour analysis.
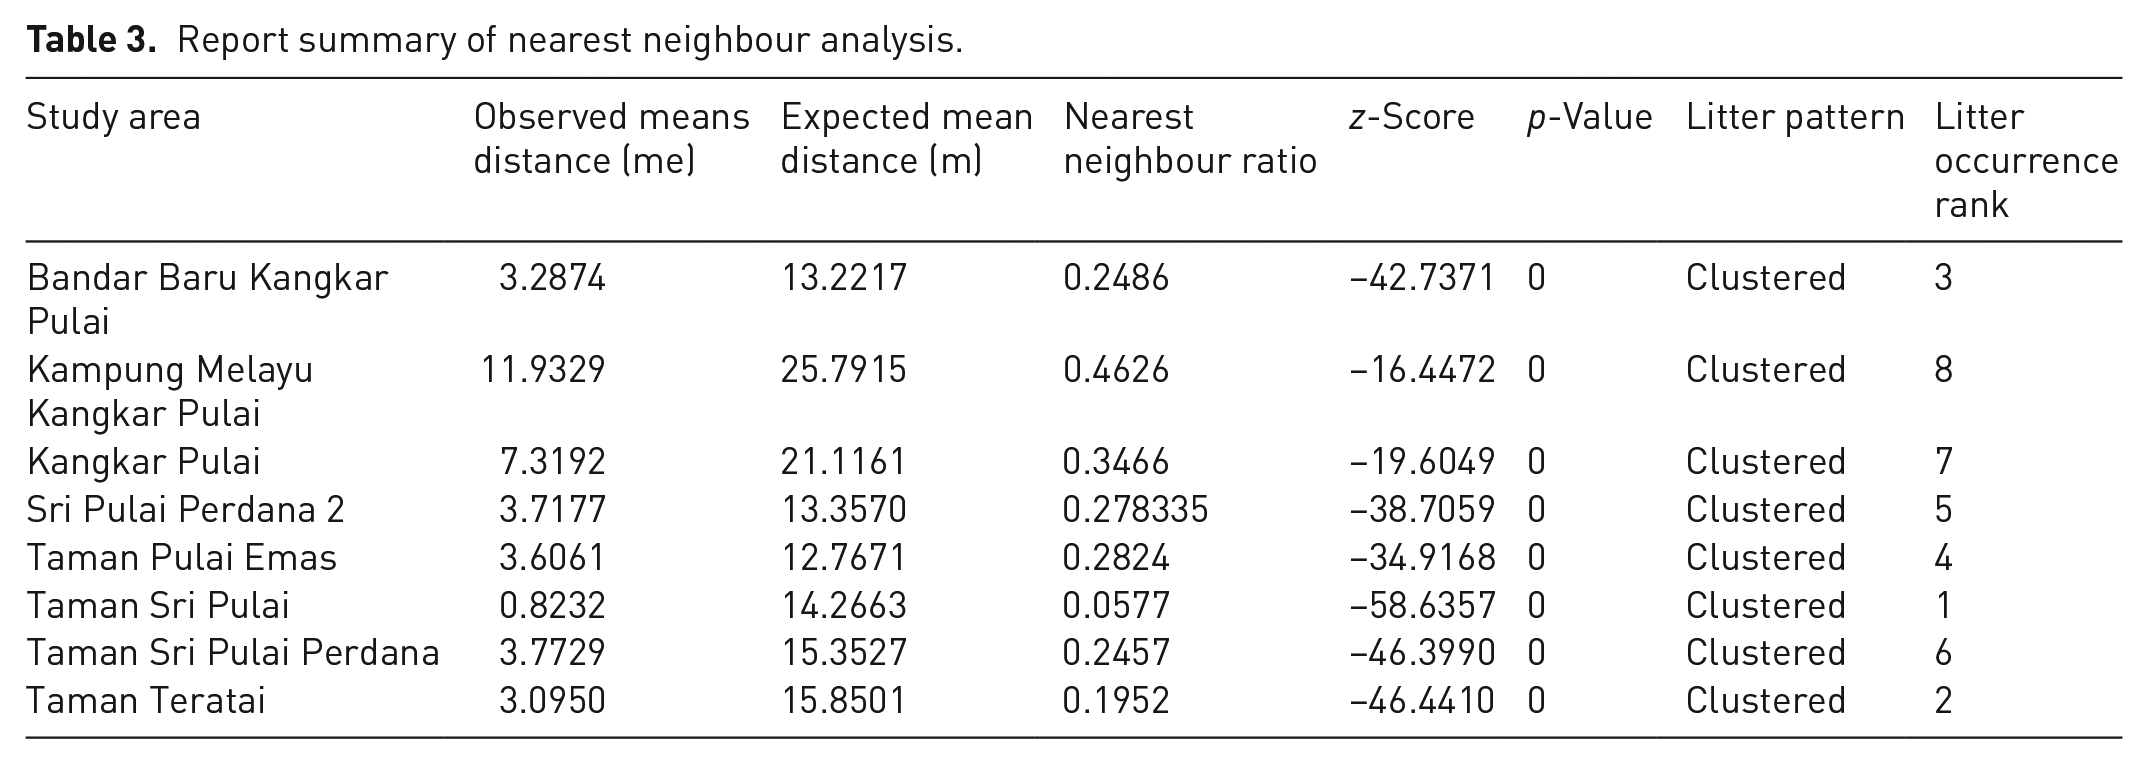
The summary report for eight study areas is presented in the following Table 3. Based on the summary, the nearest neighbour ratios for all study areas are <1, indicating that all litters distribution is clustered. The z-value for all study areas is also very low, between −16.447 and −58.635. Since the z-value is relatively small, this explains the consistent value of the p-value for all study areas, which is 0. Thus, the null hypothesis Ho can be rejected, and it can be concluded that litter distribution for all study areas is clustered. The findings are then analysed, and it is determined that litter is concentrated in similar areas, such as in front of businesses and along roadways. Thus, the recycling container should be positioned in this high-traffic area to attract attention and encourage recycling habits.
From Table 3, we can also indicate the litter occurrence based on the observed mean distance of litter distribution. For example, litter can be found at the average of 3-m distance in BBKP and 11-m distance for KMKP. The number of litter occurrences is ranked based on the observed mean distance values. Among these eight study areas, TSP is at the first (1st) rank, where litter can be found at an average distance of 0.8 m. KMKP is at the eighth (8th) rank, where the average distance to find a litter is 11.9 m. This rank clearly shows that litter is concentrated in the study area. Thus, there is a need to strategize to reduce public littering and motivate residents’ recycling habits.
Recycle point identification
The optimal recycle point is identified based on the combination of the k-means clustering algorithm and the Elbow Method of WCSS. Figure 5(a) shows the relationship between the number of clusters and WCSS. The number of clusters k can be identified through the plot. Based on Figure 5(a), the WCSS plot dramatically drops with the increasing value from k = 1 to 2 and from k = 2 to 3, then the optimal cluster elbow is k color4. Then, the distortion goes down gradually and becomes stable. After obtaining the value of k, we can determine the cluster centre point of data using the k-means clustering algorithm. The location of the recycle bin can be proposed based on this cluster centre. The output of the proposed recycle bin locations for BBKP is represented in Figure 5(b). There are four proposed locations for the recycle bin in BBKP study areas (yellow dots). However, the proposed location is considered as raw location. Further verification is needed to confirm the location optimality.
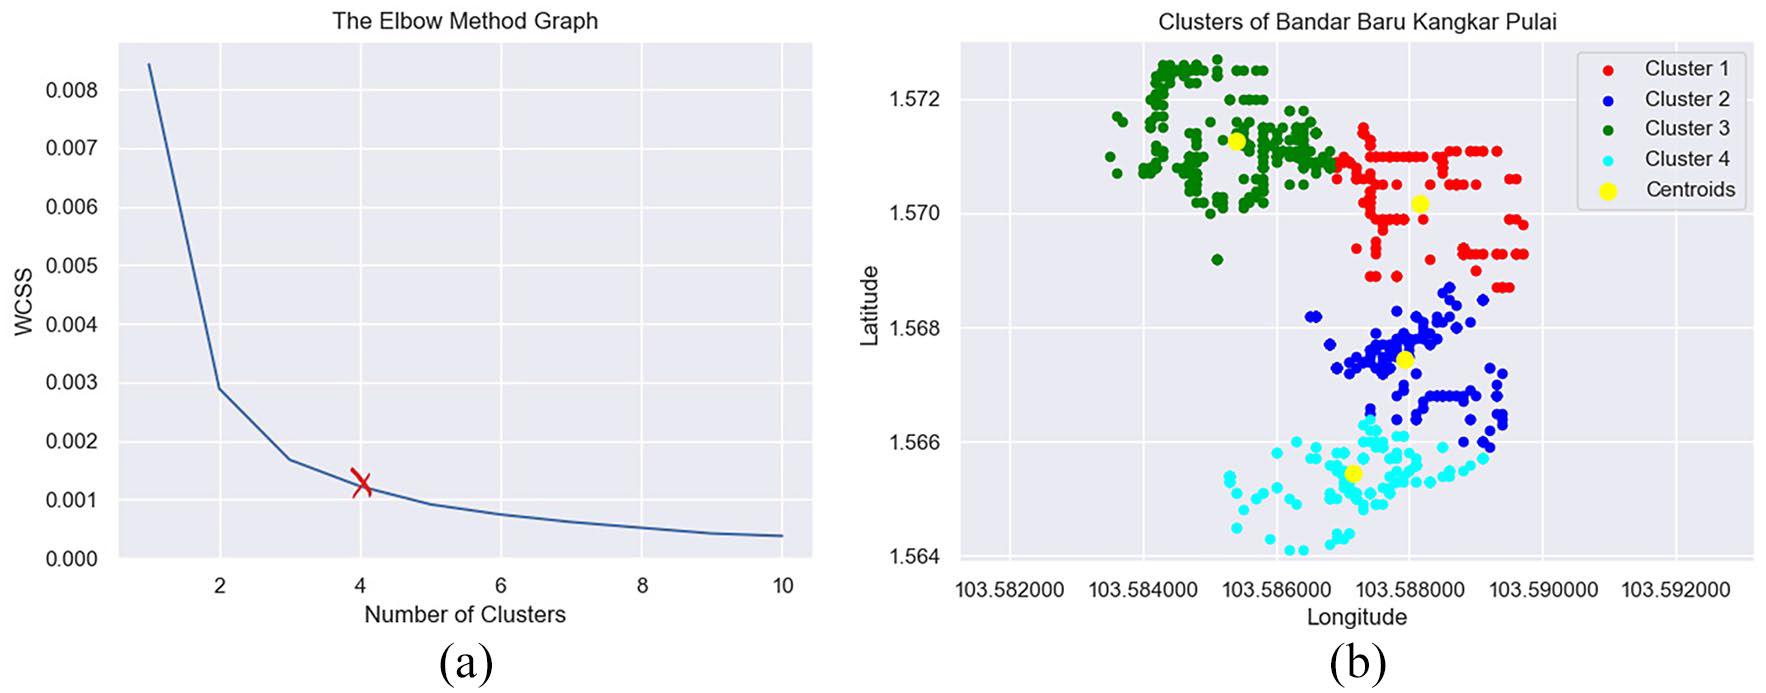
(a) Within-cluster-sum-square plot and (b) number of proposed recycle bin locations.
The proposed recycle bin locations for another seven study areas are described in Figure 6. Based on the results, it is shown that the Taman Pulai Emas (Figure 6(b)) study areas require more bins placement than other study areas. It is due to the concentration of litter at several spots is high. Furthermore, the boundary area of Taman Pulai Emas is larger than others, which justifies why the area requires more bins than other areas. Based on the concentration, eight group clusters are produced by k-means clustering and WCSS.
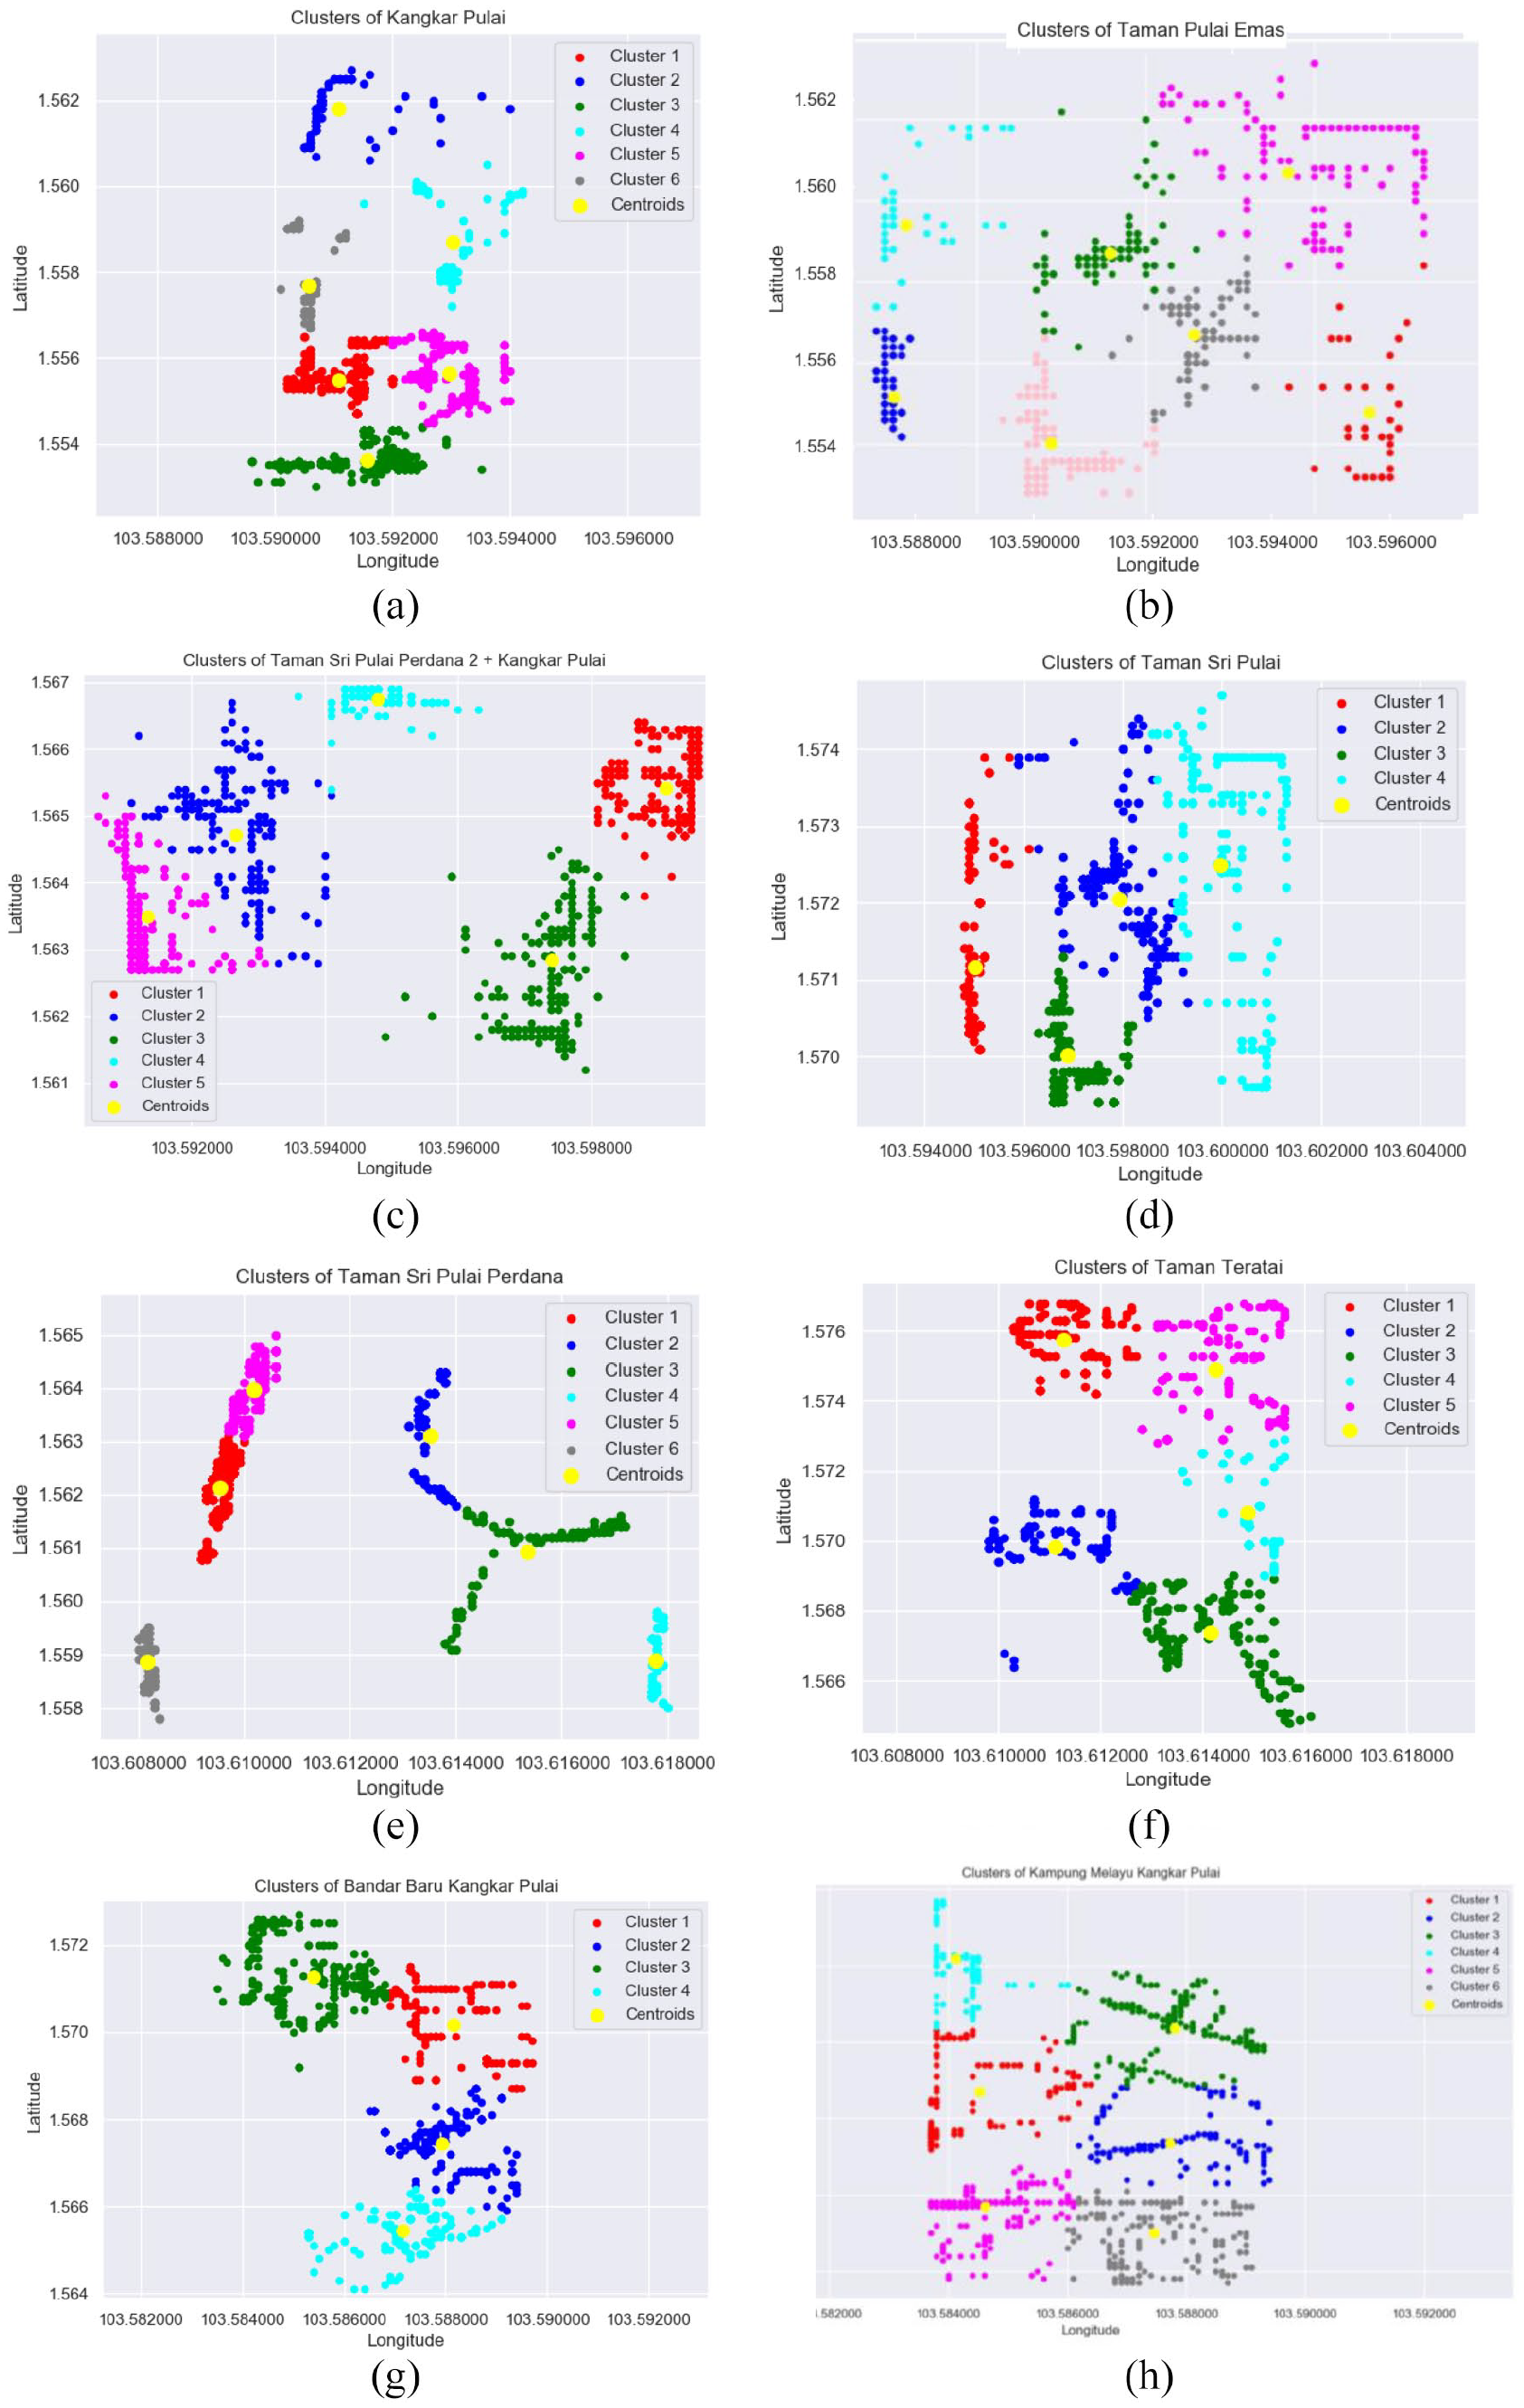
Proposed recycle bin locations (yellow dots) for each study area: (a) produced cluster centre k = 6 for KP, (b) produced cluster centre k = 7 for Taman Pulai Emas, (c) produced cluster centre k = 5 for TSPP 2, (d) produced cluster centre k = 4 for TSP, (e) produced cluster centre k = 6 for TSPP, (f) produced cluster centre k = 5 for TT, (g) produced cluster centre k = 5 for BBKP and (h) produced cluster centre k = 6 for KMKP.
Location verification
Based on the proposed location, several conditions need to be addressed to maximize the suitability of the location. Some of the proposed locations are not suitable because they are located in front of the residential house, on top house unit roof, on the main roads or streets and in an inaccessible area. So, there is a need to suggest a new location of recycling points for better accessibility and the resident’s convenience. Figure 7(a) shows the proposed locations for TSPP recycling bins in the OpenStreetMap. The proposed locations need to be adjusted, as shown in Figure 7(b). The adjusted location of the recycling bins must be within the cluster boundary to maintain the average distance ratio based on point distribution. There are six locations proposed for the TSPP study area, and only three locations which are Point 2, Point 4 and Point 6, need to be adjusted.
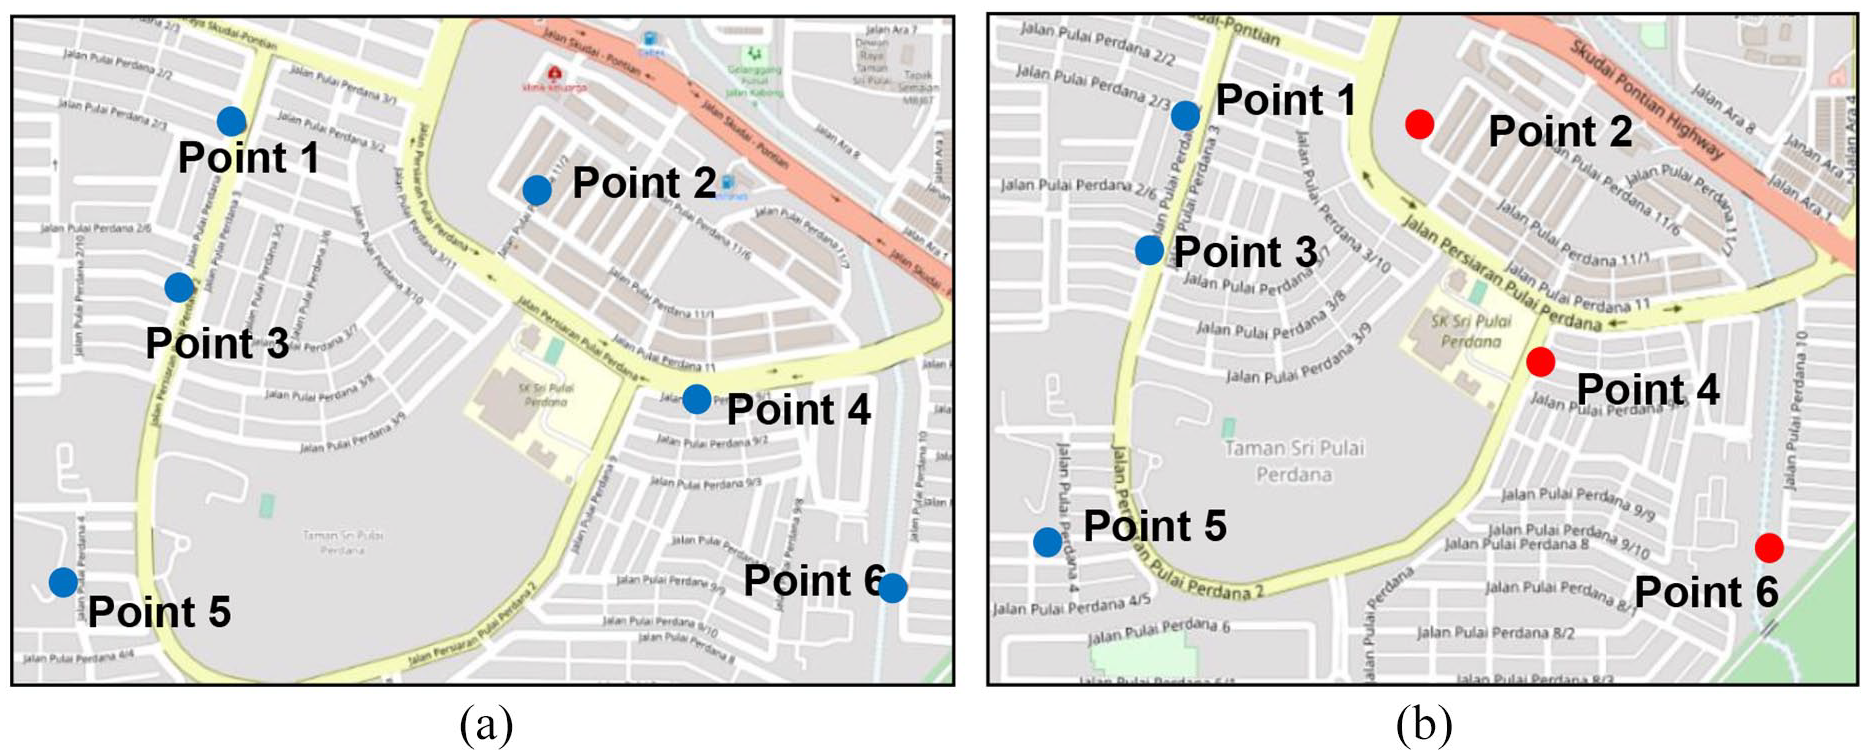
(a) Proposed location of recycling bins and (b) adjusted locations for TSPP.
Total carbon footprint
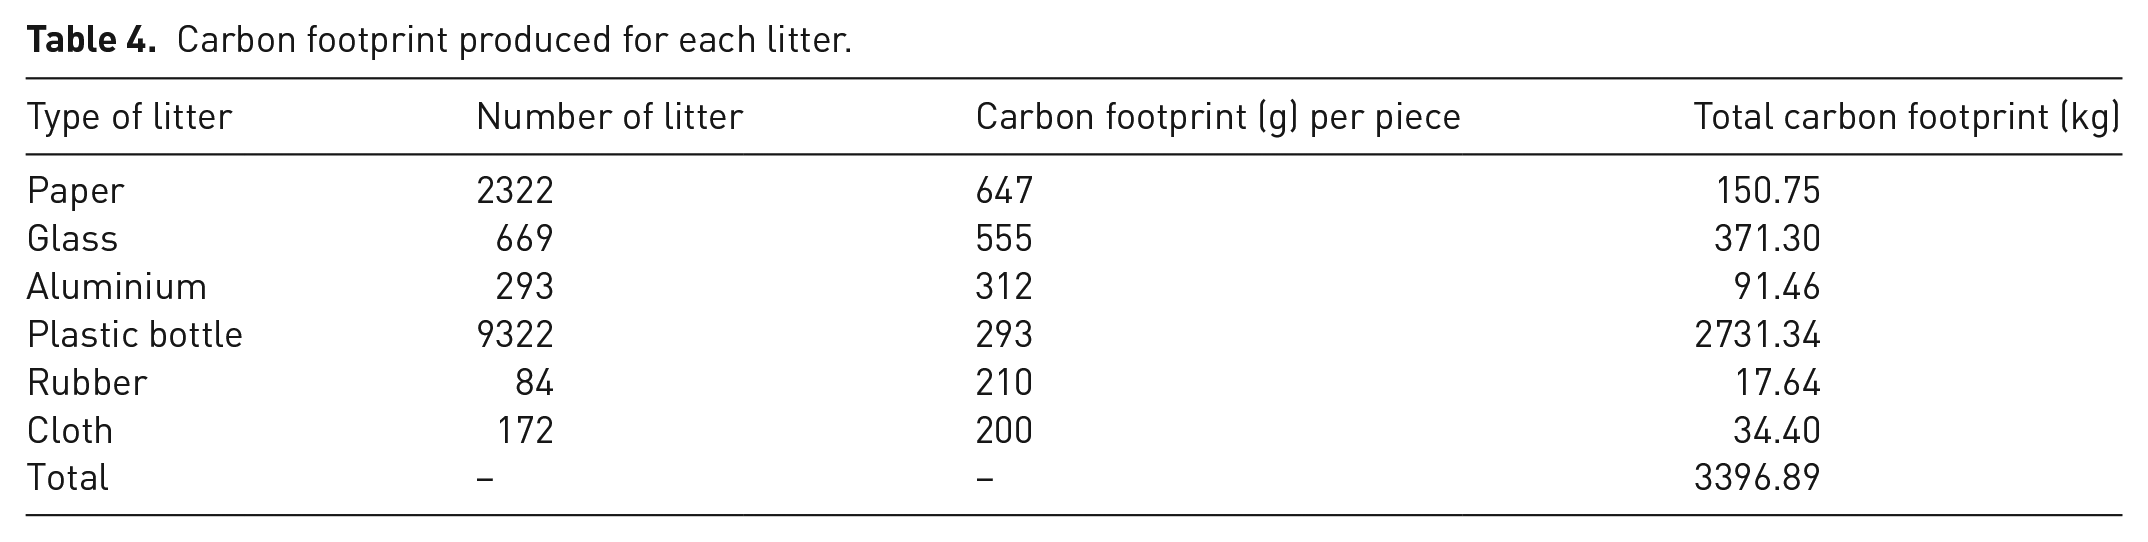
In this study, the calculation used for the litter does not precisely describe the carbon footprint because the litter is not weighted using designated tools. However, it can be used to estimate the carbon footprint that can be reduced by utilizing the WCPI approach. The result for the total carbon footprint is described in the Table 4. From Table 4, it is shows that the litter from a plastic bottle produced 2731.34 kg of carbon footprint, the highest among others. Meanwhile, rubber-based litter produced the lowest carbon footprint, 17.64 kg. Suppose the WCPI approach is realized and managed to motivate consumers to recycle public litter. In that case, there are possibilities that the total of 3396.89 kg of carbon emissions can be reduced and, at the same time, could save the energy digestive and reduce the use of other natural resources. It is indicated that placing recycle bins at an optimal location is important to support a low carbon footprint. Table 4 shows the total carbon footprint produced for each type of litter in Phase 1.
Carbon footprint produced for each litter.
Conclusion
This study introduced a new approach to identifying optimized recycle point distribution; WCPI. WCPI used comprehensive spatial analysis distribution to describe the litter pattern for eight study areas in Johor Bahru, Malaysia. Currently, the local authorities of study areas do not have any specific model to identify the optimal location of the recycle bin. Meanwhile, other practices and studies only consider distance and weight in their model to locate the bin. None of the current models consider the litter pattern distribution for the bin location-allocation model.
Our findings proved that public littering is still happening in the study areas, and most of the litter is recyclable. A total of 11,945 litter are found in the study areas, and most of the litter is PET bottles. The following theoretical implications can be drawn from the litter insights.
Public littering is still common, which contradicts the Theory of Waste Management. Based on the theory, it is expected to manage waste management efficiently to prevent the waste from causing harm to human health and the environment and, at the same time, promote resource use optimization (Pongrácz et al., 2004).
Our findings also confirm that WCPI incorporates clustering approaches to propose the location of the bin. The results show that WCPI successfully processed the data input and the litter distribution and proposed a suitable location based on litter concentration. The number of proposed recycle points may vary depending on the number of litter and litter distribution. However, the location needs to be verified in terms of its suitability and accessibility. Findings from other domains suggest that bin placement may play a significant role in embarking on consumer motivations to dispose of litter in the recycle bin (Geertman and van Gent, 2018). Nevertheless, whether the strategic location will contribute to litter disposable remains to be investigated.
This study also provides an insight into the number and type of litter disposed of in the study area. Based on that information, 3396.89 kg of carbon footprint can be saved if the disposed of litter is sent for recycling. This approach will be in line with the aim of Iskandar Malaysia to achieve a low carbon society as planned in the Low Carbon Society Blueprint for Iskandar Malaysia 2025. Therefore, we recommend that a standardized approach be employed to manage public littering and, at the same time, strategize carbon footprint reduction via waste management.
Despite several findings, we also note that our knowledge measure (particularly on carbon footprint) had rather low reliability since it is based on the estimation and could be improved in future work. Finally, our research focused on litter distribution as a factor in identifying optimal recycling bin’s locations. Future research should consider cross-examination after the execution of the proposed approach.
In conclusion, we believe that the findings of this study could help the local authorities to strategize a plan for a better recycling environment for achieving the SDG 2030. The optimal location is essential to embark on consumers’ motivation to dispose of recycling waste, reduce litter and transform Malaysia into a clean and sustainable nation, aiming to achieve Agenda 2030.
Footnotes
Acknowledgements
The authors would like to express special thanks to the student of Bachelor of Science (Geoinformatics) course SGHG3513 Spatial Analysis – Session 2019/2020 and Bachelor of Engineering (Geomatic) course SGHU4843 Environmental Studies – Session 2018/2019 & 2019/2020 for data collection.
Declaration of conflicting interests
The author(s) declared no potential conflicts of interest with respect to the research, authorship, and/or publication of this article.
Funding
The author(s) disclosed receipt of the following financial support for the research, authorship, and/or publication of this article: This work was supported by Ministry of Education (MOE) through Fundamental Research Grant Scheme (FRGS/1/2022/WAB07/UTM/02/3) and Universiti Teknologi Malaysia Industry/International Incentive Grant (IIIG) ‘Spatial Classification and Clustering of Waste Recycle Point Distribution Towards Green City Initiatives’, Vot Q.J130000.3652.02M78.