
Abstract
Eco-efficiency assessment of municipal solid waste (MSW) suppliers is a useful tool in the transition to a circular economy. Furthermore, it provides evidence of the economic and environmental performance of municipalities that can be used for decision-making and/or elaboration of regulatory policies. In this study, eco-efficiency scores were computed for a sample of 140 Chilean municipalities in the provision of MSW services. In doing so, the stochastic semi-parametric envelopment of data method was applied. It is a novel technique which overcomes the limitations of parametric (stochastic frontier analysis) and non-parametric (data envelopment analysis) methods previously employed to evaluate the eco-efficiency of MSW services. The average eco-efficiency of the 140 assessed municipalities was 0.332 which indicates that they could save 66.8% of their operational costs and recycling the same amount of waste. Moreover, 61.4% of the evaluated municipalities presented an eco-efficiency score which was lower than 0.4, whereas the other municipalities (38.6% of the sample) exhibited an eco-efficiency which raged between 0.4 and 0.80. Hence, none of the municipalities assessed was identified as eco-efficient which, implies that there is room for all municipalities to reduce operational costs in the management of MSW. Population density, tourism and location of the municipality were identified as factors influencing the eco-efficiency of the municipalities in MSW management.
Keywords
Introduction
The collection of municipal solid waste (MSW) and its valorization play a crucial role in guaranteeing the health of citizens and the sustainability of the environment at local and national levels (Romano et al., 2021). Over the recent decades, waste production and its management have received growing interest because of increased population, economic growth, consumption habits and urbanization (Gastaldi et al., 2020; Marques et al., 2018; Simoes et al., 2012). It is estimated that the quantity of waste that will be produced in 2050 could reach 3.40 billion of tons from 2.01 billion of tons in 2016 (Kaza et al., 2018).
In the framework of circular economy, policy makers had interfered to tackle with increased waste generation. For instance, European Union (EU) countries aim to recycle 65% of their solid waste by 2035 (Gastaldi et al., 2020). Recycling of MSW became part of the United Nations agenda on circular economy and Sustainable Development Goals (SDGs) (Geissdoerfer et al., 2017; UN, 2015). Societies worldwide have been moving towards the 3Rs principle – reduce, reuse, recycle – to ensure the environmental sustainability of waste sector and promote circular economy.
In the case of Chile, a middle-income Latin American country, the waste collection and recycling services are under the jurisdiction of municipalities but these services are in most of the cases outsourced to private companies. There are also informal recyclers whose relevance is more significant in poorer municipalities (Valenzuela-Levi, 2021). MSW is collected door-to-door because public containers for waste disposal are very rare. MSW which is not recycled is disposed to landfills. Based on a study by SINIA (2021), approximately 80% of the solid waste produced in Chile is disposed in dumps. The legislation regarding the municipal management of waste in Chile is out-of-date compared to EU countries. In 2016, the Chilean government approved the Law for Promoting Recycling and Extended Producer Responsibility although its implementation was launched in mid-2020. Local entities are not obliged to have a compulsory recycling system. Nevertheless, in 2018, around 55% of the Chilean municipalities had implemented some sort of recycling service (Valenzuela-Levi, 2019).
In the context of MSW management, eco-efficiency evaluations can help to minimize both environmental impact and operational costs (Cerciello et al., 2019; Lombardi et al., 2021). Within the circular economy context, such changes are vital for building a sustainable society (Yi and Lim, 2021) contributing also to the achievement of the SDGs 11 and 12 defined by the United Nations (2015). 1 Eco-efficiency is defined as the production of more goods (products) and services with fewer resources (inputs) and less environmental impact (Beltrán-Esteve et al., 2017; Delgado-Antequera et al., 2021). The prefix ‘eco’ represents environmental and economic issues and, therefore, the assessment of eco-efficiency provides relevant information from an economic and environmental perspective (Lo Storto, 2021).
Based on the definition of eco-efficiency, life cycle assessment (LCA) and life cycle costing (LCC) approaches have been employed to assess the environmental and economic impacts of MSW treatment alternatives. However, most of past research interpreted LCA and LCC results separately (Chin et al., 2022) and therefore, they did not assess eco-efficiency. Relevant exceptions to this approach are Woon and Lo (2016), Yi and Lim (2021), Abdeljaber et al. (2022) and Chi et al. (2022) who compared the eco-efficiency of waste treatment technologies or facilities developing a synthetic eco-efficiency index. An alternative approach to LCA and LCC approaches to estimate eco-efficiency scores are frontier methods. They measure the performance of each unit (municipality in this case study) relative to ‘best practice’ frontiers comprising the leading units in the sample. Hence, they are considered suitable approaches for benchmarking purposes (Delgado-Antequera et al., 2021).
Several research studies in the past assessed the performance 2 of the MSW service providers using two main frontier methods namely: (i) stochastic frontier analysis (SFA) and (ii) data envelopment analysis (DEA). Both methods compare inputs and outputs across decision-making units (DMUs) (e.g. companies, municipalities) and identify most and less efficient DMUs. SFA is a parametric (econometric) method where it takes into account both inefficiency and noise. However, it requires the specification for a functional form for the production technology (e.g. Cobb-Douglas or translog). This specification is not required by DEA because it is a non-parametric (non-linear programming) method. DEA, however, does not include noise in the estimation (deterministic) (Amaral et al., 2022).
Both approaches (DEA and SFA) have been widely used to evaluate the economic efficiency of MSW sector in several EU countries such as in Portugal, Spain or Italy. For studies that use parametric methods see for instance, Simões and Marques (2011), Carvalho and Marques (2014), Swart and Groot (2015), Foggia and Beccarello (2018, 2020) and some examples of studies employing non-parametric methods are Benito et al. (2011, 2014), Simões and Marques (2012), Sarra et al. (2017), Guerrini et al. (2017), Castillo-Giménez et al. (2019), Exposito and Velasco (2018), Romano et al. (2019, 2020) and Delgado-Antequera et al. (2021). While there is ample evidence on the performance assessment of MSW sector in developed countries, empirical research on this topic from middle-income countries is limited. Studies by Valenzuela-Levi (2019, 2021) and Valenzuela-Levi et al. (2021) employed econometric techniques to understand the factors influencing the recycling rates in Chile; however, they did not measure efficiency. This drawback was overcome by Llanquileo-Melgarejo et al. (2021), Llanquileo-Melgarejo and Molinos-Senante (2021) and Salazar-Adams (2021) by using DEA techniques to assess the eco-efficiency of municipalities in the provision of MSW services in Chile and Mexico, respectively. However, the existing studies from both middle-income and developed countries have a main limitation.
Past research evaluating the eco-efficiency of municipalities in the provision of MSW services used DEA or SFA when conducting their efficiency assessment, and therefore they presented the methodological limitations discussed previously which might lead to biased results and therefore misguiding conclusions. In this context, the following questions arise: (i) which frontier method that overcomes the limitations of DEA and SFA could be used to estimate eco-efficiency of the MSW sector?; (ii) which is the level of the eco-efficiency of a sample of Chilean municipalities in the management of MSW? and (iii) which are the factors who can influence the eco-efficiency of Chilean municipalities in the management of MSW?
The stochastic non-parametric envelopment of data (StoNED) method firstly proposed by Kuosmanen (2008, 2012) and subsequently developed by Johnson and Kuosmanen (2011, 2012) and Kuosmanen and Kortelainen (2012) brings together the merits of SFA and DEA. Like SFA, the StoNED approach includes both inefficiency and noise in efficiency assessment. Moreover, it maintains the assumptions of monotonicity, convexity and returns to scale (Molinos-Senante and Maziotis, 2021). Unlike SFA and like DEA, it does not need to specify a functional form for the production technology. The StoNED approach uses convex non-parametric least squares (CNLS) (non-linear programming techniques) and Method of Moments (MoM) techniques to measure eco-efficiency.
Within this context, the main objective of this study is to evaluate the eco-efficiency of the MSW sector using the StoNED method. The use of this approach overcomes the limitations of the widely used SFA and DEA. Consequently, this method provides reliable and robust estimates and eco-efficiency scores that could support business decision making process. To take into account municipalities’ heterogeneity we included in the analysis several operating characteristics (environmental variables) such as population density, tourism index and region. This is a novel approach because it is the first study that employs the newly developed technique to understand the factors that influence the costs of providing waste collection and recycling services, and most importantly, to evaluate the eco-efficiency of these services.
We assessed the eco-efficiency of 140 Chilean municipalities in the provision of MSW services. Chile is a prominent case study because it is a middle-income country which has recently implemented policies to promote circular economy. Moreover, Chile is among a few Organisation for Economic Co-operation and Development (OECD) countries whose per-capita MSW generation has increased in the last 5 years (OECD, 2021). Thus, although this study focuses on Chilean municipalities, it provides tools for other countries whose environmental policies for MSW management are incipient.
The remaining parts of this article are structured as follows: the second section presents the proposed methodology to assess the eco-efficiency of MSW sector, the case study is detailed in the third section, the fourth section presents and discusses the results and the conclusions are presented in the fifth section.
Methodology
In this section, we outline the methodological approach used to assess the eco-efficiency of municipalities in the provision of MSW services which is based on three main steps. The first step involves the definition of the cost frontier function which is as follows:
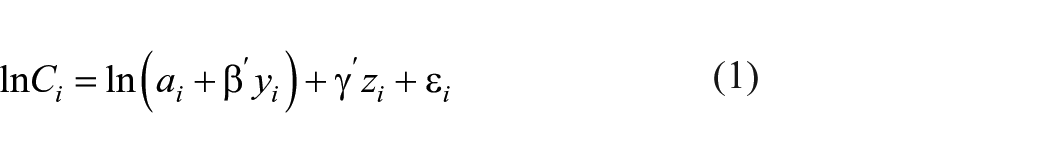
where the subscript
The StoNED technique is applied to estimate the cost frontier model in equation (1). The second step in this study involves using CNLS regression techniques (Kuosmanen, 2008) to provide estimates of the constant term (α), outputs (
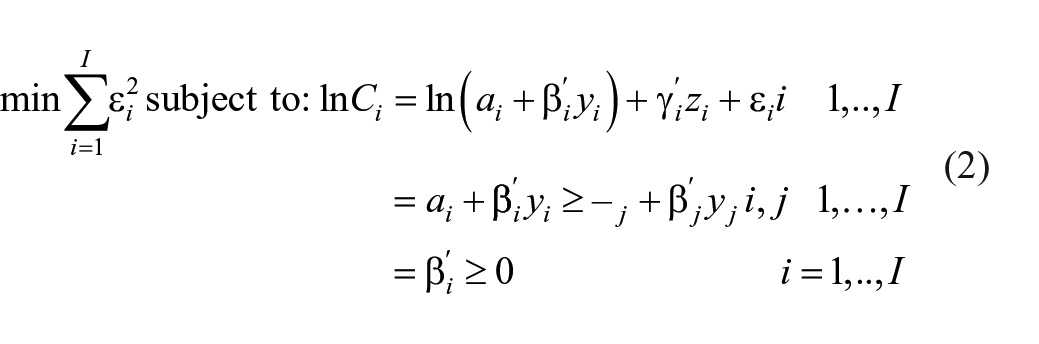
According to equation (2), it is assumed that the municipalities operate under constant returns to scale, that is, under the most productive scale, and therefore ai = 0. In the above linear programming model, the first constraint is the regression equation (equation (1)). The β coefficients can be considered as marginal costs of production (Eskelinen and Kuosmanen, 2013). They are similar to the weights obtained under the DEA framework. The second constraint ensures convexity whereas the third constraint is related to monotonicity (Johnson and Kuosmanen, 2011, 2012). The heterogeneity among municipalities is ensured by the inclusion of the environmental variables denotes as
The third step of the methodological approach applied takes the estimated residuals, noise and inefficiency and derives the eco-efficiency score of each municipality. Using the MoM, it is estimated the expected values of inefficiency and the variances of inefficiency and noise (Kuosmanen, 2012; Kuosmanen et al., 2013; Kuosmanen et al., 2013, 2015). The expected value of the inefficiency of each municipality

where ϕ denotes the standard normal density function,
Eco-efficiency scores of each municipality range between zero and one. A value of one means that the municipality is eco-efficient, whereas values lower than 1 suggests that the municipality has room for improvement.
The fourth step in this research involved the use of cluster techniques to get a better understanding on the performance of municipalities. The classification of municipalities based on their eco-efficiency scores allows identifying groups with best performers and groups with worse performers. This could further allow us to understand the characteristics of these groups in terms of recyclable products or environmental characteristics and potentially introduce more target-oriented policies to improve eco-efficiency. Cluster analysis was widely used to analyse economic and environmental topics (Xie et al., 2019). There were several studies in the past that employed cluster techniques to group units based on their efficiency (Bojnec and Latruffe, 2007; Lo Storto, 2018; Omrani et al. 2018; Wu et al., 2010).
The k-means clustering algorithm was chosen to group municipalities based on their eco-efficiency because it is efficient, widely used and easy to execute approach (Swenson et al., 2016; Cinaroglou, 2020). In the first of the k-means algorithm, which is called the initialization step, the number of clusters
Variables and data
The empirical approach is associated with the MSW collection and recycling services provided by 140 municipalities in Chile for the year 2018. Based on data availability and in accordance with existing studies on eco-efficiency of waste management (e.g. Llanquileo-Melgarejo et al., 2021; Ríos and Picazo-Tadeo, 2021; Romano and Molinos-Senante 2020; Sarra et al., 2017; Simões et al., 2010), the following inputs, outputs and environmental variables were selected. The input was the operational costs of providing MSW collection, recycling and disposal services. Operational costs were measured in Chilean Pesos per year and data was collected from SINIM database. 4 Four outputs were used: (i) paper and cardboard collected and recycled; (ii) glass collected and recycled; (iii) plastic collected and recycled and (iv) organic waste collected and recycled. All outputs were measured in tons per year and the data was collected from the National Waste Declaration System. 5
Several environmental variables were used to evaluate their impact on eco-efficiency. The first variable captured population density and was defined as the number of inhabitants divided by the area covered by each municipality (Agovino et al., 2020; Guerrini et al., 2017; Halkos and Petrou, 2019; Romano et al., 2019). The second variable captured the tourist intensity in the area. According to Llanquileo-Melgarejo and Molinos-Senante (2021), the tourist indicator developed by the Division of Studies and Territory of the Undersecretariat of Tourism was employed. The last variable considered is the region of the municipality which captures several characteristics such as the availability of recycling facilities, climate and regional support to recycling initiatives (Valenzuela-Levi, 2019, 2021; Valenzuela-Levi et al., 2021). The summary statistics of the variables used in this study are reported in Table 1.
Summary statistics of variables.
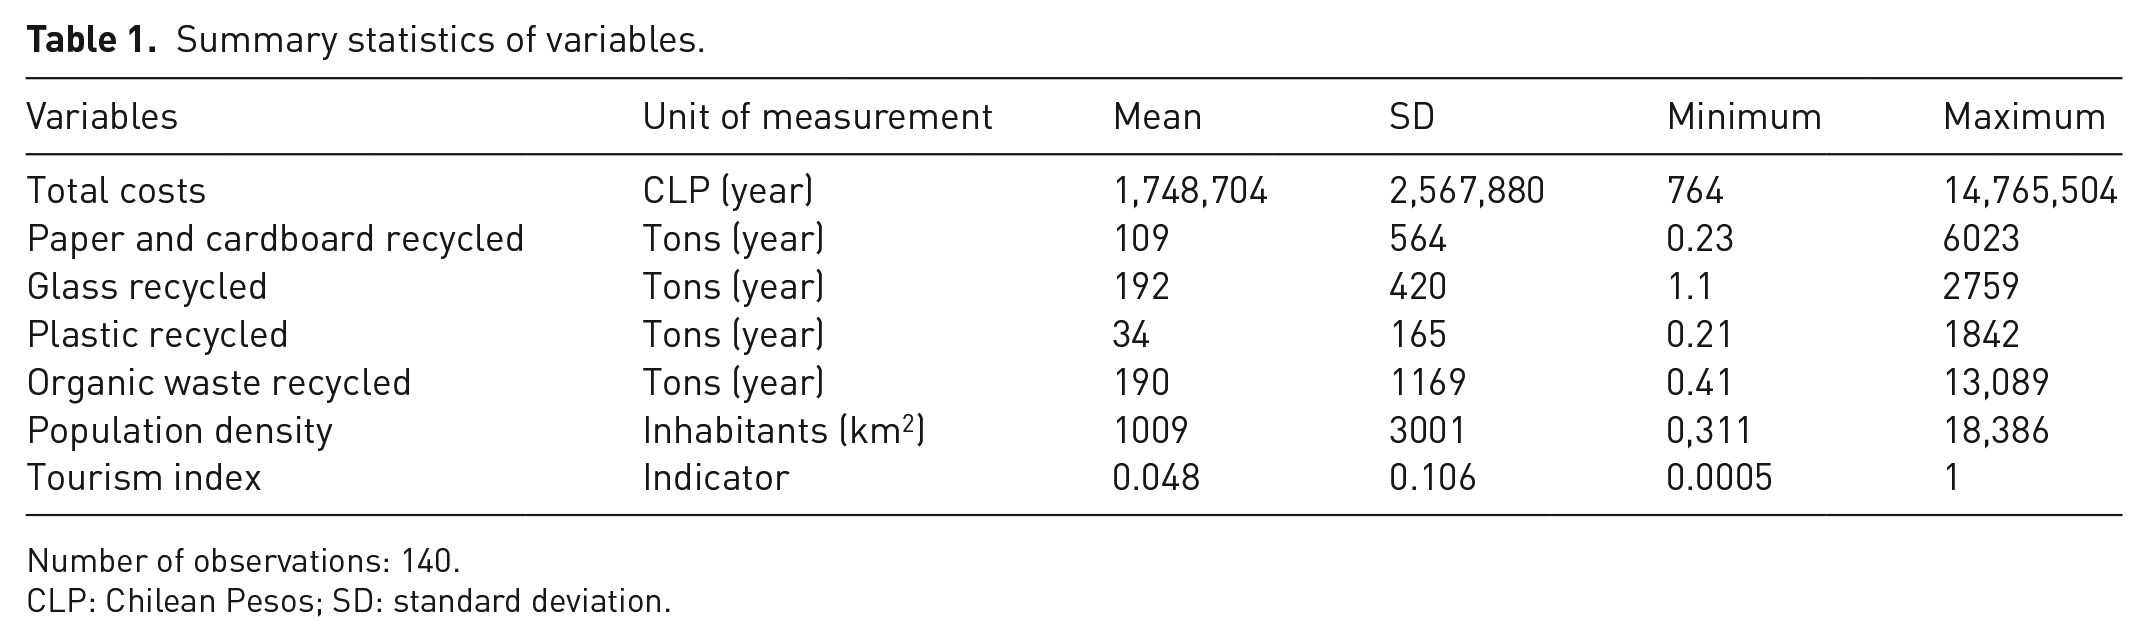
Number of observations: 140.
CLP: Chilean Pesos; SD: standard deviation.
Results and discussion
Cost frontier function
The first step to assess the eco-efficiency of MSW providers using StoNED approach is the estimation of the cost frontier function whose parameters are shown in Table 2. As it was expected, it was found that the collection, recycling and disposing of all wastes had a positive and statistically significant impact on costs. This means that the more recyclable waste is collected and disposed the higher the costs of providing these services would be. Based on the magnitude of the estimated coefficients, plastic and organic waste had the major impact on operational costs of municipalities in the provision of MSW services. Keeping other variables constant, a 1% increase in the collection of plastic and organic waste could increase operational costs by 0.443 and 0.345% on average, respectively. Paper and glass waste had also an influence on costs but at a smaller scale. It is found that a 1% increase in the collection, recycling and disposal of paper and glass waste could lead to an increase in operational costs by 0.082 and 0.144% on average, respectively.
Parameters of the cost frontier function.
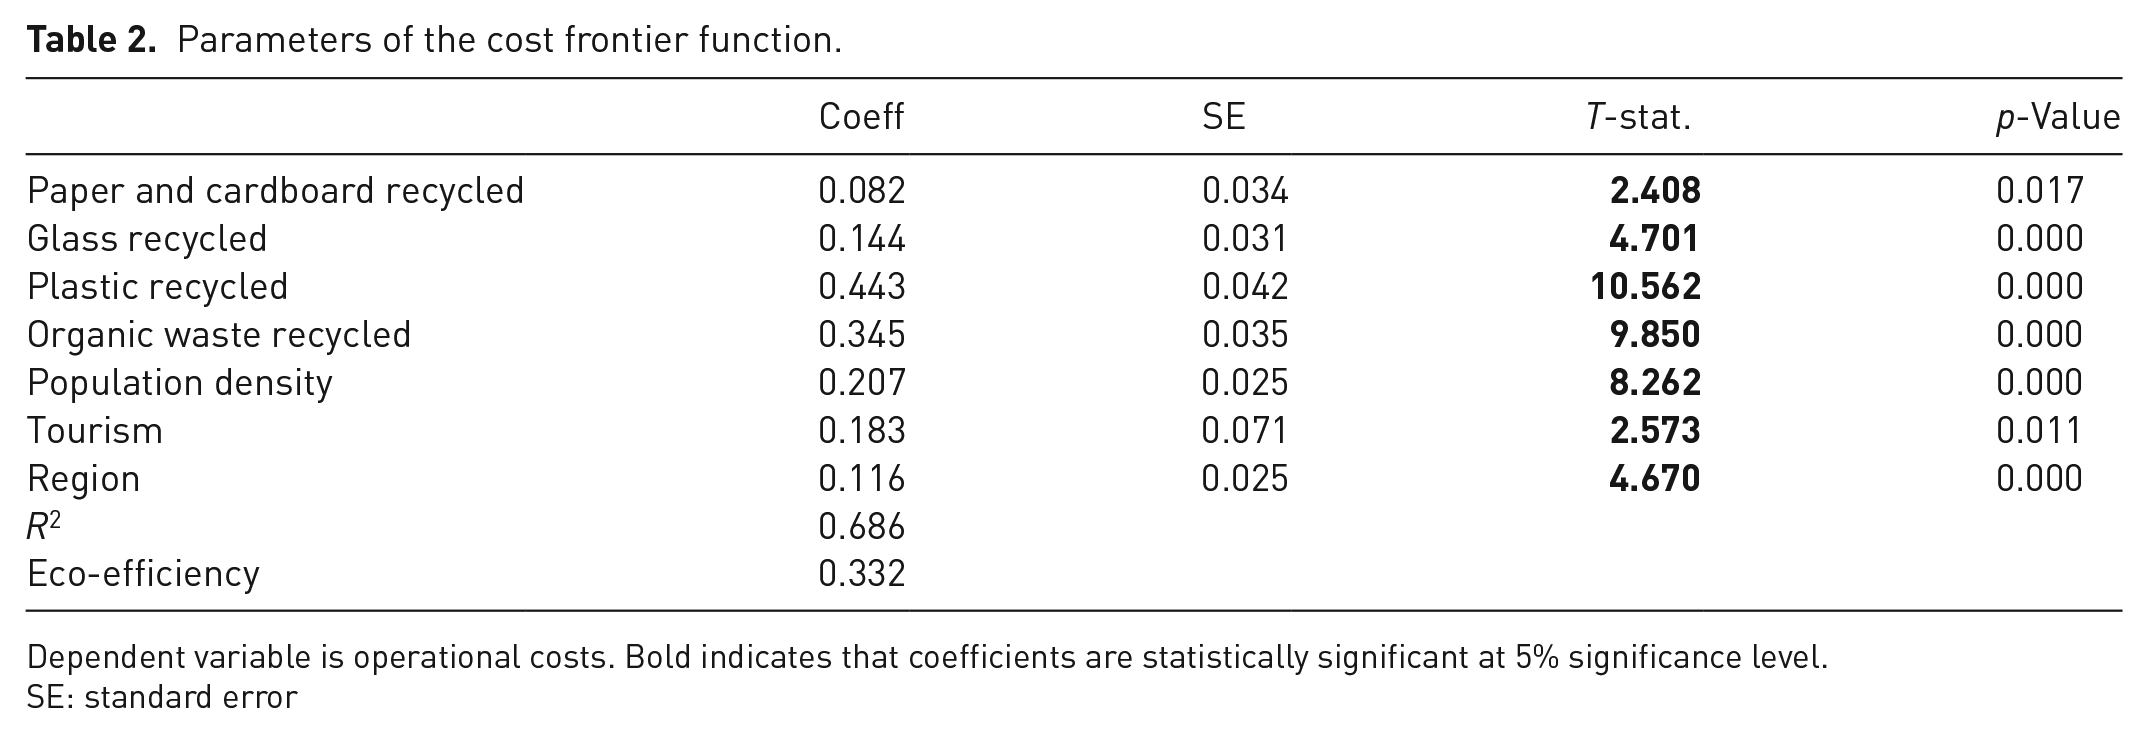
Dependent variable is operational costs. Bold indicates that coefficients are statistically significant at 5% significance level.
SE: standard error
The sum of elasticities of wastes recycled (paper and cardboard, glass, plastic, organic waste) is close to 1 which indicates that on average the municipalities operated under constant returns to scale. This result means that, on average, the operational size of the municipalities evaluated is optimal. This result differs from the conclusions by Llanquileo-Melgarejo and Molinos-Senante (2021) who reported that 40.4% of the Chilean municipalities evaluated should increase their operational size to improve eco-efficiency in the provision of MSW services. This previous study estimated eco-efficiency scores using DEA method whose limitations have already discusses. Hence, the divergent conclusions between both studies reveal the importance of using robust methods for benchmarking the performance of municipalities to avoid biased conclusions and policy recommendations.
As for the environmental variables, they all statistically contribute to waste management costs (see Table 2). Population density and tourism had the major impact on costs followed by region. A positive coefficient on tourism suggests that the more touristic the area is the higher the costs of providing collection and recycling services could be. This result corroborates the conclusions by García-Sánchez (2008), Guerrini et al. (2017), Díaz-Villavicencio et al. (2017), Romano and Molinos-Senante (2020) and Delgado-Antequera et al. (2021) who demonstrated that increased tourism negatively impacts the eco-efficiency of MSW providers. Most of these studies suggest the introduction of eco-taxes for tourism to partially fund MSW services and increasing recycling rates. In this context, eco-taxes are not yet applied in Chile and they might be a useful economic instrument to raise fund to implement the recently adopted waste policies in Chile. Additionally, Table 2 shows that a 1% increase in population density could result in an increase in operational costs by 0.207% on average. This means that densely populated areas might be associated with higher waste collection and recycling costs. Although this result seems counterintuitive, past research (e.g. Benito et al., 2011; De Jaeger et al., 2011; Delgado-Antequera et al., 2021; Vishwakarma et al., 2012) also found that larger population density could cause higher costs because larger equipment could not be used in narrow streets. The region variable had a positive sign which means that moving to regions that were located to the central part of Chile might be confronted with higher operational costs than other parts of the country.
Eco-efficiency scores and its drivers
As far as the eco-efficiency of the MSW sector is concerned, it is found to be 0.332 which means that on average Chilean municipalities needed to further reduce their operational costs by 66.8% to recycle the same amount of products. This finding suggests that on average the solid waste sector was substantially inefficient which is consistent with previous studies by Llanquileo-Melgarejo et al. (2021), Llanquileo-Melgarejo and Molinos-Senante (2021) who reported low efficiency scores for the Chilean waste sector using non-parametric techniques. In particular, 73% of municipalities reported an average efficiency score of less than 0.2, whereas an average efficiency of 0.5 was found for most of them. The findings of the above studies were corroborated by Molinos-Senante and Maziotis (2021) who used econometric techniques to estimate the eco-efficiency of the Chilean waste sector.
On average municipalities need to further improve their managerial practices to become more eco-efficient. This could be, for instance, through the establishment of public containers where MSW can be easily collected. Another solution could be the creation of more recycling drop-off points where citizens can drop different types of waste such as paper and plastic in different containers for recycling. Moreover, the education of citizens through information campaigns regarding the benefits of recycling should be a priority for the municipalities. Policy makers also have a crucial role to play. Regulation needs to provide incentives to companies and households to reduce the production of waste and enhance recycling. For instance, the imposition of a landfill tax could have considerable environmental benefits, but its acceptability and implementation could require the collaboration of several stakeholders. Moreover, the identification of products such as electronic devices, batteries, newspapers who can be classified as priorities for recycling due to their high consumption rates should be promoted. Furthermore, the government could implement curbside collection of recyclables where households could drop waste in different recycling containers to enhance separate collection and recycling rates. This could be associated with more frequent schedules to collect waste.
Figure 1 shows the distribution of eco-efficiency scores across municipalities. It is shown that the majority of municipalities poorly performed because they reported an average eco-efficiency score which was less than 0.60. There were not any municipalities that were fully efficient (an eco-efficiency score of 1) or reported an eco-efficiency score which was greater than 0.81. Additionally, there were 11 municipalities that showed a moderate performance as their mean eco-efficiency score ranged between 0.61 and 0.80. It should be noted that these 11 municipalities only represent 7.8% of the total Chilean municipalities evaluated.
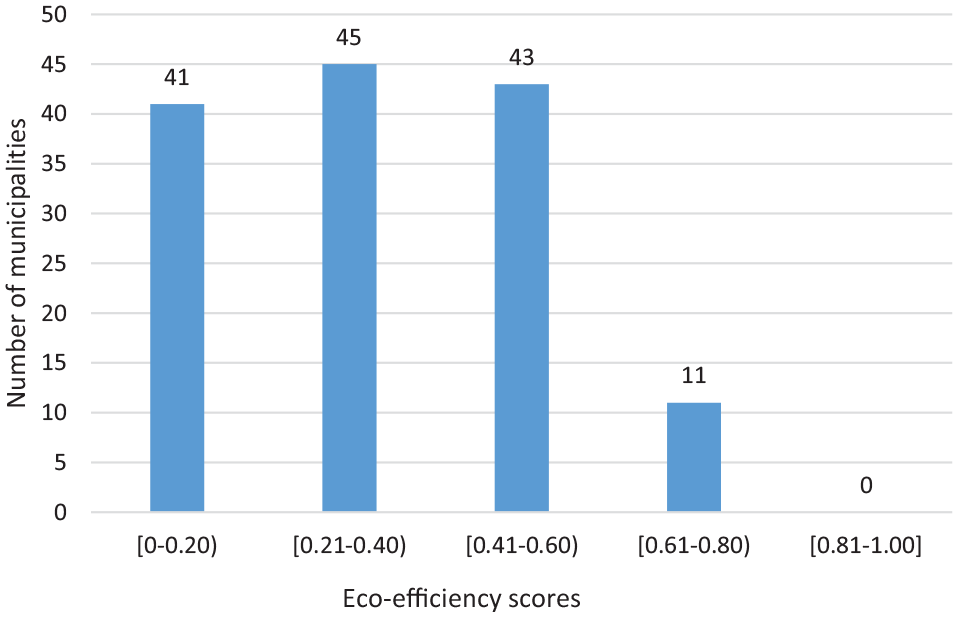
Histogram of eco-efficiency scores of the evaluated Chilean municipalities in the provision of municipal solid waste services.
In contrast, the low levels of eco-efficiency across Chilean municipalities followed a symmetric distribution. It is shown that 43 out of 140 municipalities (30.7%) reported an average eco-efficiency score which ranged between 0.41 and 0.60. The potential savings in costs among these municipalities could vary between 40 and 60% on average to collect, recycle and dispose the same level of recyclable products. Higher costs savings could be achieved by the rest of the municipalities. In total 86 municipalities (61.4%) reported an average eco-efficiency score which was less than 0.40 which indicates that cost savings could reach the level of 60% on average to produce the same level of output. Overall, the results indicate that considerable inefficiency in the municipal waste sector existed. On average municipalities could reduce their daily business costs by more than 40% to catch-up with the best performers in the industry. However, there is still room for improvement among the most efficient ones with cost savings reaching the level of 20% on average.
To improve eco-efficiency in the management of MSW, the Chilean municipalities should develop waste collection strategies adapted to the specific conditions and environment of the collection zone (e.g. population density, types of buildings), public acceptability and preferences of local people by the different collection methods. According to the European Commission (2022) door-to-door and curbside collection rounds from households are identified as best practices to collect MSW promoting its recycling. Other alternative methods for collecting recyclable materials could be implemented such as drop-off centres, buy-back centres or deposit/refund programme. Each of these alternatives presents pros and cons and therefore, its adoption would depend on the preferences and socio-economic conditions of the local communities.
Because programmes for recycling MSW are not common in Chile, we suggest the development of pilot cases by municipalities or regional authorities to investigate the environmental, social, economic and technical feasibility of different MSW collection methods in their local territories. Moreover, surveys to the local communities could also be carried out to better understand their preferences and therefore, selecting MSW collection systems fitting them.
Table 3 shows the results from the cluster analysis based on the eco-efficiency scores of the Chilean municipalities. The optimal number of clusters was 2 based on the silhouette score (See Figures 1 and 2 in Online Appendix). The first group includes 69 municipalities whereas the second group consists of 71 municipalities. The average eco-efficiency was 0.305 for group 1 and 0.359 for group 2. This means that on average municipalities in groups 1 and 2 needed to further reduce costs by 69.5 and 64.1%, respectively, to recycle the same level of MSW. The relatively most efficient group consists of municipalities that were characterized by high levels of operational costs. It appears that these municipalities operated in densely populated areas that might attract high levels of tourism. These areas might have more frequent waste collection services to deal with waste that is generated by local residents and tourists. In contrast, the first group consists of municipalities that had lower operational costs. Although being densely populated and less touristic than those in group 1, on average municipalities needed to make some improvements in their managerial practices to improve performance.
Cluster analysis of Chilean municipalities based on eco-efficiency scores in the provision of solid waste services.
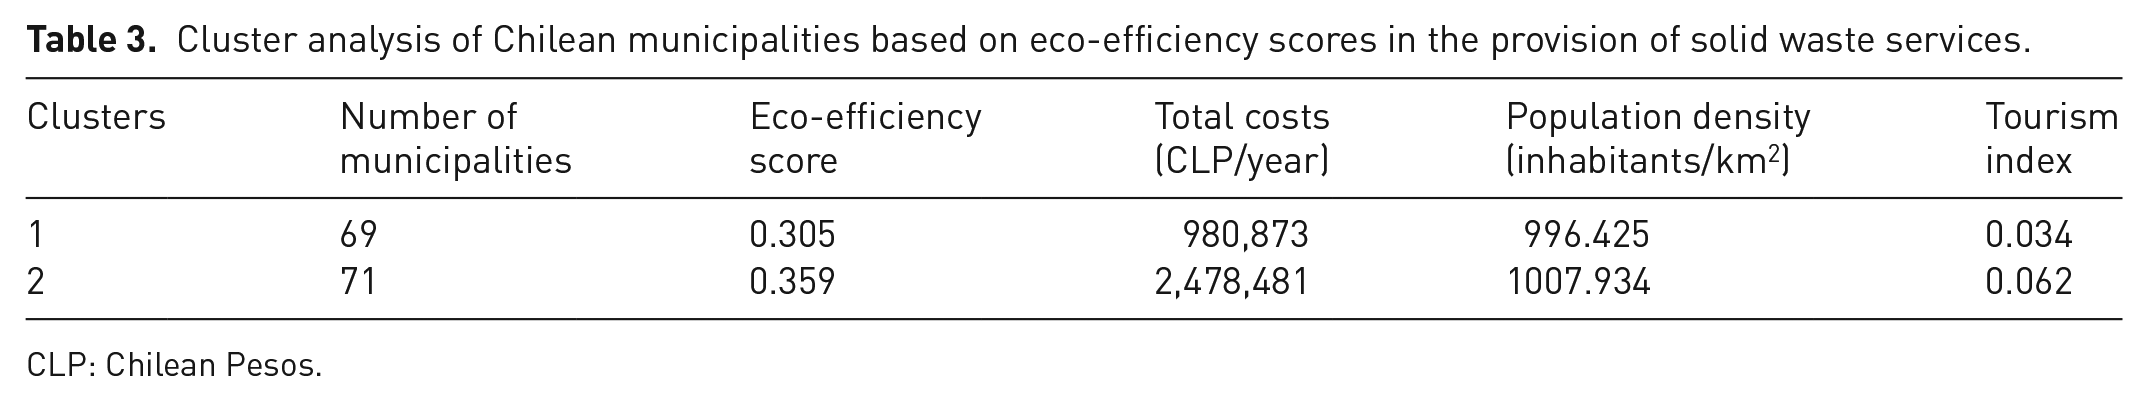
CLP: Chilean Pesos.
Overall, the results indicate that Chilean municipalities that were slightly more densely populated and attract more tourists might have to deal with high operational costs to provide waste and recycling services. However, these municipalities are the ones who showed higher levels of eco-efficiency than others who experienced lower levels of costs. This might be explained by the fact that these municipalities needed to take into consideration that the waste generated by households and businesses in densely populated areas should be frequently collected and disposed. At the same, they needed to have in place practices and strategies to ensure that waste generated by tourists was adequately collected and safely disposed. Thus, they might have already adopted some practices such as recycling drop-off points to provide waste and recycling services in an efficient way. In contrast, municipalities that were slightly lower less densely populated and touristic encountered lower operational costs. However, the levels of efficiency were slightly lower. This finding suggests that these municipalities should improve their day-to-day operations to become more efficient. This is apparent for the municipalities that operated in group 2, the relatively more efficient one.
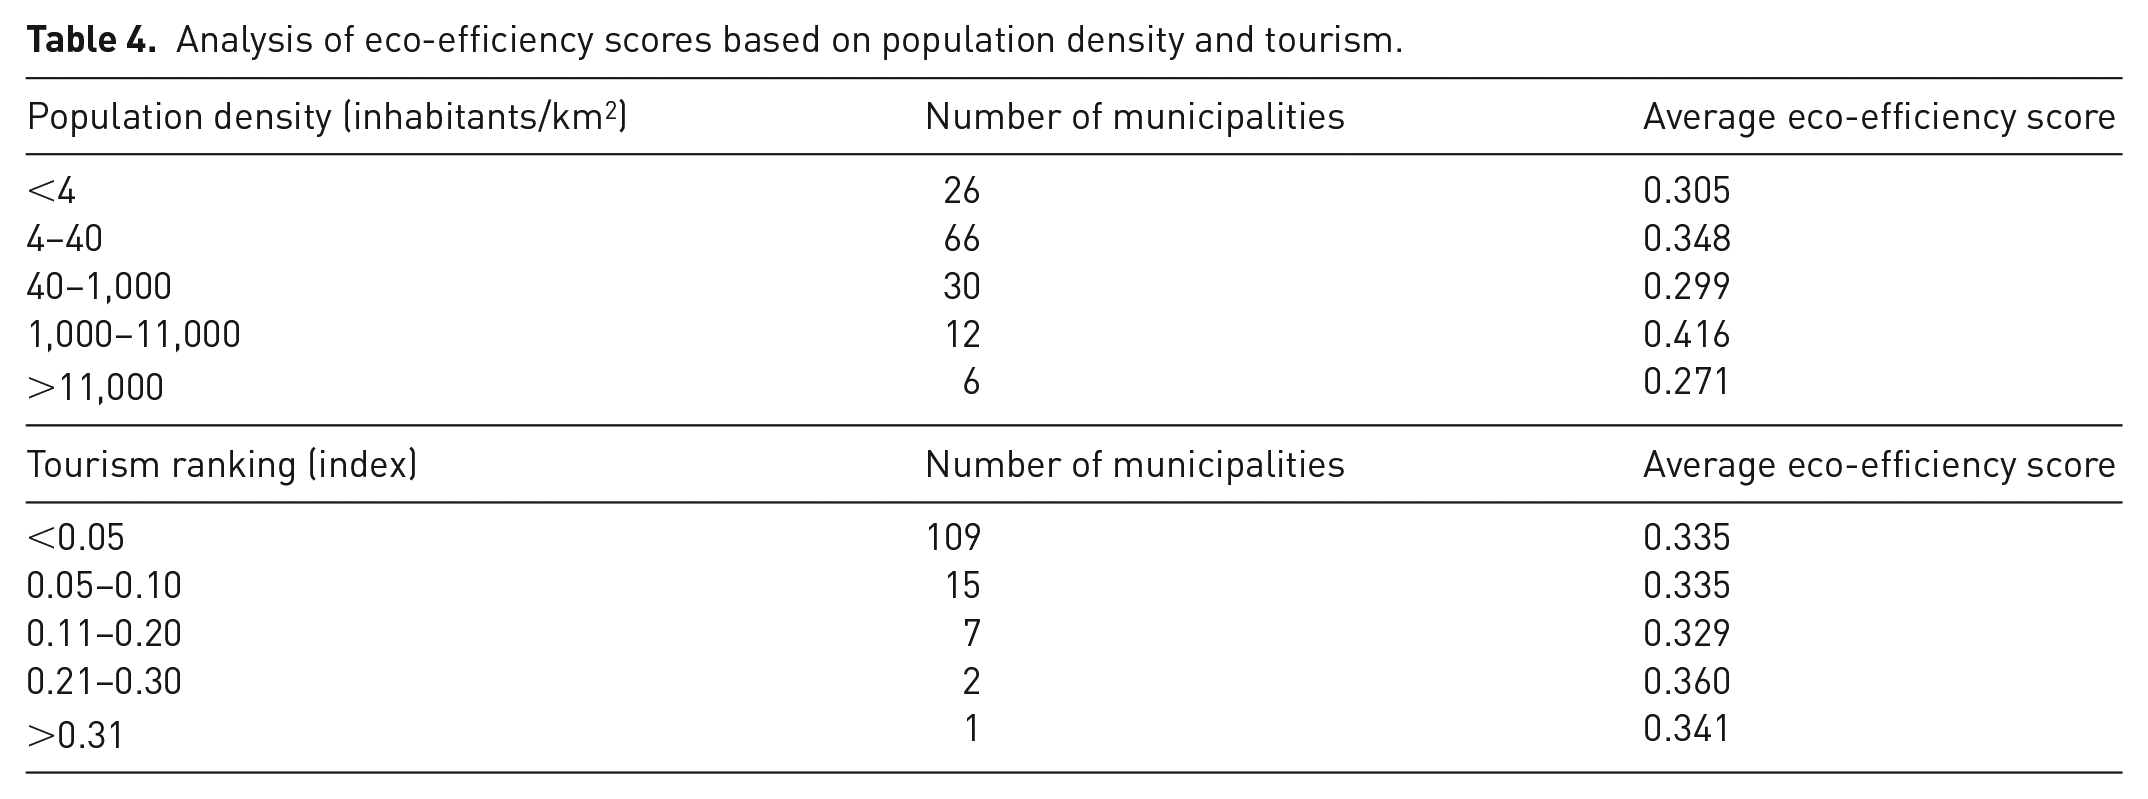
Results demonstrated that population density and tourism are significant drivers of eco-efficiency so it is interesting to assess how eco-efficiency of municipalities varied across different ranges of density and tourism. The results of this analysis are reported in Table 4. It is found that eco-efficiency remained at low levels for less densely populated areas. Then it reached the level of 0.348 for areas with a population density between 4 and 40 inhabitants/km2. In these areas, on average municipalities still needed to further reduce operational costs by more than 65% to produce the same level of outputs. As population density increases, then eco-efficiency decreases. This was apparent for areas whose density was between 40 and 1000 inhabitants/km2 and for highly densely populated areas with more than 11,000 inhabitants/km2. On average areas with a density of more 40 inhabitants/km2 reported an average eco-efficiency score of 0.329 implying that the potential costs savings in those areas could exceed the level of 67% on average. Thus, it is evidenced that for Chilean municipalities, the optimum population density might be between 1,000 and 11,000 inhabitants/km2. Lower and larger population density outside this range, impacted negatively on the eco-efficiency of municipalities in the provision of MSW services.
Analysis of eco-efficiency scores based on population density and tourism.
Past research has evaluated the influence of population density on the performance of MSW suppliers leading to inconclusive results. On one hand, some studies found that higher population density causes lower costs and therefore, higher efficiency (Expósito and Velasco, 2018; Guerrini et al., 2017; Llanquileo-Melgarejo and Molinos-Senante, 2021). On the other hand, other studies showed that higher density reduced efficiency of waste service providers (De Jaeger et al., 2011; Vishwakarma et al., 2012).
As far as tourism is concerned, it is found that the majority of the municipalities with slightly low levels of tourism experienced low levels of efficiency. As areas attract slightly more tourists, inefficiency remains at the same level or drops. For instance, areas with a tourism index between 0.11 and 0.20 reported an average efficiency of 0.329. This means that on average municipalities could further reduce operational costs by more than 67% to provide the same level of waste and recycling services. Few areas with higher levels of tourism experienced slightly levels of efficiency, however, this did not exceed the level of 0.341. It should be noted that although differences are statistically significant, as it is shown in Table 4, average eco-efficiency scores for the five groups of municipalities according to its tourism index only range between 0.329 and 0.360.
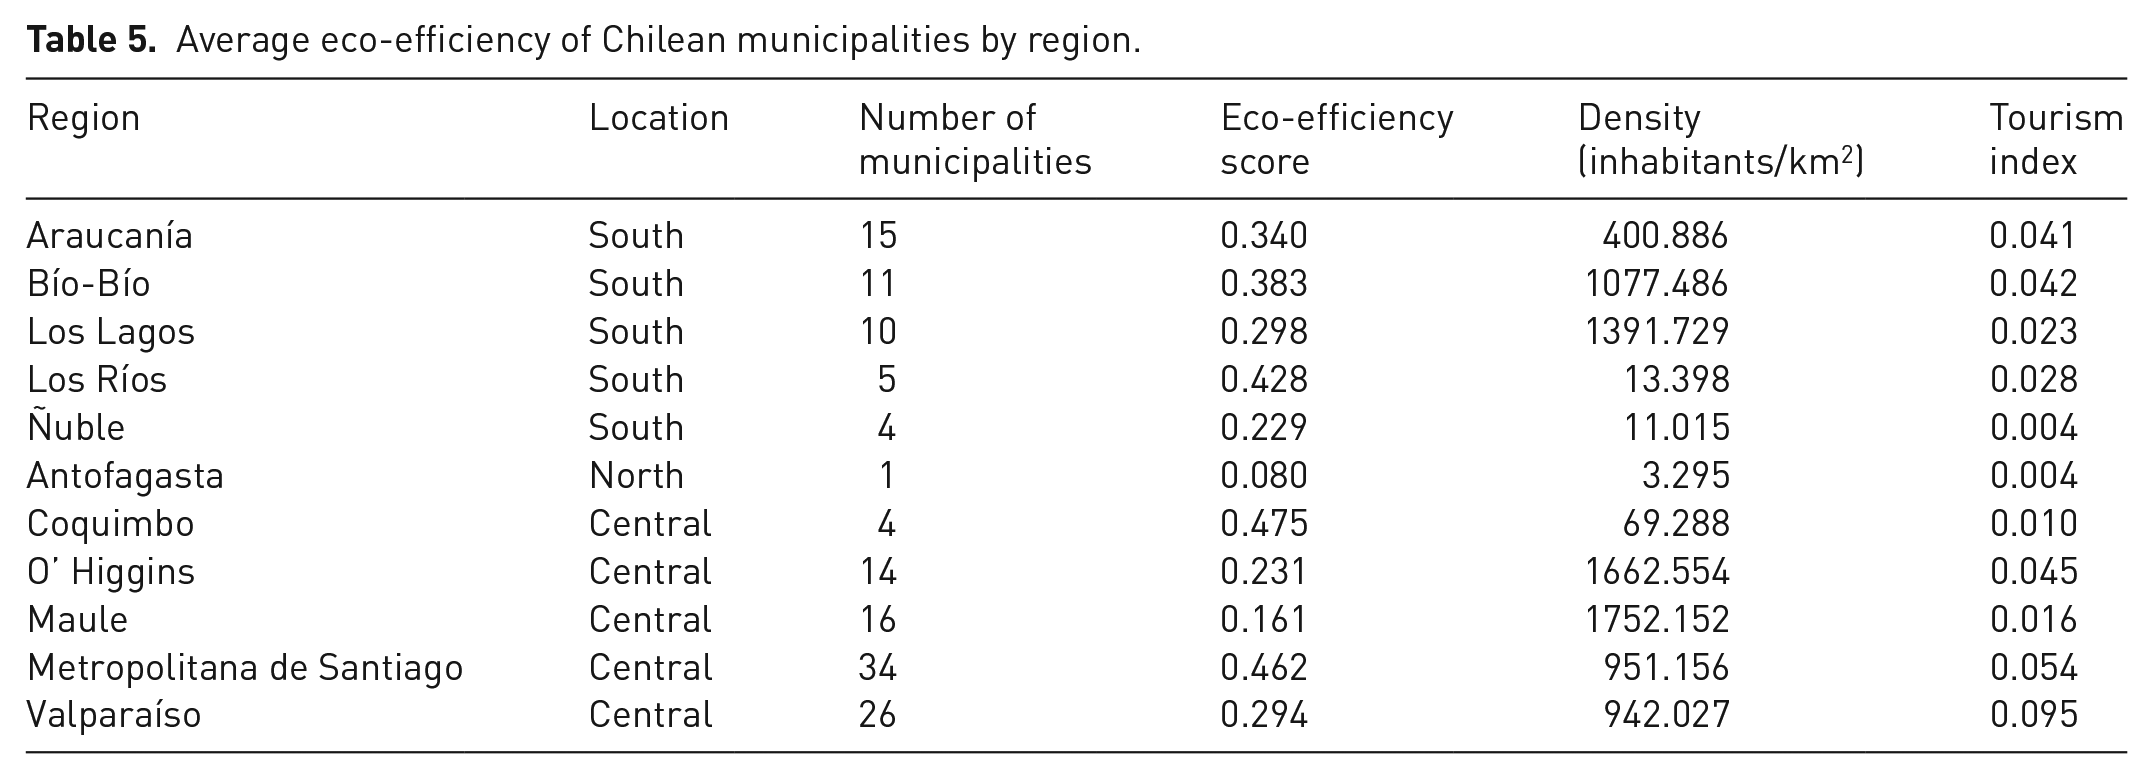
Another factor that might influence the eco-efficiency of municipalities is its region. As it is shown in Table 5, it was found that the most inefficient region in the provision of MSW services is Antofagasta located on the north part of Chile. This region is characterized by low levels of density and touristic activities. It might be challenging for a densely sparse area to collect and recycle waste. Higher levels of eco-efficiency were shown in the central part of Chile. This area includes the highest number of municipalities including the capital of Chile, Santiago. On average the central part of Chile reported an average eco-efficiency of 0.325 with areas having a density of 1075 inhabitants/km2 and considerable touristic activities. The Metropolitan Region of Santiago, a densely populated area and attracted to tourists was one of the relatively more eco-efficient regions in the sector. The high levels of eco-efficiency could be explained by the fact that several municipalities in that region have already in place some programmes to enhance recycling such as recycling drop-off points or curbside recycling. More densely populated areas had difficulties in eliminating inefficiencies. For instance, the regions of O’ Higgins and Maule reported an average eco-efficiency of 0.231 and 0.161, respectively. The south part of Chile showed slightly higher levels of eco-efficiency compared to the central and north ones. The average eco-efficiency was 0.336 serving less densely populated areas, 579 inhabitants/km2, and less touristic areas. Overall, the results indicate that municipalities located in the central and south parts of Chile were more eco-efficient than the ones located in the north part. However, there is still room for improvements in their managerial practices. The potential savings in costs for municipalities in the central part of Chile which ranged between 52.5 and 83.9% on average. In the southern Chile, where it is less densely populated and less touristic than the central part one, these varied between 57.2 and 77.1% on average.
Average eco-efficiency of Chilean municipalities by region.
Conclusions
In the transition towards a circular economy, improving the eco-efficiency in the provision of MSW services is of vital importance. To support decision-making, robust eco-efficiency estimations, overcoming limitations from conventional methods, are needed. For the first time in the literature, this study uses the StoNED method to evaluate the eco-efficiency of municipalities in the MSW sector in Chile.
The main findings of the case study can be summarized as follows. It was found that the recyclable of waste had a significant influence on the cost of providing waste collection and recycling services. Other factors that influenced eco-efficiency were related to population density, tourism and location of municipalities. The more touristic the region was the lower the eco-efficiency in the provision of MSW services could be. This suggests the need for an eco-tax to promote recycling activities. It was also shown that municipalities located to the central part of Chile might encounter higher operational costs than other regions. The average eco-efficiency of the 140 municipalities evaluated was 0.332 which indicates that municipalities could further reduce operational costs by 67% to recycle the same level of MSW.
The findings our study could have relevant policy implications. We offer a method that evaluates the eco-efficiency of solid waste sector using a newly developed technique that overcomes any shortcomings of other benchmarking methods that assess performance based on econometrics or linear programming techniques only. This leads to robust estimates of costs drivers and efficiency scores. Moreover, policy makers have the opportunity to determine the level of inefficiency, what drives performance and the best and worst performers in the sector. The findings of our empirical approach could allow policy makers understanding what drives performance in the solid waste sector and adopt strategies to deliver waste collection, recycling and disposal services in an efficient and sustainable manner.
Supplemental Material
sj-docx-1-wmr-10.1177_0734242X221142223 – Supplemental material for The eco-efficiency of municipalities in the recycling of solid waste: A stochastic semi-parametric envelopment of data approach
Supplemental material, sj-docx-1-wmr-10.1177_0734242X221142223 for The eco-efficiency of municipalities in the recycling of solid waste: A stochastic semi-parametric envelopment of data approach by Maria Molinos-Senante, Alexandros Maziotis, Ramón Sala-Garrido and Manuel Mocholi-Arce in Waste Management & Research
Footnotes
Declaration of conflicting interests
The authors declared no potential conflicts of interest with respect to the research, authorship, and/or publication of this article.
Funding
The author(s) disclosed receipt of the following financial support for the research, authorship, and/or publication of this article: The authors would like to thank to Agencia Nacional de Investigacion y Desarrollo (Chile) FONDECYT 1210077 for their financial support.
Supplemental material
Supplemental material for this article is available online.
Notes
References
Supplementary Material
Please find the following supplemental material available below.
For Open Access articles published under a Creative Commons License, all supplemental material carries the same license as the article it is associated with.
For non-Open Access articles published, all supplemental material carries a non-exclusive license, and permission requests for re-use of supplemental material or any part of supplemental material shall be sent directly to the copyright owner as specified in the copyright notice associated with the article.